Article

Assessment of Depressional Wetland Degradation, Spatial Distribution, and Geological Aspects in Southern Brazil

1
Department of Geotechnics, University of São Paulo, São Paulo 13564-002, Brazil
2
Department of Civil Engineering, University of São Carlos, São Paulo 13565-905, Brazil
*
Author to whom correspondence should be addressed.
Geosciences 2020, 10(8), 296; https://doi.org/10.3390/geosciences10080296
Submission received: 9 May 2020 / Revised: 21 July 2020 / Accepted: 29 July 2020 / Published: 3 August 2020
(This article belongs to the Section Hydrogeology)

Abstract

:
This paper presents a procedure to study depressional wetlands in southern Brazil and focuses on the mechanisms controlling water dynamics and environmental degradation due to anthropogenic interference. The study is based on an inventory of wetlands, a digital elevation model, the geological and geotechnical characteristics of geological materials, a multitemporal analysis of satellite images, the distribution of land use types, and onsite monitoring of water level and rainfall data. One hundred and twelve depressional wetlands were identified with a total area of 902 ha and a catchment area of 5456.8 ha. These wetlands were grouped into two classes with different hydrological control mechanisms. From the water level monitoring, the wetlands were found to present different hydrological conditions. Before rainy periods, the wetlands were almost dry or had little water; after rainy periods, over half of the wetlands were still dry or had groundwater levels below the surface, and the water levels of the other wetlands increased. The multitemporal analysis showed a reduction in the wetland water surface area from 270 ha in 1991 to 60 ha in 2019, which confirms the monitoring result that the amount of stored water is decreasing because of anthropogenic activities. Anthropogenic activities affect wetland water dynamics because of changes in the landscape and soil characteristics of the catchment area, and drainage of wetland areas by ditches for agricultural water supply; more than 50% of wetlands showed a high degree of change (environmental degradation), with conditions that make restoration or remediation very difficult.

1. Introduction

Depressional wetlands are characterized as inland aquatic ecosystems that occur in topographic lows with closed or nearly closed elevation contours, which allow surface and groundwater accumulation and typically present weak surface water connections [1] as their surface water levels fluctuate in response to wet and dry periods [2]. These wetlands are environments with great environmental importance [3,4,5] because they provide habitats for native vegetation and wildlife, reduce erosion during peak events, maintain stream flow during drier periods, recharge aquifers, store precipitation and runoff water, provide atmospheric moisture by evapotranspiration, assimilate and retain pollutants and sediments derived from upland sources, improve water quality, and provide water availability for different purposes such as agriculture and livestock [6].
However, these areas are highly vulnerable to anthropogenic changes (e.g., extensive wetland drainage for agricultural and livestock, land use transitions to agriculture or grazed grassland, infrastructure developments, urban sprawl, extraction of water, and overexploitation of groundwater resources), and several wetland areas in the world are facing intense degradation processes at different levels [6,7,8,9,10,11]. Wetland hydrological, hydrogeological, biogeochemical, habitat, and ecological functions are impacted, which has resulted in decreases in ponded water, changes in groundwater flow, losses of plant and animal species, and changes in nutrient dynamics [12,13,14,15,16]. Moreover, several depressional wetlands are already lost, for example, in the Prairie Pothole Region (PPR) located in the United States and Canada, Johnston [17] verified that ~5000 to 6000 ha yr−1 of depressional wetlands have been lost since the 1980s. In addition to the losses of and negative impacts on depressional wetland functions, their restoration is difficult. Moreno-Mateos et al. [9] analyzed data from 36 studies of 358 North American wetlands and observed that they did not recover to reference conditions, even after 50 years following restoration.
Thus, carrying out studies that evaluate degradation is essential to assess different levels of impact, identify potential targets for preservation, conservation, and restoration, and develop management strategies to reduce the losses and damage caused by anthropogenic changes in depressional wetlands. In the USA, Europe, and Canada, evaluating the effects of anthropogenic changes is very common, where robust and long-term studies are being developed to better comprehend the magnitude of impacts on wetland components as well as proposals to restore them [9,13,18,19,20,21]. However, in Brazil, there is evidence that depressional wetlands are being altered due to agricultural expansion, urban sprawl, and road construction [22,23,24,25], but the degradation of depressional wetlands is not well documented. The studies are limited and are related to wetland hydro-physicochemical characterization (e.g., [26,27]) and wetland hydrodynamic analysis (e.g., [28]) developed mainly in the Pantanal region (central Brazil), but specific studies to assess degradation have not been identified.
In the northeastern central portion of São Paulo State (southern Brazil), depressional wetlands are very common, and these wetlands are spread over 200,000 km2. However, these wetlands have been experiencing intense anthropogenic activities that are degrading or destroying them due to the expansion of sugarcane plantations; this expansion changes infiltration, groundwater recharge, surface runoff generation (which in 15 years increased from 44.68% to 57.15% of the total agricultural area in São Paulo State [29]), the removal of vegetation, the drainage of wetlands by ditches for more than 60 years, cultivation during dry periods, road construction, and the expansion of urban areas. Currently, little is known about the degradation of depressional wetlands in this region as well as their main characteristics and water dynamics, which are the basis of degradation assessment [30].
As depressional wetlands are important for environmental stability and as sources of freshwater for many purposes, and given the intense changes imposed on environmental components by humans, studying the previously mentioned wetlands and the effects of anthropogenic activities is fundamental. Thus, the objective of this work was a first approach to evaluate the degradation by focusing on hydrological aspects of depressional wetlands situated in the Leme region in the northeastern central portion of São Paulo State (southern Brazil) to guide environmental management and policy decisions. The evaluation of degradation was based on previously collected data, interpretations of satellite imagery and aerial photographs, and simple indicators such as the compositions of soils and other geological materials, morphology, flooded areas, field surveys, and monitoring of rainfall and ponded water. In addition, because there is no work about the basic characteristics and functioning of depressional wetlands in the study area, we studied their essential characteristics, classified them, and determined their potential functions, which helps us to comprehend the magnitude of changes caused by anthropogenic activities.

2. Study Area

The study area is located in the eastern central portion of São Paulo State and covers an area of approximately 715.2 km2 between 47°15′ and 47°30′ W longitude and 22°00′ and 22°15′ S latitude and includes the municipalities of Leme, Pirassununga, Santa da Cruz da Conceição, Corumbataí, and Araras (Figure 1).
Herbaceous plants such as grasses, sedges, rushes, reeds, and some flowering herbs compose the wetland vegetation, and several species die back at the end of the growing season. In the catchment areas of wetlands, the natural vegetation consists of a type of savanna called Cerrado [31] and dense tropical forests. However, the study area has been almost entirely converted to rural land uses, in which sugarcane crops predominate, and the landscape has been heavily terraced due to agricultural management. Moreover, many wetlands have been ditched over 60 years to pump water to irrigate sugarcane crops [32].
The drainage network in the Leme region is 695 km long and has a density of 0.96 km/km2. The main rivers are Ribeirão do Roque, which is located in the north and runs W–E, and Ribeirão do Meio, which is located in the south and runs SW–NE. These rivers are tributaries of the Mogi-Guaçú River. Smooth slopes and plains with slopes of less than 10% predominantly constitute the relief in the region. In a few areas, steeper slopes occur with slopes greater than 10%, but few slopes are greater than 20%. The elevations range between 530 m and 800 m.
The climate is characterized as subtropical humid to very humid, with extreme winter droughts. The rainfall is mainly concentrated from November to March and ranges from 98 to 590 mm/month, whereas the monthly rainfall from April to October is between 0 and 130 mm. The mean annual rainfall is approximately 1300 mm and ranges from 730 to 2200 mm. Figure 2 shows the mean monthly rainfall data and the number of rainy days per month for the last 20 years and the variations in annual rainfall obtained from a 68-year series (1950–2018). The reference mean annual evapotranspiration is higher than 1000 mm [33], and the mean annual temperature ranges from 20 to 21 °C.
Geologically, the study region consists of (1) diabases (Serra Geral Formation) distributed mainly in the form of sills that are fractured and have various thicknesses; (2) friable Eolian sandstones (Botucatu Formation), with low degrees of cementation and high porosities; (3) medium- and fine-grained fluvial sandstones (Pirambóia Formation) with variable thickness; (4) claystones, shales, and siltstones (Corumbataí Formation), which can contain calcareous cements; (5) siltstones and shales (Irati Formation), which present arhythmic alternation with limestones and restricted conglomerate levels; and (6) sandy siltstones (Tatuí Formation) that form thick layers of clayey siltstones and have interbedded layers of sandstones, limestones, shales, and flint.
All lithologies are covered by unconsolidated material packages constituting soil (residual or transported + residual) and saprolitic and weathered rock layers that can vary between 1 m and 10 m; the groundwater level is positioned between the bedrock and residual layers. The texture of the unconsolidated materials varies from sandy to clayey; in general, the materials display low heterogeneity when only the residual soil layer is present. However, high heterogeneity may appear when there is a transported soil layer (i.e., a layer of sandy colluvium that overlies the clayey residual diabase soil). The unconfined aquifer can be characterized as porous, with variable hydraulic conductivity values and thicknesses ranging from 0 m to 10 m. The wetland soils are Melanic Gleysols, characterized by variable textures along the soil profile, poor drainage, and a 30-cm dark A horizon; just below this horizon is a layer with a mottled or motley gray color that can extend to a depth of more than 150 cm.

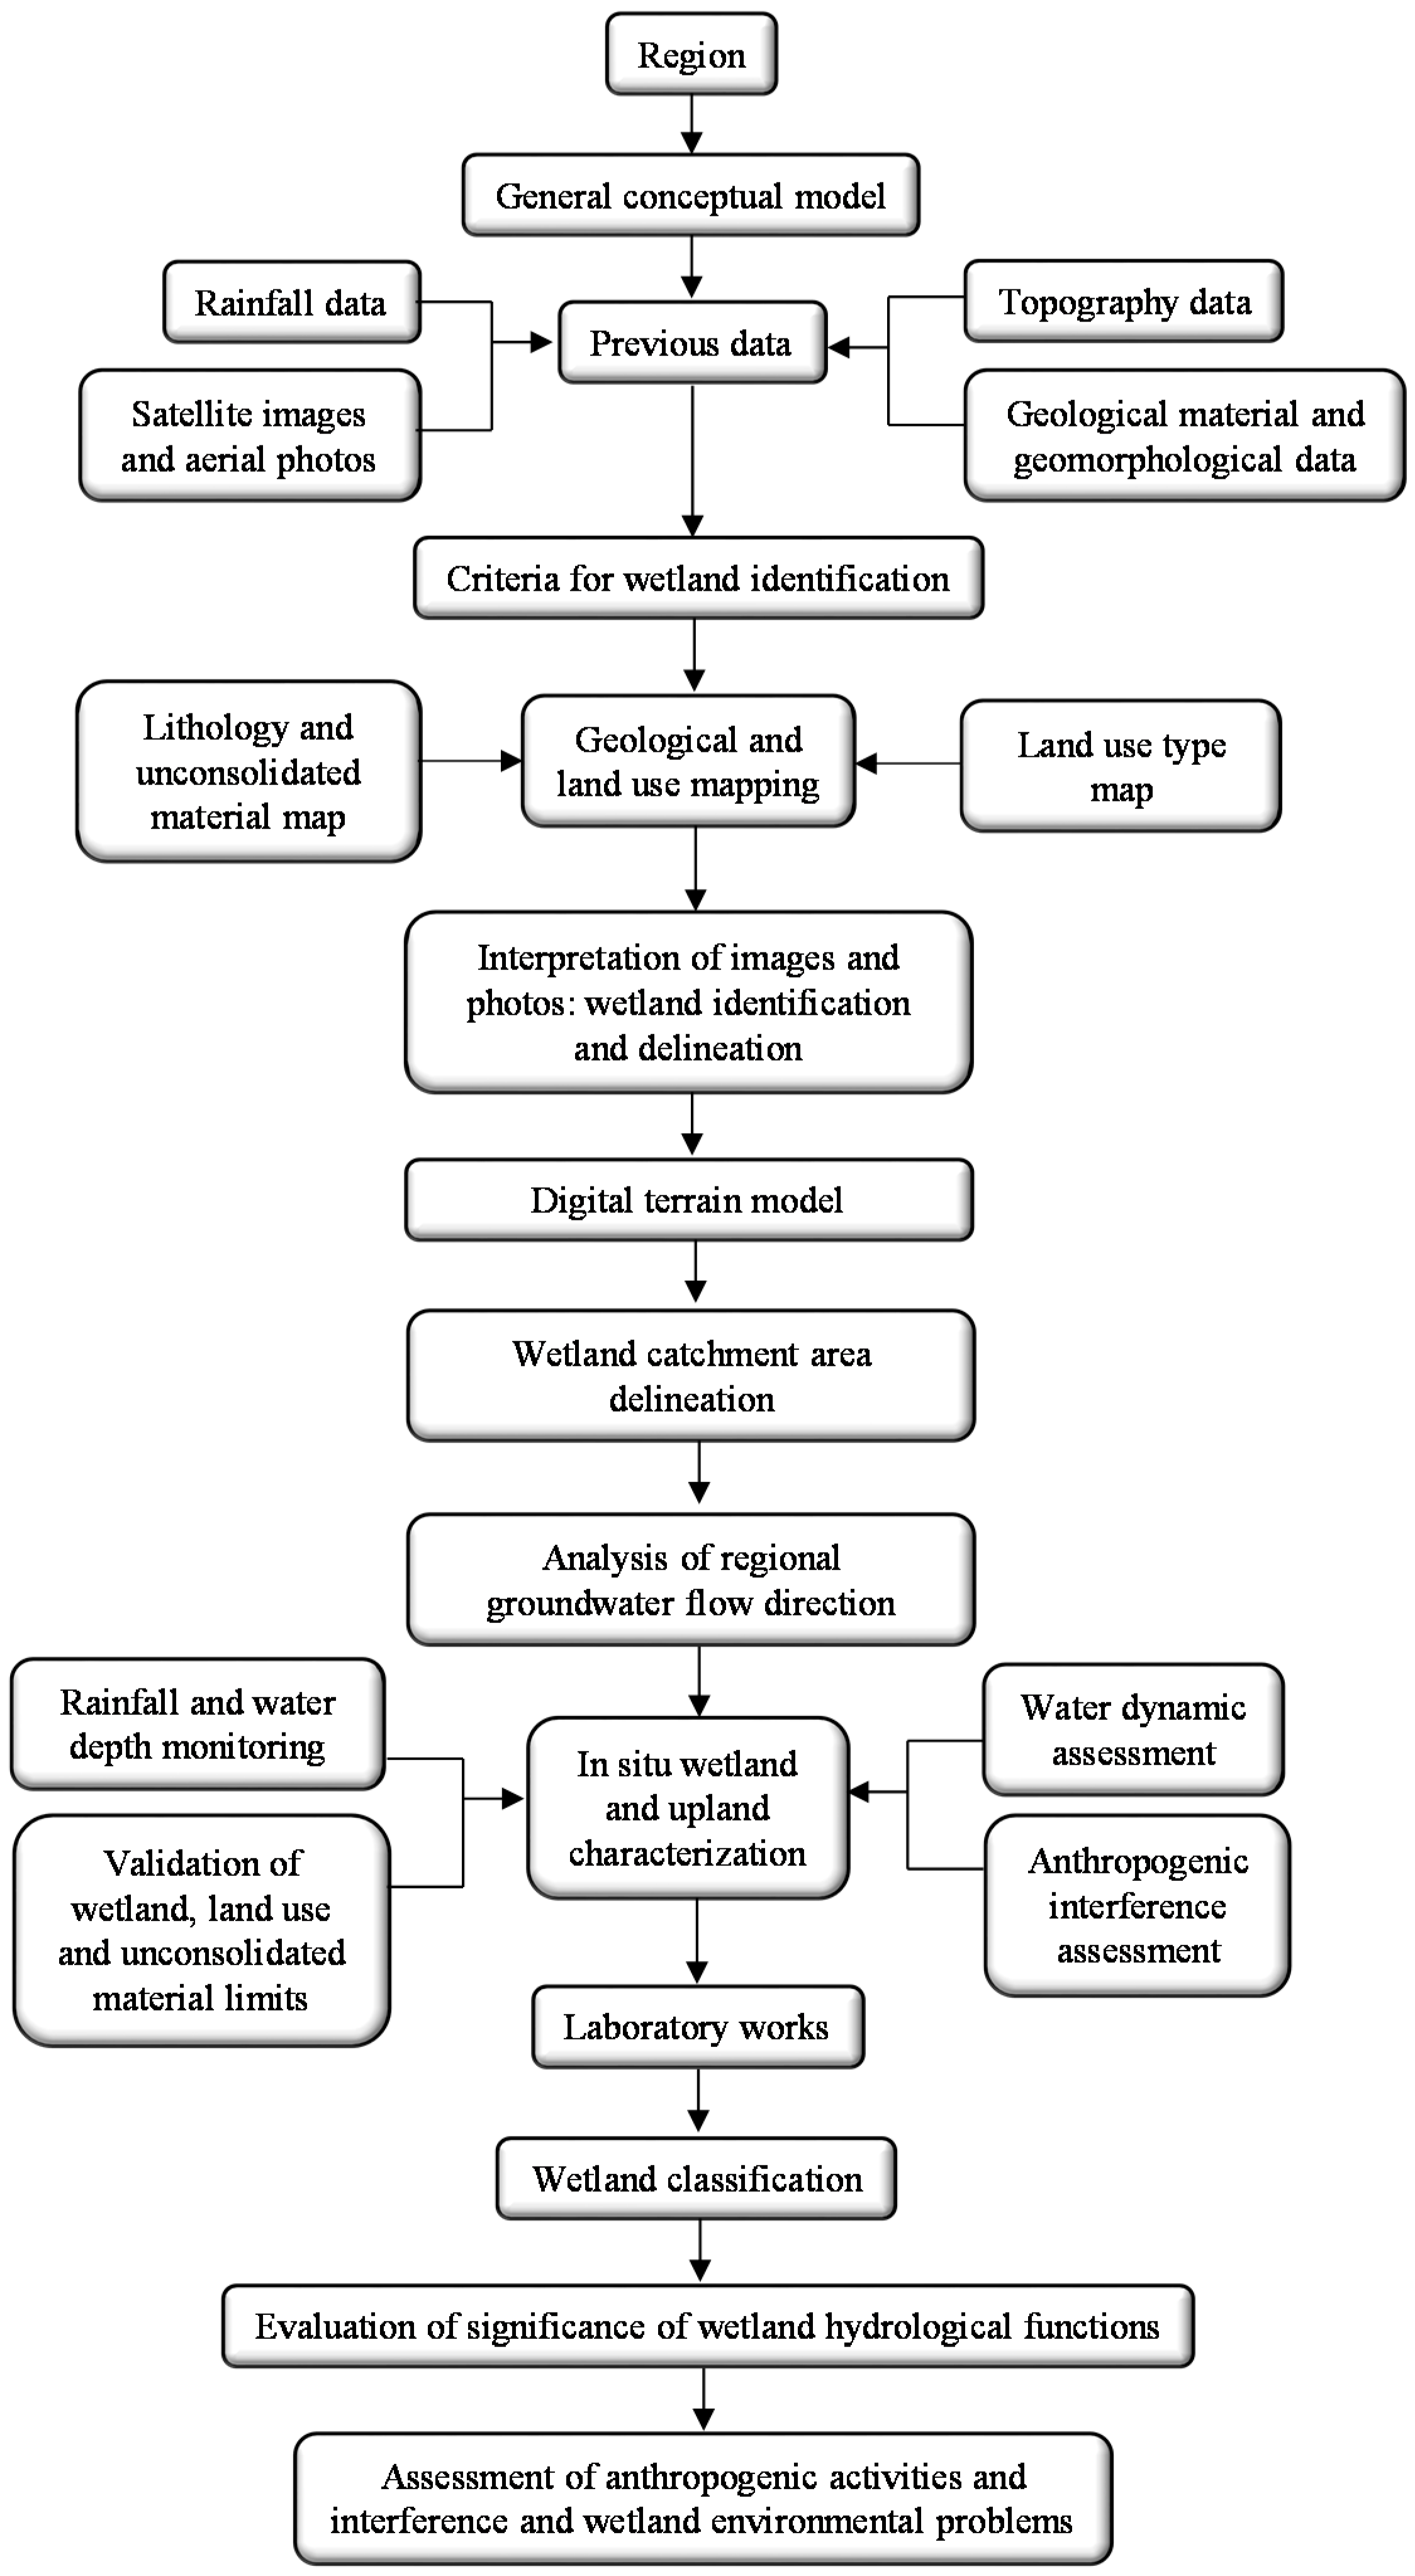
3. Materials and Methods

To evaluate degradation and characterize depressional wetlands in the study area, we applied a landscape-level assessment [30], which considered the use of geographic information systems, remote sensing, and previous data. Based on this assessment level, we determined the distribution of geological materials, delineated wetlands and catchment areas, analyzed the temporal variations and distributions of ponded water and land use types, identified anthropogenic interferences (e.g., road density and presence of drainage ditches), and established the significance of wetland functions, which permitted us to inventory, describe, and provide an overview of wetland conditions. We also considered some field procedures to validate information obtained through the landscape assessment and to improve our comprehension of wetland characteristics, water dynamics, and degradation levels. The field procedures included monitoring rainfall and water levels in some wetlands, validating land use and geological material maps and anthropogenic interferences, improving wetland limits, and performing soil sampling. Based on these factors, the method scheme is illustrated in Figure 3. Some of the proposed steps adopted previously established methods such as the classification of wetlands or were modified, for example, the determination of the function significance step. However, monitoring of the water depth, evaluation of anthropogenic interference, and wetland degradation steps were proposed.

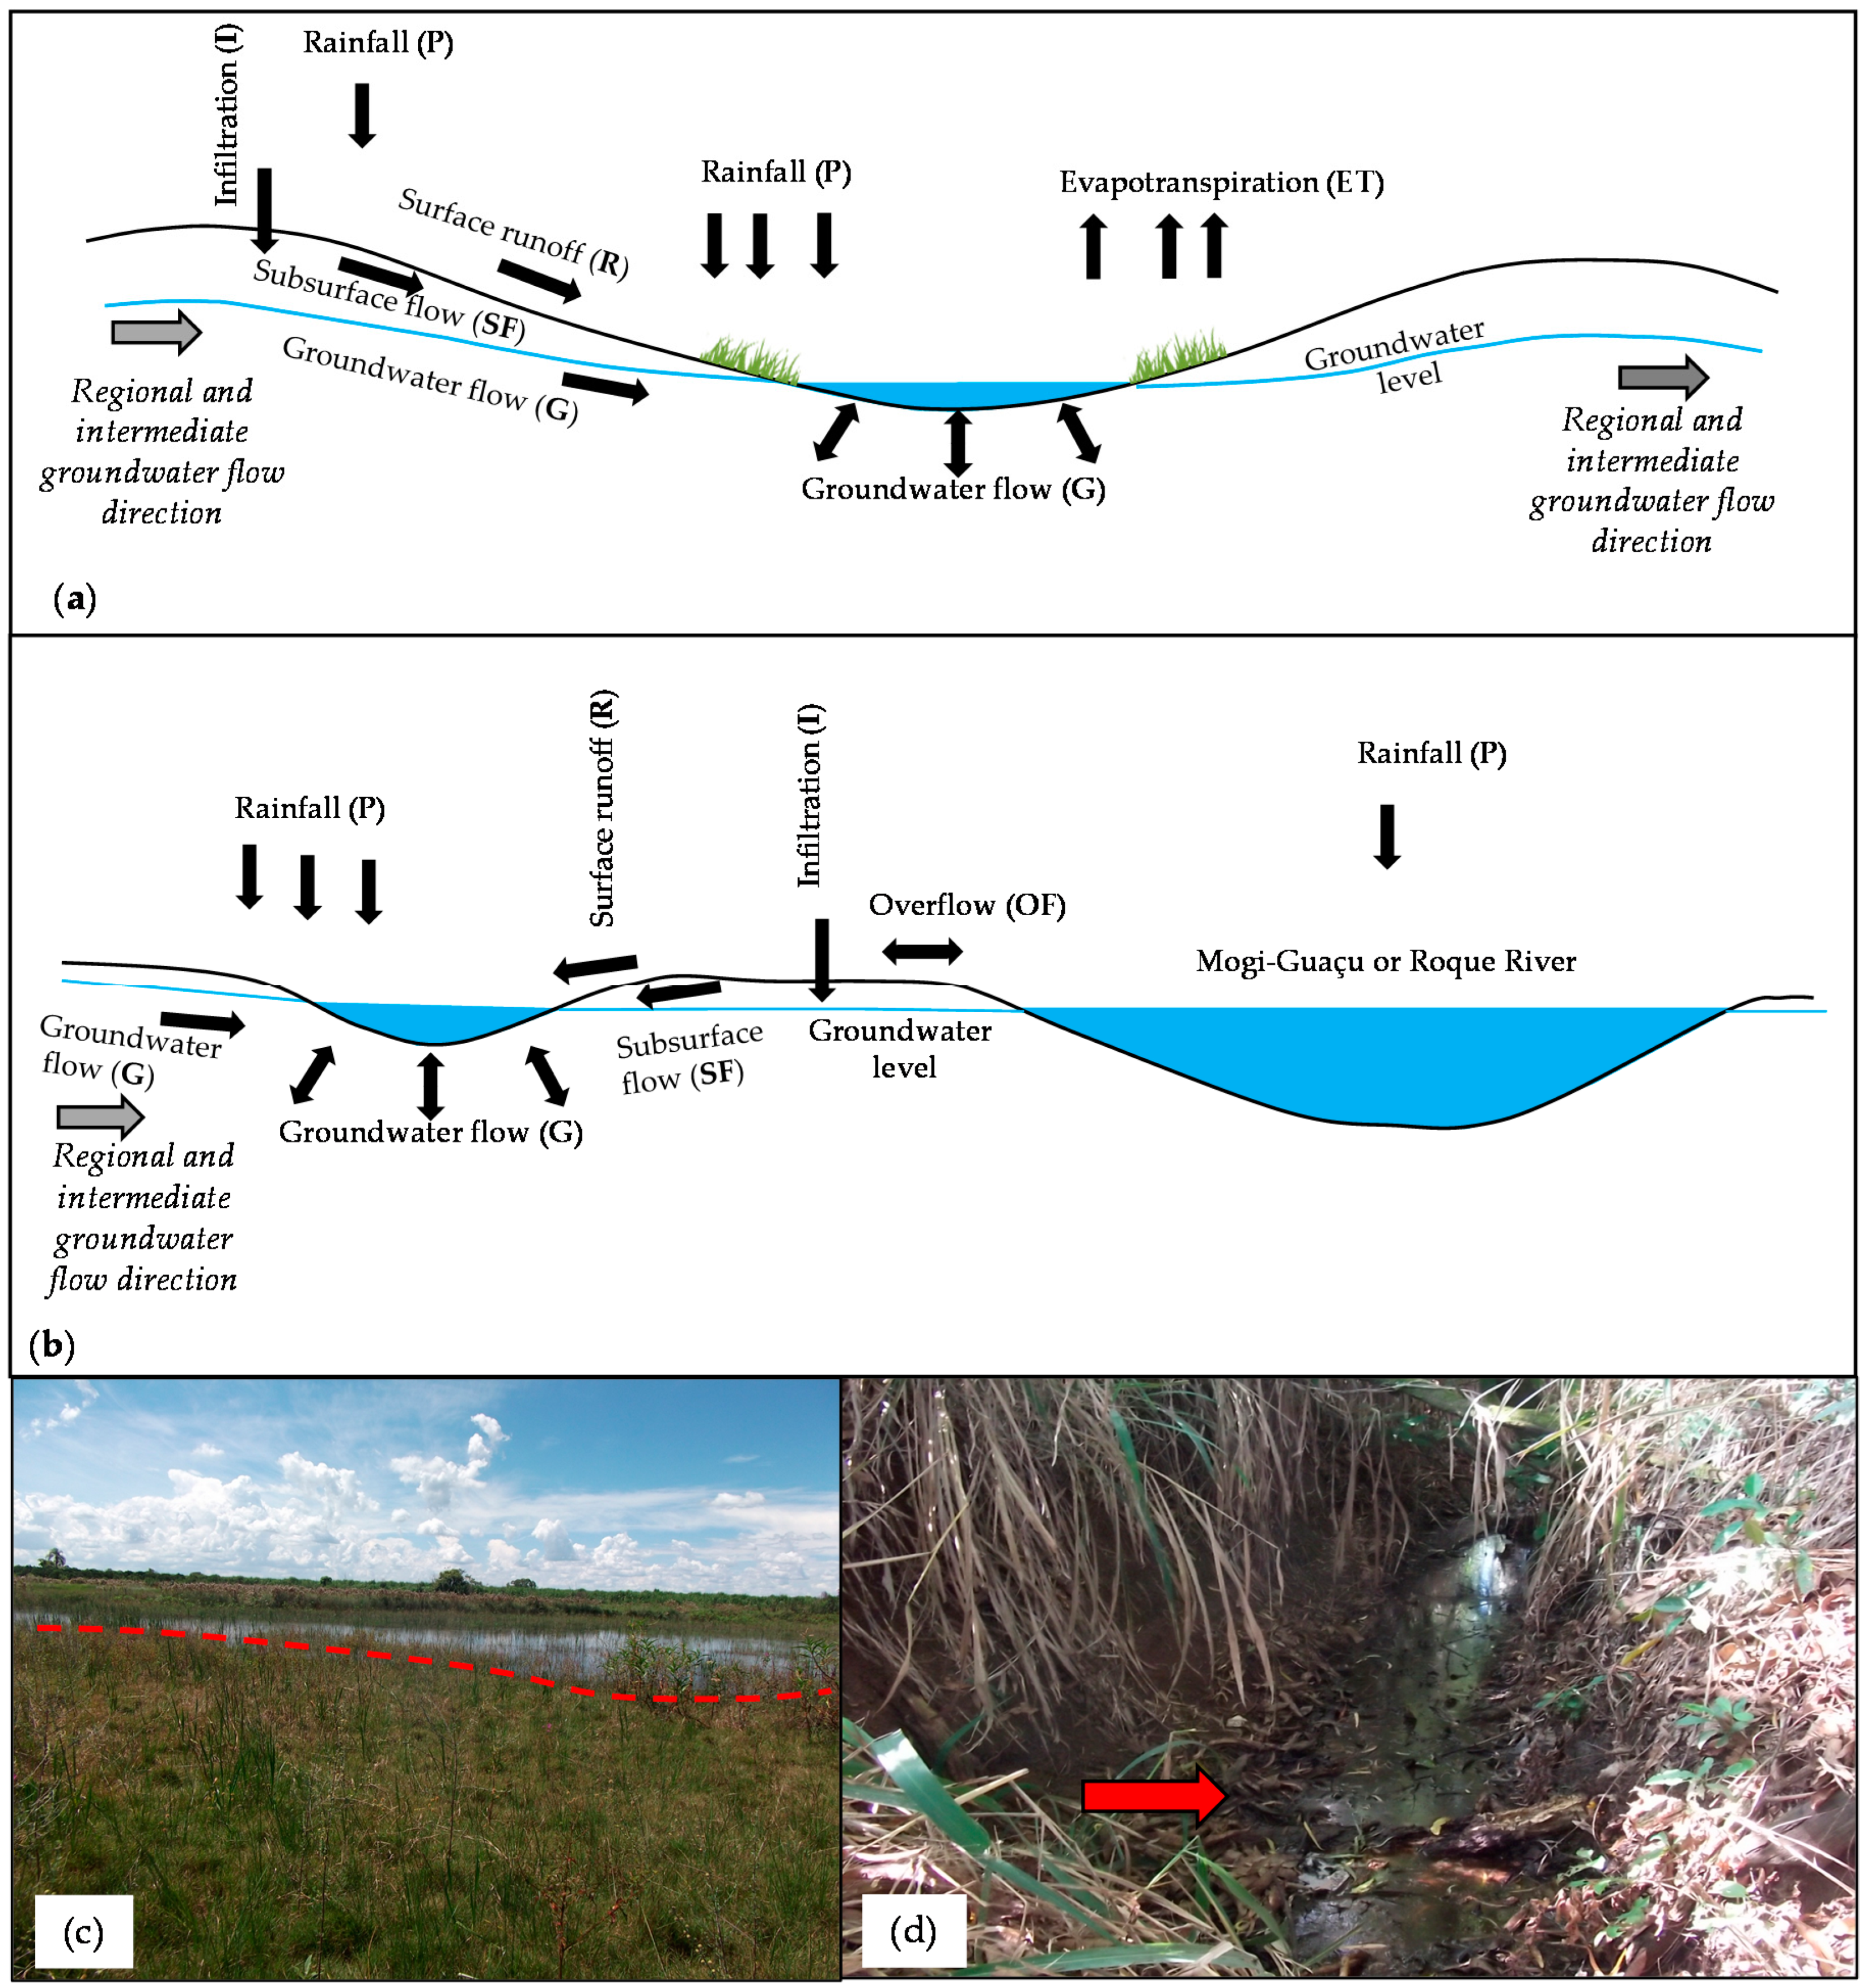
3.1. Depressional Wetland Conceptual Model

The basic conceptual model that addresses the essential conditions of the depressional wetlands present in the study region is helpful for surveying specific sites and for understanding the processes controlling wetland hydrology, the water budget, the feedbacks among them, and their responses to climatic variability and land management practices. The main concepts and understanding of the hydrology and water budget of depressional wetlands were based on Hayashi et al. [6] and Acreman and Felicity [34].
The hydrology of depressional wetlands must be analyzed based on the surrounding upland hydrology because some of the inputs and outputs are correlated to upland processes. The inputs are direct precipitation (P) in the wetland, surface runoff (R) and subsurface flow (SF) from uplands, occasional overflow (OF) from other wetlands or rivers during very wet periods, and groundwater flow (G) in the form of either diffuse or point discharge (G > 0). The outputs are evapotranspiration (ET) from the entire wetland including both inundated and surrounding non-inundated wetland areas, groundwater flow when wetlands recharge (G < 0) the aquifer, and drainage surface flow (D) when the wetlands are connected with natural drainage channels or ditches.
Depressional wetlands can be separated into four regions (Figure 4), corresponding to ponds, moist areas, wetlands, and catchment areas (contribution zones). These areas can have variable sizes and shapes, and sometimes ponds and moist areas can disappear because of climatic conditions and anthropogenic interference in wetlands or catchment areas. For example, in the study area, rainfall is seasonal, thus, the water inputs are also seasonal; according to Hayashi et al. [6], ponds that are occasionally central in wetlands often become dry, depending on the catchment size. However, wetland hydrological processes such as groundwater flowing beneath a dry pond area and the rest of the wetland continue through the dry period, regardless of whether a moist area remains.
In subsequent wet periods, the subsurface moisture directly influences the reappearance of ponds depending on the depth of the moist layer in relation to the wetland surface because the time required for soil to become saturated is less. The rainfall and soil characteristics of a catchment area also influence the wetland water budget, depending on the magnitude and duration of a rainfall event and soil infiltration rates. If a rainfall event occurs with a low intensity and short duration, this water will probably infiltrate (I) and not recharge the groundwater because it will be stored in superficial soil layers and then lead to evapotranspiration. However, long durations of moderate to high intensity rainfall will produce surface runoff (P–I) (Hortonian overland flow) and infiltration, which can be converted to subsurface flow or recharge the groundwater, raising the water table and discharging to wetlands. During a rainfall event, for locations where the water table is close to the ground surface, which in general is in low portions of floodplains and around wetlands, the water table may rise to the ground surface. When the soil becomes saturated, additional rainfall will also become surface runoff (saturation excess overland flow). It is important to note that the surface runoff and the precipitation that fall directly in wetlands are short-term inputs, and they are the most critical for maintaining wetlands, despite the atmospheric moisture deficit (i.e., P−E < 0). Meanwhile, groundwater flow and subsurface flow are considered as moderate- to long-term inputs, and depending on their position within a complex of wetlands, the wetland hydrology behavior can be different during wet and dry periods.
Based on these considerations, a conceptual model of depressional wetlands is presented in Figure 4, and the equation that describes the basic water budget is as follows.
Δ s = i n p u t o u t p u t
where ∆s is the change in water storage in a wetland; the inputs are P, R, SF, OF (OF > 0), and G (G > 0); and the outputs are E, D, (OF < 0), and G (G < 0). Substituting these variables into Equation (1) yields
Δ s = P + R + S F ± O F ± G E T D

3.2. Collection of Previous Data and Development of Maps of the Environmental Components

In this step, existing information about the region including a basic characterization of the geological materials (unconsolidated deposits and bedrock), topographic maps, satellite images, aerial photographs, and rainfall records was collected. These data were then assessed to verify their adequacy and usefulness for the conceptual model. Table 1 shows the previously collected data for the environmental components and the corresponding product, source, and spatial scale or resolution.
Maps of the drainage channels, topography, unconsolidated materials, and geology were developed from previous data. However, we updated the map of unconsolidated material and validated it in the field according to the procedures proposed by Zuquette et al. [41], which are based on interpretations of aerial images and photographs and characterization of unconsolidated materials. The characterization of unconsolidated materials included fundamental geotechnical parameters (e.g., texture, grain specific weight, porosity, and hydraulic conductivity) and was based on field and laboratory work. The basic geotechnical parameters were obtained from undisturbed and disturbed samples at different depths (0.2 m, 0.6 m, and 2.0 m) from exposed soil profiles and auger drilling executed at several sites mainly near wetlands; laboratory tests followed the procedures of Zuquette and ABNT [42,43,44] considering triplicates.
For the years 1991 and 2019, we developed land use and occupation maps, and the land use conditions in 2019 were validated in the field. The satellite images (Landsat) used to elaborate the land use and occupation maps were from the same period of the year (the rainy season) to represent the same season, and both years also presented similar rainfall event characteristics. In the ArcGIS 9.3 software, the satellite images were georeferenced, and land use boundaries were delineated manually.

3.3. Identification, Delineation, and Characterization of Depressional Wetlands and Catchment Areas

The depressional wetlands were inventoried, identified, and preliminarily delineated by hand in ArcGIS 9.3 based on an interpretation of satellite imagery (Landsat) with the help of aerial photographs and Google Earth images, considering typical wetland shapes, topographic positions, vegetation types, hydric soils, and the presence of water. The satellite images were taken during the wet season to easily observe wetland boundaries and the presence of ponded water in the wetlands. Based on the inventory, field observations were used to refine wetland boundaries. For the field work step, authorization was obtained from the owners of the visited areas, and a standard field form was developed to document the observed aspects exemplified at each stage. We used hydromorphic soil characteristics as the main indicators to determine the wetland extent, which corresponded to evidence of high organic matter content, the presence or absence of chemical reduction including mottling, occasional specks of elemental manganese, soil color, and muck presence. These characteristics were verified following Brazilian pedological suggestions [45]. To help analyze wetland extent, we also used soil saturation and flooding evidence (e.g., marks of the water level on vegetation and drift lines) as auxiliary information. For the delineation of the wetland limits, transects were executed in two perpendicular directions, and this procedure was performed in more than 90% of the wetlands. In these transects, soils were examined by digging a hole with an auger to a depth of 2 m, and the coordinates of locations where soil changes in the wetlands were obtained. After obtaining these points, adjustments were made to the boundaries marked via the interpretation of the satellite images and aerial photographs.
Based on the inventoried wetlands, the respective catchment areas were delineated. Initially, a digital elevation model (DEM) was used, which was developed in ArcMap 9.3 at a scale of 1:50,000 with a spatial resolution of 30 × 30 m pixels from the drainage channel net, wetlands, lakes, contour lines (20 m spacing), and points using a regular grid method. The model was refined using the fill filter to fill small depressions and the low-pass filter to smooth the matrix, thereby reducing local variations and removing raster noise. The model was validated by comparing the original contour line geometries and values with those generated from the DEM. In the next step, ArcScene 9.3 was used to control the vertical exaggeration of the developed DEM and to manually delineate the catchment boundaries.
The wetland characterization was based on environmental maps, unconsolidated material descriptions, identification of anthropogenic interferences, and rainfall and water level monitoring. From the environmental maps, the relief, geology, and unconsolidated material distribution of wetlands and their catchment areas were determined. Based on satellite images (Google Earth) and field work in both wetland and catchment areas, we identified anthropogenic interferences that are described in Section 3.7. To evaluate the water dynamics and hydrological conditions, rainfall and water level monitoring were conducted both before the rainy season and after the occurrence of significant rainfall events (rainy season). For rainfall monitoring, we considered two rainfall gauges (pluviographs) located close to the Pirassununga and Leme urban areas, which were monitored for two months before the beginning of the rainy season and one month after the start of the wet period. For water level, observations focused on the presence of ponded water at the surface and in ditches as well as evidence of saturation or wetting. To assist in the monitoring of changes in the water depth and saturation, reference stakes were installed in 35 wetlands with different topographies, landforms, and geological materials at the limit between pond and non-pond areas and between saturated and unsaturated soils. When the wetlands were dry at the surface, the stakes were installed in places with evidence of flooding or inside ditches where possible, assuming that if water did not surge onto the surface, the water levels could be observed inside these features. In addition, during water level monitoring, when possible, wells close to the wetland, holes dug with an auger during the wetland delineation step, and ditches within the wetland were analyzed to verify the groundwater levels in the field, which helped with the analysis of water level monitoring and inference of the water table in the wetlands from the geological profiles (Section 3.4).
To summarize and analyze information about wetland and catchment area characterization, we used basic statistics (e.g., mean, standard deviation, maximum, and minimum). We also performed Kruskal–Wallis [46] and Tukey’s Honest Significant Difference (HSD) [47] tests to verify whether there were statistically significant differences between the catchment and wetland areas considering the different geomorphological settings into which wetlands are inserted.

3.4. Analysis of Regional Intermediate Groundwater Flow

Even if the conceptual model considers regional and intermediate groundwater flows, the catchment area alone does not permit a proper analysis of this process. Thus, the regional groundwater flow was analyzed with a set of geological cross sections constructed from the DEM, hydrography, geology, and unconsolidated maps for a group of depressional wetlands, floodplains, drainage channels, lakes, and reservoirs. Due to limited well data, it was not possible to properly determine the groundwater level of unconfined aquifers; thus, the water table was inferred from the analysis of the field data (water levels in wells close to the wetland, holes dug with an auger, and excavated ditches) and the elevations of the drainage channels, lakes, and wetlands. The groundwater level between two known heights was considered to have a smooth curved shape, corresponding to a typical water table shape. Based on these cross sections, the groundwater flow direction was analyzed to investigate the potential contribution of regional and intermediate groundwater flows between wetlands, drainage channels, lakes, and reservoirs.

3.5. Wetland Classification

The wetland classification was based on the hydrogeomorphic (HGM) classification proposed by Brinson [48], which considers the geomorphic setting, water source, and hydrodynamics. The geomorphic setting was related to landforms and the position of the wetland in the landscape. The analysis of the water source considered the main input components including rainfall, overbank floodwater, surface runoff, subsurface flow, and groundwater flow, and the evaluation of the hydrodynamics considered the level of energy and the direction in which the water moves in the wetland. This classification system was used because hydrological and geomorphologic variables drive the chemical and physical processes and biotic community structure of wetlands [49] and because the HGM classification system has low cost, is easy to apply, and permits the aggregation of variables into functions.
The classification of depressional wetlands was initially carried out using geological, unconsolidated material, landform, land use, and topographic maps, and where possible, the water level in wells was estimated by field observations during the two incursions. The geomorphic settings analyzed the elevations, landforms, geological profiles, vegetation cover, and dominant soil types. For the water sources and hydrodynamics, the proximity to rivers, lakes, floodplains, and aquifers, the maximum and minimum rainfall, and the distribution of rainfall throughout the year were considered. However, this procedure only provides an initial determination of the HGM classification; the final determination was made through a field investigation (described in Section 3.2) for some reference wetlands, which were the monitored wetlands. Based on the classification of the wetlands, the mechanisms that control the water dynamics of the wetlands were determined.

3.6. Assessment of Potential Function Significance

It is often inappropriate to assess all wetland functions because not all wetlands perform all functions to the same degree or magnitude. The selection of functions for assessment should consider the characteristics of the wetland ecosystem and landscape, the assessment objectives, and the available data. Based on the HGM classes, it is possible to identify the potential functions that are most likely to be performed [50]. The selected functions to be assessed in this study are groundwater recharge and discharge, the removal of nonpoint source pollutants, and surface runoff storage. Groundwater recharge is related to the potential for the wetland to contribute water to an aquifer, which can be associated with the wetland capacity to contribute to the maintenance of drainage channel flow during the dry season. Groundwater discharge is related to the potential for the wetland to serve as an area where groundwater can be discharged to the surface, which helps to control the stored water and can provide water that leaves the wetland as streamflow. The removal of nonpoint pollutants (i.e., sediments, nutrients, or toxins) from overland runoff is the potential capacity of a wetland to remove pollutants from the water; in other words, the wetland works as a filter. The function of surface runoff storage is critical to the maintenance of a wetland and reflects the capacity of a wetland to collect and retain surface runoff, direct precipitation, and floodwater as standing water above the soil surface, pore water in the saturated zone, or soil moisture in the unsaturated zone. In addition, the water storage function is essential to support the biogeochemical processes that occur in wetlands such as the removal of nutrients and particulates.
The assessment was carried out through a qualitative approach to identify the importance of potential functions for depressional wetlands. In other words, this study was not concerned with the wetland function performance in terms of index or rates, but in terms of the potential and importance of a wetland to perform specific functions. Some of the selected parameters and the respective assumptions were based on [51]; however, these authors considered only surface runoff water storage and nonpoint source pollutant removal functions, therefore, other parameters were selected to analyze the groundwater discharge and recharge functions. Table 2 shows the parameter assumptions in relation to the respective analyzed functions.

3.7. Anthropogenic Interferences and Environmental Problems

Anthropogenic interferences and activities in the catchment and wetland areas can affect depressional wetland hydrology and functions and lead to environmental problems [10]. Thus, analyzing such influences involves evaluating the degree of environmental pressure, which can result in environmental impacts. The following anthropogenic interferences and activities were identified and quantified in satellite images and on site: (1) land use types and distribution, which can change infiltration, groundwater recharge, and the generation of surface runoff; (2) excavation within wetlands and artificial drainage channels (ditches) constructed to supply agriculture with water, which can result in a decrease in ponded water and wetland water storage and lower the groundwater level; and (3) landscape alteration due to the construction of terraces to reduce surface runoff energy, roads, allotments, and streets that change the surface runoff flow direction and infiltration and the filling of wetlands with other types of soil to plant sugarcane, which can change the water dynamics.
Considering that anthropogenic interferences affect the amount of water within wetlands, the water level and ponded area surface were evaluated. The evaluation of water level was performed based on the results of the onsite monitoring of rainfall and water level inside 35 wetlands (Section 3.3). For ponded areas, using Landsat satellite images in two different years from March 1991 and 2019, we determined, manually delineated in ArcGIS, and quantified the spatial distribution of the surface of ponded water considering the same period (wet season) and similar previous 12 months of rainfall patterns to compare the results.

4. Results

The results, analyses, and assessments of the conditions of the wetlands and catchment area are presented in the order in which they were collected.

4.1. Inventory and Basic Characteristics of the Wetlands and Catchment Areas

During the inventory, 112 wetlands, which cover approximately 902.0 ha, were identified and delineated. The average wetland size was 8.1 ha, with equivalent square dimensions of 283.7 m × 283.7 m. The largest wetland had an area of 40.4 ha, and the smallest wetland had an area of 1.1 ha. The shapes and extents of the wetlands were quite diverse, but they tended to be circular and serve as water catchment and storage features. The spatial arrangements of the wetlands and their positions with respect to the relief also differed. While they were typically close to each other (wetland complex), some isolated wetlands were identified. In general, the wetlands were associated with flat areas at high elevations, but were also observed at middle elevations or near the bases of hills close to drainage channels and floodplains.
The total wetland catchment area was approximately 6456.8 ha, with mean, maximum, and minimum areas of 57.6 ha, 334.3 ha, and 3.3 ha, respectively. Their shapes and extents also varied from circular to elongated. The average catchment area was 12 times larger than the wetland area. Figure 5a shows the spatial distribution of the wetlands and their association with drainage channels and relief, and Figure 5b shows the ratio of the wetland area to the corresponding catchment area.

4.2. Soil Characterization of Wetlands and Catchment Area

Based on field surveys, an analysis of updated geologic and geotechnical surveys from previous data and other environmental maps, the soil was characterized to verify the variations among the wetlands and the corresponding catchment areas.
The distributions of the lithologies and unconsolidated materials were combined in the map in Figure 5c. The lithologies underlying the wetlands and catchment area were those of the geological formations including the Tatuí (sandy siltstones), Irati (siltstones and shales), Corumbataí (claystones and siltstones), Pirambóia (fluvial sandstones), Botucatu (eolian sandstones), and Serra Geral (diabase) Formations. The unconsolidated materials of the catchment area were classified into two large groups: residual material originating from the previously described lithologies and transported materials (sandy colluvium, alluvial deposits, and clayey colluvium). The unconsolidated wetland material was denominated as hydromorphic soil, the characteristics of which are associated with Melanic Gleysol. The basic geotechnical characteristics of the different types of unconsolidated materials are shown in Table 3.
It was observed that 64.2% of wetland areas occurred on diabase lithology, where residual unconsolidated material from diabases, sandy colluvium, and clay colluvium transported unconsolidated materials predominately cover the catchment area. The other wetlands were distributed on Tatuí (20.5%), Corumbataí (14.3%), and Irati (1%) Formation lithologies, presenting sandy alluvium and sandy colluvium, residual unconsolidated material from siltstones and claystones, and siltstones and shale covering the catchment areas. The unconsolidated material of wetlands contain a hydromorphic soil layer varying from sandy clay loam to clay texture and from 1 to 2 m thick. These soils are also enriched in the underlying organic matter (30 cm), the porosity was highly variable, and the hydraulic conductivity values were low.
Based on the geology, unconsolidated maps and their characterizations, well profile descriptions obtained from the National Groundwater Database, field observations, and the DEM, five combinations of geological materials and the relief of the wetlands were identified, and their respective geological profiles were inferred. The main characteristics are described below.
  • Combination 1—Wetlands associated with diabase and residual unconsolidated material
This combination included 33 wetlands and their respective catchment areas. These wetlands varied in size with an average size of approximately 10.5 ha, generally occurring in the highest portion of the ground, and tended to be circular including the catchment area. The unconsolidated material that covered the catchment area had a clay to sandy clay texture and a thickness of up to 10 m. Figure 6a shows the typical relationships between these wetlands and the geological materials.
  • Combination 2—Wetlands associated with transported unconsolidated material composed of clay colluvium overlying the diabase
This combination included 11 wetlands, which were more elongated than those of combination 1 and had an average area of less than 5 ha and smaller contribution zones. The unconsolidated material of the catchment area was more clayey and less than 5 m thick. Figure 6b shows the typical relationships between these wetlands and the geological materials.
  • Combination 3—Wetlands associated with residual unconsolidated materials from the Corumbataí, Irati, and Tatuí Formations
This combination included 14 wetlands with areas ranging from approximately 1 ha to 12 ha with an average of 5 h, and contribution zones of varying sizes. The soil texture ranged from sandy loam to clay with variable depths. Figure 6c shows the typical relationships between these wetlands and the geological materials.
  • Combination 4—Wetlands associated with transported unconsolidated material consisting of sandy colluvium deposited on the residual materials
The 35 wetlands in this combination were associated with the highest portion of the ground and sandy transported materials, with depths ranging from 2 to 10 m. The elevation between the lowest point of the wetland and the top of the catchment area generally does not exceed 5 m. The average size of these wetlands was 9.6 ha, whereas that of the catchment area was 25 ha. Figure 6d shows the typical relationships between the wetlands and the geological materials.
  • Combination 5—Wetlands associated with unconsolidated materials in alluvial deposits
The 19 wetlands included in this combination interacted with the sandy transported unconsolidated materials deposited along the margins of the Mogi-Guaçú River as alluvium that mainly overlies the Tatuí Formation. Figure 6e shows the relationships between the geological materials and these wetlands. These wetlands were elongated and had an average area of 4.7 ha, whereas their contribution zones were rarely circular and had an average area of 18.5 ha.
To verify whether there were statistically significant differences in wetland and catchment areas among the five identified combinations of geological material and relief that compose wetlands, we applied Kruskal–Wallis and Tukey’s HSD tests. The results showed that for the Kruskal–Wallis test considering wetland area, p was 0.0098, which was lower than 0.05, indicating that there was a difference between the combinations. However, this difference only occurred between wetlands associated with diabase and residual unconsolidated material and wetlands associated with unconsolidated materials in alluvial deposits. For the catchment area, p was 0.0003262 from Tukey’s test, indicating that there was a difference between wetlands associated with transported unconsolidated material consisting of sandy colluvium deposited on the residual materials and wetlands associated with unconsolidated materials in alluvial deposits.

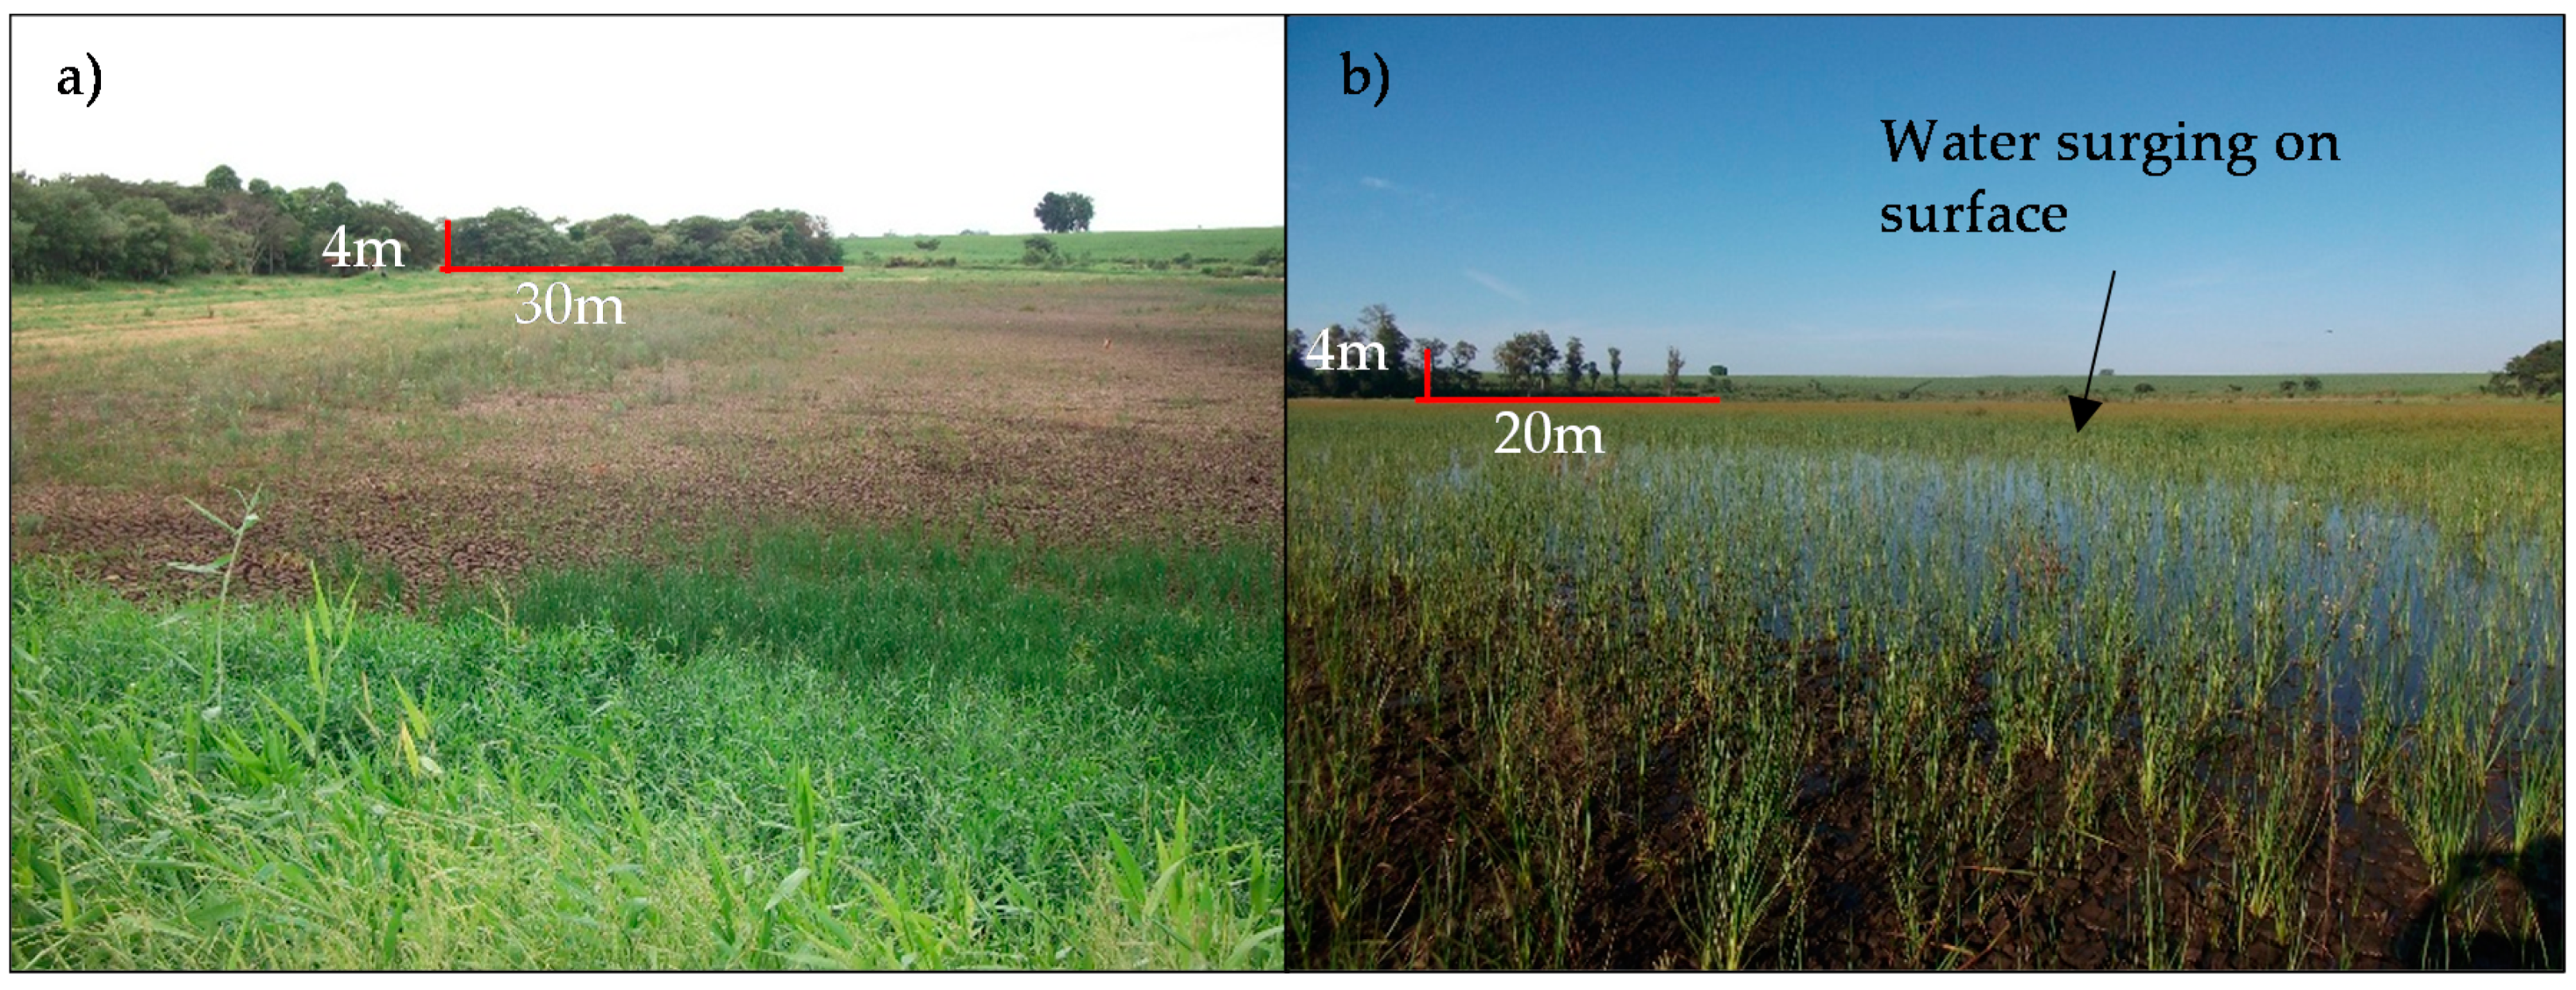
4.3. Hydrological Aspects of Wetlands

In relation to wetland hydrological conditions, the ponded water and saturated soil conditions identified in the field and in satellite images were different for the dry and wet seasons. During the dry period, most of the wetlands were dry; however, some still had some water in the center of the wetland, or the soil was saturated. For wet periods, some of the wetlands presented ponded water varying from 0.01 to 1.5 m in depth, and in the others, the soil was saturated. Figure 7 shows the conditions of a set of wetlands for four different periods, which highlights the water condition variations during the dry and rainy periods and for specific years. Dry wetlands with little water are shown in Figure 7a,b (2004 and 2011, respectively), which are consistent with the dry periods. Figure 7c,d (2016 and 2017, respectively) show features that indicate the presence of water, which is the result of the rainy period. Another interesting hydrological aspect observed in the study area was the occurrence of throughflow in some wetland catchment areas associated with sandy colluvium unconsolidated material, which covered residual unconsolidated material from diabases.

4.4. Rainfall and Water Level Monitoring

Before beginning the rainy season, the accumulated rainfall of the two previous months was 110 mm, the total days without and with rainfall events were 47 and 13, respectively, and rainfall events were not concentrated and generally presented low intensities (<6 mm/day). The one month monitored during the rainy season presented an accumulated rainfall of 300 mm including 13 days without and 17 days with rainfall events concentrated at the beginning and middle to end of the month, respectively. The rainfall event intensities ranged from 1 mm/day to 79 mm/day, with a standard deviation of 20.4 mm/day and an average of 16 mm/day.
For water level monitoring, we considered different hydrological conditions, which represented the conditions of the water level before and after the rainy season. Table 4 shows the results of the hydrological conditions observed in the monitored wetlands. Before the rains, these wetlands were mostly dry (54%), the soil was slightly saturated (6%), the ponded water depth was low (26%) or the groundwater level was near the surface in artificial drainage channels, and some wetlands suffered excavation and augering holes (14%). Different hydrological conditions were observed after the rainfall events that occurred in the study area. Figure 8a,b show the differences in one of the monitored wetlands before and after the rainy season. Five wetlands that were dry, two with saturated soil conditions, and one with water in artificial drainage channels and excavation holes showed evidence of flooding (23%). All the wetlands that presented ponded water had increased water volumes (26%). The wetlands that showed water in ditches and excavation holes also had elevated water levels (11%). However, eight dry wetlands (23%) showed no evidence of ponded water, saturation, or water in ditches and wetlands that had been excavated for water supply after a rainy season.

4.5. Wetland Classification

Based on the obtained data, the wetlands in the Leme region were classified based on the hydrogeomorphic classification as depressional. The depressional wetlands occurred mainly in the highest plain portion of the landscape and on the floodplains of the Mogi-Guaçú River and the Ribeirão do Roque, but fewer than 10 were located on the middle slopes. The identified potential sources of water were groundwater discharge, rainfall (direct source), surface runoff, subsurface flow, and overflow from drainage channels, and the magnitude and occurrence of each input source varied. The predominant hydrodynamics were vertical and seasonal fluctuations.
The depressional wetlands in Leme were also verified to show variability in terms of wetland water dynamics. The depressional wetlands were classified into two subclasses, the functional scheme of which is shown in Figure 9a,b. The characteristics of the hydrogeomorphological subclasses recognized in the study area are described below.
The first class is associated with the ninety-three wetlands located on higher and flat portions of the terrain. The main water entry is groundwater flow, and the magnitude of the discharge is a function of the position of the water level, which mainly occurs in a diffuse way (Figure 9c). However, in some wetlands, water may also be contributed from point discharge sources. Figure 9d shows an example of a point discharge source that occurs in the southeastern portion of Wetland 26. The other water inlets in these wetlands are the subsurface flow and surface runoff that occur in its basin and direct precipitation; however, their importance as water inputs is less than that of groundwater flow. The water output is either through evapotranspiration, natural or artificial drainage channels, or direct recharge of the aquifer. In terms of the catchment and wetland areas, they presented varied sizes and shapes.
The second subclass is the 19 wetlands located in the low part of the terrain near the floodplains of the Mogi-Guaçú and Roque Rivers. The main input is groundwater discharge; however, overbank flow may provide an important contribution, depending on the proximity of the drainage channel and wetland and the river water level, which influences the overflow volume. The output is by overflow when high-intensity rainfall events occur, groundwater recharge, and evapotranspiration.

4.6. Significance of Wetland Potential Functions

From the qualitative analysis of several parameters, the significances of potential wetland functions were assessed. For nonpoint pollution removal, proximity to pollution sources, proximity to water bodies, and wetland soil characteristics were considered. It was verified that 80% (Figure 10b) of the catchment area surrounding the wetlands was used for agricultural purposes, which corresponded mainly to sugarcane crops, indicating the high importance of nonpoint pollutant removal. In relation to the proximity to water bodies, two situations were verified: depressional wetlands that were far from (>100 m) intermittent or permanent surface waters (lakes and rivers) and wetlands that were near permanent water bodies. The first case (80%) represented the most common situation in the study area, and because wetlands are not close enough to water bodies, the likelihood that polluted runoff entering the wetlands otherwise enters surface water is low. The second case (20%) was the opposite of the first case, so considering this parameter for wetlands, the potential to remove nonpoint pollution is more significant than that in the first case. The wetland soils of the study regions presented high organic matter contents and generally fine textures, indicating that they have important cation exchange capacity and efficiency in retaining and transforming nutrients.
The analysis of the water storage function considered the wetland size, catchment area, hydraulic conductivity, and watershed position. The wetlands, as previously shown, are of various sizes, and those that are larger present a greater potential to store water from surface runoff, precipitation, subsurface flow, and groundwater discharge. The same logic was applied to the catchment areas, which were also varied, and the larger ones indicate a greater capacity to generate higher volumes of surface runoff to be stored. It was verified that the saturated hydraulic conductivity ranged from low (<10−5 cm/s) to high (>10−3 cm/s) and moderate (10-4 cm/s); in the catchment areas (46%) with low values, the water storage function presented a greater importance due to the higher possibility of generating surface runoff. The wetlands were varied in relation to the watershed position and were located predominantly near drainage channels of the 1st, 2nd, and 3rd orders, which indicates that the water storage function of these wetlands can have great impacts on the overall watershed hydrology.
For the groundwater discharge and recharge function, we analyzed hydraulic conductivity, occurrence of throughflow, and catchment and wetland areas. We found that the saturated hydraulic conductivity of unconsolidated materials in the catchment area varied from low to high and moderate, consequently resulting in different recharge and discharge potentials. In the study area, wetlands with larger catchment areas presented a greater probability of infiltrating a higher volume of water, increasing the wetland groundwater discharge potential. The Leme depressional wetlands were varied, and those with greater areas had greater potential for groundwater recharge. More than 20 catchment areas displayed throughflow, indicating low significance for the groundwater discharge function.

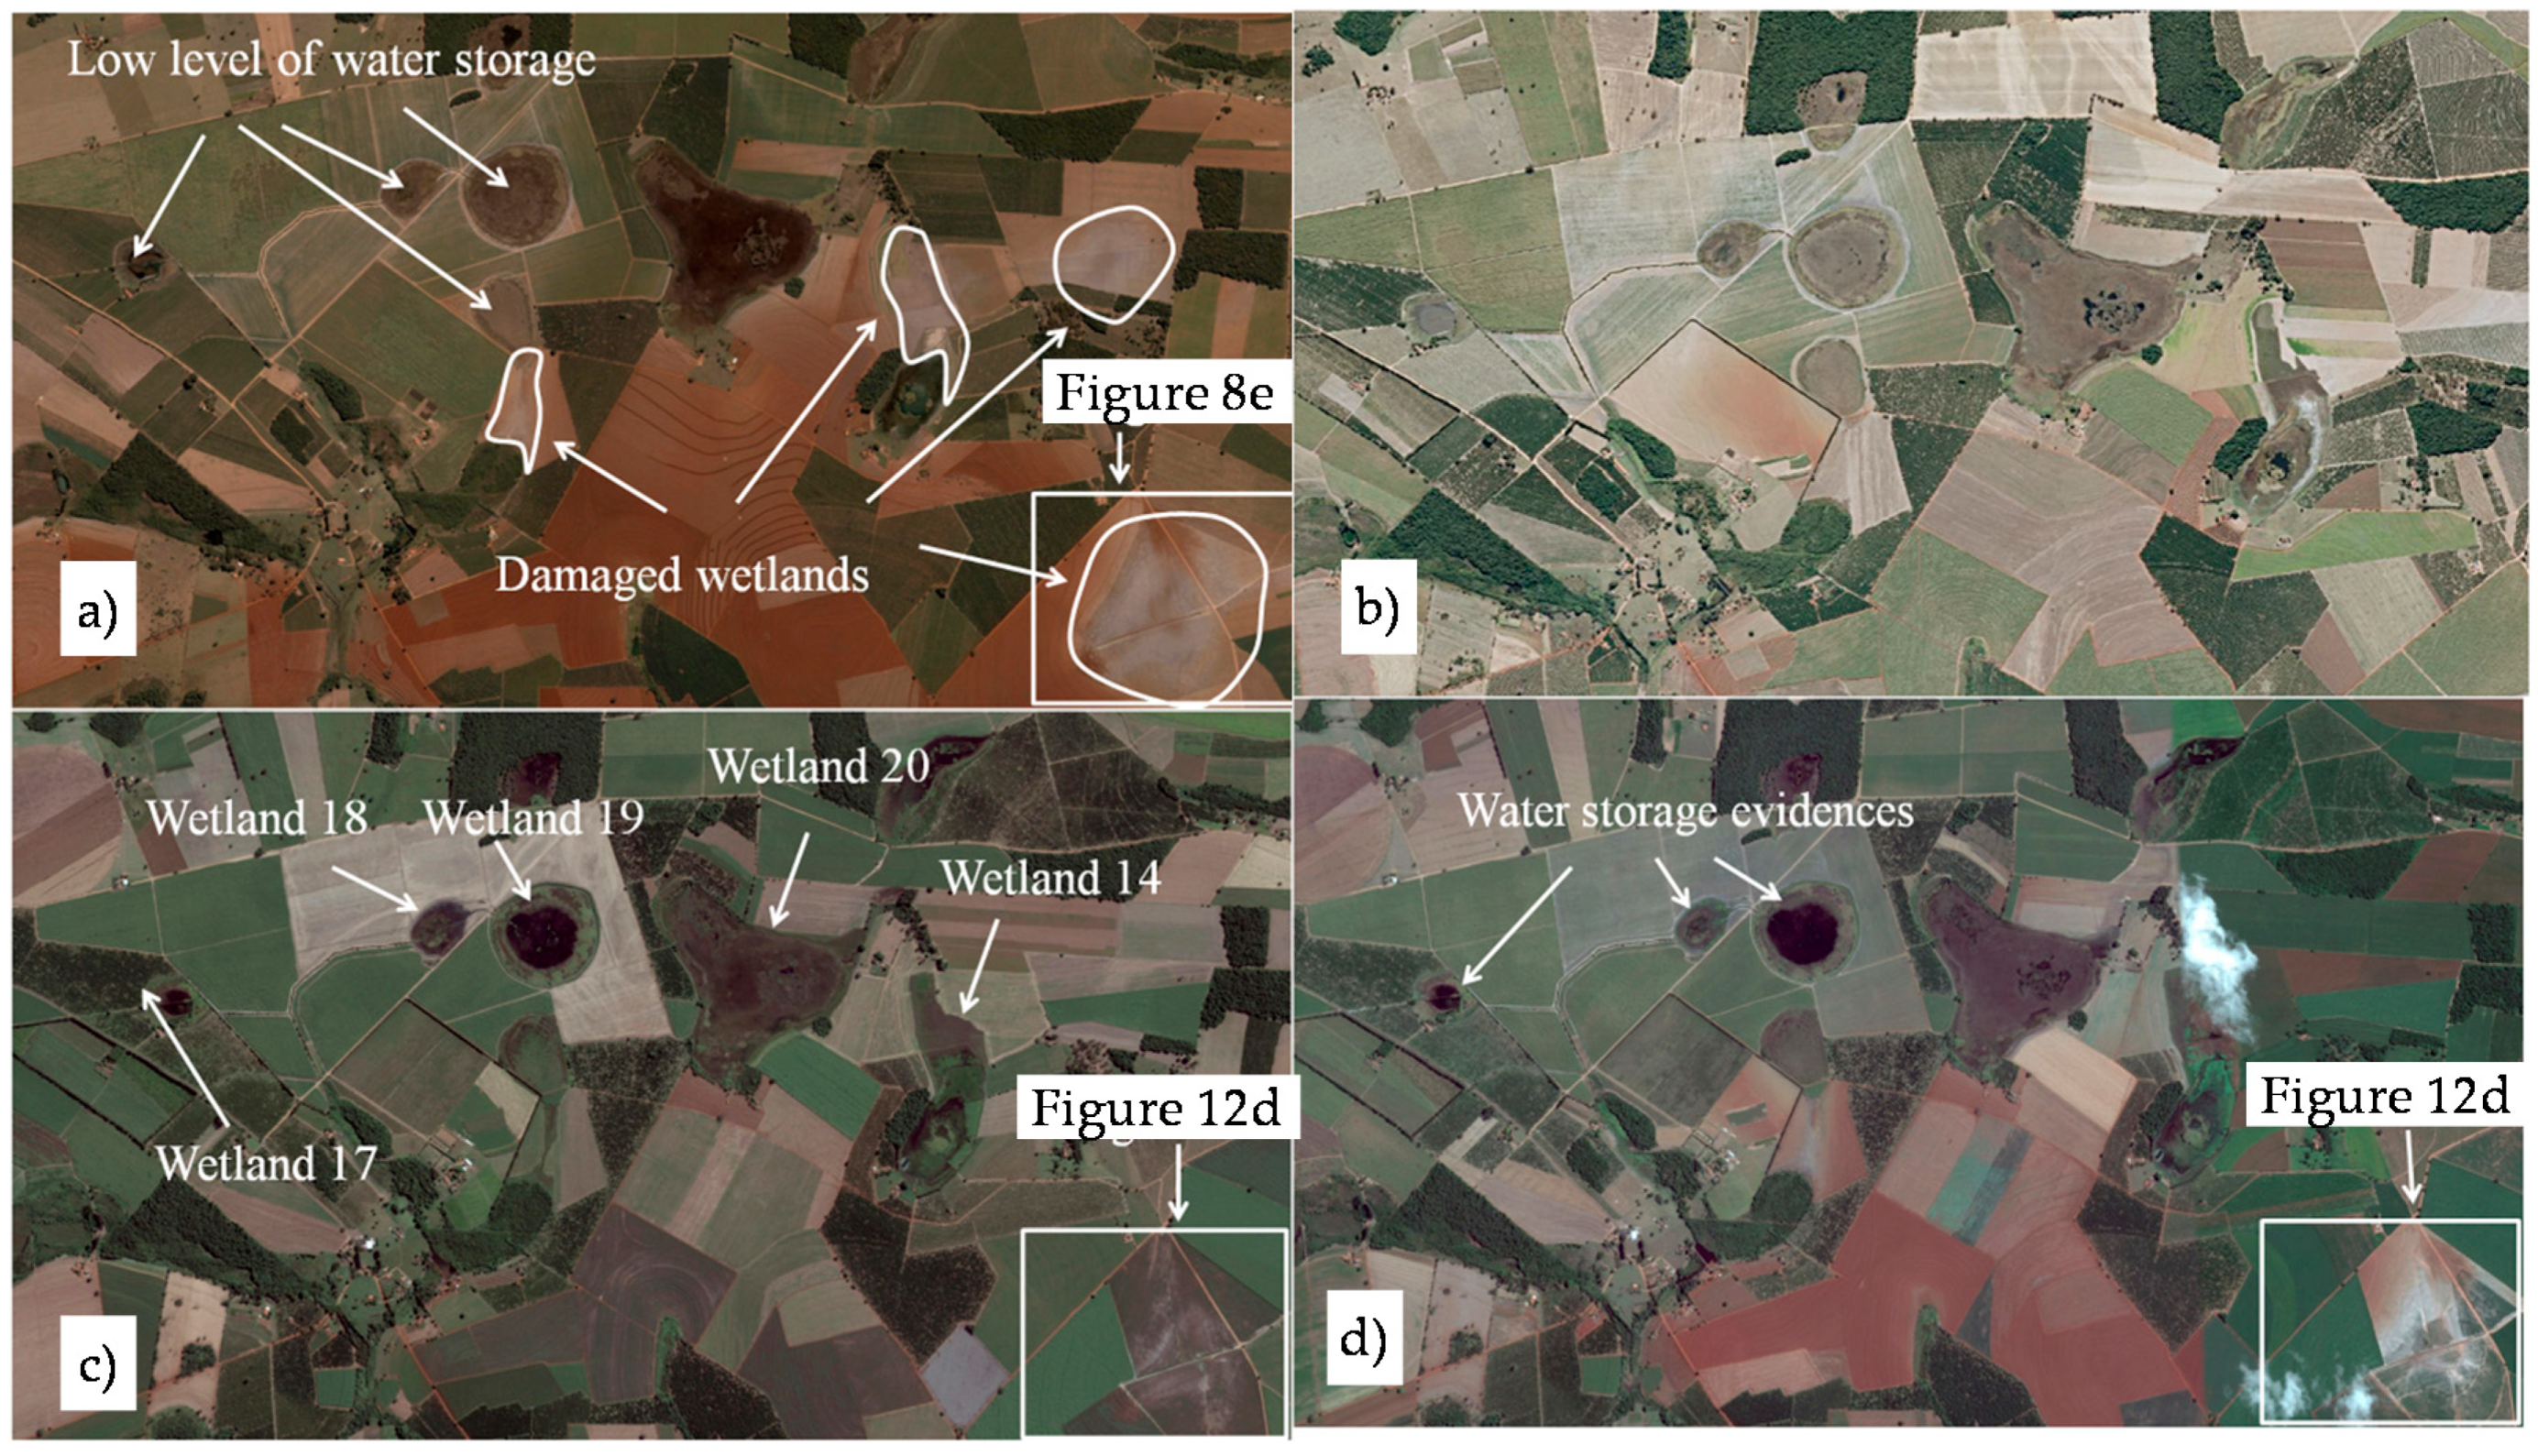
4.7. Land Use, Anthropogenic Interference, and Surface Area of Ponded Water

Agricultural uses were dominant within the wetlands and the catchment areas, in which the main land use type was semi-perennial crops (mainly sugarcane) (62.9%). A comparison of the two maps (Figure 10) showed a slight decrease (0.3%) in the vegetated areas, an increase in urban areas (1.6%), and a shift (4.4%) from permanent to semi-perennial (orange plantation) and annual crops, mainly to sugarcane plantations.
Five types of anthropogenic interference were identified within the wetlands: ditches and excavation of the wetland for exploiting water for irrigation and other agricultural uses, agricultural activities, roads cutting wetlands, and expansion of urbanized areas. Excavations (Figure 11a) and ditches (Figure 11b) were observed in more than 20 and 40 wetlands, respectively, and they were generally identified close to sugarcane plantations. Agricultural activities occurred all across the study area and could be associated with both wetland areas and wetland catchment areas. For catchment areas, it was observed that agricultural activities changed the landscape due to the construction of terraces higher than 1 m that permit the storage of overland flow (Figure 11c,d) and change the surficial soil layer due to agricultural management and the weight of machinery. It was observed that more than 10 wetlands, located both north and south of the study area, were cut by roads, and Figure 11e shows that Wetland 29 was cut by a road (SP-225). The expansion of urbanized areas changed four wetland landscapes, as shown in Figure 11g,h. The first image shows the positions of the terraces that were built during different periods to restrict the wetland, and they serve as a reference to evaluate the changes in size even before urbanization occurred. The second image also shows the lines of the streets in the current urban area, which are orthogonal to the edges of the wetland as well as the decreases in stored water and wetland area.
The magnitude of changes caused by anthropogenic interference also varied. Figure 10a shows a set of wetlands that illustrate the magnitudes of the changes in 2013 resulting from agricultural activities in the wetland and catchment areas. Figure 12b,c shows the same set of wetlands in 2017, and the details of Wetland 58 indicate that the landscape characteristics were heavily physically changed by the construction of terraces of channels excavated to drain the area and enable agricultural use. The others, except for Wetland 57, did not present evidence of ponded water, which could be the effect of ditches. Figure 12d shows a wetland that had been totally modified by agricultural activities including ditches and presented evidence of erosion.
Assuming that the changes and responses of the water dynamic components of wetlands can be measured based on the amount of water present in them, using satellite images from March 1991 and 2019, we quantified the surface area of ponded water inside the wetlands. The total rainfall amounts for the 12 months preceding March 1991 and 2019 were 1390 mm and 1350 mm, respectively. As observed in Figure 7a,b, in 1991, more than 60 wetlands presented flooded areas totaling 270 ha of ponded surface. However, in 2019, only 29 presented evidence of ponded water, and the results showed a significant decrease from 270 ha in 1991 to 60 ha in 2019.

5. Discussion

5.1. General Comments

In this manuscript, we inventoried, characterized, and studied the degradation of depressional wetlands in the Leme region. The main findings showed that the 112 inventoried wetlands were located within different geological materials and relief settings and were classified into two subclasses with different hydrological control mechanisms. The studied potential functions of depressional wetlands that presented high significance were groundwater discharge and recharge and surface runoff storage functions, but the removal of pollutants showed moderate potential. Anthropogenic interference (e.g., ditches, physical landscape and soil alteration, and water pumping) produced changes at different levels in both wetland and catchment area characteristics and affected wetland hydrology, which resulted in a decrease in the surface area of ponded water, a reduction in the water level, or even the drying of wetlands.
The applied methodology is flexible and reproducible and permits inventorying, characterizing, classifying, and evaluating the degree of degradation in several wetlands and identifying potential wetland targets for reclamation. It further allows the combination of quantitative and qualitative approaches based on low-cost mapping procedures and field and laboratory work, but experienced, trained professionals are required. The procedure used to monitor wetland water levels in the short term, despite its simplicity, proved to be interesting because long-term monitoring is expensive and such data for undeveloped countries and large wetland complex areas are lacking. Moreover, the monitoring also facilitates verifying significant variations in the wetland water levels in relation to rainfall events, thereby enabling inferences about wetland hydrology and environmental impacts.
On the other hand, the limitations of the method are associated with the scale of the work and the monitoring design. All the maps of environmental attributes should have compatible scales, and to reproduce this method, we recommend using it only for large areas with mapping scales from 1:50,000 to 1:10,000. For larger scales in undeveloped countries, maps with more detailed scales are rare, and their elaboration for large areas is expensive due to extensive field and laboratory work. At scales smaller than 1:50,000, it is not possible to thoroughly map and characterize depressional wetlands. The monitoring design provides only an indication of the water level between two periods, and the locations of stakes should be planned properly to identify the places where water surging occurs. Moreover, it is necessary to spatialize rainfall and to compartmentalize the study area rainfall depths to better comprehend the influence of precipitation variability on water depth and ponded surface area.
Note that the methodology used is a first approach to characterize and understand the magnitude and impacts caused by anthropogenic interferences, which presented an overall characterization and condition of the Leme depressional wetlands. Thus, it is necessary to develop more specific studies related to the long-term monitoring of the water table and evapotranspiration, characterization of the different infiltration conditions (soil + land use and management) of the catchment area, and modeling of water dynamics considering not only a single depressional wetland, but also the whole watershed and other types of wetlands to verify groundwater flow and connectivity.
After a brief review of the main findings and analysis of the applied methodology, it is important to deeply interpret the results and point out the potential implications of this study. As there are only a few studies in Brazil regarding depressional wetlands, several comparisons or relations made throughout the discussion were associated with other depressional and palustrine wetlands around the world, mainly the Prairie Pothole wetlands located in the United States and Canada. Although these wetlands are situated in a region with different wetland genesis, climate, and geology as well as the presence of snow in wetland water dynamics, in general, the Prairie Pothole area has groundwater discharge as the main input and groundwater recharge and evapotranspiration as the principal outputs [53], which are similar to the main input and outputs of the studied wetlands. Thus, it is possible to realize only a rough comparison because they present approximately similar hydrological mechanisms.

5.2. Wetland Characterization and Function Significance

Depressional wetlands are located in different settings with respect to relief and geological materials, and the analysis of the relationship between them is essential because their characteristics influence the amount of rainfall available for infiltration in the catchment area, local groundwater recharge, surface runoff generation, and subsurface flow. In other words, this analysis should be undertaken to understand the variability of the wetland geomorphological context and to infer an overview of how this variability can affect wetland water dynamics. For example, the wetland catchment areas located on flat and high regions composed of unconsolidated material with clay texture present low potential infiltration due to the low values of saturated hydraulic conductivity, which can result in high potential for overland flow generation and low potential for groundwater recharge [54,55,56]. Moreover, in the areas that present thicker unconsolidated materials, the probability that the infiltrated water provides groundwater recharge may be even smaller due to the greater depth of the effective transmission zone. On the other hand, catchment areas with highly permeable unconsolidated materials (sandy colluvium) yield high potential for groundwater recharge and low potential to generate overland flow [57,58]. The wetlands located on the floodplains of the Roque and Mogi-Guaçú Rivers presented a different hydrological behavior from those of other wetlands because they are strongly influenced by the groundwater water level, which is usually shallow, and less time is therefore required for the rainfall to infiltrate and reach the groundwater. This factor directly affects the water level as well as the recharge by overflows due to flooding [59,60].
In relation to the wetland and catchment areas, the average catchment area was 31% larger than the wetland area, which is in accordance with the range (5–35%) found by Hayashi et al. [6] in depressional wetlands in the PPR. Based on the five combinations of unconsolidated material, lithologies and relief, we used the Kruskal–Wallis and Tukey’s HSD tests on wetland and catchment areas to verify whether there are statistically significant differences between these combinations. The results showed that there was a difference between wetlands located on lowlands and uplands, which can be related to geomorphological characteristics. Although no statistically significant difference was found between upland wetlands, the area proportion is a useful guide because land management may affect the wetland water balance [6]; the area proportion also permits a comparison with other wetlands. In other words, the quantities of water budget components such as infiltration, runoff, and evapotranspiration are dependent on this area proportion. For example, two wetlands with the same characteristics of geology, relief, and land use can present different water balance behaviors if the relation between catchment and wetland areas is too diverse, which would necessitate a different management strategy for each wetland type.
When analyzing the hydrological mechanism used to comprehend and classify depressional wetlands, we verified that during the rainy season, the wetlands receive water from direct rainfall, surface runoff, and subsurface flow from uplands, and because the groundwater level is shallow, as the level rises because of groundwater recharge in the catchment area, groundwater discharge in wetlands becomes the main water input. The groundwater discharge may have a more significant contribution in wetlands located in low positions within the landscape [21]. Another important mechanism that was observed only for the wetlands located on the higher portion of the terrain in sandy colluvium unconsolidated materials and during the rainy period was throughflow, which is a part of subsurface flow where a certain point at the flow returns to the surface as overland flow prior to becoming groundwater [61]. The implication of throughflow in the wetland water budget can be a decrease in upland local groundwater recharge and wetland groundwater recharge because rainfall water returns to the surface and solar radiation exposure can increase evaporation. In addition to the groundwater contribution, wetlands located in floodplains can receive water from overbank flow from drainage channels, and the magnitude is a function of the rainfall intensity and duration, which influence river water levels [62]. During the remaining months (dry season), the water sources are restricted to regional, intermediate, and local groundwater flow and subsurface flow, and the subsurface and local groundwater flows depend on the amount of water that infiltrates in the catchment area and on the flow conditions, which are controlled by the geological materials. It is important to note that for regional and intermediate groundwater flow, we roughly estimated their contributions based on geological cross sections, and the real contributions of these components need further investigation.
In turn, water loss occurs by natural processes such as evapotranspiration, groundwater recharge, and depending on the configuration of the wetland, drainage through intermittent or perennial outlets and by anthropogenic components such as ditches and pumps for use in agricultural irrigation, animal husbandry, and other human purposes. Ditches, water pumping, and groundwater recharge are directly associated with wetland areas, and evapotranspiration occurs throughout both wetland and catchment areas [6]. However, evapotranspiration from moist areas may have a major influence on the water balance of wetlands [63]. In terms of contributions to water balance, evapotranspiration may present higher rates during the dry season due to lower volumes of rainfall. Groundwater recharge depends on hydraulic conductivity below the transmission zone [64], and wetlands with low values may present low potential groundwater recharge (e.g., wetlands located on residual unconsolidated material from diabases).
In general, the overall significance of the studied wetland functions is high to moderate, but the removal of pollutants presents a moderate potential to remove pollutants because most wetlands are not close to surface water; in other words, the probability that pollutants reach surface water is low. Despite this moderate potential, the catchment area of depressional wetlands is used for anthropogenic activities such as sugarcane crops that represent potential pollution sources. Sugarcane land use is an important potential pollution source if vinasse is used to increase production and is applied inadequately and indiscriminately. Vinasse can pollute water and soil [65] and has high concentrations of nitrate, potassium, and organic matter; in high concentrations, it can cause two conditions. It can improve the water infiltration capacity because it can cause soil aggregation, which increases the leaching of ions that can contaminate groundwater [66]. On the other hand, it can promote the dispersion of soil particles, which can decrease the infiltration capacity, resulting in an increase in surface runoff generation and the probability of contaminated surface waters [67].
For potential surface runoff storage, most wetlands present high to moderate significance. The high potential is because the wetlands have large catchment (>8 ha) and wetland (>4 ha) areas and are usually located in upstream watersheds and because the surface layer presents high saturated hydraulic conductivity. The combination of these factors indicates that the probability of generating a greater volume of overland flow is higher, and wetlands have enough area to store this flow and reduce the impact of downstream runoff. The moderate significance is associated with catchment areas that have unconsolidated material consisting of sandy colluvium, which presents high saturated hydraulic conductivity (i.e., rainfall has a high possibility of infiltrating instead of becoming overland flow). However, it is important to note that depending on rainfall duration and intensity, wetlands that have sandy colluvium in catchment areas can experience throughflow and can exfiltrate part of the rainfall, thus increasing the significance of these wetlands for performing the surface runoff storage function.
Similar logic can be applied to the potential groundwater recharge and discharge functions. Wetlands that have large extents tend to have greater areas to discharge groundwater and recharge the aquifer, and consequently have greater volumes. Most wetlands present large catchment areas, and when associated with unconsolidated material that has low saturated hydraulic conductivity, the possibility to infiltrate and recharge groundwater is higher, which can increase the groundwater level and affect the flow rates of groundwater discharge. However, for unconsolidated materials with low infiltration capacities, the effects of rainfall on groundwater levels due to lower potential groundwater recharge are probably less significant.

5.3. Wetland Degradation

Different anthropogenic interferences (e.g., the construction of ditches and roads, excavation within wetlands, and the use of the surrounding land for a variety of purposes) in the study region have caused changes of varying magnitudes in wetland hydrology including changes in the catchment area and the wetland area. The change in land use from forest to agricultural activities, mainly sugarcane, may change wetland characteristics and the infiltration and Hortonian overland flow dynamics in the catchment. On agricultural activity, converting wetlands to sugarcane plantations is a procedure commonly observed in the study area, and the effects of these modifications increase the degradation or totally modify some wetlands. Associated with wetland ditching, such changes have been one of the principal factors in the destruction of small depressional wetlands around the world [9,10,14]. In turn, the changes in catchment area are related to compaction of the surface layer because of the type of land management, which can intensify the construction of terraces that cut into hill slopes, store water, and decrease the surface runoff flow into wetlands. To investigate the soils of the region, Failache and Zuquette [56] considered a set of typical rainfall events in the east-central portion of São Paulo and studied the soil characteristics, infiltration, and Hortonian overland flow generation behavior of several land use types including sugarcane in different management stages. They found that independent of soil type, sugarcane and orange crops compacted the surface soil layer over the years because of the weight of machinery. Considering sugarcane at the beginning and end of the cultivation cycle (seven years), the dry specific weight and total soil total porosity of the surface layer (up to 20 cm) ranged from 1.358 to 1.520 g/cm3 and from 0.54 to 0.48, respectively, for residual unconsolidated material from diabases and from 1.470 to 1.637 g/cm3 and from 0.46 to 0.38, respectively, for sandy colluvium. Due to soil compaction, the infiltration rates decreased significantly, which resulted in an increased generation of Hortonian overland flow, which can increase erosion and wetland sedimentation processes [7], or flow to and be stored on terraces. The problem associated with stored water on terraces is that the time to infiltrate is much longer due to low infiltration rates, which can increase the evaporation rates because stored water is exposed to solar radiation for a longer time. On the other hand, part of the water that infiltrates is absorbed by sugarcane crops and then transpired; the other part is stored in the surficial soil layer, and only a small part is available to percolate to the groundwater.
Drainage through ditches in the study area is extensive and is one of the major factors affecting wetland water dynamics, and this practice is also applied in other wetlands around the world. Ehsanzadeh et al. [68] estimated that 30% of wetland areas have been drained in the Canadian portion of the PPR, and drainage can be more extensive in the U.S. portion [69]. The drainage in the Leme region is sometimes focused on smaller, seasonally, and ephemerally flooded wetlands. According to Mccauley et al. [14], the smaller ones dry out and consolidate surface water into fewer, more permanent basins that likely become larger and deeper, which was also observed in some Leme wetlands. The main effects of wetland drainage can be associated with groundwater level drawdown, and recent studies indicate that wetland drainage increases downstream flooding in some watersheds, but the magnitude of the effect remains uncertain [6]. Van der Kamp and Hayashi [64] similarly verified that in the prairie region, wetland drainage strongly affects the local groundwater; however, they noted that the effect on regional groundwater recharge may be small. In turn, McCauley et al. [14] found that wetland drainage tends to increase the ponded water areas of end-basin depressions, which can be considered a flooding impact, although not on outflowing streams.
Similarly, the construction of roads also affects the water dynamics of a few wetlands, and the main observed effect is the formation of a groundwater and surface water flow barrier that modifies the water depth. McCauley et al. [14] also observed such impacts; however, these authors verified that road construction can also facilitate flow between ditched wetlands. Shuldiner and Cope [70] explained that because of impoundment caused by roads, the water level tends to increase on the upflow side of the structure and decrease on the downflow side, consequently changing wetland areas and altering the natural distribution of water in wetlands. For the wetlands with ditches, before ditching, water flow was diffuse, and the change to concentrated flux at a certain point in the wetland resulted in a significant disruption of the hydrological regime [70].
In the Leme region, only a few wetlands are located close to urbanized areas. The main problem associated with these areas is the concentration of surface runoff because the lines of streets in the current urban area are orthogonal to the edges of the wetlands; furthermore, the expansion of urban boundaries physically changes the catchment and wetland landscape. The results of these changes are decreases in water storage, water depth, wetland area, and vegetation. Moreover, because of the increase in runoff rates, erosion and sedimentation may also be enhanced, which is in agreement with the observations of Reinelt and Horner [71]. Azous [72], the U.S. EPA [73], and Reinelt et al. [12] also observed in depressional freshwaters in U.S. urban areas that such changes altered water level response times, water depths, and durations and frequencies of inundation, decreased infiltration in catchment areas, and reduced stream baseflows and groundwater supplies to wetlands.
Thus, it is evident that anthropogenic interferences have several impacts in the Leme wetlands and to evaluate those impacts, we quantified the water inside wetlands based on the hypothesis that the analysis of surface water level and ponded area in relation to rainfall input can reflect the impacts of these changes. The main implication of the discussed changes was the faster decrease in water volume in several wetlands. However, the magnitude of the decrease varied and was verified in satellite images and by water level monitoring. Over 28 years, the surface ponded area decreased more than 4.5 times, and decreases occurred in all wetlands. The monitoring results were corroborated with multitemporal data and showed that before the rainy season, in several wetlands, the geological materials on the surface were very dry or even cracked, and that the vegetation showed signs of lacking water, which could be preliminarily associated with a drier period. The monitored wetlands that had water at their surfaces also had groundwater levels closer to the wetland surfaces. In addition, the wetlands associated with sandy colluvium in the catchment area showed evidence of sedimentation due to erosion, which reduced their useful water volume. However, after a rainy period, for the same rainfall amount, eight areas were still dry, and 10 wetlands had water below the surface, demonstrating that the water dynamics and hydrological functions of these wetlands were affected in some way by anthropogenic interferences. These wetlands were located in areas with intense anthropogenic activities in both the catchment and wetland areas such as the presence of extensive agricultural management, landscape modifications, pumping, and artificial drainage channels, which are well known to change the water dynamics and hydrological functions of wetlands including water storage and groundwater discharge and recharge [10,14,70,74]. Although these results are strongly indicative of wetland degradation, future studies to model wetland hydrology and consider geological material variability are essential because many of the wetlands that are experiencing high anthropogenic pressure are located in clay soils. Wetlands with clay soil may cause water ponding that is perched above the groundwater table, which results in smaller storage volumes and shorter seasonal hydroperiods than in wetlands with deeper sands that permit connections with shallow groundwater [75,76]. Thus, when analyzing the monitoring data, it is essential to consider this variability so that erroneous interpretation is avoided.
To comprehend the global situation of degradation in the study area based on an understanding of the dynamic wetland water components, Figure 13 shows the main anthropogenic activities that were identified in the region, the modifications of the components of the wetland and catchment areas, and the main environmental changes that could occur in both the wetlands and the catchment areas. The relationships shown in Figure 13 demonstrate that anthropogenic interferences affect the factors that modify the equilibrium of wetlands and catchment areas and can lead to changes in the wetland water dynamics and even the destruction of the wetlands. Agricultural activities are the most influential because they change the environmental conditions of both the wetlands and the catchment areas, which leads to the degradation of the wetlands.
Based on the multitemporal analysis of the flooded wetland area and land use changes and the evaluation of anthropogenic interferences and environmental changes associated with short-term monitoring, it was possible to identify wetlands that present evidence of degradation including those that experience a high degree of anthropogenic pressure. To improve wetland management, these results enable the choice of potential targets for reclamation and support more effective planning and water management in the region to ensure environmental quality and to maintain and improve wetland hydrological functions.

6. Conclusions

The 112 assessed depressional wetlands covered a total area of approximately 900 ha and included different geological materials, relief settings, and characteristics. The wetlands were divided into two hydrogeomorphic classes with different hydrological control mechanisms, which are related to groundwater flow, surface runoff, subsurface flow, overflow, evapotranspiration, and drainage surface flow. In general, the studied wetlands showed high significance for the groundwater discharge and recharge functions and the surface runoff storage function; however, they showed moderate significance for the removal of pollutants, mainly because most of the wetlands were not close to water bodies.
Considering that changes in the hydrology of wetlands are reflected in the variable amount of water present in these areas, we concluded that the water dynamics of the studied wetlands were affected by anthropogenic activities in the catchment areas and within the wetlands. A comparison of the ponded water area in 1991 with that in 2019 showed a significant water volume loss in the studied wetlands, which confirmed the data obtained from onsite monitoring. The wetlands presented different hydrological conditions that varied in the two monitoring periods. Before the rainy periods, most of the 35 monitored wetlands were dry, the soil was only slightly saturated, or the depth of the ponded water was low. After the rainy periods, over half of the wetlands were still dry, or there was water only inside the ditches excavated to drain the wetlands for water supply; the other wetlands had ponded water, even if the water level was low.
The anthropogenic activities that affected wetland water dynamics changed both the wetland catchment and wetland area characteristics. The land uses (agriculture, pasture, urban, and road) in the catchment area affected the water dynamics in two ways. First, they compacted the superficial layer of geological materials, which reduced the infiltration rate and therefore decreased the amount of infiltrated water and the percolation distribution during the dry season, consequently impacting the local potential groundwater recharge. Second, they physically changed the landscape, for example, terraces that store water and reduce the surface runoff that reaches wetlands were constructed, and urbanized areas that change the surface flow direction and reduce the amount of infiltrated water had expanded. The modifications in wetlands were related to the construction of drainage ditches for agricultural water, and the results showed evidence of decreasing the available stored water in wetlands; furthermore, the construction of roads reduced the ponded water in parts of the wetlands.
We conclude that the proposed procedure is flexible and can evaluate the degree of degradation of several wetlands and identify potential wetland targets for reclamation. The procedure also yields data to realize more effective planning and water management in the region to ensure environmental quality and to maintain and improve wetland hydrological functions. This method has several advantages; it combines quantitative and qualitative approaches and considers the variability of geological materials, land uses, and management practices. The data used to characterize the wetlands were obtained from common and low-cost mapping procedures, in situ tests, and laboratory equipment, but experienced, trained professionals are required. However, the drawbacks are related to the scale of the work, which is indicated only for large areas up to mapping scales between 1:50,000 and 1:10,000; monitoring provides only an indication of the water level between two periods, the locations of stakes should be planned properly to identify the places where water surging occurs, and it is necessary to spatialize and compartmentalize rainfall to improve the interpretation of water depth results.
For future work, we intend to apply specific algorithms considering satellite images to monitor water levels and field monitoring studies to validate offsite monitoring results. Furthermore, mathematical models will be applied to quantify the depressional water budget changes due to anthropogenic activities.

Author Contributions

The main idea was conceptualized by L.Z. and M.F., whereas the methodology was defined by L.Z. and M.F. The original draft was prepared by L.Z., M.F., and A.B. and reviewed and edited by L.Z., M.F., and A.B. The overall work was carried out under the supervision of L.Z., M.F., and A.B. All authors have read and agreed to the published version of the manuscript.

Funding

This research was funded by the São Paulo Research Foundation (Fundação de Amparo à Pesquisa do Estado de São Paulo—FAPESP), grant number 2014/02162-0.

Conflicts of Interest

The authors declare no conflicts of interest.

References

  1. Winter, T.C.; LaBaugh, J.W. Hydrologic considerations in defining isolated wetlands. Wetlands 2003, 23, 532–540. [Google Scholar] [CrossRef]
  2. Johnson, W.C.; Boettcher, S.E.; Poiani, K.A.; Guntenspergen, G.R. Influence of weather extremes on the water levels of glaciated prairie wetlands. Wetlands 2004, 24, 385–398. [Google Scholar] [CrossRef]
  3. Bates, B.C.; Kundzewicz, Z.W.; Wu, S.; Palutikof, J.P. (Eds.) Climate Change and Water. Technical Paper of the Intergovernmental Panel on Climate Change, IPCC Secretariat, Geneva. 2008. Available online: http://www.ipcc.ch/publications_and_ata/publications_and_data_technical_papers_climate_change_and_water.htm (accessed on 17 May 2018).
  4. Poff, L.; Brinson, M.; Day, J.R.J. Aquatic Ecosystems & Global Climate Change: Potential Impacts on Inland Freshwater and Coastal Wetland Ecosystems in the United States; Pew Center on Global Climate Change: Washington, DC, USA, 2002. [Google Scholar]
  5. Winter, T.C. The vulnerability of wetlands to climate change: A hydrologic landscape perspective. J. Am. Water Resour. Assoc. 2000, 36, 305–311. [Google Scholar] [CrossRef]
  6. Hayashi, M.; Van der Kamp, G.; Rosenberry, D. Hydrology of Prairie Wetlands: Understanding the Integrated Surface-Water and Groundwater Processes. Wetlands 2016, 237–254. [Google Scholar] [CrossRef]
  7. Luo, H.R.; Smith, L.M.; Allen, B.L.; Haukos, D.A. Effects of sedimentation on playa wetland volume. Ecol. Appl. 1997, 7, 247–252. [Google Scholar] [CrossRef]
  8. Reiss, K.C.; Brown, M.T. Evaluation of Florida Palustrine Wetlands: Application of USEPA Levels 1, 2, and 3 Assessment Methods. EcoHealth 2007, 4, 206–218. [Google Scholar] [CrossRef]
  9. Moreno-Mateos, D.; Power, M.E.; Comín, F.A.; Yockteng, R. Structural and functional loss in restored wetland ecosystems. PLoS Biol. 2012, 10. [Google Scholar] [CrossRef] [Green Version]
  10. Evenson, G.R.; Golden, H.E.; Lane, C.R.; McLaughlin, D.L.; D’Amico, E. Depressional wetlands affect watershed hydrological, biogeochemical, and ecological functions. Ecol. Appl. 2018, 28, 953–966. [Google Scholar] [CrossRef]
  11. Gallaway, S.; Davis, C.; Dvorett, D.; Tramell, B. Validation of the Oklahoma Rapid Assessment Method (OKRAM) in Depressional Wetlands Using EPA’S Three-Tiered Framework. Wetlands 2019, 1–13. [Google Scholar] [CrossRef]
  12. Reinelt, L.; Horner, R.; Azous, A. Impacts of urbanization on palustrine (depressional freshwater) wetlands—Research and management in the Puget Sound region. Urban Ecosyst. 1998, 2, 219–236. [Google Scholar] [CrossRef]
  13. Skagen, S.K.; Melcher, C.P.; Haukos, D.A. Reducing sedimentation of depressional wetlands in agricultural landscapes. Wetlands 2008, 28, 594–604. [Google Scholar] [CrossRef]
  14. Mccauley, L.; Anteau, M.; Van der Burg, M.; Wiltermuth, M. Land use and wetland drainage affect water levelsand dynamics of remaining wetlands. Ecosphere 2015, 6, 1–22. [Google Scholar] [CrossRef]
  15. Riato, L.; Bella, V.; Leira, M.; Taylor, J.; Oberholster, P. A diatom functional-based approach to assess changing environmental conditions in temporary depressional wetlands. Ecol. Indic. 2017, 78, 205–213. [Google Scholar] [CrossRef] [Green Version]
  16. Ficken, C.; Cobbaert, D.; Rooney, R. Low extent but high impact of human land use on wetland flora across the boreal oil sands region. Sci. Total Environ. 2019, 693. [Google Scholar] [CrossRef] [PubMed]
  17. Johnston, C.A. Wetland Losses Due to Row Crop Expansion in the Dakota Prairie Pothole Region. Wetlands 2013, 33, 175–182. [Google Scholar] [CrossRef]
  18. Finlayson, C. Loss and Degradation of Australian Wetlands. In LAWASIA Conference: Environmental Law Issues in the Asia-Pacific Region; Supervising Scientist: Darwin, Australia, 2000. [Google Scholar]
  19. Ballantine, K.; Schneider, R. Fifty-five years of soil development in restored freshwater depressional wetlands. Ecol. Appl. 2009, 19. [Google Scholar] [CrossRef] [Green Version]
  20. Wu, Q.; Lane, C.R. Delineating wetland catchments and modeling hydrologic connectivity using lidar data and aerial imagery. Hydrol. Earth Syst. Sci. 2017, 21, 3579–3595. [Google Scholar] [CrossRef] [Green Version]
  21. Neff, B.P.; Rosenberry, D.O.; Leibowitz, S.G.; Mushet, D.M.; Golden, H.E.; Rains, M.C.; Brooks, J.R.; Lane, C.R. A Hydrologic Landscapes Perspective on Groundwater Connectivity of Depressional Wetlands. Water 2020, 12, 50. [Google Scholar] [CrossRef] [Green Version]
  22. Macedo-Soares, P.H.M.; Petry, A.C.; Farjalla, V.F.; Caramaschi, E.P. Hydrological connectivity in coastal inland systems: Lessons from a Neotropical fish metacommunity. Ecol. Freshw. Fish. 2010, 19, 7–18. [Google Scholar] [CrossRef]
  23. Moraes, A.B.; Stenert, C.; Rolon, A.S.; Maltchik, L. Effects of landscape factors and hydroperiod on aquatic macroinvertebrates with different dispersal strategies in southern Brazil ponds. J. Freshw. Ecol. 2014, 29, 319–335. [Google Scholar] [CrossRef] [Green Version]
  24. Alho, C.; Mamede, S.; Benites, M.; Andrade, B.; Sepúlveda, J. Threats to the biodiversity of the Brazilian Pantanal due to land use and occupation. Ambient. Soc. 2019, 22. [Google Scholar] [CrossRef]
  25. Cunha, C.; Junk, W. Identificação e Análise das Ameaças e Impactos no Componente Pantanal e recomendações para salvaguardá-lo. Wetl. Int. Blue Corridor Rep. 2019, 1, 1–79. [Google Scholar]
  26. Parizotto, T. Morphological and Hydrochemical Study of Small Depressions in Nhecolândia, Pantanal. Master’s Thesis, Geography, University of São Paulo, São Paulo, Brazil, 2012. [Google Scholar]
  27. Almeida, F. Distribution and Correlation of Soil Physical and Chemical Parameters in Cerrado Wetland Applying Mathematical Models. Ph.D. Thesis, University of Uberlândia, Uberlândia, Brazil, 2016. [Google Scholar]
  28. Furlan, L. Hidrodinâmica em Área Úmida de Cerrado na Chapada Sedimentar do Oeste Mineiro. Master’s Thesis, Universidade Estadual Paulista, Rio Claro-Brazil, Brazil, 2019. [Google Scholar]
  29. Caldarelli, C.E.; Gilio, G. Expansion of the sugarcane industry and its effects on land use in São Paulo: Analysis from 2000 through 2015. Land Use Policy 2018, 76, 264–274. [Google Scholar] [CrossRef]
  30. EPA. Elements of a State Water Monitoring and Assessment Program for Wetlands. 2006. Available online: http://www.epa.gov/owow/wetlands/pdf/Wetland_Elements_Final.pdf (accessed on 25 June 2017).
  31. Ratter, J.A.; Ribeiro, J.F.; Bridgewater, S. The Brazilian cerrado vegetation and threats to its biodiversity. Ann. Bot. 1997, 80, 223–230. [Google Scholar] [CrossRef] [Green Version]
  32. Lollo, J.A. Mapeamento Geotécnico da Folha de Leme—SP. Master’s Thesis, University of São Paulo, São Carlos, Brazil, 1991. [Google Scholar]
  33. Marcuzzo, F.; Arantes, E.; Wendland, E. Evaluation of potential and direct evapotranspiration estimate methods applied in the region of São Carlos. Irriga Botucatu 2008, 13, 323–338. [Google Scholar] [CrossRef]
  34. Acreman, M.C.; Felicity, M. Hydrological Impact Assessment of Wetlands. In Proceedings of the ISGWAS Conference on Groundwater Sustainability, Alicante, Brazil, 24–27 January 2006; pp. 225–255. [Google Scholar]
  35. IBGE (Instituto Brasileiro de Geografia e Estatística). Cartas topográficas, Folha:SF-23-Y-A-II-1 (LEME) Escala1:50.000. 1971. Available online: https://www.ibge.gov.br/geociencias/downloads-geociencias.html (accessed on 25 October 2018).
  36. EMBRAPA, Levantamento Pedológico Semi-Detalhado do Estado de São Paulo, 1:100.000 scale. EMBRAPA Brasília. 1981. Available online: https://www.ibge.gov.br/geociencias/downloads-geociencias.html (accessed on 25 October 2018).
  37. ANA (Brazilian National Water Agency). Rainfall Data. 2015. Available online: http://www.snirh.gov.br/hidrotelemetria/Default.html (accessed on 29 March 2018).
  38. NASA. Landsat Data Continuity Mission: Continuously Observing Your World. Available online: http://ldcm.gsfc.nasa.gov/mission_details.html (accessed on 5 July 2019).
  39. GOOGLE. Google Earth Satellite Images. 2019. Available online: https://earth.google.com/web/data=CiQSIhIgOGQ2YmFjYjU2ZDIzMTFlOThiNTM2YjMzNGRiYmRhYTA (accessed on 11 November 2019).
  40. Base. Aerophotogametry and Projects. 1971. Available online: https://www.baseaerofoto.com.br/ (accessed on 13 April 2019).
  41. Zuquette, L.V.; Pejon, O.J.; Collares, J.Q.S. Engineering geological mapping developed in the Fortaleza Metropolitan Region, State of Ceara, Brazil. Eng. Geol. 2004, 71, 227–253. [Google Scholar] [CrossRef]
  42. Zuquette, L.V. Mapeamento Geotécnico Preliminar na Região de São Carlos. Master’s Thesis, University of São Paulo, São Carlos-Brazil, Brazil, 1981. [Google Scholar]
  43. ABNT. NBR 6508: Solo, Determinação da Massa Específica Aparente; ABNT: Rio de Janeiro, Brazil, 1984; p. 8. [Google Scholar]
  44. ABNT. NBR 6502: Rochas e Solos—Análise Granulométrica Conjunta; ABNT: Rio de Janeiro, Brazil, 1995; p. 18. [Google Scholar]
  45. IBGE. Manual Técnico de Pedologia, 2nd ed.; IBGE: Rio de Janeiro, Brazil, 2007; ISBN 978-85-240-3722-9.
  46. Tukey, J.W. The Problem of Multiple Comparisons. In The Collected Works of John W. Tukey VIII; Multiple Comparisons: 1948–1983 1–300; Chapman and Hall: New York, NY, USA, 1953. [Google Scholar]
  47. Kruskal, W.H.; Wallis, W.A. Use of Ranks in One-Criterion Variance Analysis. J. Am. Stat. Assoc. 1952, 47, 583–621. [Google Scholar] [CrossRef]
  48. Brinson, M.M. A Hydrogeomorphic Classification for Wetlands; Wetlands Research Program Tech. Rep. WRP-DE-4; U.S. Army Engineer Waterways Expt. Station: Vicksburg, MS, USA, 1993.
  49. Mitsch, W.M.; Gosselink, J.G. Wetlands, 4th ed.; John Wiley and Sons, Inc.: Somerset, NJ, USA, 2007; p. 582. [Google Scholar]
  50. Smith, D.R.; Ammann, A.; Bartoldus, C.; Brinson, M.M. An Approach for Assessing Wetland Functions Using Hydrogeomorphic Classification, Reference Wetlands, and Functional Indices; Wetlands Research Program Technical Report WRP-DE-9; US Army Corps of Engineers, Waterways Experiment Station: Vicksburg, MS, USA, 1995.
  51. Sutter, L.A.; Stanfill, J.B.; Haupt, D.M.; Bruce, C.; Wuenscher, J.E. North Carolina Coastal Region Evaluation of Wetland Significance. A Report of the Strategic Plan for Improving Coastal Management in North Carolina; Department of Environment and Natural Resources, North Carolina Division of Coastal Management: Morehead City, NC, USA, 1999.
  52. USDA. Textural Classification Soil Survey Staff. Soil Taxonomy: A Basic System of Soil Classification for Making and Interpreting Soil Surveys; Soil Conservation Service, U.S. Department of Agriculture Handbook 436; USDA: Washington, DC, USA, 1975.
  53. Winter, T.C.; Rosenberry, D.O. The interaction of ground water with prairie pothole wetlands in the Cottonwood Lake Area, east-central North Dakota, 1979–1990. Wetlands 1995, 15, 193–211. [Google Scholar] [CrossRef]
  54. Sharratt, B. Groundwater recharge during spring thaw in the Prairie Pothole Region of North America. Int. J. Water 2009, 5. [Google Scholar] [CrossRef]
  55. Gurdak, J.J.; Roe, C.D. Review: Recharge rates and chemistry beneath playas of the High Plains aquifer, USA. Hydrogeol. J. 2010, 18, 1747–1772. [Google Scholar] [CrossRef]
  56. Failache, M.; Zuquette, L. Geological and geotechnical land zoning for potential Hortonian overland flow in a basin in southern Brazil. Eng. Geol. 2018, 246, 107–122. [Google Scholar] [CrossRef]
  57. Van der Kamp, G.; Hayashi, M. Groundwater-wetland ecosystem interaction in the semiarid glaciated plains of North America. Hydrogeol. J. 2009, 17, 203–214. [Google Scholar] [CrossRef]
  58. Zuquette, L.; Palma, J.; Pejon, O. Initial Assessment of the Infiltration and overland flow for different rainfall events in land constituted of sandstones of the Botucatu Formation (Guarani Aquifer), State of São Paulo, Brazil. Environ. Geol. 2006, 50, 371–387. [Google Scholar] [CrossRef]
  59. Ramberg, L.; Wolski, P.; Krah, M. Water balance and infiltration in a seasonal floodplain in the Okavango Delta, Botswana. Wetlands 2006, 26, 677–690. [Google Scholar] [CrossRef]
  60. Freitas, J.G.; Furquim, S.A.C.; Aravena, R.; Cardoso, E.L. Interaction between lakes’ surface water and groundwater in the Pantanal wetland, Brazil. Environ. Earth Sci. 2019, 78, 139. [Google Scholar] [CrossRef]
  61. Fetter, C.W. Applied Hydrogeology, 4th ed.; Prentice-Hall, Inc.: Upper Saddle River, NJ, USA, 2001; p. 598. [Google Scholar]
  62. Assine, M.L.; Merino, E.R.; Pupim, F.N.; Warren, L.V.; Guerreiro, R.L.; McGlue, M.M. Geology and Geomorphology of the Pantanal Basin; Bergier, I., Assine, M., Eds.; Dynamics of the Pantanal Wetland in South American, Springer International Publisher: Berlin/Heidelberg, Germany, 2016. [Google Scholar]
  63. LaBaugh, J.W.; Winter, T.C.; Rosenberry, D.O. Hydrologic functions of prairie wetlands. Great Plains Res. 1998, 8, 17–37. [Google Scholar]
  64. Van der Kamp, G.; Hayashi, M. The groundwater recharge function of small wetlands in the semi-arid Northern Prairies. Great Plains Res. 1998, 8, 39–56. [Google Scholar]
  65. Christofoletti, C.A.; Escher, J.P.; Correia, J.E.; Marinho, J.F.U.; Fontanetti, C.S. Sugarcane vinasse: Environmental implications of its use. Waste Manag. 2013, 33, 2752–2761. [Google Scholar] [CrossRef]
  66. Jiang, Z.-P.; Li, Y.-R.; Wei, G.-P.; Liao, Q.; Su, T.-M.; Meng, Y.-C.; Zhang, H.; Lu, C. Effect of long-term vinasse application on physico-chemical properties of sugarcane field soils. Sugar Technol. 2012, 14, 412–417. [Google Scholar] [CrossRef]
  67. Silva, M.; Griebeler, N.; Borges, L. Uso de vinhaça e impactos nas propriedades do solo e lençol freático. Revista Brasileira de Engenharia Agrícola e Ambiental 2007, 11, 108–114. [Google Scholar] [CrossRef]
  68. Ehsanzadeh, E.; van der Kamp, G.; Spence, C. On the changes in long-term streamflow regimes in the north American prairies. Hydrol. Sci. J. 2016, 61, 64–78. [Google Scholar] [CrossRef]
  69. Huang, S.; Young, C.; Feng, M.; Heidemann, K.; Cushing, M.; Mushet, D.M.; Liu, S. Demonstration of a conceptual model for using LiDAR to improve the estimation of floodwater mitigation potential of Prairie Pothole Region wetlands. J. Hydrol. 2011, 405, 417–426. [Google Scholar] [CrossRef] [Green Version]
  70. Shuldiner, P.; Cope, F. Ecological effects of highway fills on wetlands: Examples from the field. Transp. Res. Board 1979, 736, 29–37. [Google Scholar]
  71. Reinelt, L.; Horner, R. Pollutant removal from stormwater runoff by palustrine wetlands based on a comprehensive budget. Ecol. Eng. 1995, 4, 77–97. [Google Scholar] [CrossRef]
  72. Azous, A.L. An Analysis of Urbanization Effects on Wetland Biological Communities. Master’s Thesis, Department of Civil Engineering, University of Washington, Seattle, WA, USA, 1991. [Google Scholar]
  73. US Environmental Protection Agency. Natural Wetlands and Urban Stormwater: Potential Impacts and Management, 843-R-001; Office of Water, US Environmental Protection Agency: Washington, DC, USA, 1993.
  74. Skagen, S.K.; Burris, L.E.; Granfors, D.A. Sediment Accumulation in Prairie Wetlands under a Changing Climate: The Relative Roles of Landscape and Precipitation. Wetlands 2016, 36, 383–395. [Google Scholar] [CrossRef] [Green Version]
  75. Chmielewski, R.M. Hydrologic Analysis of Carolina Bay Wetlands at the Savannah River Site, South Carolina. Master’s Thesis, University of Wisconsin-Milwaukee, Milwaukee, WI, USA, 1996. [Google Scholar]
  76. Kirkman, L.K.; Goebel, P.C.; West, L.; Drew, M.; Palik, B. Depressional wetland vegetation types: A question of plant community development. Wetlands 2000, 20, 373–385. [Google Scholar] [CrossRef]
Figure 1. Location of the study region, wetlands, and main drainage channels.
Geosciences 10 00296 g001
Figure 2. Mean rainfall/month (a) and number of days with rain/month (b) for the last 20 years and (c) annual rainfall from a 68-year series (1950–2018) in the study region.
Geosciences 10 00296 g002
Figure 3. Flowchart of the main steps involved in the study.
Geosciences 10 00296 g003
Figure 4. Basic conceptual model of the environmental components of a depressional wetland.
Geosciences 10 00296 g004
Figure 5. Spatial distribution of wetlands: (a) wetland distribution associated with the drainage channel network, elevation curves, digital terrain model, and the corresponding catchment area; (b) data regarding the ratio between the extents of a wetland and its catchment area; (c) map of unconsolidated materials and wetlands associated with the contribution zones. Legend: R.U.M.: residual unconsolidated material; T.U.M.: transported unconsolidated material.
Geosciences 10 00296 g005
Figure 6. Wetlands and geological materials: (a) typical cross section of wetlands associated with diabase and residual unconsolidated material; (b) typical cross section of wetlands associated with transported unconsolidated material composed of clay colluvium overlying the diabase; (c) typical cross section of wetlands associated with residual unconsolidated materials from the Corumbataí, Irati, and Tatuí Formations; (d) typical cross section of wetlands associated with transported unconsolidated material consisting of sandy colluvium deposited on the residual materials; (e) typical cross section wetlands associated with unconsolidated materials in alluvial deposits.
Geosciences 10 00296 g006
Figure 7. Water variations in the wetlands during different seasons: (a) August 2004—dry period; (b) July 2011—dry period; (c) May 2016—final rainy period; (d) February 2017—rainy period.
Geosciences 10 00296 g007
Figure 8. Example of in situ monitoring of hydrological conditions: (a) before the rainy season; (b) after the rainy season.
Geosciences 10 00296 g008
Figure 9. (a) Functional scheme of wetlands located in topographical depressions in high and plain positions of the terrain; (b) functional scheme of wetlands on topographical depressions in lowlands near or in the floodplains of the Mogi-Guaçú and Roque Rivers; (c) example of diffuse spring; (d) example of point spring.
Geosciences 10 00296 g009
Figure 10. Land use maps for (a) March 1991 and (b) March 2019, and (c) is the total area of each land use in both years.
Geosciences 10 00296 g010
Figure 11. Evidence and examples of anthropogenic interferences: (a) wetland that was excavated to extract water for agriculture; (b) artificial drainage channel (ditches); (c) terraces in the catchment area; (d) detail of Figure 11c showing water storage due to terraces in the catchment area; (e) effect of road construction on stored water of Wetland 29 (06/2019); (f) photograph showing details of the road construction effect, in which one side displayed more water than the other; (g,h) changes in Wetland 104 caused by urbanization in July 2010 and June 2017.
Geosciences 10 00296 g011
Figure 12. Examples of environmental changes: (a) set of wetlands highlighting Wetland 58—October 2013; (b) Wetland 58—June 2017; (c) detail of Wetland 58, (d) wetland that was totally modified by agricultural activities, had been ditched, and presented evidence of erosion.
Geosciences 10 00296 g012
Figure 13. Main anthropogenic interferences, environmental changes, and affected functions of wetlands and catchment areas.
Geosciences 10 00296 g013
Table 1. Collected data on environmental components and the corresponding product, source, and spatial scale.
Environmental ComponentsProductSourceScale or Resolution
Relief and drainage channelsTopographic map[35]1:50,000
Lithologies unitsBedrock map[32]1:50,000
Unconsolidated material unitsMap unconsolidated materials[32]1:50,000
Landform unitLandform map[32]1:50,000
Geotechnical characterization of unconsolidated material unitsBasic characterization of unconsolidated materials[32]
[36]
-
Annual, monthly and daily rainfall and rainfall eventsRainfall records[37]0.5 mm
Wetlands; Land use typesSatellite images[38]30 m
[39]10–30 m
WetlandsAerial photos[40]1:35,000
Table 2. Parameters and respective assumptions considered to analyze the significance of wetland functions.
FunctionFunctionParameterExplanation
Water qualityNonpoint source pollution removalProximity to sourcesMore of the perimeter of the wetland surrounded by agricultural and urban land uses, the higher the probability that polluted runoff entering the wetland
Proximity to water bodyIf there are water bodies near to wetland, smaller will be the probability that polluted runoff entering the wetland because it can enter directly in surface water.
Wetland soil characteristicFiner the texture and the higher the organic matter content of the soil, the higher its cation exchange capacity is and the more effective it is in retaining and transforming nutrients.
HydrologySurface runoff StorageWatershed positionThe further upstream in a watershed, the greater is the impact of water storage on overall watershed hydrology.
Wetland sizeThe larger wetland size, greater will be the water storage.
Catchment areaThe larger catchment area, greater will be the probability to generate higher volumes of runoff
Saturated hydraulic conductivityThe hydraulic conductivity determines the amount of water that soil can receive and store, and be available as surface runoff.
Groundwater discharge and rechargeSaturated hydraulic conductivityThe hydraulic conductivity determines the amount of infiltrated water. Higher hydraulic conductivity greater will be the groundwater recharge potential in catchment area, which will rise groundwater level increasing the possibility to groundwater discharge in wetland.
Catchment areaThe larger catchment area, greater will be the volume of infiltration and potential local groundwater recharge that increase the possibility of higher groundwater discharge volumes in wetland.
occurrence of throughflow Identification of occurrence of throughflow that moves nearly parallel to the soil surface until a certain point that returns to the surface becoming or not overland flow, thus reducing the volume of groundwater recharge.
Wetland areaGreater the wetland area, greater will be the groundwater recharge in wetland.
Table 3. Basic geotechnical characteristics of the unconsolidated materials in the study region.
Unconsolidated MaterialArea
(km2)
Texture aThickness
(m)
Soil Total PorosityHydraulic Conductivity (cm/s)
R.U.M. from Diabases107.2Clay to Sandy clay<100.45–0.6210−4–10−5
R.U.M. from Eolian sandstones16.7Sand to Loamy Sandy<20.41–0.48>10−3–10−4
R.U.M. from fluvial sandstones39.5Sandy loam to Sandy clay loam<50.4110−3–10−4
R.U.M. of siltstones and claystones173.3Clay<50.35–0.4810−4–10−6
R.U.M. siltstones and shale32.4Clay to Sandy clay<50.50–0.5410−4–10−6
R.U.M. from sandy siltstones28.4Sandy clay loam<50.4010−4–10−5
T.U.M. sandy colluvium162.7Loamy sand to Sandy loam<100.37–0.4410−2–10−3
T.U.M. clay colluvium47.2Clay<50.50<10−4–10−6
T.U.M. sandy alluvium96.8Sandy loam<20.37–0.4710−3–10−6
Hydromorphic soil
(Melanic Gleysol)
9.0Sandy clay loam to Clay<20.45–0.6010−6
Legend: R.U.M.: Residual unconsolidated material; T.U.M.: Transported unconsolidated material. a Soil texture was classified based on [52].
Table 4. Hydrological conditions of monitored wetlands before and after a rainy period.
Hydrological ConditionDry SeasonRainy Season
Water storage in man-made drainage channels and excavation holes that water level is below wetland surface56
Ponded water in wetlands118
Soil saturation evidences.2-
Dry conditions178
Increase of ponded water depth*9
Water storage increase in man-made drainage channels and excavated and augering holes*4
Legend * This hydrologic condition only occurs after the rainy period because it is associated with an increase in water depth due to rainfall events.

