Article

Wheel Load and Wheel Pass Frequency as Indicators for Soil Compaction Risk: A Four-Year Analysis of Traffic Intensity at Field Scale

1
Department of Geography, Christian-Albrechts-University, Ludewig-Meyn-Straße 14, 24118 Kiel, Germany
2
Institute of Agricultural Technology, Johann Heinrich von Thünen Institute, Bundesallee 47, 38116 Braunschweig, Germany
*
Author to whom correspondence should be addressed.
Geosciences 2020, 10(8), 292; https://doi.org/10.3390/geosciences10080292
Submission received: 7 July 2020 / Revised: 21 July 2020 / Accepted: 31 July 2020 / Published: 31 July 2020
(This article belongs to the Special Issue Soil Degradation: Salinization, Compaction, and Erosion)

Abstract

:
Avoiding soil compaction is one of the objectives to ensure sustainable agriculture. Subsoil compaction in particular can be irreversible. Frequent passages by (increasingly heavy) agricultural machinery are one trigger for compaction. The aim of this work is to map and analyze the extent of traffic intensity over four years. The analysis is made for complete seasons and individual operations. The traffic intensity is distinguished into areas with more than five wheel passes, more than 5 Mg and 3 Mg wheel load. From 2014 to 2018, 63 work processes on a field were recorded and the wheel load and wheel passes were modeled spatially with FiTraM. Between 82% (winter wheat) and 100% (sugar beet) of the total infield area is trafficked during a season. The sugar beet season has the highest intensities. High intensities of more than five wheel passes and more than 5 Mg wheel load occur mainly during harvests in the headland. At wheel load ≥3 Mg, soil tillage also stresses the headland. In summary, no work process stays below one of the upper thresholds set. Based on the results, the importance of a soil-conserving management becomes obvious in order to secure the soil for agriculture in a sustainable way.

1. Introduction

In current challenges of restructuring towards a sustainable society, agriculture plays a major role in terms of soil conservation, resource management, emission control, biodiversity and more. Recent strategies towards a more sustainable intensification of agriculture seek to reduce the avoidable negative effects of field traffic on the various soil functions. Today’s agriculture employs highly efficient machinery, which enable fast and labor-saving field operations. This machinery, however, has become bigger and heavier over time [1], resulting in increased soil compaction risk during field traffic. According to the FAO and ITPS [2], soil compaction is one of the main threats to the soil.
As a common definition, soil compaction occurs when the soil stress exceeds the soil strength [3]. Generally, soil strength depends on soil properties like soil texture, organic carbon, bulk density and water content [3], while soil stress depends on wheel load, inflation pressure, wheel size and wheel passes [4,5,6]. Soil compaction can be differentiated in topsoil and subsoil compaction. While topsoil compaction may be lowered by soil tillage, subsoil compaction can last up to several decades or even be time persistent depending on soil conditions [7,8,9,10].
Studies confirm that the wheel load in particular has a strong influence on compaction in the subsoil, while the tire inflation pressure and contact area pressure tends to affect the topsoil [5,11,12]. In addition, the frequency of wheel passes influences the stress transfer into the subsoil, where multiple crossing at lower wheel load may result in higher subsoil compaction than one path by a heavy wheel load [12,13,14,15,16,17].
Consistent upper values for wheel load or wheel passes to mitigate (harmful) soil compaction are missing. Only few studies as for example Becerra et al. [13] and Botta et al. [12] conclude that from the fifth wheel pass the applied stress affects the subsoil. With regard to wheel load, some studies report that an upper value of approximately 3 Mg for humid soil will affect the subsoil [18,19] and others assume approximately 5 Mg [13,20].
Consequently, both the frequency of wheel passes and wheel load can be used to define traffic intensity, indicating the exposure of the soil surface to machinery-induced stress inputs. Uniform procedures for the assessment of field traffic intensity are still missing. Moreover, methods that consider the spatio-temporal variation of traffic intensity are lacking. However, these are important to be able to estimate the risk of soil compaction more accurately. So far, only a few studies have recorded the spatial distribution of traffic intensity in practice [21,22,23,24]. In most cases, it is only the distance traveled multiplied with the tire footprint in relation to the area of the field [21,22,25]. Summarizing their results Kroulík et al. [21] showed that about 95.3% of the field area is passed during one season with grain under conventional tillage. Conservative and no-tillage management affected less area (55.7 and 72.8%). The trafficked area could also be reduced by controlled traffic farming [22]. Håkansson [25] used a different method to determine the area crossed by vehicles and showed that seasons with root crops or potatoes and ley for silage have the highest intensities with about 400–800% (roots, potatoes) and 600–1000% (ley) of the field area trafficked respectively.
Duttmann et al. [23,24] recorded the GPS positions of all vehicles during silage maize harvest and added the information of wheel load to their analysis. However, the analysis did not include further work processes like sowing and soil tillage. Likewise, they did not take into account the dynamic changes in load and wheel passes as a result of reversing, lifting and lowering of implements or crab walk. To close these gaps, Augustin et al. [26] have developed the “Field Traffic Model” (FiTraM). FiTraM automatically models the exact tracks of each tire by point positioning data and derives spatially wheel loads, wheel pass frequencies and vertical stress inputs or contact area pressure. However, the analyses of field traffic intensities of diverse field traffic activities like tillage, sowing and harvest for different crops for entire fields has not yet been investigated.
Resulting from this, the aim of this study is (i) to represent the field traffic intensity with which the soil is stressed for three different crops during one complete crop rotation and (ii) to analyze the extent and spatial location at which work processes exceed certain maximum values of traffic intensity. To this end, an agricultural farm with a soil conservation orientation and crop rotation with winter wheat, silage maize and sugar beet was monitored. Sixty-three work processes were gathered and modeled with FiTraM over four years to map and analyze the traffic intensities in practice.
These analyses enable a spatially explicit assessment of the intensity of traffic and thus the evaluation of soil compaction risk. The results of the study could contribute to the development of spatially specific soil management strategies and recommendations for practical applications.

2. Methods and Materials
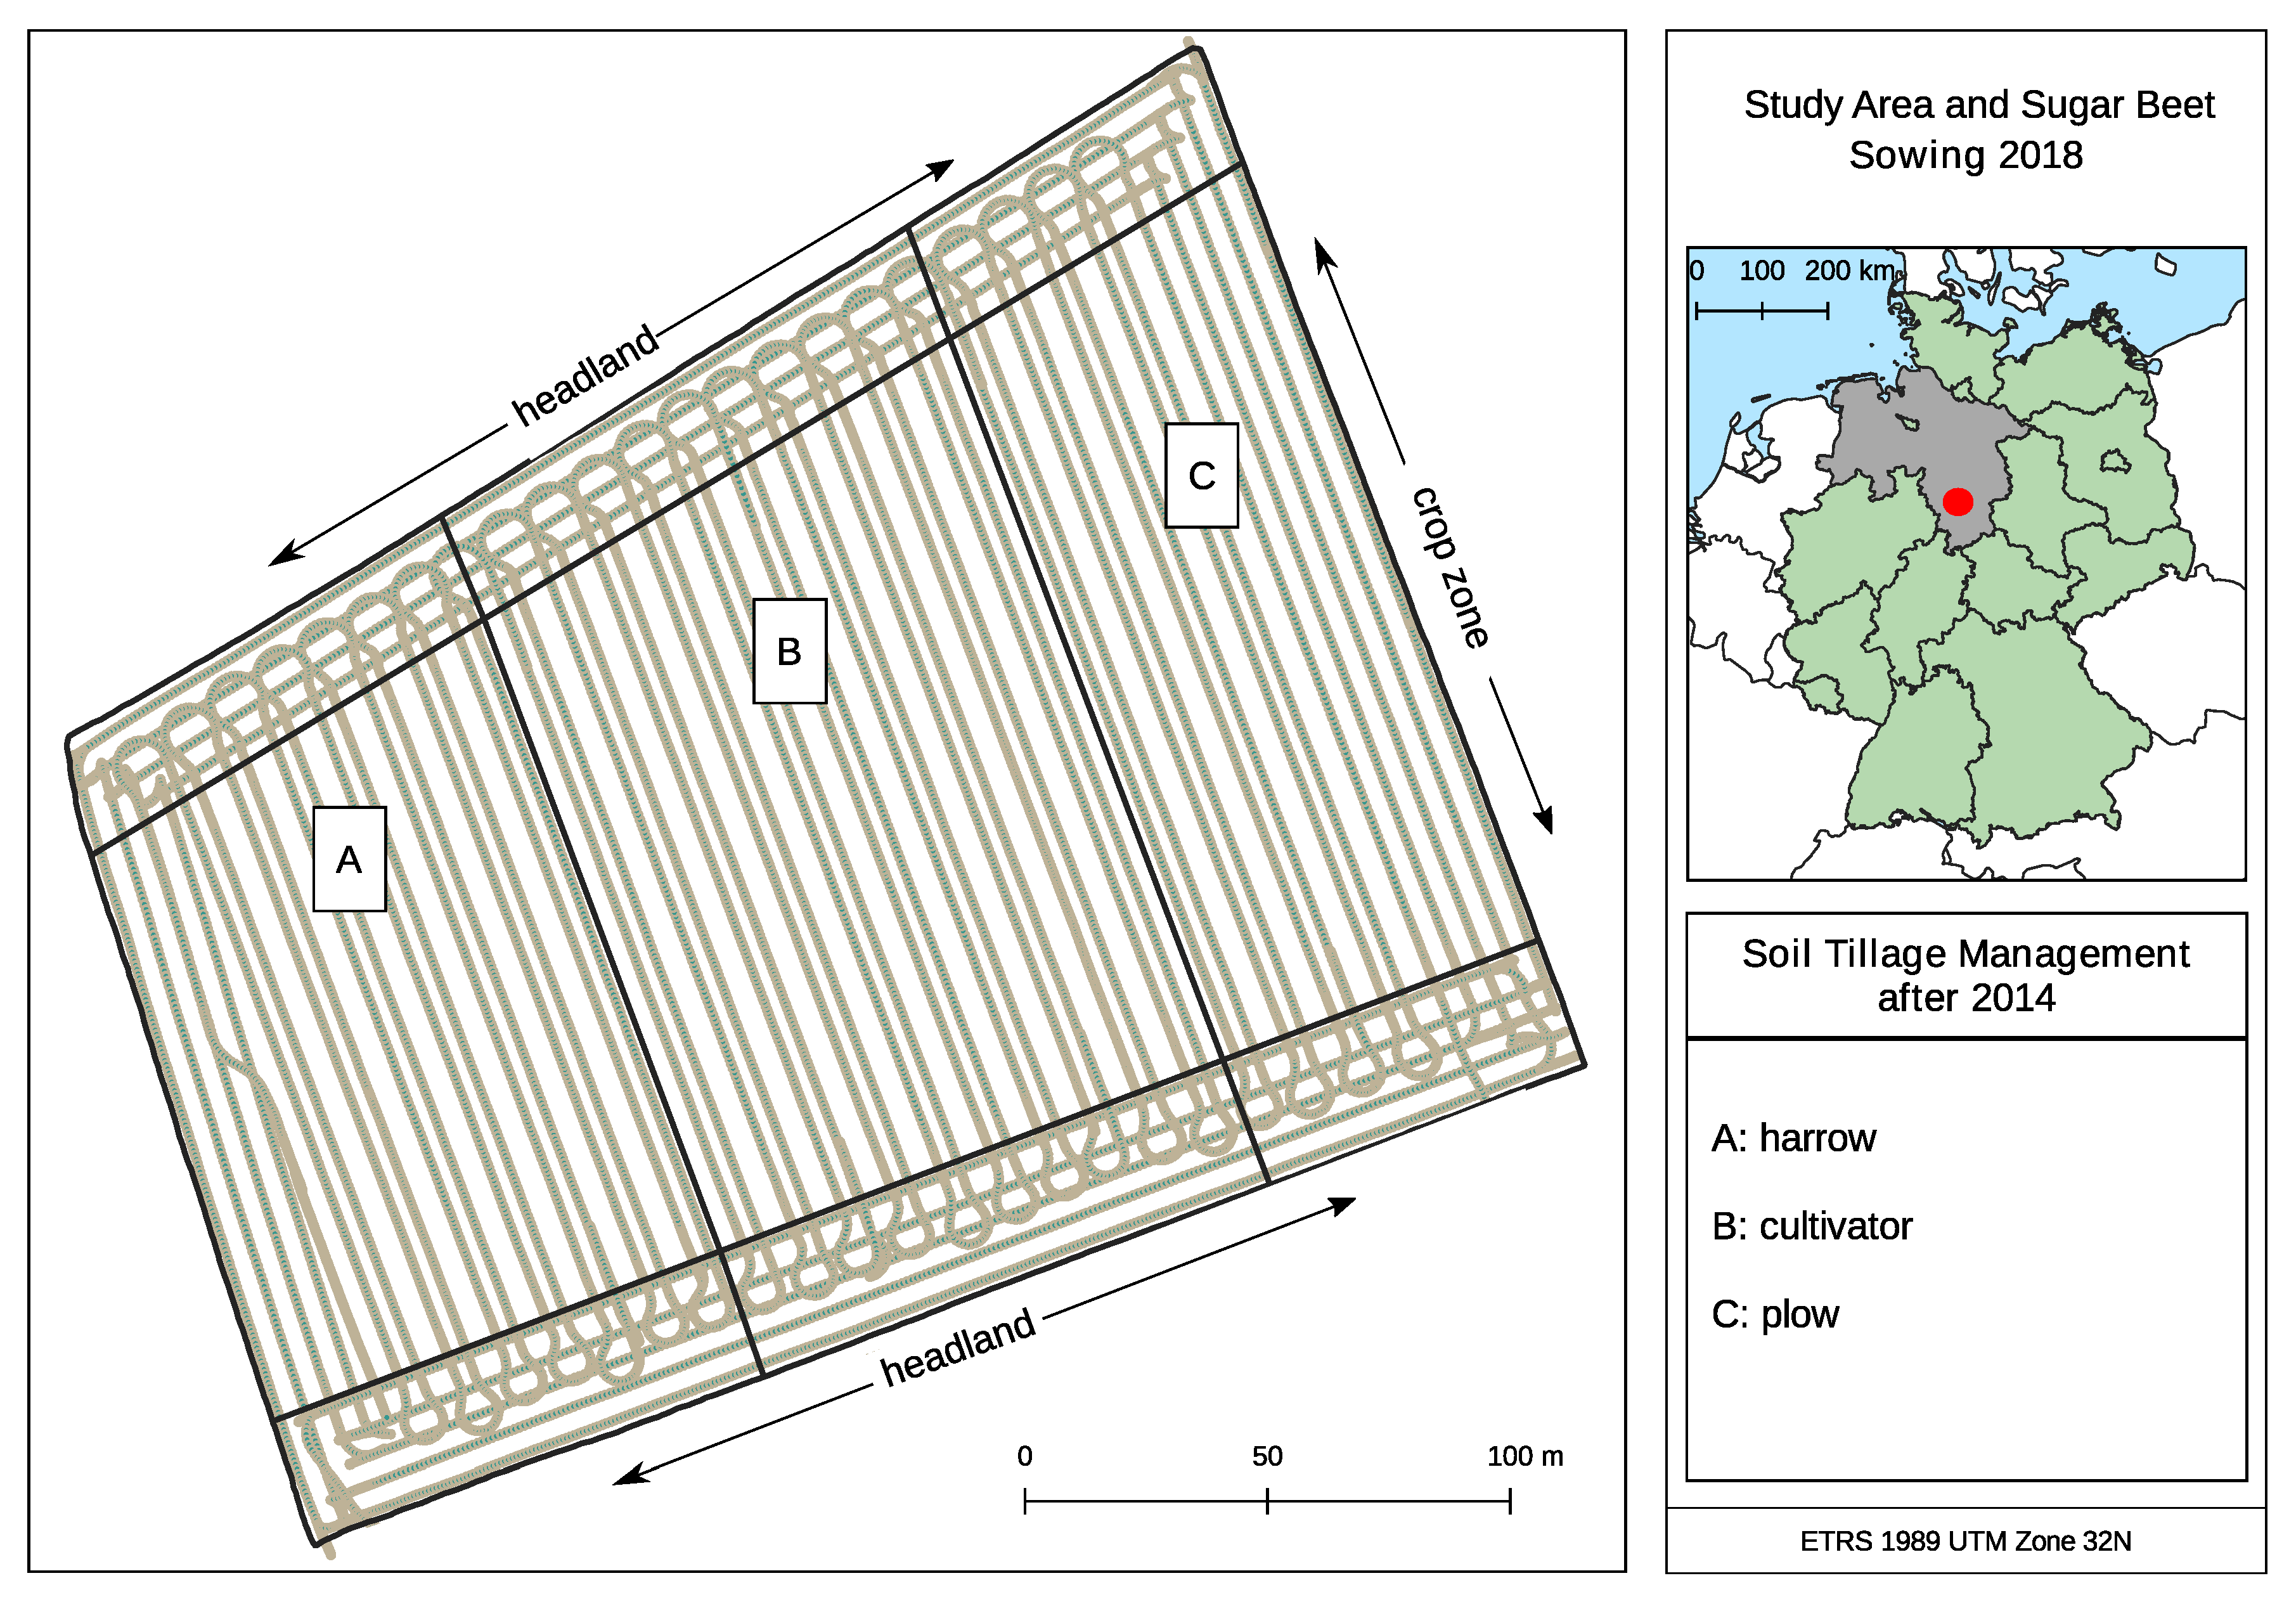
2.1. Study Area

The study area has a size of 5.45 ha and is located south from Hildesheim in Lower Saxony, Germany. The region is characterized by intensive agriculture and by a moderately hilly terrain. It has very fertile soils as a result of the periglacial loess deposits. While the region is hilly, the study field itself shows only a slight slope to the northeast. The soil type of the field is Luvisol [27]. For research purposes, the surveyed field was divided into three areas with different kind of tillage practices after a complete plowing in 2014: Plow (eastern part), cultivator (middle) and disc harrow (western part) (Figure 1). The headland width is 27 m—adapted to the working width of the sprayer used—and located in the southern and northern sides of the field. The crop zone refers to the part of the field where usually no turning maneuver is performed. The farmer cultivates the fields in a soil-conserving and protecting manner. This implies that soil erosion and soil compaction shall be prevented by adapted soil management. The crop rotation is winter wheat (WW), silage maize (M), winter wheat and sugar beet (SB). No catch crops are cultivated. Instead, the soil is mulched with organic material from the previous crop.

2.2. Recording of Field Traffic

Over a period of four years—a complete crop rotation of the farm (2014–2018)—all field traffic activities were recorded with a GPS with real time kinematic (RTK) function. Three main systems were used: (i) The Trimble system installed on the tractor (New Holland T7.270 see Supplementary Materials Table S1) and (ii) the external GPS instruments Leica Viva CS10 and Trimble R10 and (iii) the unknown internal GPS systems of sugar beet and maize harvesters.
In total, 63 work processes were surveyed and 37 recorded by GPS. The semi-permanent tracks for spraying and fertilizing were only recorded once in a year and used for the route of any further spraying- and fertilizer work process. This explains the reduced amount of recorded processes by GPS compared to the surveyed ones.
Individual work processes were sometimes completed over several days or at different times of the day. Table 1 summarizes all the different work processes for the respective crops and years. The corresponding machines can be found in the Supplementary Materials (Table S1).
Some special features of certain work processes should be briefly mentioned here again. Firstly, spraying and fertilizing are conducted in semi-permanent tracks, which are used several times during the cropping season. Secondly, the sowing of winter wheat in 2014 was not recorded with a GPS. Shortly after sowing, the route was manually recorded and digitized by an employee. This reduces the spatial accuracy of the tracks for this working process. Thirdly, the GPS devices occasionally stopped recording. Smaller dropouts and correspondingly smaller gaps were not further processed. Larger gaps or data gaps in areas of curves that could lead to semantic misinterpretations of the application were added and marked in the data set (Supplementary Materials Figure S1). Recording gaps are usually caused by the loss of satellites or RTK reception.

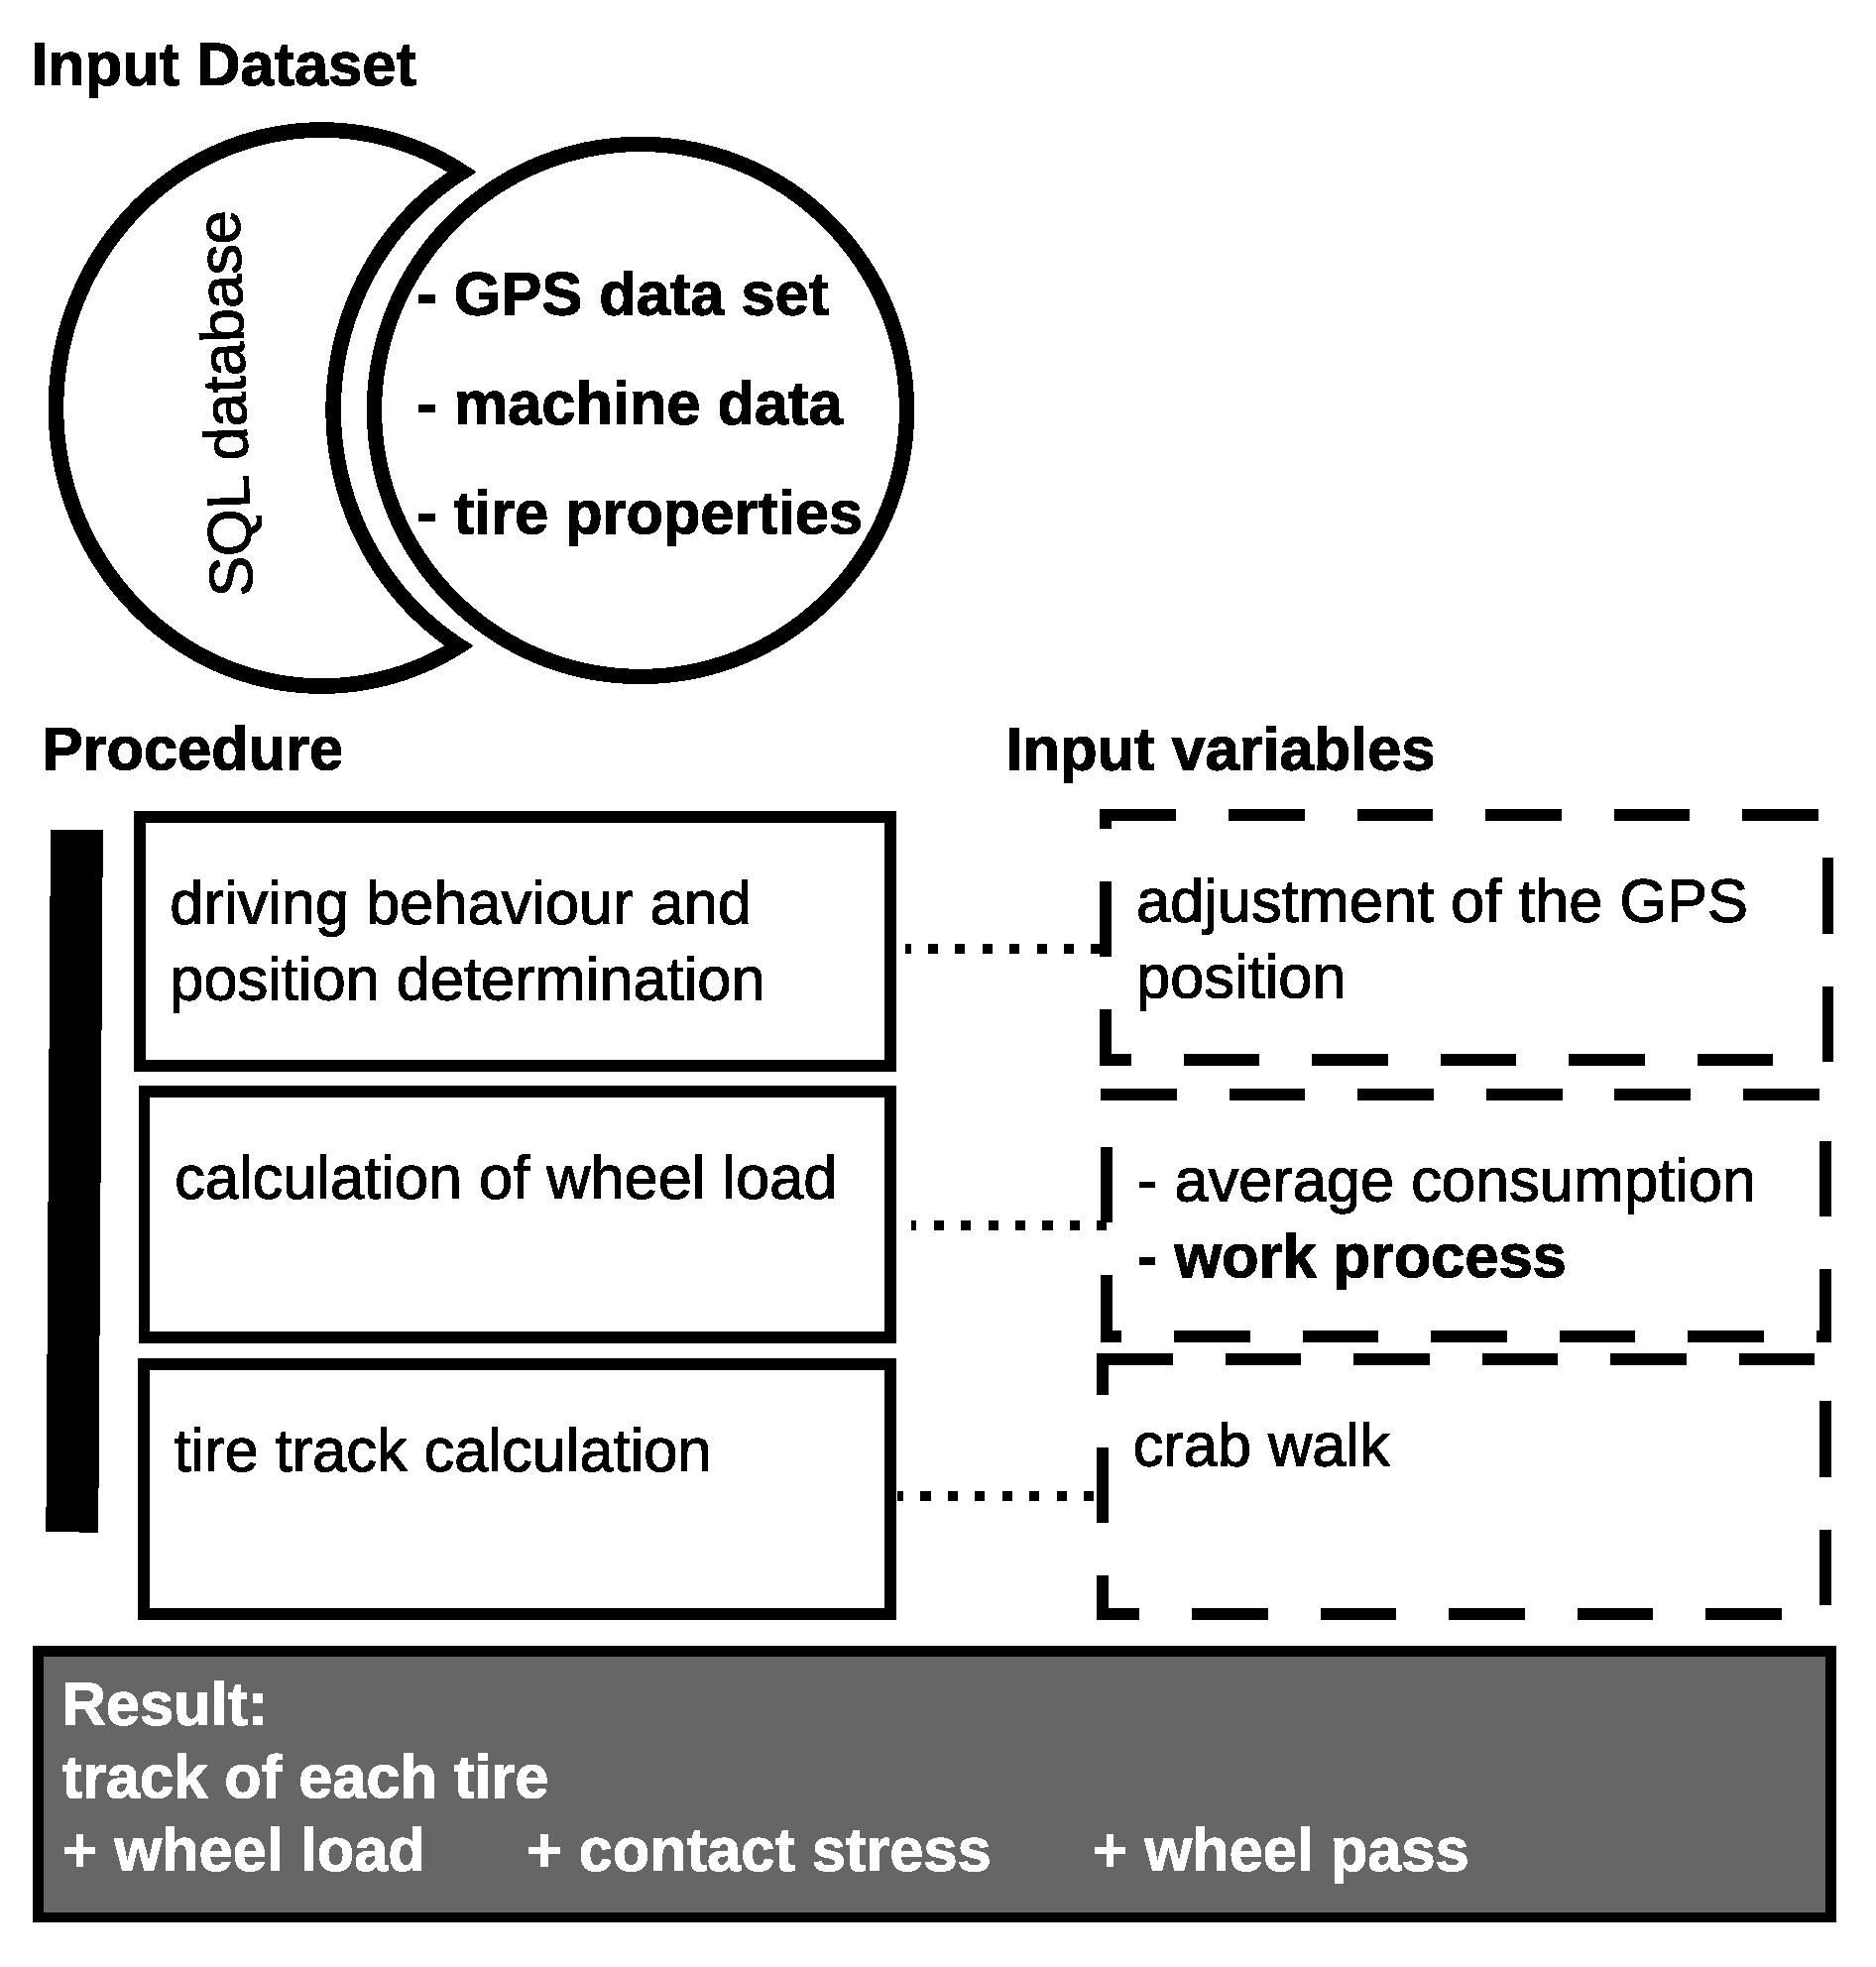
2.3. Modeling of Tracks and Traffic Intensity

The tracks, wheel passes and wheel loads of the 63 work processes were modeled and analyzed using the Field Traffic Model [28]. It models the wheel tracks with wheel load and number of wheel passes spatially explicit from GPS-recorded work processes (Figure 2). In addition to the recorded route, the tire inflation pressures, the average consumption of pesticides, fertilizers and seeds and the crop yield were recorded (Table 1). The relative position of the GPS on the machine was measured (Supplementary Materials Table S2). The dimensions and axle loads of the machines were measured in advance. Machines with a bunker (fertilizer, harvester etc.) were also weighed with a full bunker to calculate the increase and decrease of the wheel loads on the field. During harvesting, sowing and the application of plant protection products, fertilizer, lime and kali the load in the bunker was calculated linearly based on the average yield or consumption, bunker capacity and working width cf. [26].
Partly the same work processes were performed over several dates. This was caused by, for example, the interruption of a working process or—in case of tillage—by using the plow for one part of the field and the cultivator for the other. After modeling, these individual parts of the process were merged to represent the relationship between the field area and the work process.
The number of wheel passes and cumulative wheel loads of the individual work processes were stored as a grid with 1 cm resolution. The work processes were summed up for each cropping season.
To estimate the risk of subsoil compaction for single work processes, areas were extracted where the number of wheel passes per working process were greater or equal to 5 [12,13] and the wheel loads were higher than 5 Mg [13,20] or 3 Mg [18,19]. These analyses were performed with PostgreSQL/PostGIS 10 in conjunction with Python 3.

3. Results and Discussion

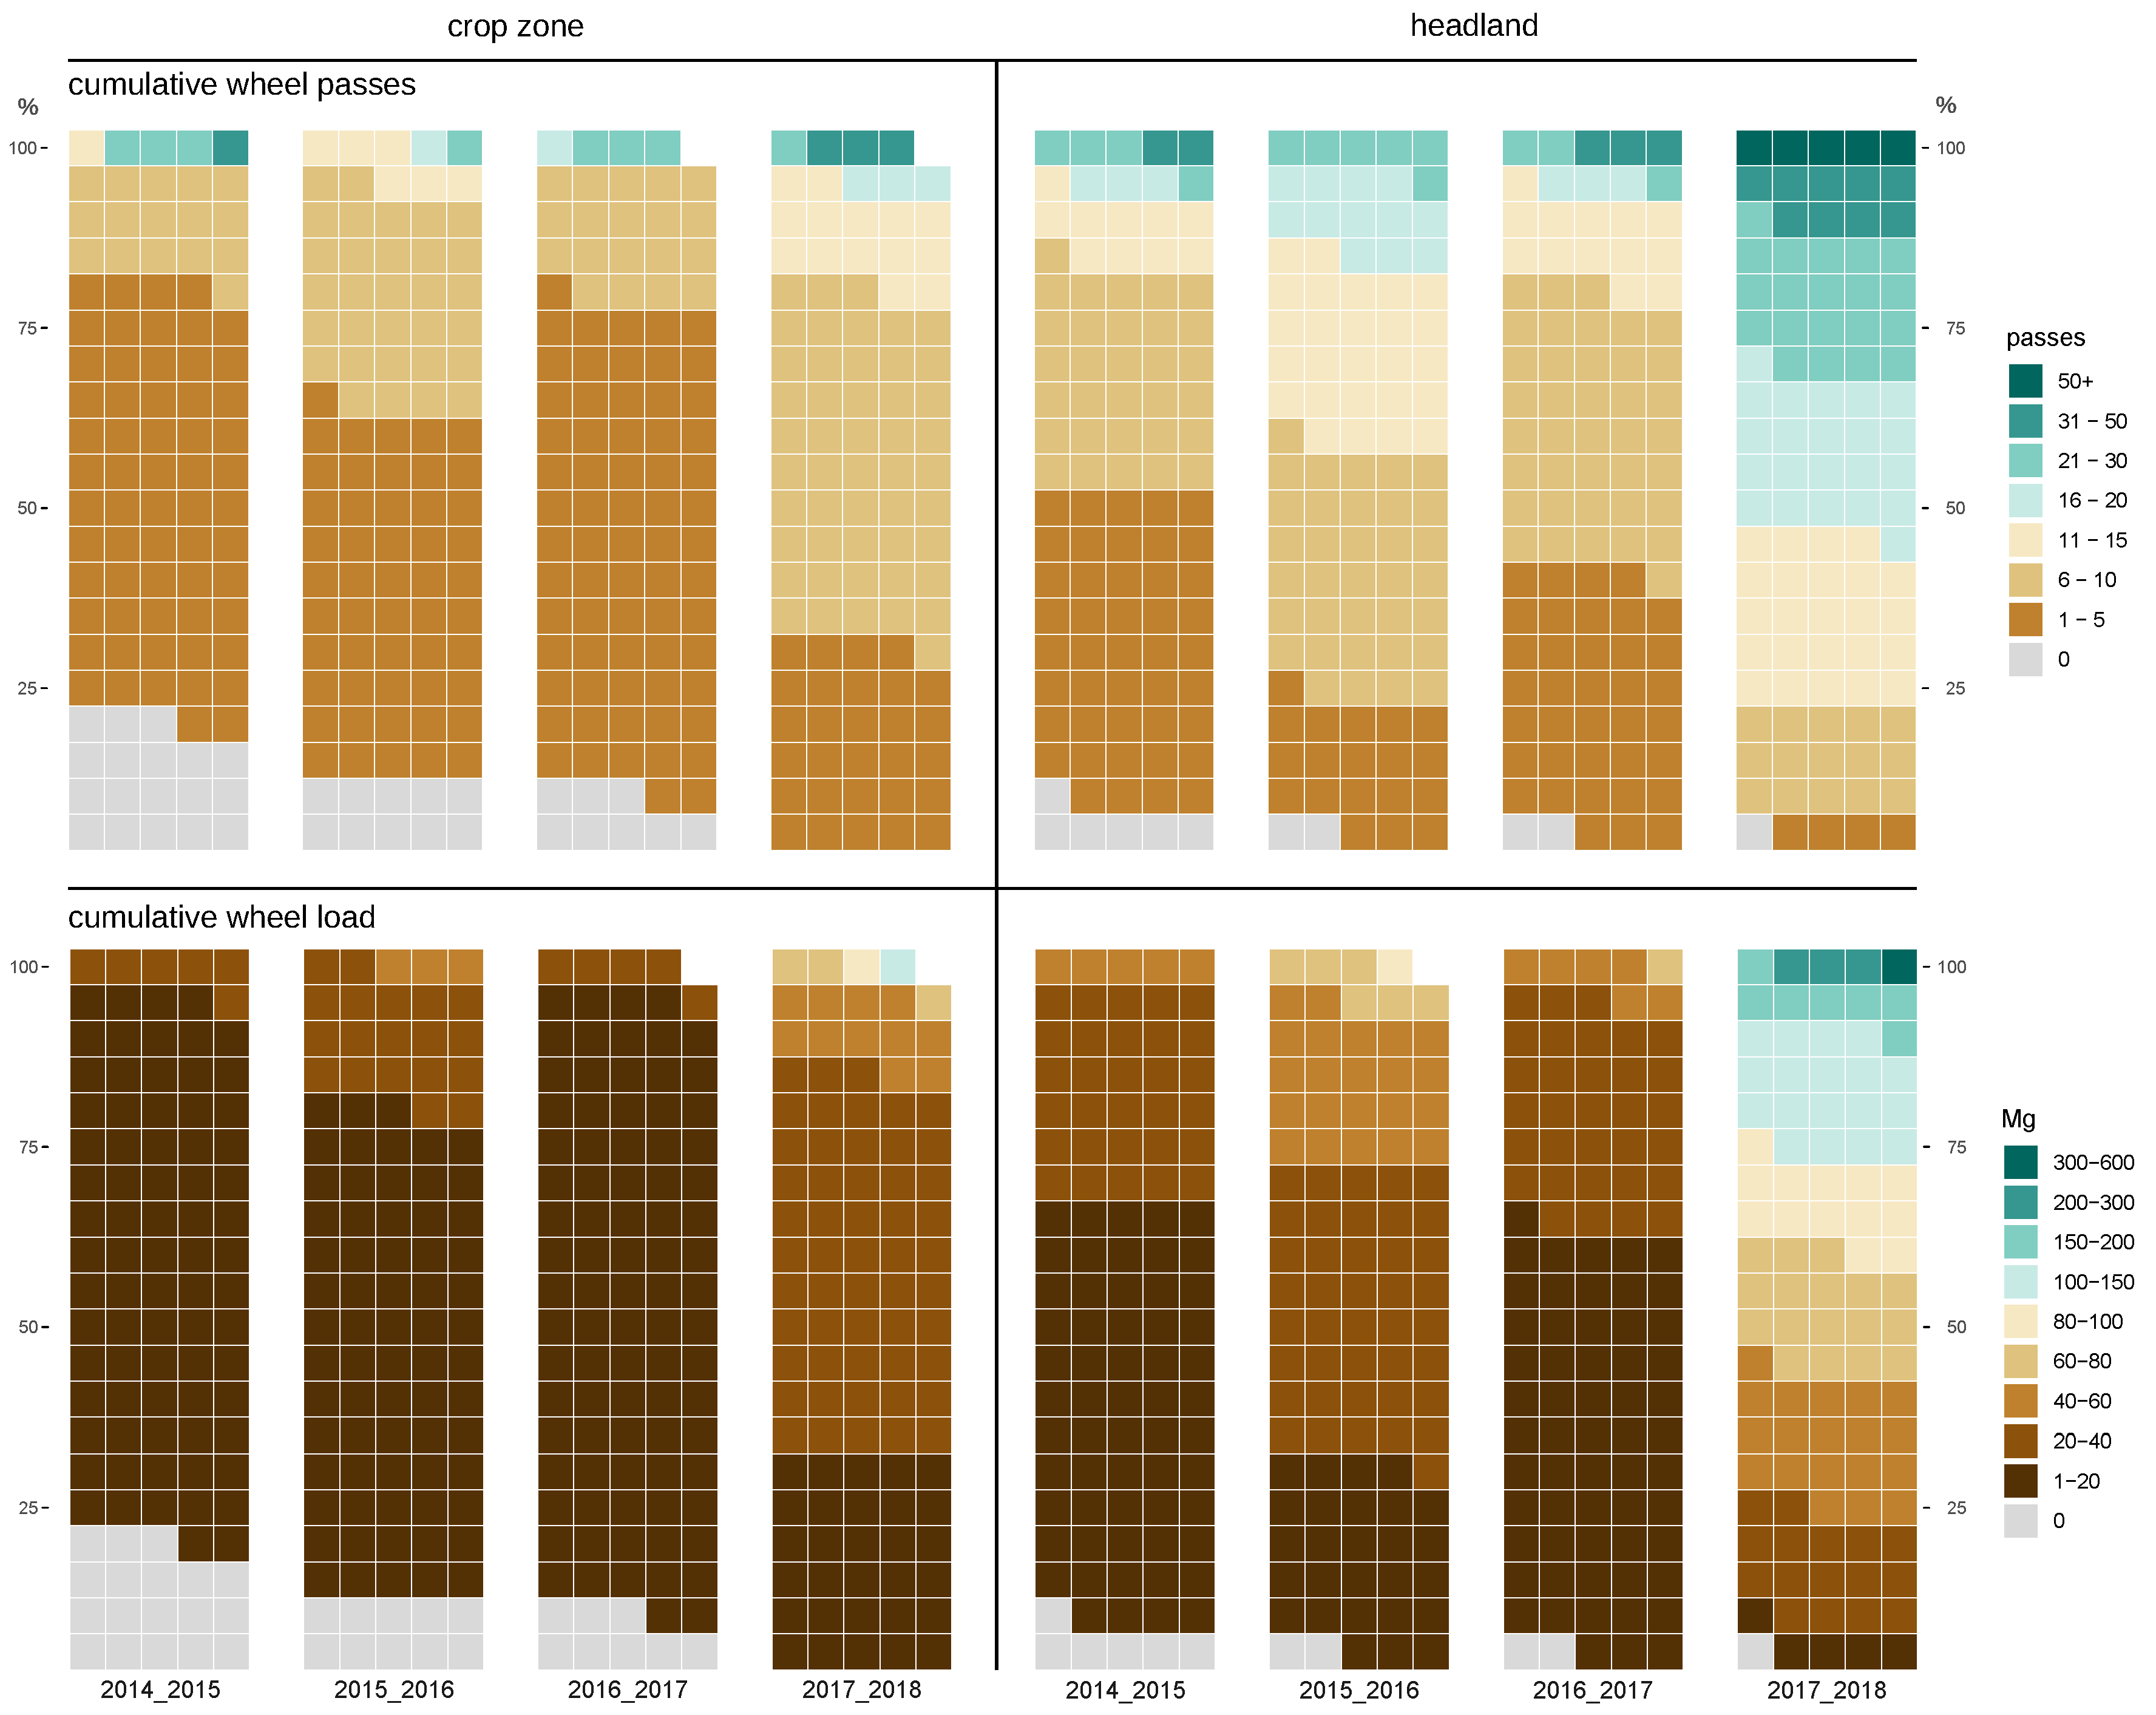
3.1. Analysis of Cumulative Results for Whole Cropping Seasons

With this study, the traffic intensity was quantitatively modeled and analyzed over a period of four years for the first time. The wheel pass frequency and wheel loads were aggregated per growing season: Winter wheat, silage maize, winter wheat and sugar beet. Both, wheel passes and wheel loads, were divided into classes and calculated as a percentage of the field area. For spatial traffic intensity analyses, a distinction is made between crop zone and headland of the field. Figure 3 shows the area proportions for the three crops over the four years. In total, 82% (winter wheat) to 100% (sugar beet) of the crop zone is passed at least once during the individual seasons. In the headland at least 5% more area is trafficked than in the crop zone (except sugar beet).
Compared to winter wheat and silage maize, sugar beets season are characterized by distinctly higher wheel pass frequency and cumulative wheel load, both in the crop zone and in the headland. During sugar beet season, about 30% of the headland area reaches cumulative wheel loads exceeding those observed throughout the winter wheat and silage maize seasons at a factor of 6. Approximately 5% of the area in the headland was passed 50–127 times, while about 1% has been trafficked with summed wheel loads ranging between 300–600 Mg. In the headland, areas with the highest traffic intensities are predominantly located at the beet clamp (Figure 3). In the crop zone, wheel pass frequency and cumulative wheel loads are noticeably lower.
Sugar beet harvest was performed with a self-propelled three-axle bunker harvester. The high bunker load on the one hand and the use of the six wheel vehicle on the other, explain why the highest wheel load (here about 10.1 Mg) and largest number of wheel passes were observed at sugar beet harvest. In addition, unloading of the bunker fill at a clamp contributed another share of traffic intensity within the headland.
The traffic intensity for winter wheat and silage maize are similar in the crop zone. For silage maize, larger area shares are found in the higher classes of the cumulative wheel loads than for winter wheat, although work processes for fertilization and plant protection were less over the season (Table 1). Like with sugar beets, the harvest is the decisive factor for the higher loads during silage maize season. Silage maize was harvested with a chopper chain consisting of a forage harvester and a transport or overloading vehicle. Consequently, the transport vehicle crossed the field several times and more uncontrolled than the forage harvester or combine harvester. While work processes for winter wheat result in a higher maximum amount of wheel passages, the area percentage affected by repeated wheeling is much larger for silage maize. In contrast to winter wheat the percentage of the area wheeled between 6–15 times is up to 20% higher in the crop zone (9–20%) and in the headlands (18–20%) of silage maize. The higher maximum amount of wheel passes during the winter wheat season is mainly caused by the more frequent fertilization and spraying, which also leads to a higher number of wheel passes at the crossings of the crop zone and headland tracks (Figure 4 and Table 1).
However, the silage maize harvest did not correspond to the usual circumstances. The transport vehicle in the field was used to carry the harvest goods to an off-field transfer vehicle. The purpose of this was to separate the high tire inflation pressure, which is required to drive on paved roads, from the field with lower tire inflation pressure. In addition, only one vehicle was used in the field, while in the usual routine several transport vehicles are in the field at the same time. Consequently, it can be assumed that under normal circumstances, the traffic intensity on a silage maize field would be even higher than calculated here. This corresponds to the results of Duttmann et al. [23,24], who reported uncoordinated and intensive traffic during silage maize harvest in both the field and the headland.
Derived from the cumulative observations of cropping seasons, (sub)soil compaction risks of the respective crop can be estimated. In summary, the analyses show that the season with the cultivation of sugar beet is by far the most stressful for the soil compared to silage maize and winter wheat. This finding stays in line with Håkansson [25], Goetze et al. [28] who reported that sugar beet is one of the crops with the highest soil compaction risk. For winter wheat, the results of the trafficked area can be compared with those of Kroulík et al. [21]. They indicate that under conventional tillage 95.3% of the entire field has been passed, while conservation tillage amounts up to 72.8%. Our study reveals an area percentage of 82% trafficked under conventional tillage (2014–2015) and 92% wheeled under mixed tillage with harrow, cultivator and plow (2016–2017). The difference might be explained by the different (1) methodology of calculation, (2) number of work processes and (3) working widths of the vehicles.

3.2. Analysis of Traffic Intensity for Single Work Processes

Specific values from the literature were used to analyze potential upper values for the traffic intensity. The values for wheel load were assigned to 5 Mg [13,20] and 3 Mg [18,19]. For the wheel pass frequency we used five wheel passes [12,13] as upper threshold. The results with the specified classes of more than five wheel passages and more than 3 or 5 Mg wheel load for each individual work process confirm the results of the annually summed values (Table 2 and Table 3) that harvesting is the work process with the highest intensity of traffic. Apart from the harvest, wheel loads above 5 Mg are only achieved in the headland during sowing of winter wheat. More than five wheel passes are achieved in almost every work process. Harvesting and soil tillage stand out especially in headlands. In general, the highest accumulation of wheel passes for single work processes are found in the headland. In terms of wheel load, the differences between the intensity in headland and crop zone are smaller.
During the sugar beet season, a higher proportion of the area is passed with more than five wheel passes compared to the soil tillage of the other seasons. This is mainly caused by the fact that before sowing sugar beet, the soil was loosened with a cultivator both in autumn 2017 and additionally tilled in spring 2018 using the three methods (plow, cultivator, harrow). The latter was done in several individual steps. As the operations have been merged in order to be able to show them in relation to the total field area, the result is the high total area trafficked and the large area, especially in the headland, with more than five wheel pass.
During silage maize harvest about 33% of the headland and about 15% of the field in total is wheeled more than 5 times. For wheel loads over 5 Mg it is even 53.8% in the headland and 34.9% in the complete field. The results of the silage maize harvest can be compared with the studies of Duttmann et al. [23,24], as they considered almost the same type of chopper and transport vehicle. Related to the complete field our results deviates slightly from that study. Regarding the area affected by wheel loads ≥5 Mg and by ≥5 wheel passes, the maximum difference in calculated area percentage amounts to 9%. In contrast to our study Duttmann et al. [23,24] did not differentiate between field traffic intensity in the crop zone and the headland quantitatively, but indicated a higher amount of repeatedly wheeled machine tracks and higher wheel load input. Moreover, Håkansson [25] indicated a higher amount of wheel passes in the headland than crop zone.
The area percentages with wheel loads over 3 Mg (Supplementary Materials Table S3) corresponds to the result with over 5 Mg. However, in addition to sowing and harvesting, the processes with decoupled implements (e.g., primary and secondary tillage) also have wheel loads ≥3 Mg in the headland, but only seldom in the crop zone. For spraying and fertilizing the filling level of the bunker determined whether the wheel load of 3 Mg is exceeded or not.
Studies such as Schjønning et al. [14] showed that several wheel passes can have a stronger effect on the subsoil than a single pass with high wheel load. Consequently, the results of wheel loads ≥5 Mg and ≥3 Mg should not be considered in isolation. Hence, the wheel loads were combined with the results of more than five wheel passes (Figure 5, Table 4). The results show that the extent of intensive traffic is biggest during the season with silage maize and sugar beet.
The work processes that meet the criteria for over 5 Mg and five wheel passes are the same as for the individual consideration of 5 Mg, which are sowing of winter wheat and sugar beet and harvesting of silage maize, winter wheat and sugar beet (Table 4). However, the affected area for the combination of 5 Mg wheel load and five wheel passes has decreased. In case of sugar beet harvest the area affected by more than 5 Mg wheel load and five passes in the headland is 60.8%. During winter wheat and silage maize harvest it is still approximately 4 to 7.5% area in the headland.
Moreover, the work processes with ≥3 Mg and more than five wheel passes correspond to the work processes from the analysis with wheel load over 3 Mg. Figure 5 shows that for this combination, sugar beet and silage maize meet the criteria for most of the area in the headland and also parts of the crop zone.
The work processes considered in this study can be methodically transferred to other crops in principle. For example harvesting with self-propelled machines (sugar beet) or harvesting chains (silage maize). The number of traffic activities for fertilizing and spraying may vary depending on the crop type, tillage operations and soil management (preservative, conventional, no-till, organic) and environmental conditions (pest infestation). However, it needs to be noted that the working width should be almost the same for the machines, because the total wheel track area differs with different working widths, for example cf. [21,22]. Moreover, the wheel load and wheel pass frequency depend on the working width, as larger working widths cross less area, but are usually heavier and bigger.

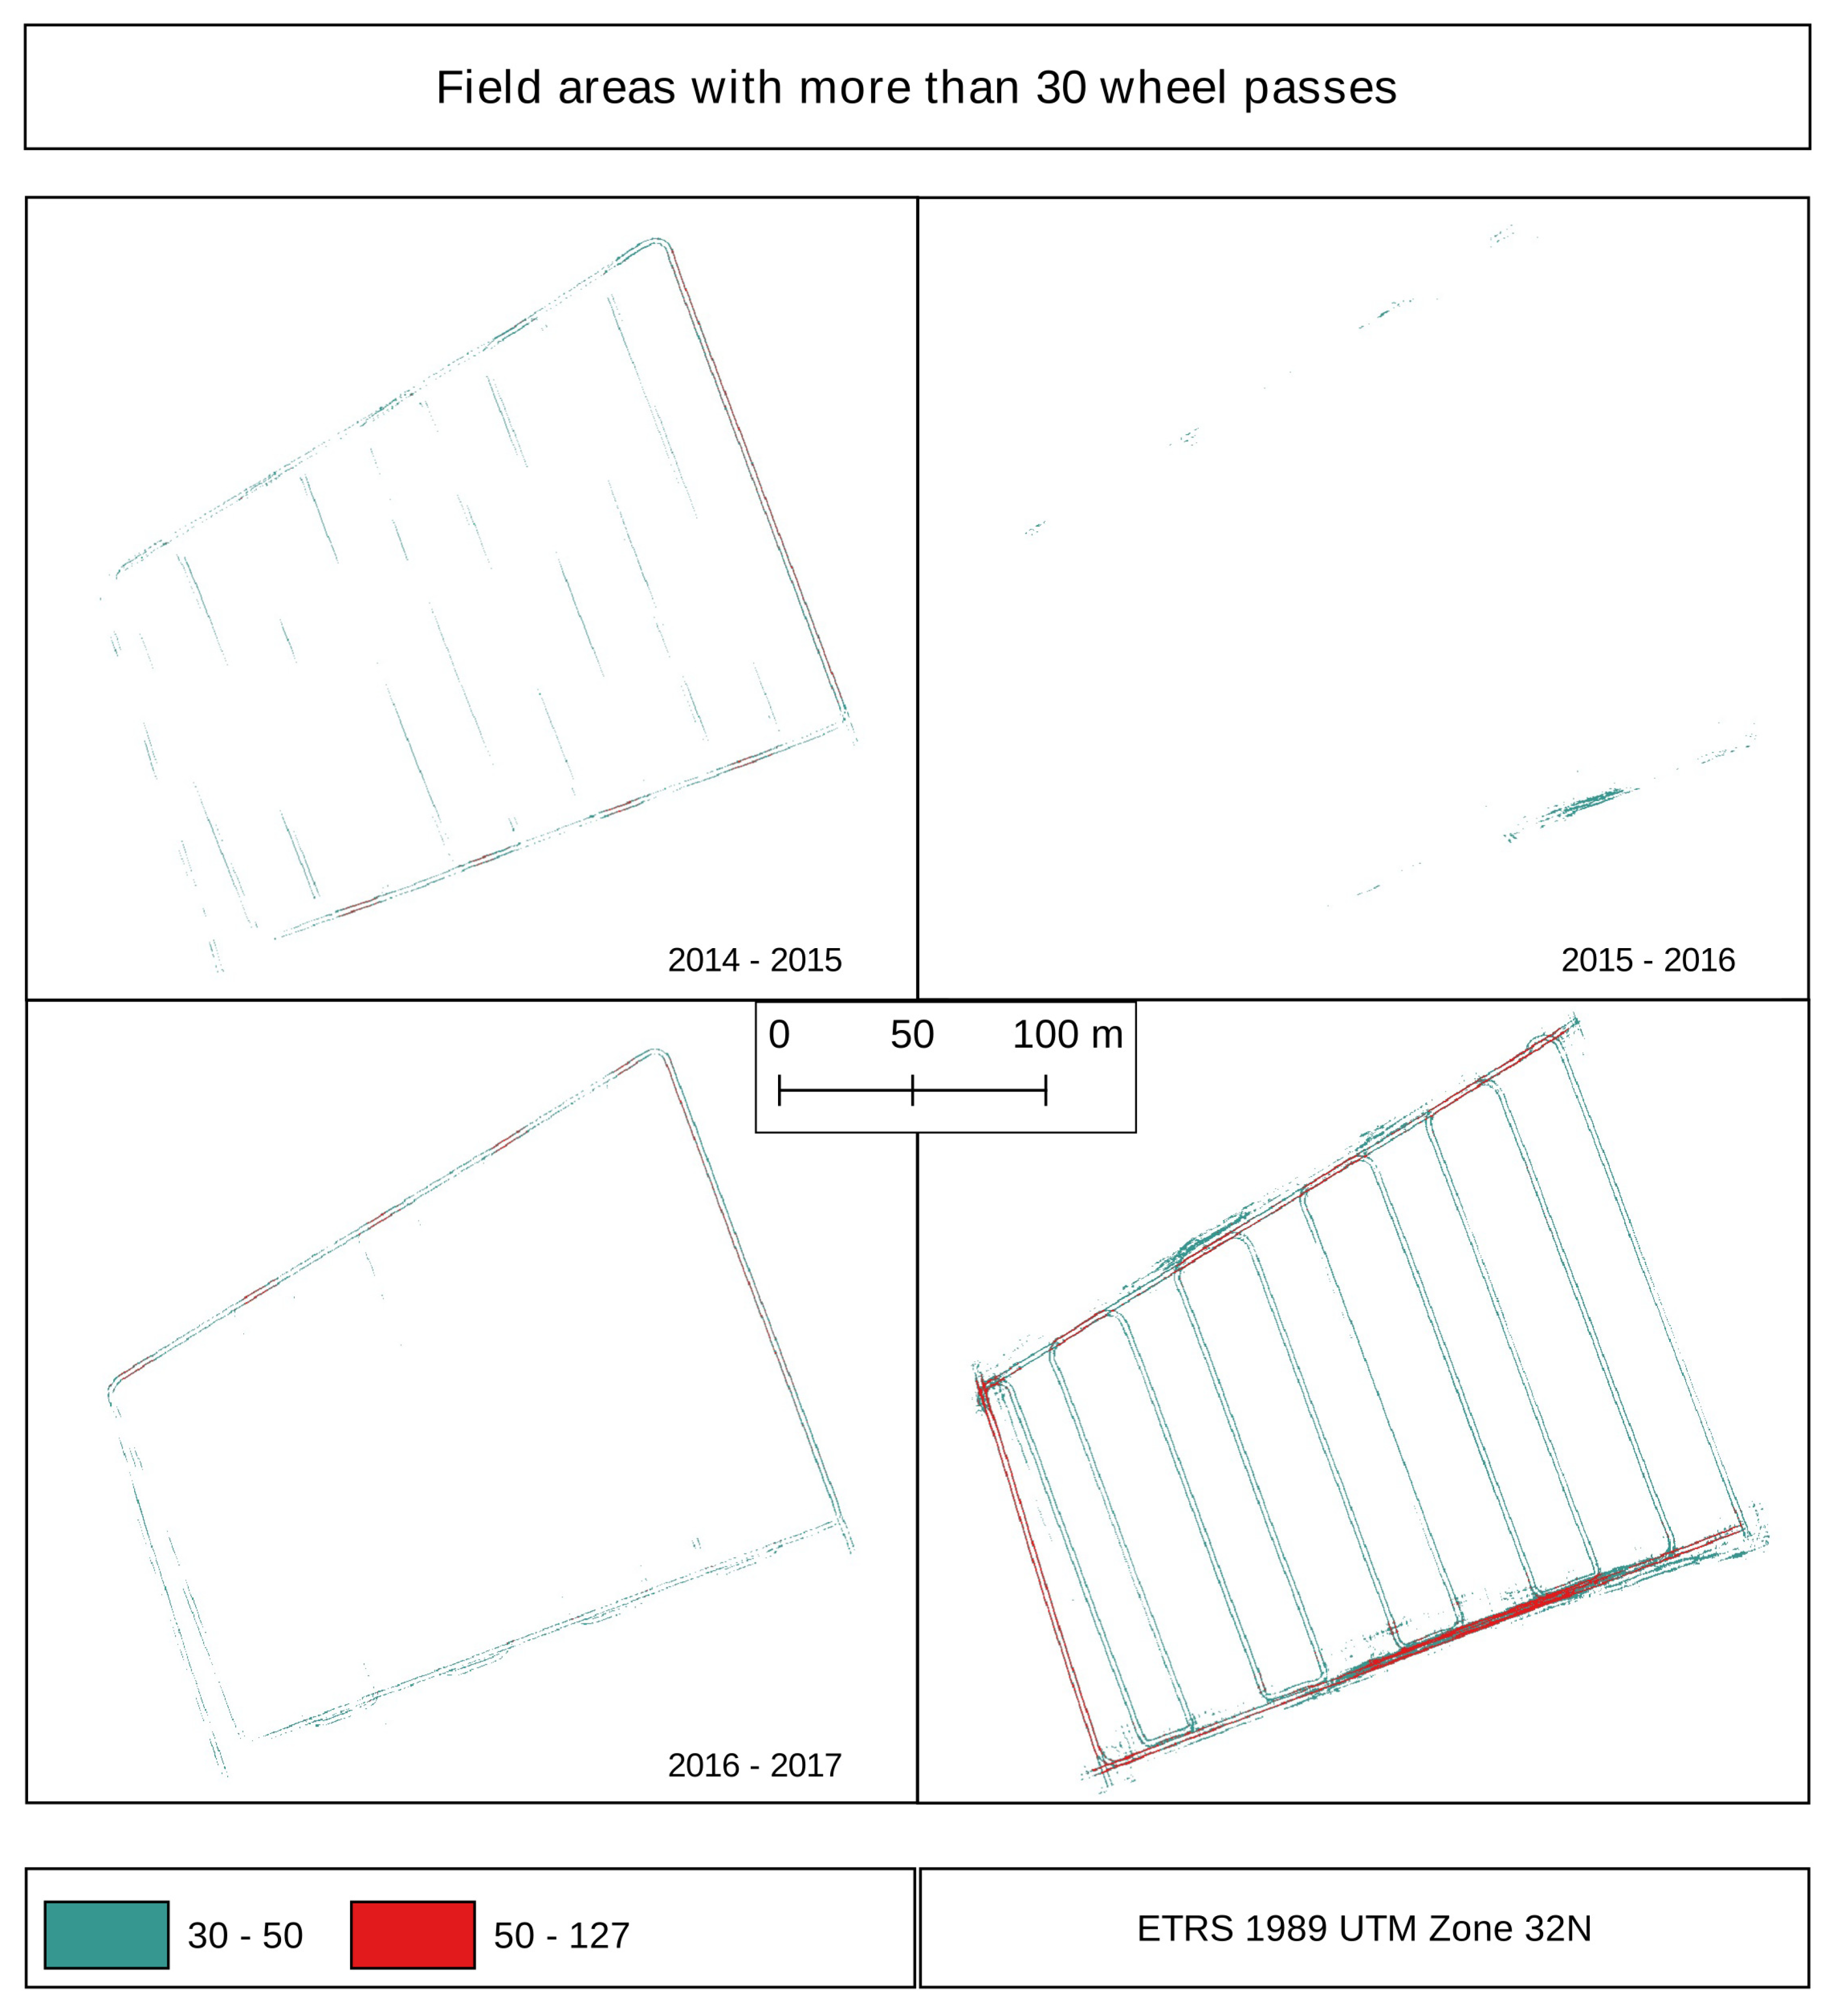
3.3. Spatial-Temporal Modeling and Future Perspectives

This study shows which pressures can be exerted on the soil spatially by agricultural machinery. In general, it distinguished between headland and crop zone. These results of potential wheel pass frequency or wheel load for specific work processes could be transferred to fields with similar field geometry or even used for regional modeling of soil compaction risks [28,29,30]. It is not yet possible to estimate how far the intensities of wheel load distribution and wheel pass frequency behave with regard to the area percentages for different field geometries. In the given study, the field shape was almost rectangular, which simplifies route planning and driving optimization. Håkansson [25] indicated that in irregular field the traffic intensity is higher during slurry spreading than for regular fields. According to Duttmann et al. [23], the length of the field should be aligned with the distance it takes to fill the bunker completely during harvesting. This avoids unnecessary drives with a full bunker in the field as much as possible.
The soil compaction risk, however, is not solely dependent on wheel load and amount of wheel passes. Soil conditions during the work process also determine the risk. In this study, the soil conditions are not taken into account in the traffic intensity analysis. For instance, soil moisture is an important parameter, which has a fundamental influence on the transfer of stress into the soil [31,32]. In very dry years there may be no reaction of the soil to high applied pressure, as soil strength and thus resistance is high. In contrast, in some years the soil conditions are too humid which theoretically results in high soil compaction risk during any field traffic. The calculation of soil resistance at the time of driving at a given soil moisture level is needed to asses the actual soil compaction risk cf. [29]. As Gut et al. [32] calculated for an Eutric Cambisol on a Swiss Plateau, however, there is no day for the sugar beet harvest on which field traffic is possible without potential loss of soil functionality.
In addition, a method to calculate and analyze the traffic intensity and soil pressure with temporally offset is also missing. This means for example, that in most cases the farmer will not pass the same spot several times within a few minutes, but will do so with a time offset during the work process. This should be investigated in order to be able to realistically evaluate the traffic in the field. In the first step values such as wheel load and wheel passes can be used. However, the analysis for wheel load limits of 3 Mg combined with more than five wheel passes showed that there would be almost no traffic activity in the field possible without damaging the soil. Increasing the maximum wheel load to 5 Mg—and wheel passes more than five—the harvest still remains potentially damaging to the soil. The changeover from tires to rubber tracks is considered to be a soil-protecting solution. Following Lamandé et al. [33], however, this technique could be improved as it still has a very heterogeneous distribution of pressure under the tire during driving. Lowering the inflation pressure and lowering the wheel load also reduces the risk of compaction [28].
Combining the wheel load with wheel passes filters the areas with the highest intensities. These show in practice that the headland is used most intensively. From this it can be deduced that studies should be initiated towards a careful headland management in order to relieve the headland. Likewise, specific soil surveys could be conducted to study particular combinations of pressures or situations and their impact on soil properties. By recording all work processes over the year, the previous traffic activities can be included in the analysis, e.g., to be able to exclude sources of error in the analysis of soil properties.

4. Conclusions

This study showed the quantitative field intensity for three complete crops and their single work processes. It has been shown that the intensity of traffic varies both between different crops and between work processes. Overall, less than 20% of the area remains unaffected during one season. For sugar beet this is even less than 1%. The highest intensities were found in the headland. Harvests were the dominant reason for the high stress levels.
The evaluation of the field traffic within four years quantifies and locates the problematic traffic intensities. The different assumptions about maximum wheel load (3 Mg, 5 Mg) and wheel pass (five passes) values revealed that each work process in the field exceeds at least one of the thresholds. However, it is obvious that mainly the headland is affected. The combination of wheel load over 5 Mg and more than five wheel passes showed the most stressed areas and most intense work processes in the field, which are the harvesting of sugar beet, winter wheat and silage maize, as well as the sowing of winter wheat.
Derivatives regarding critical driving behavior or mechanical impact can be made. For agricultural field planning particular care should be taken to develop soil-conserving management for the headland and areas with critical traffic intensity in order to relieve the soil as much as possible and to avoid damage caused by (subsoil) compaction.

Supplementary Materials

The following are available online at https://www.mdpi.com/2076-3263/10/8/292/s1, Table S1: Table containing the machines and their characteristic used in the study, Figure S1: Picture showing the study site and filled gaps because of the GPS dropouts, Table S2: Table containing all modeled work processes without aggregation of soil tillage and sowing, Table S3: Tables containing the data about the area covered by specific wheel passes and wheel load. Additionally, the R-script for the aggregation of classes under and above 5 Mg wheel load and five wheel passes, Table S4: The R-script an tables for Figure 3.

Author Contributions

Conceptualization, K.A., M.K. and R.D.; Methodology, K.A.; Software, K.A.; Formal Analysis, K.A.; Investigation, K.A., M.K., R.D. and J.B.; Resources, K.A., M.K., R.D. and J.B.; Data Curation, K.A.; Writing—Original Draft Preparation, K.A.; Writing—Review & Editing, M.K. and R.D.; Visualization, K.A; Supervision, R.D.; Funding Acquisition, R.D. and J.B. All authors have read and agreed to the published version of the manuscript.

Funding

The Federal Ministry of Education and Research (BMBF) funded this study within the framework of the BonaRes-initiative (Grant No.: 031B0684C). We acknowledge financial support by Land Schleswig-Holstein within the funding programme Open Access Publikationsfonds.

Conflicts of Interest

The authors declare no conflict of interest. The funders had no role in the design of the study; in the collection, analyses, or interpretation of data; in the writing of the manuscript, or in the decision to publish the results.

Abbreviations

The following abbreviations are used in this manuscript:
GPSGlobal Positioning System
RTKReal-Time Kinematic
WWWinter Wheat
SBSugar Beet
MMaize

References

  1. Keller, T.; Sandin, M.; Colombi, T.; Horn, R.; Or, D. Historical increase in agricultural machinery weights enhanced soil stress levels and adversely affected soil functioning. Soil Tillage Res. 2019, 194, 104293. [Google Scholar] [CrossRef]
  2. FAO; ITPS. Status of the World’s Soil Resources (SWSR)—Main Report; Food and Agriculture Organization of the United Nations and Intergovernmental Technical Panel on Soils: Rome, Italy, 2015; 650p. [Google Scholar]
  3. Horn, R.; Domżżał, H.; Słowińska-Jurkiewicz, A.; van Ouwerkerk, C. Soil compaction processes and their effects on the structure of arable soils and the environment. Soil Tillage Res. 1995, 35, 23–36. [Google Scholar] [CrossRef]
  4. Lamande, M.; Schjønning, P.; Tøgersen, F.A. Mechanical behaviour of an undisturbed soil subjected to loadings: Effects of load and contact area. Soil Tillage Res. 2007, 97, 91–106. [Google Scholar] [CrossRef]
  5. Keller, T.; Arvidsson, J. Technical solutions to reduce the risk of subsoil compaction: Effects of dual wheels, tandem wheels and tyre inflation pressure on stress propagation in soil. Soil Tillage Res. 2004, 79, 191–205. [Google Scholar] [CrossRef]
  6. Horn, R.; Way, T.; Rostek, J. Effect of repeated tractor wheeling on stress/strain properties and consequences on physical properties in structured arable soils. Soil Tillage Res. 2003, 73, 101–106. [Google Scholar] [CrossRef]
  7. Schjønning, P.; Lamandé, M.; Berisso, F.E.; Simojoki, A.; Alakukku, L.; Andreasen, R.R. Gas Diffusion, Non-Darcy Air Permeability, and Computed Tomography Images of a Clay Subsoil Affected by Compaction. Soil Sci. Soc. Am. J. 2013, 77, 1977–1990. [Google Scholar] [CrossRef]
  8. Radford, B.J.; Yule, D.F.; McGarry, D.; Playford, C. Amelioration of soil compaction can take 5 years on a Vertisol under no till in the semi-arid subtropics. Soil Tillage Res. 2007, 97, 249–255. [Google Scholar] [CrossRef]
  9. Berisso, F.E.; Schjønning, P.; Keller, T.; Lamandé, M.; Simojoki, A.; Iversen, B.V.; Alakukku, L.; Forkman, J. Gas transport and subsoil pore characteristics: Anisotropy and long-term effects of compaction. Geoderma 2013, 195–196, 184–191. [Google Scholar] [CrossRef]
  10. Besson, A.; Séger, M.; Giot, G.; Cousin, I. Identifying the characteristic scales of soil structural recovery after compaction from three in-field methods of monitoring. Geoderma 2013, 204–205, 130–139. [Google Scholar] [CrossRef]
  11. Arvidsson, J.; Keller, T. Soil stress as affected by wheel load and tyre inflation pressure. Soil Tillage Res. 2007, 96, 284–291. [Google Scholar] [CrossRef]
  12. Botta, G.F.; Becerra, A.T.; Tourn, F.B. Effect of the number of tractor passes on soil rut depth and compaction in two tillage regimes. Soil Tillage Res. 2009, 103, 381–386. [Google Scholar] [CrossRef]
  13. Becerra, A.T.; Botta, G.F.; Bravo, X.L.; Tourn, M.; Melcon, F.B.; Vazquez, J.; Rivero, D.; Linares, P.; Nardon, G. Soil compaction distribution under tractor traffic in almond (Prunus amigdalus L.) orchard in Almería España. Soil Tillage Res. 2010, 107, 49–56. [Google Scholar] [CrossRef]
  14. Schjønning, P.; Lamandé, M.; Munkholm, L.J.; Lyngvig, H.S.; Nielsen, J.A. Soil precompression stress, penetration resistance and crop yields in relation to differently-trafficked, temperate-region sandy loam soils. Soil Tillage Res. 2016, 163, 298–308. [Google Scholar] [CrossRef]
  15. Naderi-Boldaji, M.; Kazemzadeh, A.; Hemmat, A.; Rostami, S.; Keller, T. Changes in soil stress during repeated wheeling: A comparison of measured and simulated values. Soil Res. 2018, 56, 204–214. [Google Scholar] [CrossRef]
  16. Pulido-Moncada, M.; Munkholm, L.J.; Schjønning, P. Wheel load, repeated wheeling, and traction effects on subsoil compaction in northern Europe. Soil Tillage Res. 2019, 186, 300–309. [Google Scholar] [CrossRef]
  17. Seehusen, T.; Riggert, R.; Fleige, H.; Horn, R.; Riley, H. Soil compaction and stress propagation after different wheeling intensities on a silt soil in South-East Norway. Acta Agric. Scand. Sect. B—-Soil Plant Sci. 2019, 69, 343–355. [Google Scholar] [CrossRef]
  18. Horn, R.; Fleige, H. Risk assessment of subsoil compaction for arable soils in Northwest Germany at farm scale. Soil Tillage Res. 2009, 102, 201–208. [Google Scholar] [CrossRef]
  19. Schjønning, P.; Lamandé, M.; Keller, T.; Pedersen, J.; Stettler, M. Rules of thumb for minimizing subsoil compaction. Soil Use Manag. 2012, 28, 378–393. [Google Scholar] [CrossRef]
  20. Håkansson, I.; Reeder, R.C. Subsoil compaction by vehicles with high axle load—Extent, persistence and crop response. Soil Tillage Res. 1994, 29, 277–304. [Google Scholar] [CrossRef]
  21. Kroulík, M.; Kumhála, F.; Hůla, J.; Honzík, I. The evaluation of agricultural machines field trafficking intensity for different soil tillage technologies. Soil Tillage Res. 2009, 105, 171–175. [Google Scholar] [CrossRef]
  22. Kroulík, M.; Kvíz, Z.; Kumhála, F.; Hůla, J.; Loch, T. Procedures of soil farming allowing reduction of compaction. Precis. Agric. 2011, 12, 317–333. [Google Scholar] [CrossRef]
  23. Duttmann, R.; Brunotte, J.; Bach, M. Spatial analyses of field traffic intensity and modeling of changes in wheel load and ground contact pressure in individual fields during a silage maize harvest. Soil Tillage Res. 2013, 126, 100–111. [Google Scholar] [CrossRef]
  24. Duttmann, R.; Schwanebeck, M.; Nolde, M.; Horn, R. Predicting soil compaction risks related to field traffic during silage maize harvest. Soil Sci. Soc. Am. J. 2014, 78, 408–421. [Google Scholar] [CrossRef]
  25. Håkansson, I. Machinery-induced compaction of arable soils: Incidence–consequences–counter measures. In Reports from the Division of Soil Management; Swedish University of Agricultural Sciences: Uppsala, Sweden, 2005; Volume 109. [Google Scholar]
  26. Augustin, K.; Kuhwald, M.; Brunotte, J.; Duttmann, R. FiTraM: A model for automated spatial analyses of wheel load, soil stress and wheel pass frequency at field scale. Biosyst. Eng. 2019, 180, 108–120. [Google Scholar] [CrossRef]
  27. FAO. World Reference Base for Soil Resources 2014, Update 2015: International Soil Classification System for Naming Soils and Creating Legends for Soil Maps; FAO: Rome, Italy, 2015. [Google Scholar]
  28. Goetze, P.; Rucknagel, J.; Jacobs, A.; Marlander, B.; Koch, H.J.; Christen, O. Environmental impacts of different crop rotations in terms of soil compaction. J. Environ. Manag. 2016, 181, 54–63. [Google Scholar] [CrossRef]
  29. Kuhwald, M.; Dörnhöfer, K.; Oppelt, N.; Duttmann, R. Spatially Explicit Soil Compaction Risk Assessment of Arable Soils at Regional Scale: The SaSCiA-Model. Sustainability 2018, 10, 1618. [Google Scholar] [CrossRef] [Green Version]
  30. van den Akker, J.J.; Hoogland, T. Comparison of risk assessment methods to determine the subsoil compaction risk of agricultural soils in The Netherlands. Soil Tillage Res. 2011, 114, 146–154. [Google Scholar] [CrossRef]
  31. Söhne, W. Fundamentals of pressure distribution and soil compaction under tractor tires. Agric. Eng. 1958, 39, 276–290. [Google Scholar]
  32. Gut, S.; Chervet, A.; Stettler, M.; Weisskopf, P.; Sturny, W.G.; Lamandé, M.; Schjønning, P.; Keller, T. Seasonal dynamics in wheel load-carrying capacity of a loam soil in the Swiss Plateau. Soil Use Manag. 2015, 31, 132–141. [Google Scholar] [CrossRef]
  33. Lamandé, M.; Greve, M.H.; Schjønning, P. Risk assessment of soil compaction in Europe —Rubber tracks or wheels on machinery. CATENA 2018, 167, 353–362. [Google Scholar] [CrossRef]
Figure 1. Study site and exemplary of the GPS-tracks (without adjustment of position) from sowing of sugar beet. The crop zone and headland are indicated by the arrows. On the front sides the headland is located transverse to the crop zone. The different zones marked A, B and C indicate the three types of soil tillage management.
Geosciences 10 00292 g001
Figure 2. A simplified work flow for a selection of the modeling procedure of FiTraM according to [26]. The Input variables in bold are required, the others are optional.
Geosciences 10 00292 g002
Figure 3. The cumulative wheel loads and wheel passes during the single seasons of winter wheat (2014–2015, 2016–2017), silage maize (2015–2016) and sugar beet (2017–2018). The classes are chosen broadly at the extremes, as the area percentages in the higher ranges are very small and would otherwise not be presentable. Due to rounding, 2016–2018 is missing 1% in the crop zone and 2015–2016 in the headland. Data and script for the creation of the figure is attached in the Supplementary Materials (Table S4).
Geosciences 10 00292 g003
Figure 4. Areas with more than 30 wheel passes for winter wheat (2014–2015, 2016–2017), silage maize (2015–2016) and sugar beet (2017–2018). The two classes represent the two highest classes in Figure 3.
Geosciences 10 00292 g004
Figure 5. Areas with more than five wheel passes and more than 3 Mg wheel load (left) and more than five wheel passes combined with more than 5 Mg wheel load (right) within single work processes.
Geosciences 10 00292 g005
Table 1. Tracked processes for winter wheat (2014–2015), silage maize (2015–2016), winter wheat (2016–2017) and sugar beet (2017–2018). Soil tillage practices (plow, harrow, cultivator), fertilizer and spraying are summarized.
Season Work ProcessMachine
ID a
Consumption
[kg/L]
Harvest
[t]
Inflation Pressure
[kPa]
2014–2015 soil tillagePLOW002 90 100
sowingSOW002190 100 100
fertilizingFER00345/50/50/75 b 120 100
sprayingSP005200 250 180 150
SP006200 250 180 300
harvestHAR003 10.8100 100
2015–2016 soil tillageCULT002 90 90 t
HARR001 90 90
PLOW003 90 110
SECT001 70 70 130
sowingSOW001185 170 170 70
sprayingSP006200 250 180 300
harvestHAR001 51.4170 140
HTRAC001 90 100 220 220
2016–2017 soil tillageCULT001 90 110
HARR002 90 90 180
MULCH001 120 110
PLOW003 90–110
sowingSOW002190 90–110
fertilizingFER00315 100 120
sprayingSP005200 250 180 150
SP006200 250 180 300
harvestHAR003 10.2110 100
2017–2018 soil tillageCULT001 90 110
CULT002 90–100
HARR001 90–100
MULCH001 100 100
PLOW001 90 110
SECT001 80 80 130
sowingSOW0035 90 110–180 180
sprayingSP001200 100 100 100
fertilizingFER003100/150 100 120
FER002175 100 100
FER001750 100 100 220
FER001500 100 100 220
sprayingSP003200 100 100 100
harvestHAR002 96.5200 210 210
a for machines see supplementary data. b different for the single process.
Table 2. Area percentage of the field for single work processes with under and over five wheel passes. In bold are the area shares above 10%.
%—Area
HeadlandCrop ZoneComplete
CropWork Process<5 Passes≥5 Passes<5 Passes≥5 Passes<5 Passes≥5 PassesTotal
WWsoil tillage47.618.742.51.243.35.749.0
sowing59.56.147.0 50.01.651.5
6 × spraying8.40.54.80.35.70.46.1
4 × fertilizer8.5 4.9 5.7 5.7
harvest51.91.333.6 37.40.337.7
Msoil tillage61.512.951.73.253.65.759.2
secondary tillage56.45.436.00.140.61.542.1
secondary tillage32.61.05.1 12.10.312.4
sowing50.92.731.30.136.00.836.8
spraying7.40.74.80.35.40.45.8
harvest transport37.832.024.98.028.014.242.1
harvest chopper54.33.329.1 35.30.936.1
WWsoil tillage52.52.146.81.247.41.448.8
mulching48.94.829.40.434.11.535.6
sowing57.54.640.10.144.01.245.3
6 × spraying8.00.64.80.35.60.46.0
2 × fertilizer6.6 4.0 4.6 4.6
harvest56.94.034.6 39.61.040.7
SBsoil tillage39.456.162.818.456.228.084.1
mulching47.11.226.7 31.70.332.0
secondary tillage54.03.225.7 32.60.933.5
sowing47.11.532.50.336.00.636.5
kali15.71.510.1 11.40.411.8
lime22.72.415.30.817.11.218.3
8 × spraying9.41.35.00.36.10.56.7
3 × fertilizer8.10.24.4 5.30.15.4
harvest32.661.088.25.573.119.692.7
WW = winter wheat, M = silage maize, SB = sugar beet.
Table 3. Area percentage of the field for single work processes with under and over 5 Mg wheel load. In bold are the area shares above 10%.
%—Area
HeadlandCrop ZoneComplete
CropWork Process<5 Mg≥5 Mg<5 Mg≥5 Mg<5 Mg≥5 MgTotal
WWsowing63.71.947.0 51.10.551.5
harvest4.548.70.333.31.436.337.7
Mharvest transport64.15.732.40.540.31.842.1
harvest chopper3.753.80.428.71.234.936.1
WWharvest4.656.40.634.01.639.140.7
sowing59.32.940.1 44.50.745.3
SBharvest0.093.70.093.60.092.892.8
WW = winter wheat, M = silage maize, SB = sugar beet.
Table 4. Area percentage of the field for single work processes with over five wheel passes and wheel loads greater than 3 Mg and 5 Mg. In bold are the area shares above 10%.
%—Area
≥3 Mg and ≥5 Wheel Passes
CropWork ProcessHeadlandCrop ZoneComplete
WWsowing6.1-1.6
harvest1.3<0.10.3
soil tillage18.71.25.7
spraying0.60.30.4
Msowing2.70.10.8
soil tillage12.83.25.7
harvest transport31.98.014.2
harvest3.3<0.10.9
secondary tillage6.20.11.7
spraying0.70.30.4
WWsowing4.60.11.2
soil tillage2.11.21.4
harvest4.0<0.11.0
mulching4.70.41.5
spraying0.80.40.5
SBsowing1.50.30.6
fertilizer0.40.00.1
harvest60.85.319.6
kali1.5-0.4
lime2.40.81.2
mulching1.2<0.10.3
secondary tillage3.2<0.10.9
spraying1.40.30.6
sowing7.9<0.12.1
≥5 Mg and ≥5 Wheel Passes
WWsowing0.6-0.2
harvest1.3<0.10.3
Mharvest transport4.50.51.5
harvest3.2<0.10.9
WWsowing0.6<0.10.2
harvest4.0<0.11.0
SBharvest60.85.319.6
sowing1.5<0.10.4
WW = winter wheat, M = silage maize, SB = sugar beet.

