1. Introduction
The Holocene pre-inundation landscape of the southern North Sea, known as Doggerland, was a gently undulating, low-relief area associated with Mesolithic hunter-gatherer communities [
1]. Sea-level rise during the mid-Holocene period at the regional scale was episodic due to local variations in isostatic rebound, autocompaction of sediments and palaeotidal range. The precise timing and extent of such processes and consequently their impact on Mesolithic communities, remains unclear [
2]. Toward the end of Doggerland, when the majority of the landscape had already been lost, the remaining land would have been low lying, close to sea level, extending out from Norfolk, UK, to an archipelago centred on the Dogger Bank. This low-lying landscape would have therefore been extremely vulnerable to catastrophic flooding events. Significantly, a key regional event during this period was a series of underwater landslides known as the Storegga Event, which occurred off the Norwegian Atlantic coast 8.15 thousand years before present (ka cal BP) [
2,
3,
4,
5]. This event triggered a tsunami that some researchers have associated with the final submersion of Doggerland [
6].
Despite the magnitude of the Storegga tsunami in the northern North Sea, as evidenced by sediment deposits and predicted by model simulations [
4,
6,
7], there has been a surprising lack of physical evidence to suggest the tsunami reached the southern North Sea (
Figure 1) [
3,
8]. Furthermore, whilst the same model suggests that if the tsunami did reach the southern North Sea the actual impact within this area has been the subject of debate [
8].
The impact of the Storegga tsunami on contemporary landscapes and, by implication, on human communities is clearly of some importance. The recovery of a series of cores within the southern North Sea region, as part of an ERC-funded project Europe’s Lost Frontiers, provided an opportunity to assess the significance of the event on the contemporary landscape and, by extension, hunter-gather populations from within what remained of Doggerland.
2. Characterising Tsunami Deposits
Recognition of ancient tsunami deposits presents a considerable challenge in the field. Many of the key sedimentary features that are associated with tsunamis have similarities to those left by other depositional events, for example storm surges [
9]. Nonetheless, over the past 20 years several studies of both ancient and modern sediments have identified important discriminators between these events. For example, Fujiwara and Kamataki [
10] outlined a tsunami depositional model based on multiple sedimentary features identified in deposits in Tomoe Bay, Japan. Here the salient features of this event were interpreted as resulting from the difference in wave type. Tsunami sequences typically result from a few high-velocity, long-period, and often large amplitude waves where flow depths are greater than 10 m. These events entrained sediment from multiple offshore, shoreface, beach, and landward erosion zones. This often contrasts with storm surges where wave amplitudes are commonly less than 3 m, and sediment is transported primarily as bed-load by traction, from nearshore, shoreface and beach deposits. The resulting textural composition of deposits has been used to distinguish the cause of sedimentation however, the exact coastal morphology, the bathymetry of run up and the availability of sediment can make this challenging.
A common difference between tsunami and storm surges, and upon which most investigators do agree on, is the bi-direction of flow that reflects the multiple land and seaward movement of wave events in a tsunami [
9]. In these cases, deposition results from a few high-velocity, long-period waves that deposit successive layers of coarse-grain size. These are separated by deposits fining upwards to mud drapes and each sub-event ends with flow velocity stagnation. In a number of cases at least two main pulses, that are manifest by four graded layers within the overall sequence, have been reported. In contrast, storm deposits typically demonstrate a unidirectional current in a single graded sequence. This generally reflects a gradual and prolonged event consisting of many waves that erode beaches and dunes with no significant overland return flow until after the main flooding. Nanayama et al. [
11] illustrate this difference in the study of the 1993 Japan Sea tsunami and the 1959 Miyakojima typhoon. Kortekaas and Dawson [
12] record similar sequences related to the Lisbon 1755AD earthquake and subsequent tsunami with overlying storm deposits. Fujiwara and Kamataki [
10] also noted vertical stacking of internal structures within Holocene deposits in the Boso Peninsula, Japan. Another common feature of tsunami deposits is the presence of mud rip-up clasts. Goff et al. [
13] noted these at a site in New Zealand and Morton et al. [
14] advocate their significance from a study of modern tsunami deposits. They also note, in contrast to storm deposits, that a tsunami may show a conformity to the antecedent landscape and a lateral alignment of ripped-up material within the deposit. Investigation of such deposits can be problematic. On land this would involve the recovery of material from multiple sites across significant areas of landscape. Such a methodology is generally not practical in the marine context where access to sites is limited usually due to prohibitive costs of coring. Comparison with local onshore material and coastal storm deposits is recommended, but with inundated palaeolandscapes these ‘onshore’ areas have often been eroded. A recent study that has addressed this issue by examining a series of offshore cores has recently been presented by Riou et al. [
15]. Here the backwash (offshore) sediments resulting from two historic tsunami events was analysed using geochemical and mineralogical analysis, and careful examination of the sediment texture. In most cores, basal soft sediment micro deformation that included asymmetric flame structures were recognised as a key character of the tsunami event.
In distinguishing tsunami-derived deposits we are assisted by Peters and Jaffe’s [
16] useful database of studies on sedimentary characteristics of recent tsunami deposits. They conclude that while there are differences between tsunami and storm surges, knowledge of site-specific morphological criteria is also important for discrimination. Physical criteria that may be diagnostic include; deposit thickness and geometry, sediment grain sizes, sorting (grading) and type, sedimentary structures (between bed and within bed), layering (type and organisation of stratification), contacts (both below and above), and composition (macro and micro fossils). Therefore, a multi-proxy study is needed to assure the origin of any sediments as tsunami deposits. A summary of characteristics for distinguishing tsunami and storm deposits is given in
Table 1.
The available data can be used to reconstruct a likely scenario to assist in identifying a tsunami deposit. A tsunami event, where the source of water movement is remote to the impact area, shows a typical arrival onshore that begins with a rapid fall in relative sea level causing erosion of near shore material. This is followed by the first wave pulse which brings a mixture of locally derived marine sediment. These include mixed and broken fauna and flora, and particularly shell material. As the wave reaches maximum onshore limits the energy reduces to zero, and this is represented as a fining upwards grading of the bed [
17]. The wave then retreats carrying with it an increased terrestrial signature mixed with some of the marine material brought inland by the first wave pulse. The resulting deposit is also marked by a fining upwards sequence as the wave reduces to zero velocity offshore. Subsequent waves repeat the cycle [
11], with the second wave often of greater magnitude than the first. Tsunami deposits are therefore typically a repeated sequence of events, but because of the relatively short time window for each cycle, the resulting deposits are rarely greater than 1m thick. This is in contrast to a storm surge which typically only shows one fining-upwards sequence but which can reach over 1m in thickness.
3. Materials and Methods
In order to reconstruct the early Holocene palaeolandscape of the southern North Sea we used a mega-seismic survey (see
Supplementary Information, text S1) to identify the coastline at approximately 8.2 ka cal BP and interpolated the results using bathymetric contours from EMODnet [
18] and sea level curve data from Bradley et al. [
19].
To characterize the landscape inferred from the palaeobathymetric reconstruction, we investigated the seismic signal further by the collection of 15 vibrocores across the landscape. The exact core locations were chosen to allow correlation of the seismic at different palaeogeographic settings and to track the Holocene inundation process. The core most strongly associated with the seismic signal, ELF001A was analysed with the following techniques; grain size measurement using standard dry sieving, loss on ignition, palaeomagnetic (remnant magnetization using a DC 755 superconducting rock magnetometer, 2G Enterprises, Sand City, CA, USA), geochemical scanning (using an XRF core scanner, Itrax, Mölndal, Sweden), organic chemistry profiling for lipid analysis (using a 7890A gas chromatograph, Agilent, Santa Clara, CA, USA, coupled with a 5975C Inert XL mass selective detector), optically stimulated luminescence (OSL) profiling and dating, radiocarbon (RC) dating, foraminifera and ostracod assessment, pollen analysis, diatom analysis, mollusca analysis and sedimentary ancient DNA (sedaDNA) analysis. All methods are described in full detail in the
supplementary information texts 4. Results
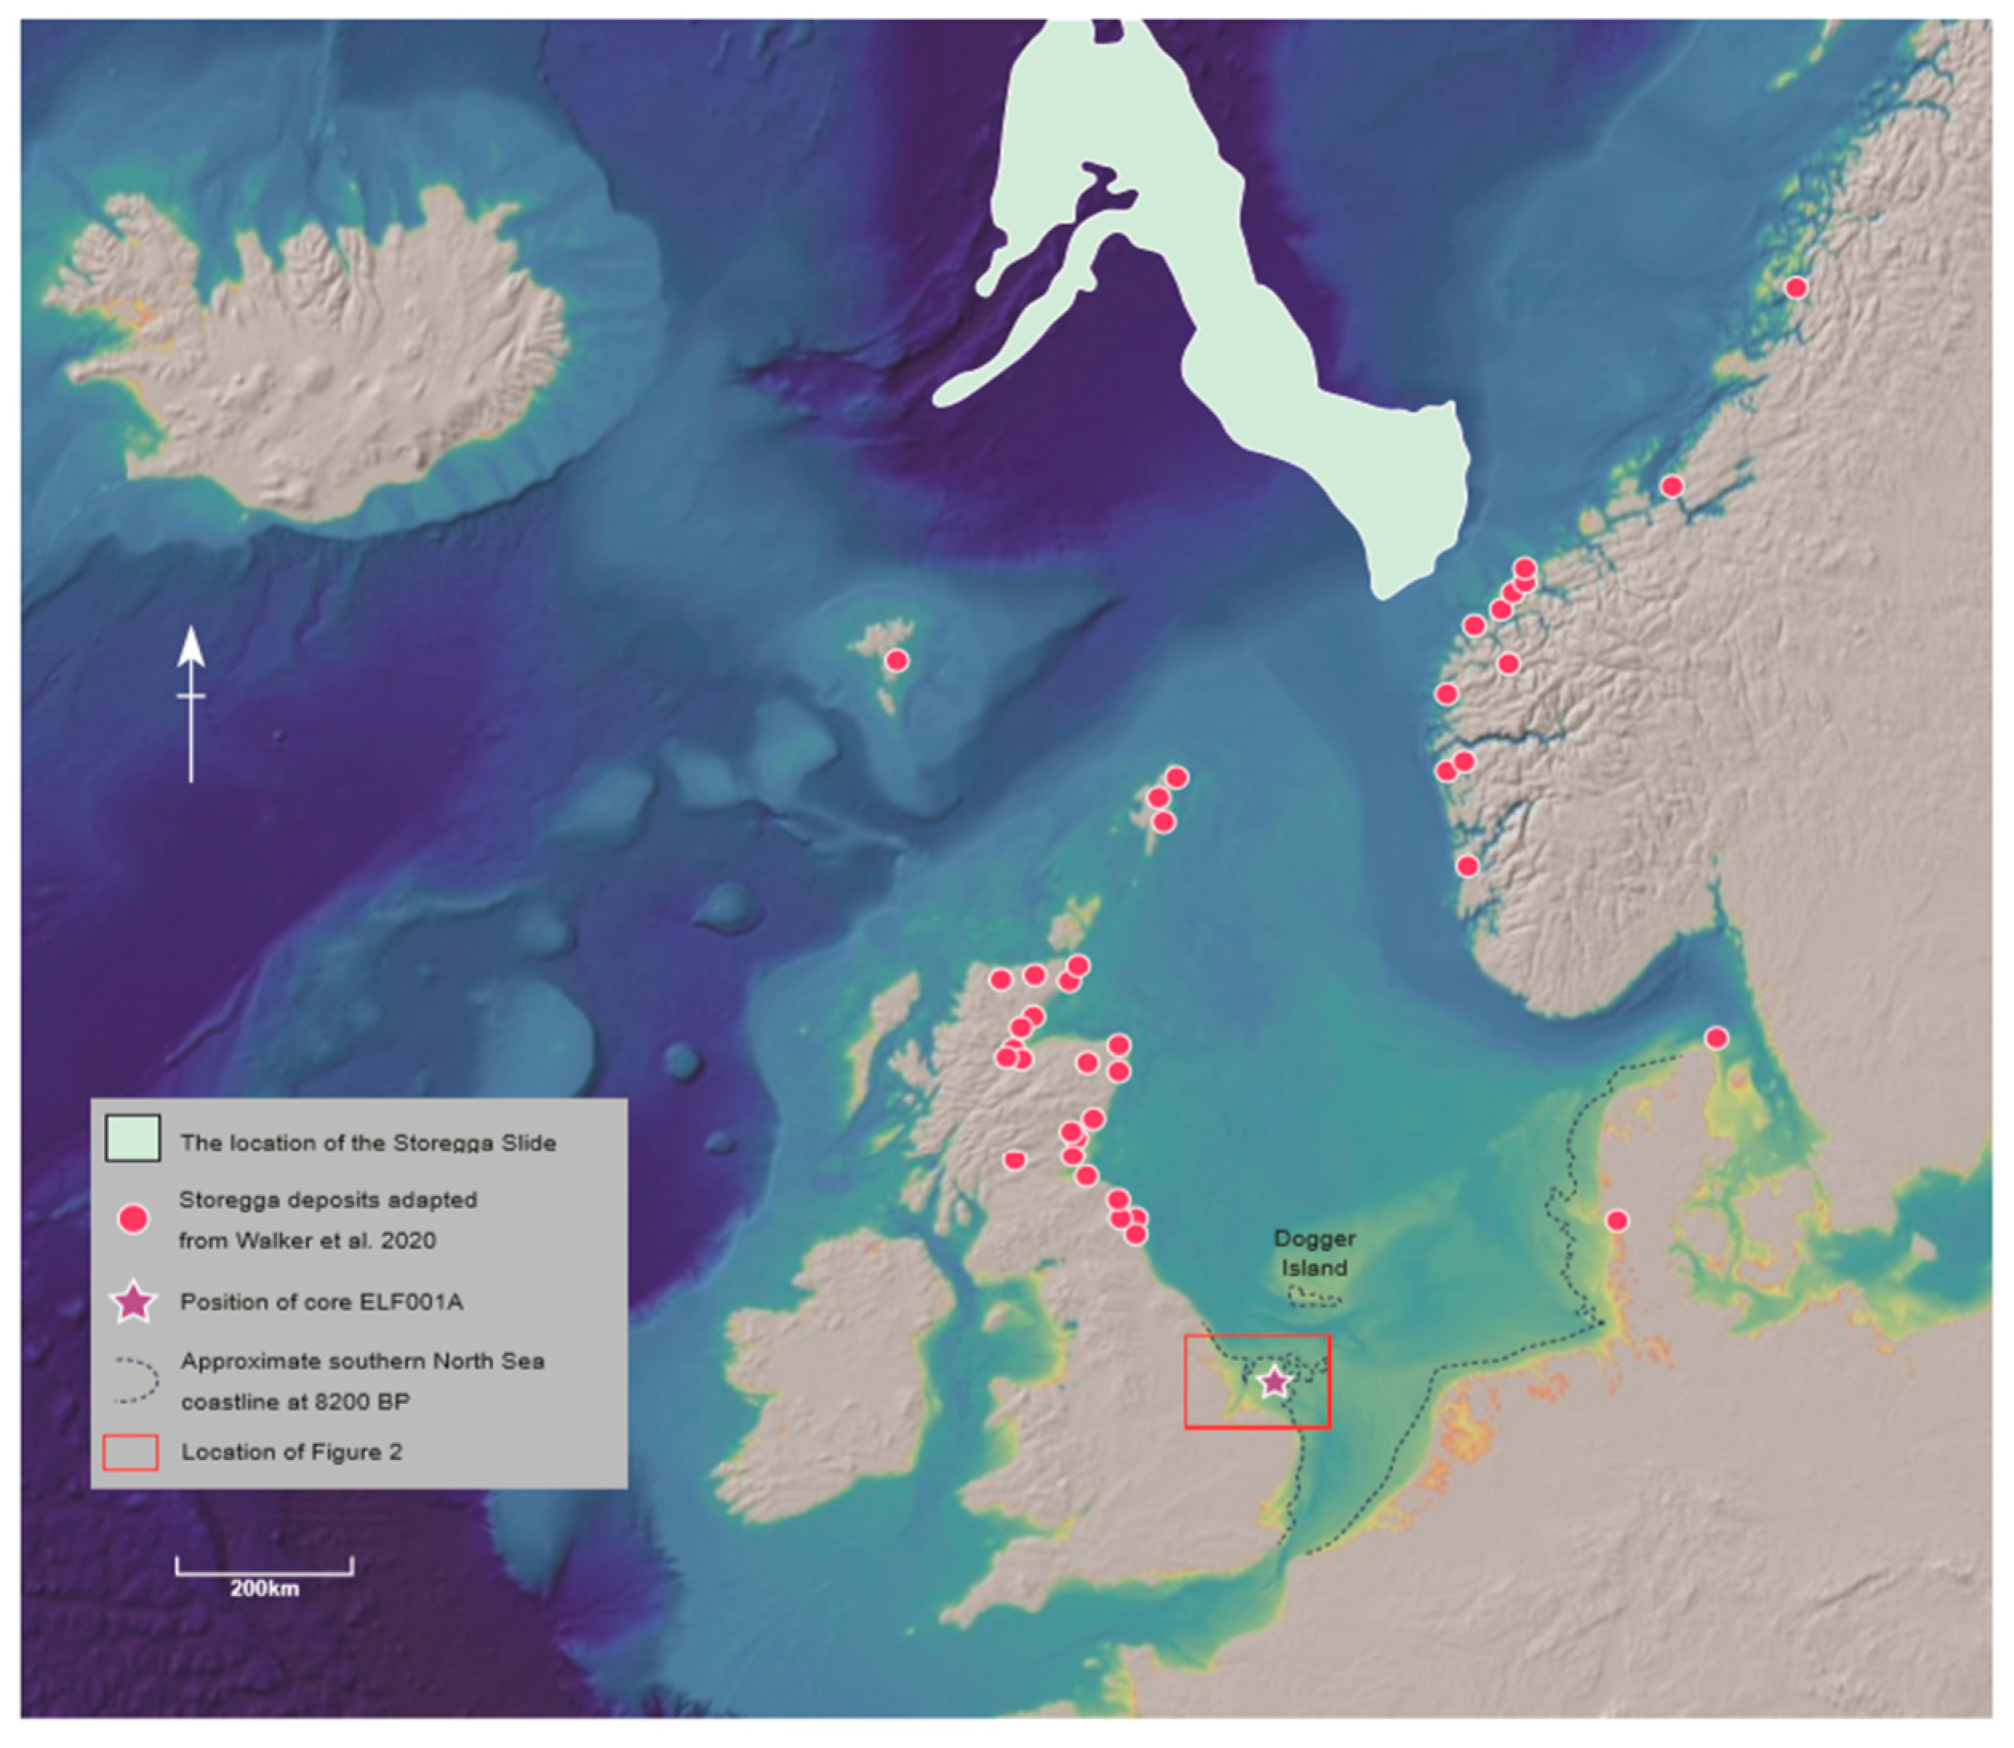
4.1. Reconstruction of the South-Eastern Doggerland Archipelago
From the mega-seismic survey, bathymetric and sea level data we inferred the landscape illustrated in
Figure 2.
The data confirmed that the offshore area associated with Doggerland was, by approximately 8.2 ka cal BP, represented by an archipelago and small stretches of coastal plain off the eastern coast of England. Within the residual plain were a series of palaeochannels representing river systems within glacial valleys that have been incised through Late Devensian terminal moraines [
20]. These included a channel associated with the Outer Dowsing Deep, for which we used the term the Southern River. This channel runs north to south terminating in north and south-facing headlands that delineate a central basin with associated low-lying watershed. A restricted area around the central basin was associated with a distinct but discontinuous seismic signal suggestive of an anomalously distinct and partially eroded stratum.
4.2. Description of the Core ELF001A
Whilst a full core description is given in
Supplementary Information Table S1, a summary is provided here. The base of the core consists of dark grey finely laminated silts and fine sands from 3.5 m to approximately 1.52 m depth beneath seafloor (unit 1a-7). The sub-horizontal laminations, up to 1 cm thick are demarcated by occasional brown organic laminae. At 1.52 m there is a very sharp contact boundary suggestive of an erosional event. Above this contact grey, medium grain sand with freshly broken shell fragments, whole shells and small stones (up to 3 cm in size) exhibit six discrete sequences each of upward-fining sediment (unit 1a-6). At 1.19 m this sequence fines to a dark grey silty sand that is moderately compact (unit 1a-5). At 1.09 m another sharp contact is encountered after which dark grey very well laminated silty sands once again show horizontal laminations of 2–4 mm thickness (unit 1a-4). From 0.90 m to the surface grey to yellow medium sand is loosely consolidated and shows evidence of bioturbation (units 1a-3 to 1a-1).
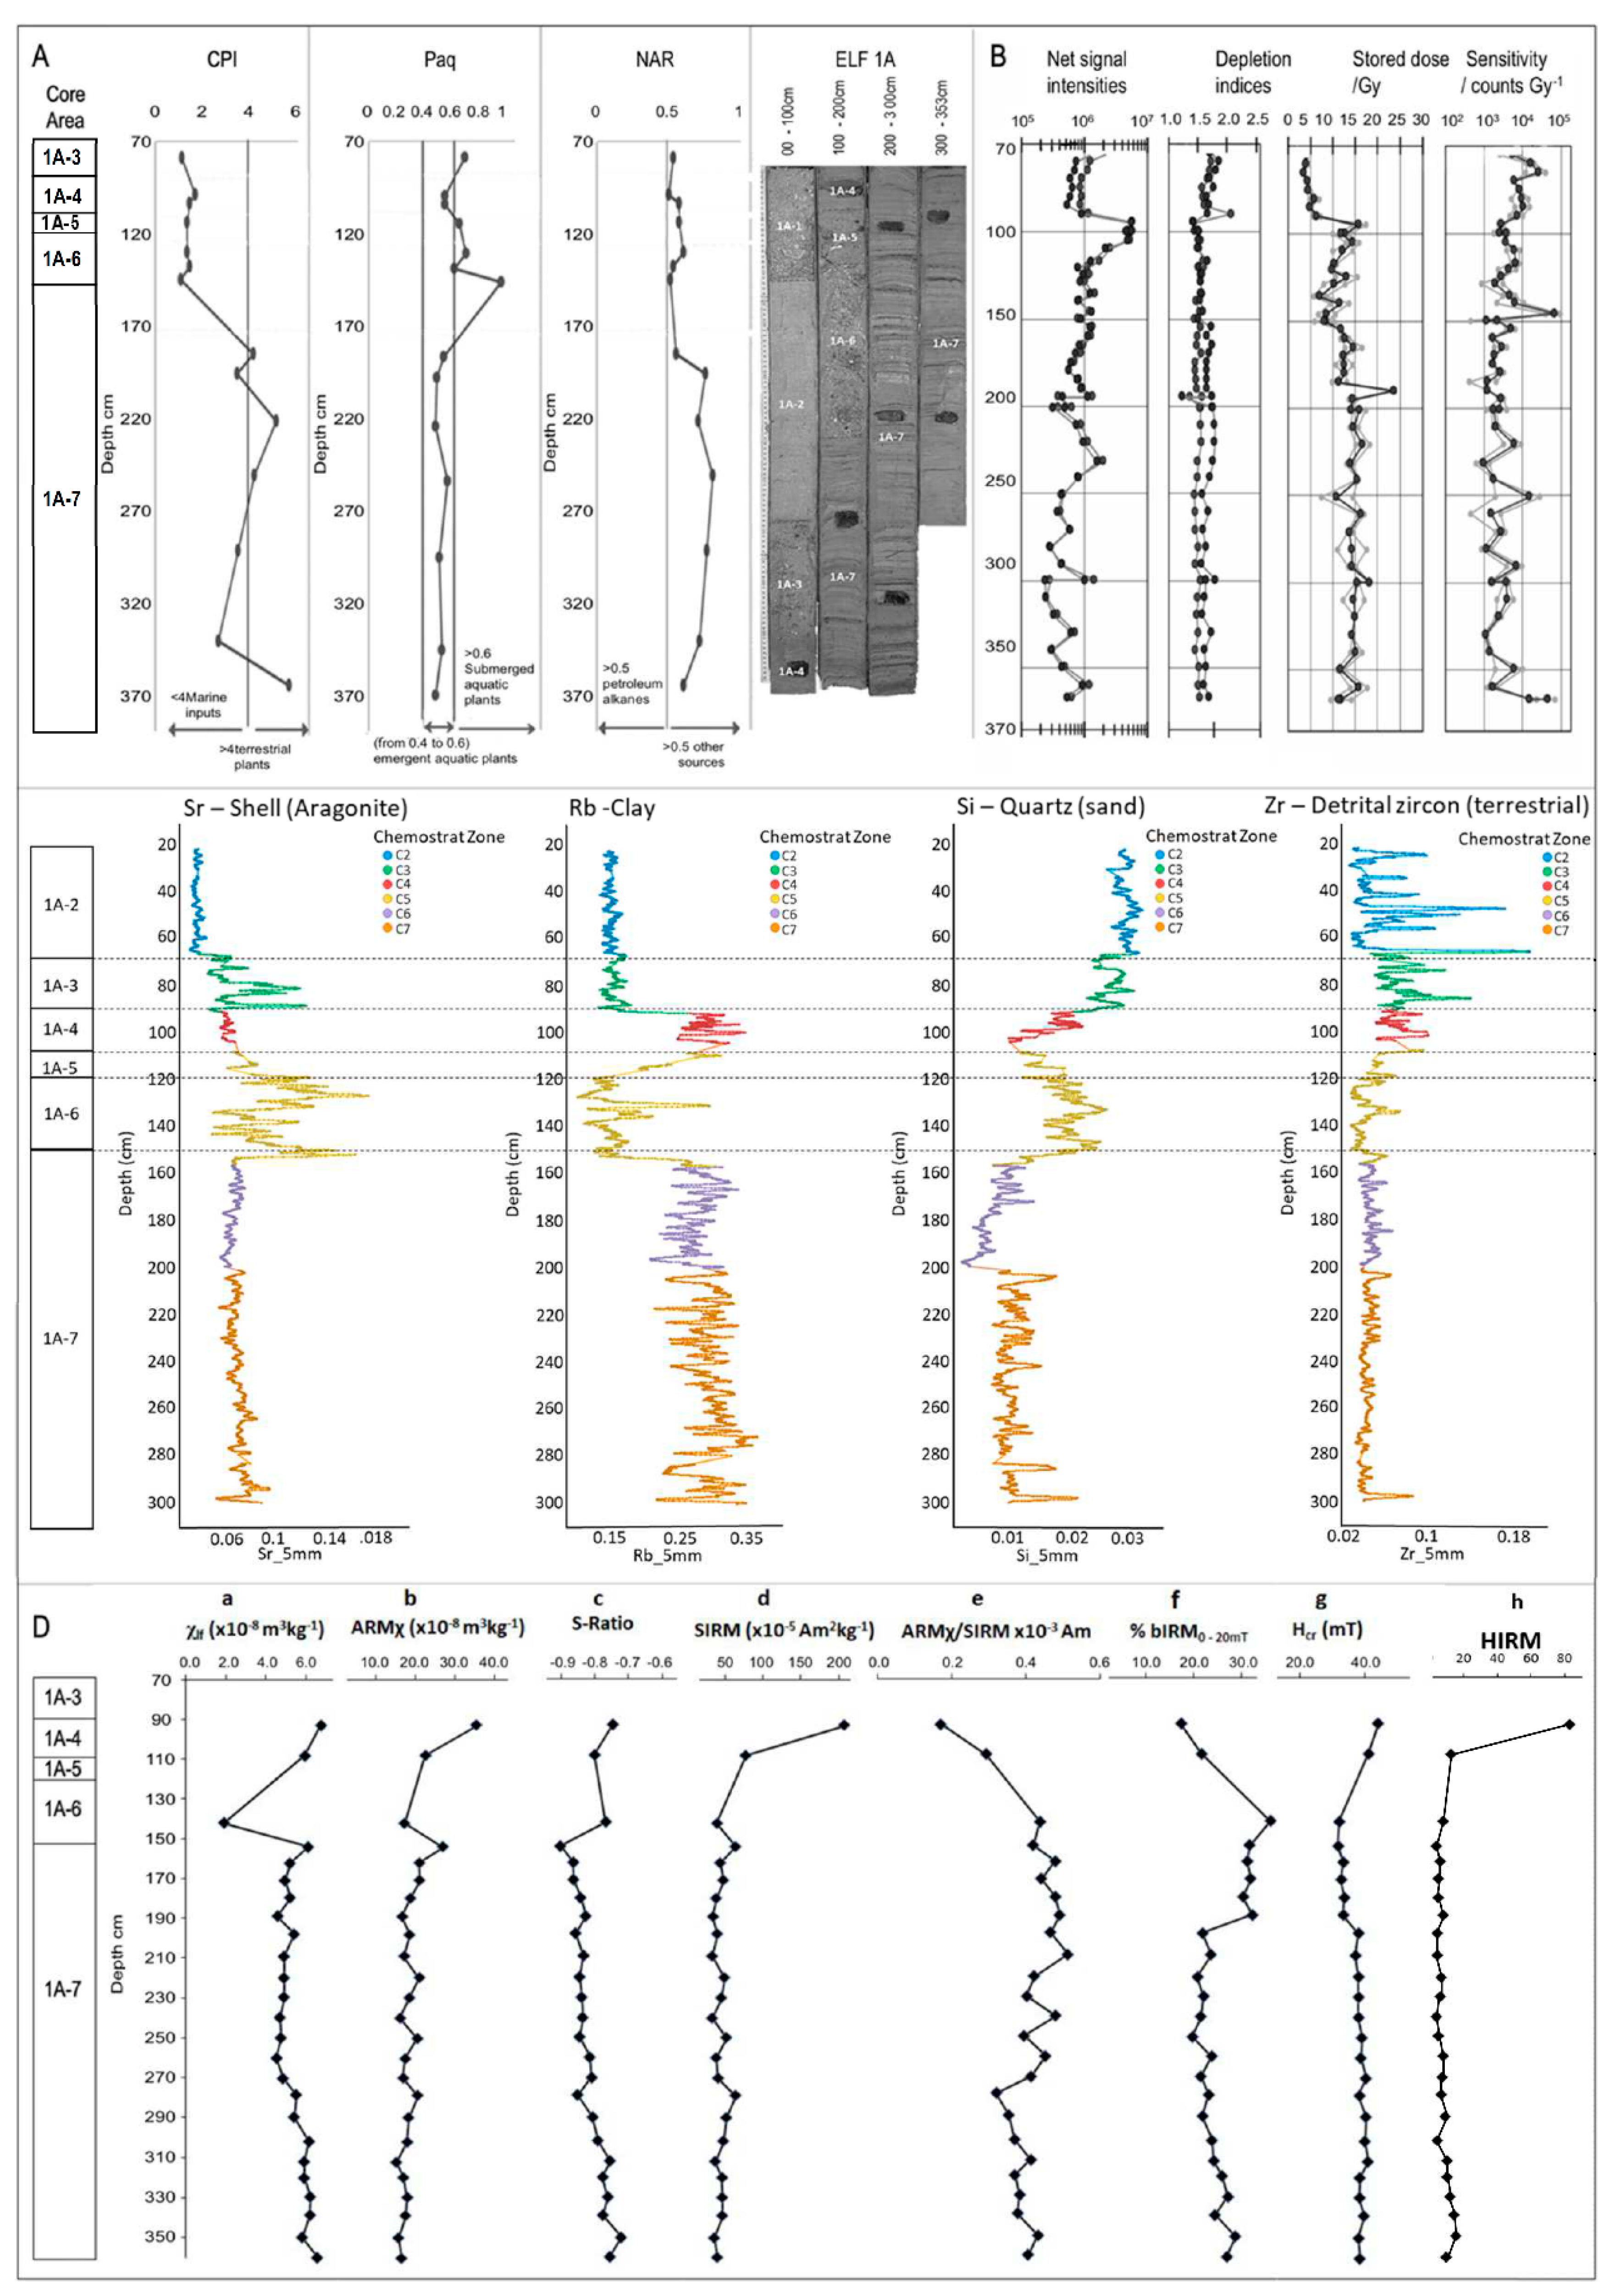
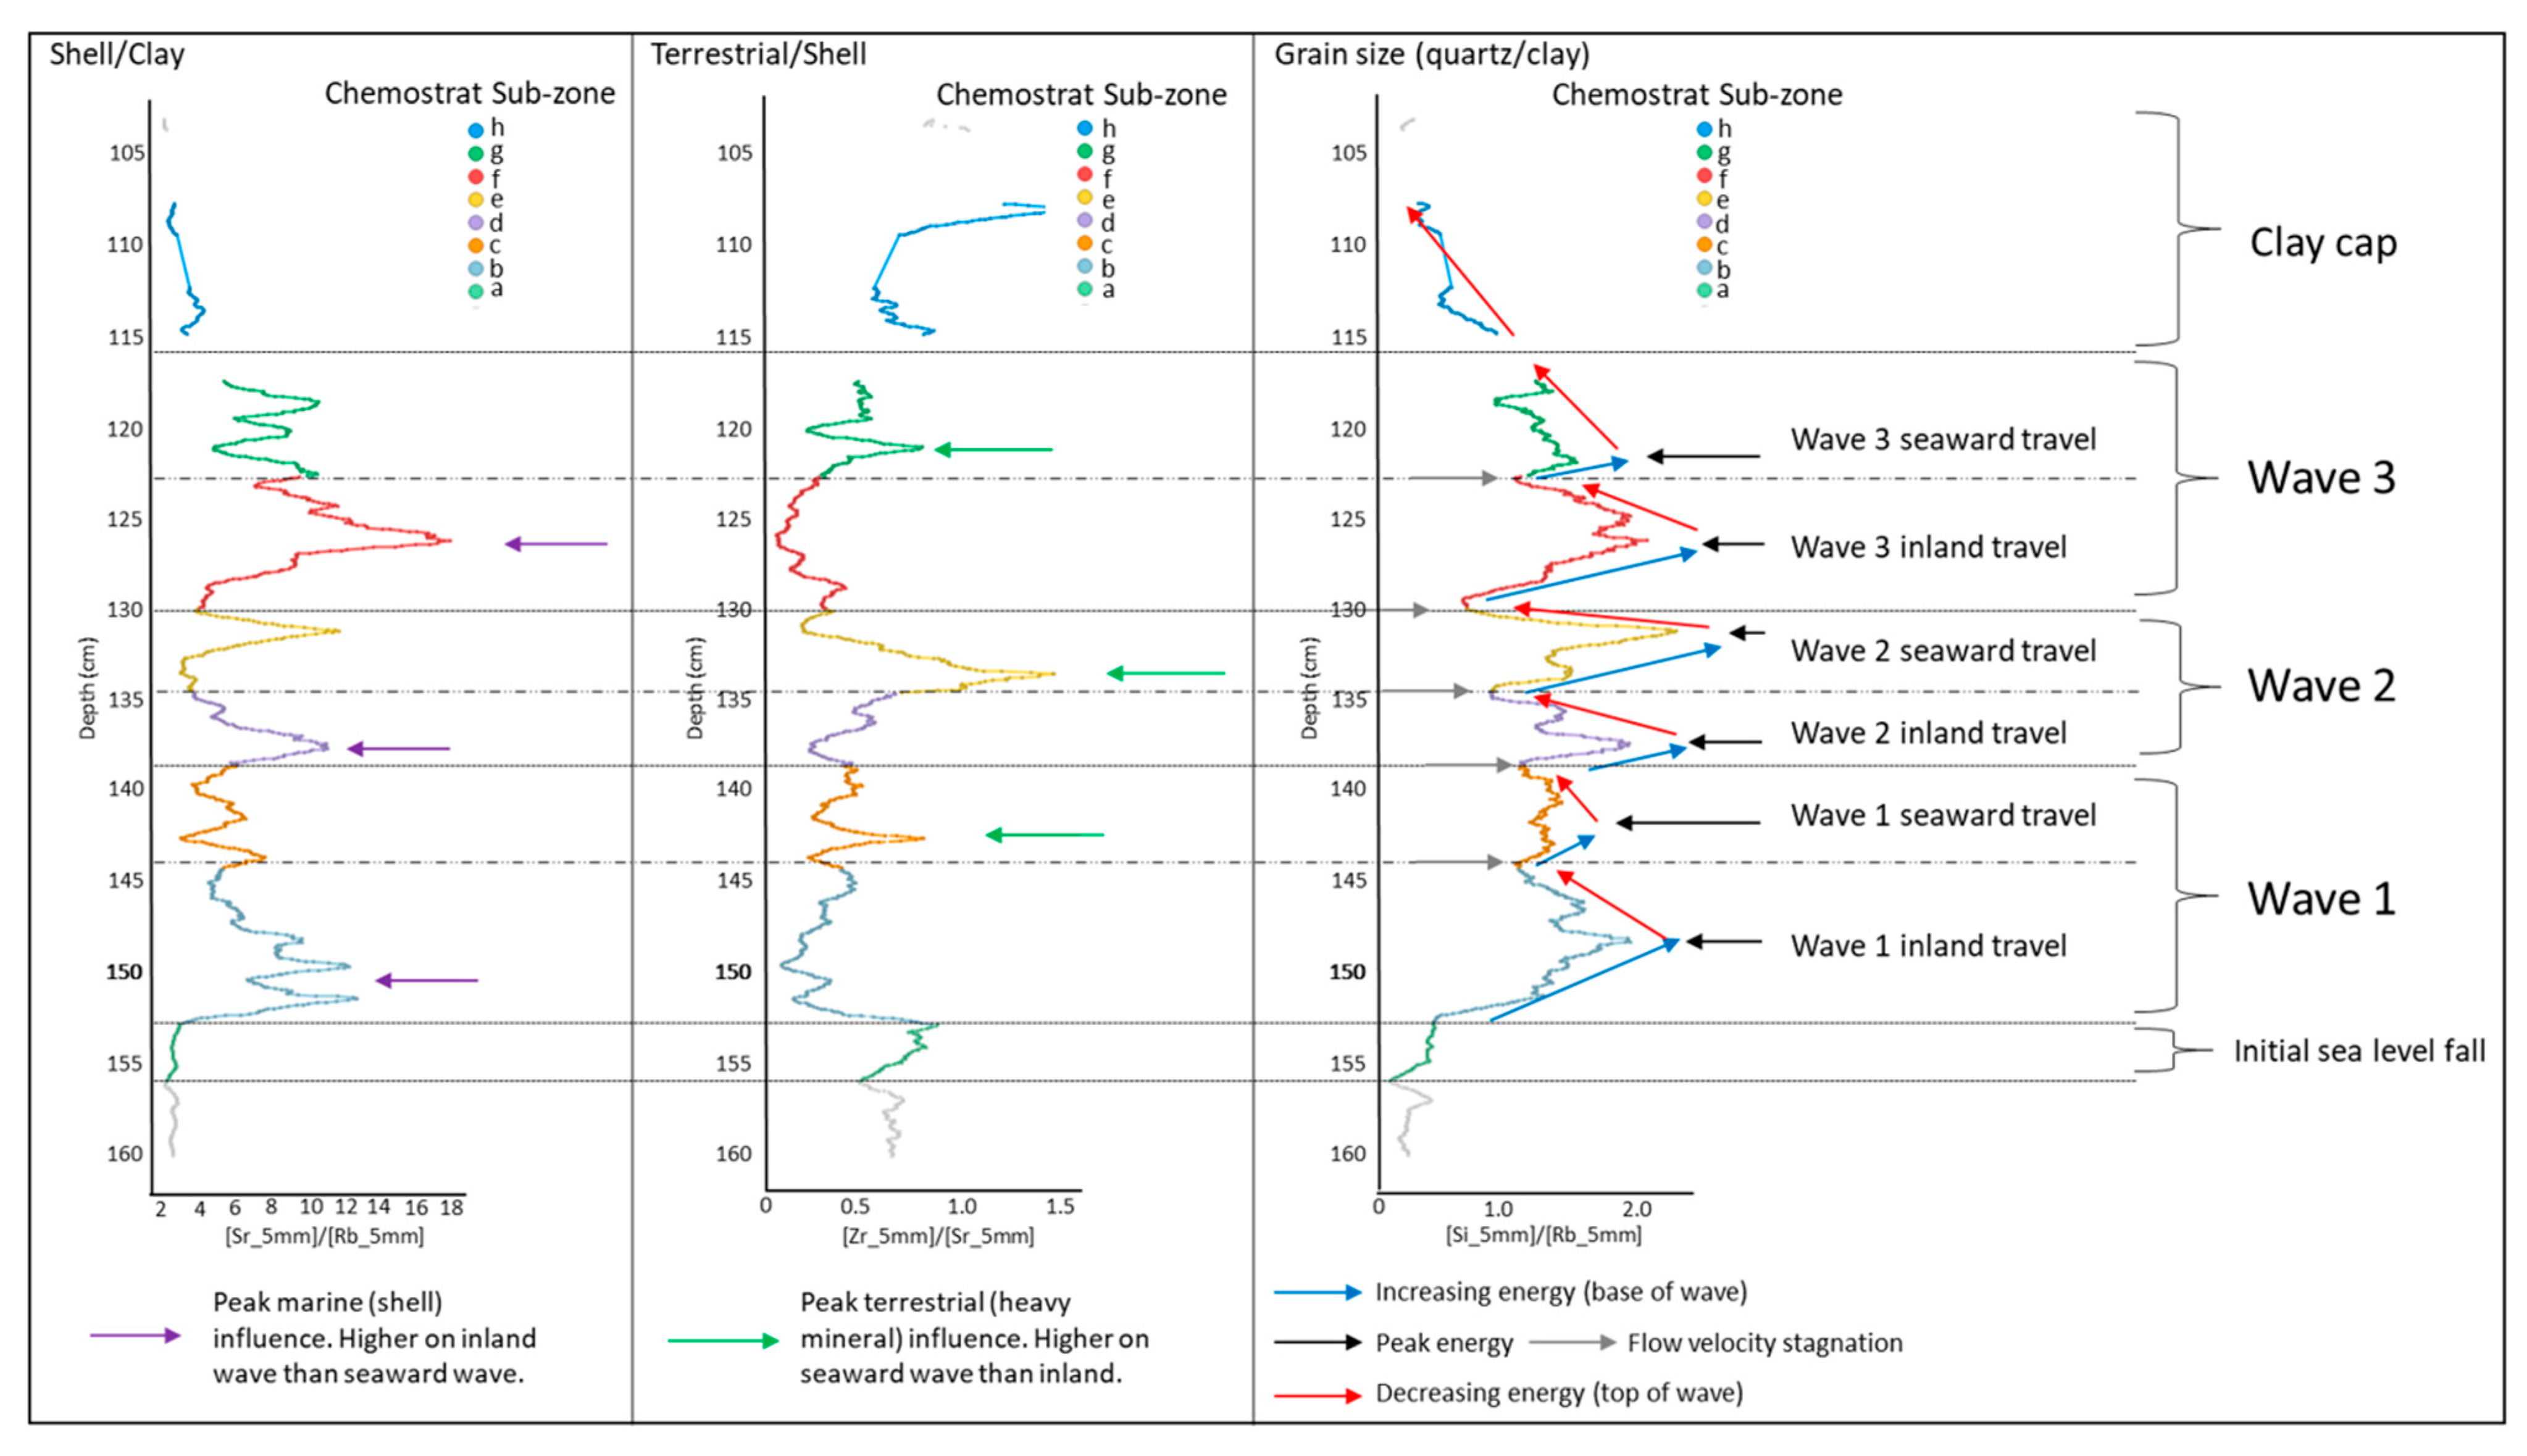
4.3. Physical Properties of Core ELF001A
Sediment properties, geochemistry, remnant magnetism and OSL dating results are shown in
Figure 3 for the whole core ELF001A and in
Figure 4 for the key section of core between depths of 1.00 m and 1.60 m. The geochemical data was acquired at 500 µm resolution but is plotted using a running average of +/−5 mm. A suite of 14 elements had detection limits above background levels including Si, Cl, K, Ca, Ti, Mn, Fe, Ni, Zn, Br, Rb, Sr and Zr. In order to compensate for potential effects of tube aging and beam intensity, the Compton scattering data was ratioed to the Rayleigh scattering data as detailed by Fortin et al. [
21] to provide a semi-quantitative density value, Rho, for the sediment. Principal component analysis was conducted (
SI Text S2.3) to establish potential environmental indicators inferred from the chemical elements and elemental ratios (
SI Text S2.1). Elements showing grouping with discriminative signals included detrital (Si, Ni and Zr), clay (K and Rb), carbonate (Ca and Sr) and oxides (Mn, Fe, Ti and Zn) with elements plotting separately including Br, Cl and S. Sr, Rb, Si and Zr were used to chemically zone the core into key chemo-stratigraphic sequences (
Figure 3C).
From a review of geochemical application in tsunami deposit analysis Chagué-Goff et al. [
22] suggested that three key ratios of elemental proxies are important, namely:
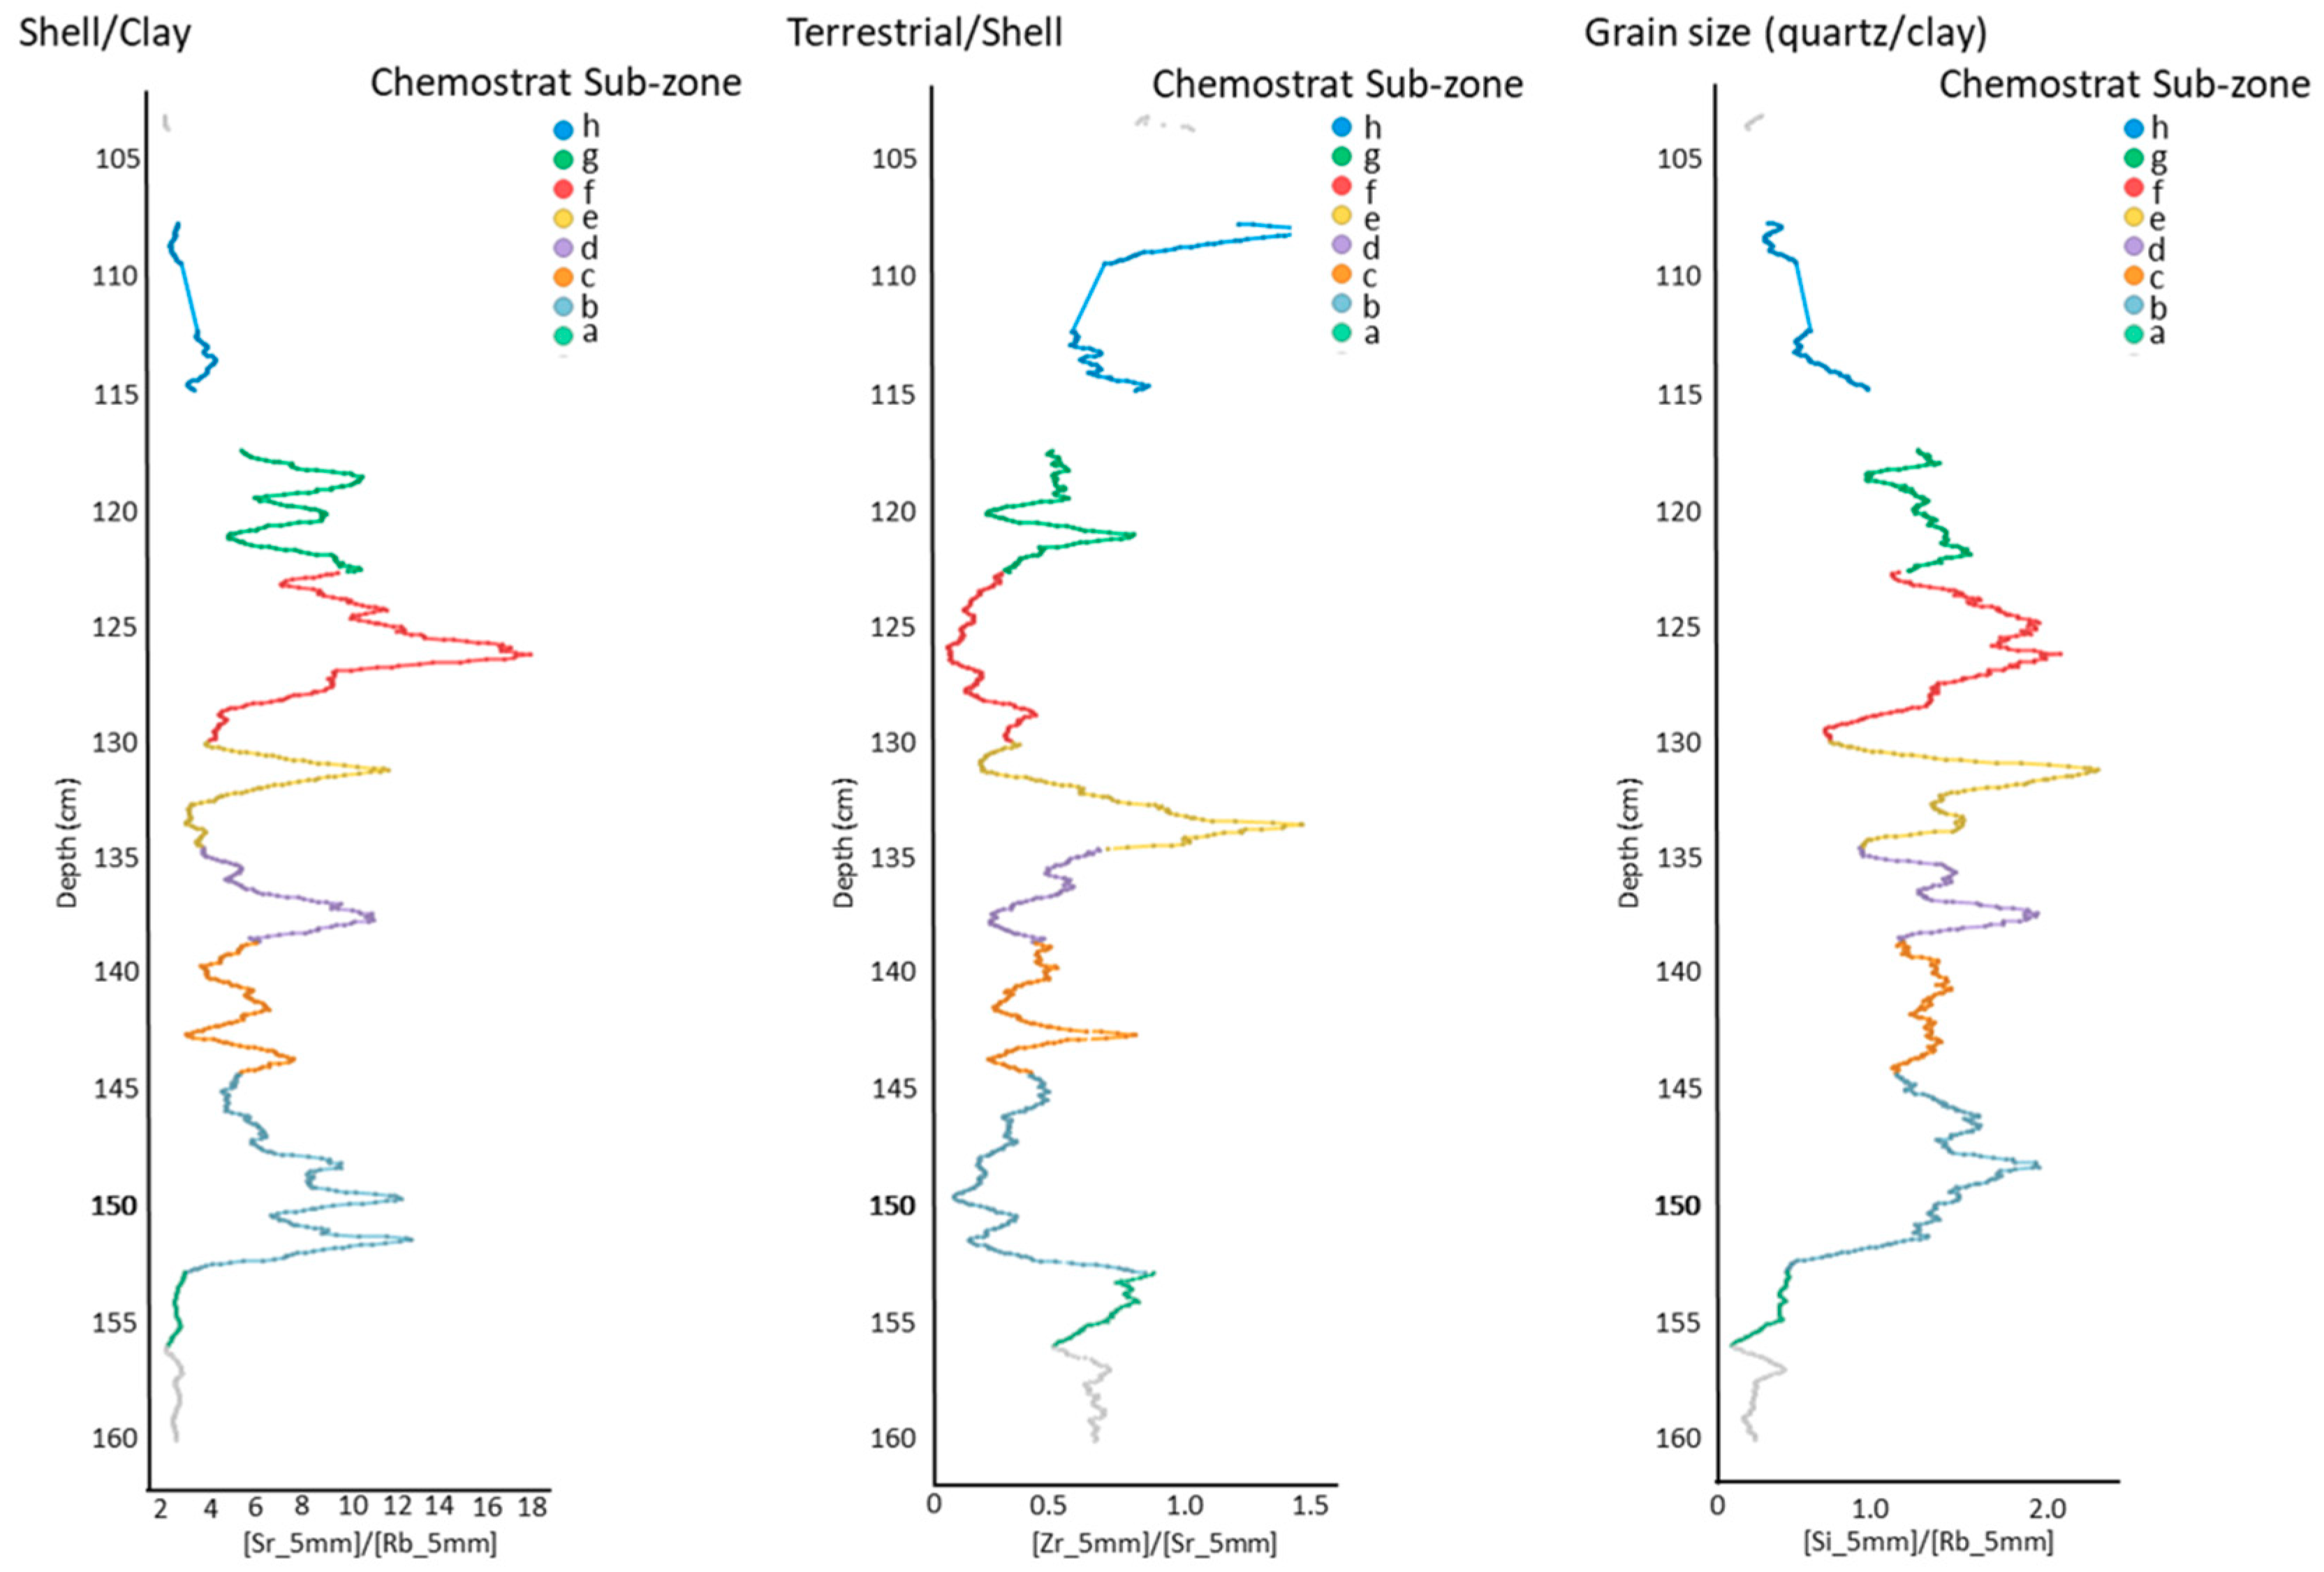
Sr/Rb—marine signature reflecting the chemical proxy for aragonite as shell content vs. clay content
Si/Rb—grain size proxy reflecting the chemical proxy for quartz (coarser sand grain) vs. clay content
Zr/Sr—a terrestrial vs. marine sediment chemical proxy based on the input of detrital zircons
The ratios were used to chemically zone the core into key chemo-stratigraphic sequences (
Figure 4). The base of the core (chemo-stratigraphic zones C6 and C7) contain low Sr, Si and Zr and high Rb abundances indicating that they are composed of fine clay/silt deposits with only occasional shell fragments as a result of relatively low energy marine conditions. There is a sudden chemical change at 1.52 m, spanning 2 cm of section representing an erosional contact after which low energy conditions are abruptly terminated. This is followed by a zone of increased energy as reflected in a grain size increase, rise in Si and decrease in Rb into zone C5. The basal chemical sub-zone displays an increase in Zr/Sr suggesting that a terrestrial input was initiated after the erosion, possibly as a result of water retreat seaward drawing a signal from the land. Above this zone six characteristic chemical sub-zone cycles (b–g) are identified, with a further sub-zone at the end of the sequence.
The six cycles are marked by increasing Si/Rb and Sr/Rb at the base (associated with increasing grain size and increasing shell content respectively) to a peak in the middle of the sub-zone, which then decreases (sediment fining-upwards as indicated by the reducing Si/Rb ratio) to the top of the sub-zone. Boundaries between sub-zones are identified by a minima in Si/Rb reflecting flow velocity stagnation. Sub-zones b, d and f all have higher Sr/Rb peaks and lower Zr/Sr peaks than sub-zones c, e and g. Sub-zone c, e and g also display higher Zr/Sr peaks. The relationship of all the ratios would suggest that the sediment in the former sub-zones have a dominant marine source and the latter a more terrestrial source. The minima between zones represents times of lowest energy or stagnation in energy between the events. The last sub-zone (h) also shows rising values in Zr/Sr, which, together with decreasing Si/Rb and Sr/Rb values, reduce to levels that were recorded in zone C6 prior to the sudden change within unit C5. Unit C4 contains high Rb values, low Sr and increasing Si values reflecting the transitional from fine to coarse material with little shell input. The sequence terminates by a unit that shows low Rb, the lowest Sr and the highest Si abundances seen in the core typical of recent marine sands.
The iron-bearing minerals in the sediments can relate to several factors in the depositional environment including the source, transport and deposition mechanisms of the sediment. Palaeomagnetic data taken from sub-samples at 0.1 m intervals show signatures associated with low or no change in the detrital input from the base of the core to approximately 1.50 m (
Figure 3D). From approximately 1.10 m to 1.50 m the core is characterized by lower χlf values than the preceding unit, together with a reduction in fine-grained magnetite (ARMχ). This suggests that the material is from a different origin to the local sediment supply as it contains a lower abundance of single domain particles. The S-ratio throughout this interval shows a higher concentration of haematite and goethite. However, this is not mirrored by the Hard IRM proxy or the coercivity of remanence, suggesting that the magnetic behaviour is the result of multi-domain magnetite co-existing with fine grained greigite. Above 1.10 m, SIRM and magnetic susceptibility suggest a much greater abundance of magnetic minerals.
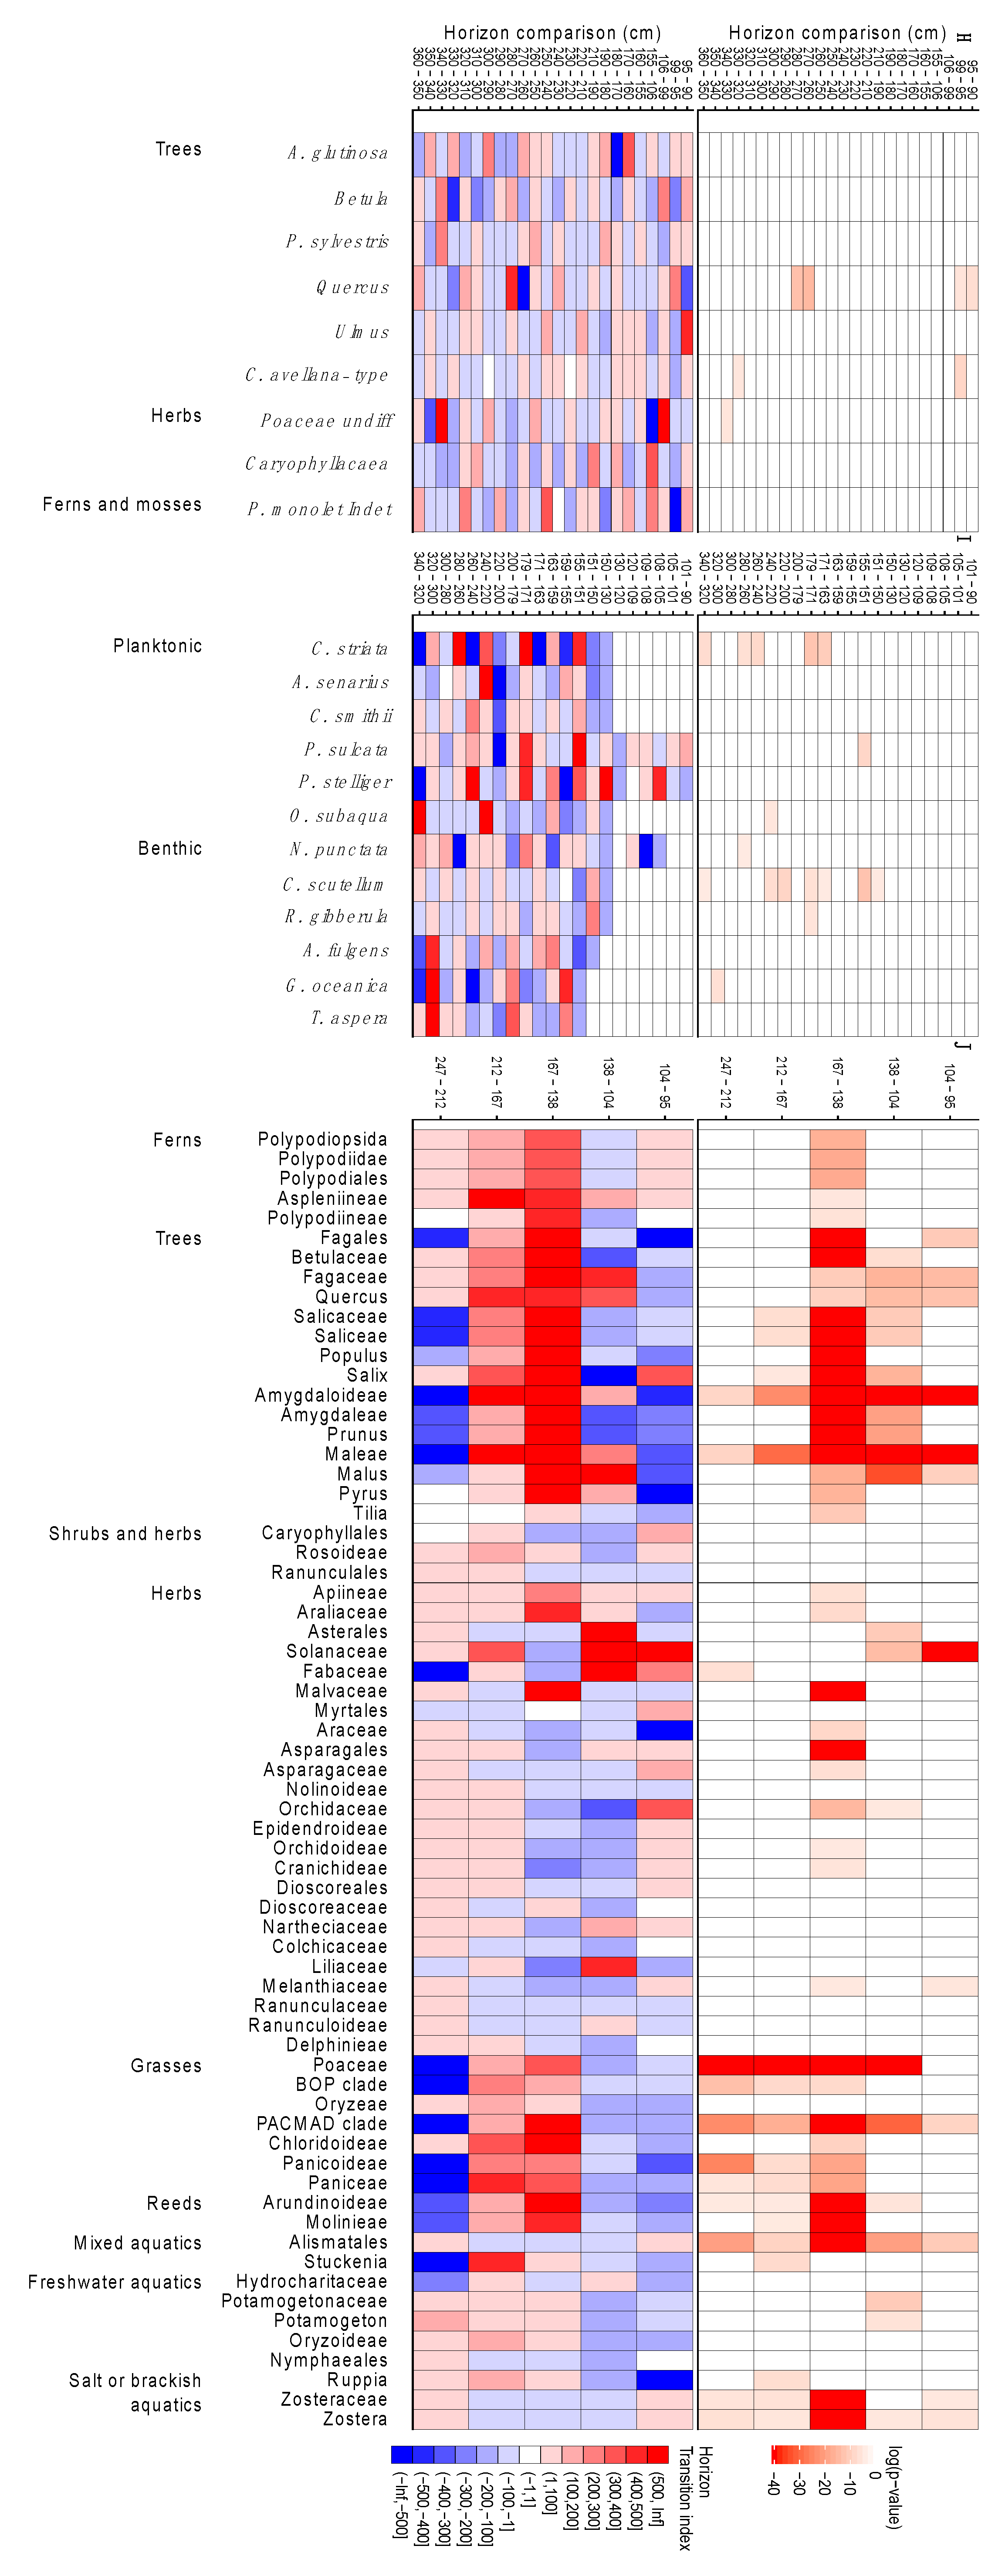
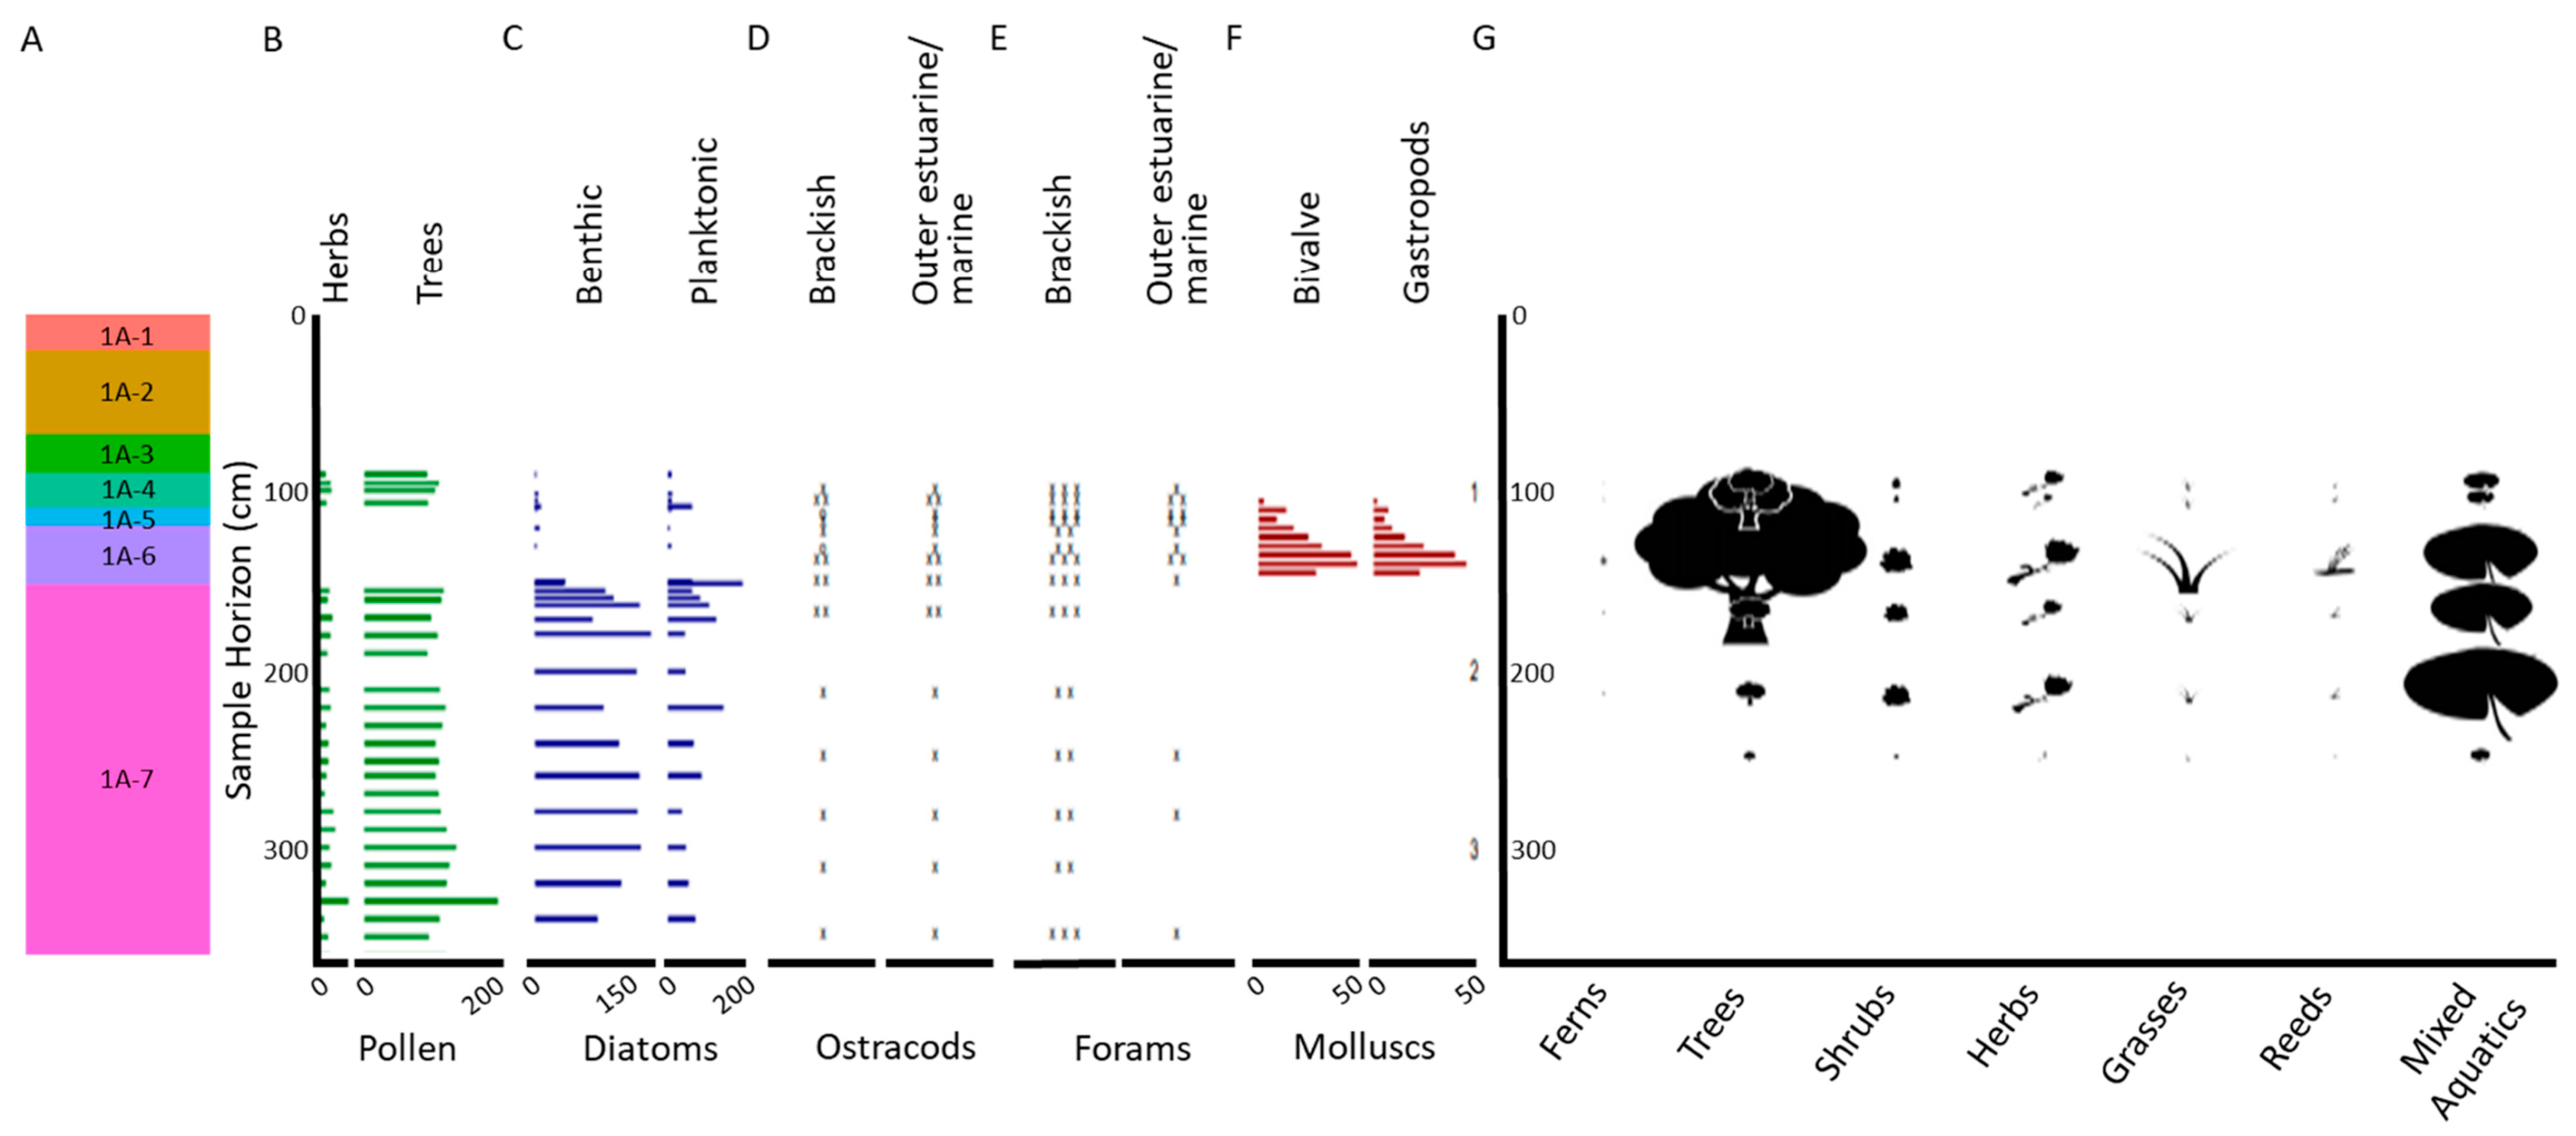
4.4. Palaeoenvironmental Characterization of ELF001A
We further confirmed the nature and source of this stratum using multiple palaeoenvironmental proxies (
Figure 5). Proxies included foraminifera, ostracods (
SI Text S4.1), pollen (
SI Text S4.2), diatoms (
SI Text S4.3), molluscs (
SI Text S4.4) and sedimentary ancient DNA (sedaDNA,
SI Text S4.5). Relatively low levels of cytosine deamination and fragmentation patterns consistent with ancient DNA of this age and environment [
23] were observed firstly by mapping sedaDNA to Quercus, Corylus and Betula genomes applying conventional mismatching approaches [
24] (
Figures S17 and S18), and secondly applying a novel metagenomic assessment methodology in which all sedaDNA is assessed for deamination damage, which may be more suitable for this data type (
Figure S19). We then further tested sedaDNA for stratigraphic integrity to assess possible biomolecule vertical movement in the core column (
Figure S20).
Figure 5 shows that the sedaDNA demonstrates highly significant differentiation between strata indicating a lack of movement post deposition. Together, these tests indicate that authentic sedaDNA was retrieved and most likely represent the original depositional environment. Interestingly, the same stratigraphic tests applied to pollen generally show a lack of differentiation between strata, indicating both a consistent influx of pollen from the surrounding area from oak, hazel woodland and that the sedaDNA derived from sources other than pollen, as has been previously suggested in other sedimentary contexts [
25]. This suggests a taphonomy in which the sedaDNA represents a local signal relative to a more regional palynological signal.
The environment prior to this dramatic event, and recorded in the underlying stratum Unit 1A-7, was an estuarine mudflat typified by predominantly benthic epiphytic and epipelic diatom communities and brackish foraminifera and ostracods, with a sedaDNA floral profile of Zostera and Potamogeton as well as members of the Hydrocharitaceae and Araceae present. This was surrounded by an area with a strong meadow influence that is also apparent in the sedaDNA profile including buttercups, orchids, mallows and asterids. Further, an open woodland is suggested close by,
Figure S20.
By contrast the underlying unit 1A-6 is characterized by an abrupt change in both microfossil and sedaDNA evidence. There is an absence of diatoms and pollen; an increase in outer estuarine or marine taxa of ostracods and foraminifera; the appearance of fractured molluscan shells from different and incompatible habitats including sublittoral, intertidal and brackish species; and the sudden and significant influx of all woody taxa in the sedaDNA profile (
Figures S16 and S20 and Table S12). A novel measure of relative biomass, biogenomic mass, based on sedaDNA and genome size (
Figure S20), suggests a higher biomass of trees than either Zostera or Potamogeton in this stratum, although these latter taxa dominate in other strata,
Figure 5 (
Figure S20). Together, these proxies indicate a violent event that brought with it the terrestrially derived debris of surrounding woodland.
After the event in units 1A-4 to 1A-1 the foraminifera and ostracod signal indicate a return to estuarine mudflats with a greater abundance of marine taxa such as Ammonia batavus indicating a more established marine signal than prior to the event,
Table S12. The sedaDNA signal also indicates estuarine taxa such as Zostera, and a meadow influence, although the biogenomic mass appears greatly reduced suggesting more distant proximity of the flora. A faunal signal considerably weaker than the floral was present throughout the core, but shows a significant elevation in count towards the top units (p = 1.0014 × 10
−6), indicating the presence of rodents and larger animals such as bear, boar and cloven hoofed ruminants, as well as higher orders of fish (Acanthomorpha, Eupercaria, Osteoglossocephalai),
Figure S21.
4.5. Dating of Deposit
The depositional ages of the sequence in ELF001A was investigated using OSL (
Figure 3B,
SI Text 3.1) and directed AMS radiocarbon dating (
SI Text 3.2). Luminescence stratigraphies generated for the core, with proxies of net OSL signal intensities and depletion indices (
Figure 3B, columns 1 and 2) and OSL stored dose and sensitivity (
Figure 3B, columns 3 and 4), contextualize depositional ages determined by quartz SAR OSL for units 1a-4 to 1a-7. Units 1A-6 and 1A-5 are dated by quartz SAR OSL to 8.04 ± 0.43 ka and 8.22 ± 0.43 ka, respectively, with a combined age of 8.14 ± 0.29 ka. The base of unit 1a-4 at 105 cm depth in core is dated to 7.16 ± 0.50 ka, and at 1.00m depth to 6.03 ± 0.22 ka.
Lithological units 1a-1 to 1a-7 are characterized by distinct luminescence behaviour described here from oldest to youngest. Unit 1a-7 is sub-divided into two further units, from 1.51 m to c. 2.00 m and deeper than 2.00 m. From 1.51 m to 2.00 m, the proxies show stratigraphic trends with depth indicating a more gradual accumulation than from c. 2.00 m to the base of the core where the proxies fluctuate around central tendencies marked by more rapid accumulation. Units 1a-5 and 1a-6 show a cyclicity with ‘couplets’ characterized by paired zones with low OSL intensities/high depletion indices and higher OSL intensities/low depletion indices. Within this unit inclusions of shell fragments were dated to 9.26-8.93 ka cal BP (at 95.4%; 8.34 ± 0.3 ka BP, Beta-505683) by radiocarbon AMS dating.
Unit 1a-4, shows a step-change in OSL intensities and stored doses across the 1a-4/1a-3 boundary demonstrating a change in depositional dynamics, and further that the quartz here was likely sourced from a different provenance. Units 1a-2 to 1a-3 show a normal signal-depth progression in these proxies resulting from gradual accumulation with no temporal breaks. Finally, Unit 1a-1 is characterized by fluctuating OSL intensities and variable OSL stored doses with no stratigraphic coherence showing these sands are derived from a highly mobile sequence.
6. Conclusions
Our evidence shows that the Storegga tsunami impacted coastlines in the area of the southern North Sea covered by this study. In these coastal areas, where Mesolithic human populations may have resided for most of the year, settlement would have been badly affected. The multi-proxy evidence suggests the landscape recovered temporarily and hence confirms that the final submergence of the remnant parts of Doggerland occurred after the Storegga tsunami. At the same time, the remaining local terrestrial landscape is suggested to have been more open or that realignment of the drainage networks was responsible for bringing in sedaDNA from more open contexts. Occupation could therefore have continued after the tsunami retreated, but within a much-modified coastal landscape before early-mid Holocene eustatic sea-level rise was responsible for finally submerging the remnant Doggerland lowlands and its associated Mesolithic communities.
The multi-proxy methodological approach applied to the analysis of cores within this project has provided one of the most complete data sets for investigation of tsunami morphology to date. The approach is not typical in either terrestrial or marine investigations but is to be recommended if the maximum information about past changing landscapes is to be gained. Further, the approach holds great promise for wide area reconstructions of palaeogeography, environments and human occupancy where a greater understanding of the impact of large natural events is needed.