Article

Constraining Basin Parameters Using a Known Subsidence History

by
Mohit Tunwal
1,2,*,
Kieran F. Mulchrone
2 and
Patrick A. Meere
1
1
School of Biological, Earth and Environmental Sciences, University College Cork, Distillery Fields, North Mall, T23 TK30 Cork, Ireland
2
School of Mathematical Sciences, University College Cork, Western Gateway Building, Western Road, T12 XF62 Cork, Ireland
*
Author to whom correspondence should be addressed.
Geosciences 2020, 10(7), 263; https://doi.org/10.3390/geosciences10070263
Submission received: 5 June 2020 / Revised: 3 July 2020 / Accepted: 6 July 2020 / Published: 9 July 2020
(This article belongs to the Special Issue Temperature in Sedimentary Basins)

Abstract

:
Temperature history is one of the most important factors driving subsidence and the overall tectono-stratigraphic evolution of a sedimentary basin. The McKenzie model has been widely applied for subsidence modelling and stretching factor estimation for sedimentary basins formed in an extensional tectonic environment. Subsidence modelling requires values of physical parameters (e.g., crustal thickness, lithospheric thickness, stretching factor) that may not always be available. With a given subsidence history of a basin estimated using a stratigraphic backstripping method, these parameters can be estimated by quantitatively comparing the known subsidence curve with modelled subsidence curves. In this contribution, a method to compare known and modelled subsidence curves is presented, aiming to constrain valid combinations of the stretching factor, crustal thickness, and lithospheric thickness of a basin. Furthermore, a numerical model is presented that takes into account the effect of sedimentary cover on thermal history and subsidence modelling of a basin. The parameter fitting method presented here is first applied to synthetically generated subsidence curves. Next, a case study using a known subsidence curve from the Campos Basin, offshore Brazil, is considered. The range of stretching factors estimated for the Campos basin from this study is in accordance with previous work, with an additional estimate of corresponding lithospheric thickness. This study provides insight into the dependence of thermal history and subsidence modelling methods on assumptions regarding model input parameters. This methodology also allows for the estimation of valid combinations of physical lithospheric parameters, where the subsidence history is known.

1. Introduction

The thermal history of a sedimentary basin is inherently associated with the basin’s tectono-stratigraphic evolution history. Changes in temperature in a sedimentary basin are governed by its geodynamic evolution, and vice versa. The geodynamic evolution history of a sedimentary basin has significant implications for its hydrocarbon bearing potential. McKenzie [1] provided the first physical concept for the formation of sedimentary basins in an extensional setting. According to McKenzie’s model, basin development undergoes two phases: (1) Uniform instantaneous stretching of the lithosphere by pure shear. The thinning of lithosphere results in passive upwelling of the asthenosphere and a rise in the thermal gradient of the stretched lithosphere. (2) Gradual thermal cooling of the lithosphere. The latter phase results in increasing the density of the lithosphere as a result of cooling. Both phases are associated with subsidence owing to isostasy, and thus result in basin formation.
Following this seminal work, a number of modifications to the McKenzie model were suggested. For the lithospheric stretching, simple shear was considered by some researchers [2,3], whereas another model used a combination of simple shear in the crust and pure shear in the lithosphere [4]. Other variations in the mode of the lithospheric stretching include non-uniform (depth-dependent) stretching [5,6] and stretching over a finite (non-instantaneous) time [7]. The following factors primarily affecting the geothermal gradient were considered in some models: the blanketing effect of sediments [8,9], the effect of radiogenic heat production [10], and the effect of magmatic activity [11]. Finally, some models incorporated flexural response of the lithosphere to sediment loading [12,13] and depth of lithospheric necking along with rift shoulder erosion [14,15].
McKenzie’s model presents an analytical solution for basin subsidence [16]. Numerical modelling allows relaxation of certain assumptions that were necessary to derive an analytical solution [10,17]. For example, the effect of sedimentary cover on thermal cooling is considered to be negligent in the McKenzie model. A numerical model in 1-dimension is presented here, which considers the effect of sediment cover during thermal subsidence. Subsidence models, whether analytical or numerical, are as good as the assumptions they use. All of these models depend upon the values taken for physical parameters such as density and thickness of crust and lithosphere. The aim of this paper is to compare subsidence profiles estimated through the backstripping method [18,19] with forward subsidence models (i.e., McKenzie’s analytical model and the numerical model introduced here) and to explore optimum estimation of values for stretching factor, crustal, and lithospheric thickness. Some earlier studies have attempted the curve fitting approach; however, their aim was limited to the evaluation of only the stretching factor [20,21,22]. The multi-parameter estimates from this study may feed into more comprehensive and sophisticated basin models (e.g., [23,24]).
In this paper, a numerical approach that incorporates the effect of sedimentary cover is first presented. Next, a simple quantitative method for comparing measured subsidence curves with numerical and/or analytical outputs is proposed over the sample space of stretching factor, crustal, and lithospheric thickness. Finally, the methodology is tested using synthetic data and is then applied to a natural subsidence dataset obtained from the Campos basin, offshore Brazil [25], to estimate a range of stretching factors and lithospheric thicknesses suitable for basin modelling.

2. Numerical Model

The subsidence of a sedimentary basin in an extensional setting is modelled by two separate stages: (i) instantaneous stretching of the lithosphere followed by (ii) gradual thermal cooling. It is assumed that the basin is nourished with sediments and subsidence is closely accompanied by sedimentation. Furthermore, the following is assumed:
(1)
Uniform instantaneous stretching for the initial phase is by pure shear;
(2)
A constant asthenospheric temperature is maintained at a fixed depth equal to initial position of the base of the lithosphere;
(3)
Radiogenic heat production is ignored.
The assumptions listed above are inherited from the classical McKenzie’s model [1]. They help to (a) simplify the thermo-mechanical basin model and (b) present a preliminary generalized version to which further complexities can be added, for future studies, according to any basin specific requirements.

2.1. Initial Stretching

First, the instantaneous stretching phase is considered (see Figure 1).
The sedimentary layer ( s I ) deposited during the instantaneous lithospheric extension is assumed to remain at the surface temperature ( T s ) during the stretching phase, whereas the temperature of the asthenosphere remains constant at T a . The density of crust and mantle at any temperature ( T ) is given by the first order approximation:
ρ c ( T ) = ρ c , 0 ( 1 α T )
ρ m ( T ) = ρ m , 0 ( 1 α T )
where α is the thermal expansion factor and ρ c , 0 and ρ m , 0 are the density of crust and mantle, respectively, at 0   ° C . The density of sediments ( ρ s ) is assumed to remain constant. Owing to the rise of lithospheric temperature after stretching (see Figure 1), the density of the crust and mantle will decrease. However, the thinning of the lithosphere leads to an initial subsidence in order to maintain isostatic equilibrium. The isostasy equation for the pressure at the depth a is given by the following:
0 c ρ c ( T U ( z ) ) d z + c a ρ m ( T U ( z ) ) d z = 0 s I ρ s d z + s I s I + c β ρ c ( T I ( z ) ) d z + s I + c β a ρ m ( T I ( z ) ) d z 1 2 3 4 5
where c and a are thickness of crust and lithosphere, respectively, prior to stretching. The stretching factor β is defined to be the pre-stretched lithosphere thickness divided by the post initial stretching lithospheric thickness. The left hand-side of Equation (3) represents the pressure at the boundary of lithosphere and asthenosphere at depth a before stretching. The temperature dependence of crust and mantle is based on thermal profile T U ( z ) , which is the thermal gradient at undisturbed state prior to stretching Equation (5). The right hand-side of Equation (3) denotes the pressure after uniform instantaneous stretching. The thermal gradient at this state is T I ( z ) for density estimation of the crust and mantle. The integrals terms of Equation (3) are shown in Figure 1 for visualisation. Replacing the density terms in Equation (3) from Equations (1) and (2) gives the following:
0 c ρ c , 0 ( 1 α T U ( z ) ) d z + c a ρ m , 0 ( 1 α . T U ( z ) ) d z = 0 s I ρ s d z + s I s I + c β ρ c , 0 ( 1 α . T I ( z ) ) d z + s I + c β a ρ m , 0 ( 1 α . T I ( z ) ) d z
The thermal gradients T U and T I (see Figure 1) as depth-dependent functions are given by the following:
T U ( z ) = { ( T a T s ) a z + T s , 0 z < a T a , a z
T I ( z ) = { T s , 0 z < s I β a ( T a T s ) ( z s I ) + T s , s I z < s I + a β T a , s I + a β z
Replacing the terms T U ( z ) and T I ( z ) in Equation (4) by Equations (5) and (6) gives the initial subsidence ( s I ) as follows:
s I = ( 1 + β ) ( c ( 2 a c α T a + ( 2 a + c ) α T s ) ρ c + ( 2 a c + ( a 2 + c 2 ) α T a ( a c ) 2 α T s ) ρ m ) 2 a β ( ρ s + ( 1 + α T a ) ρ m )

2.2. Gradual Subsidence

After instantaneous stretching, there is a gradual conductive cooling of the lithosphere, which leads to an increase in crustal and mantle density (Equations (1) and (2)). In order to maintain an isostatic balance, the basin gradually subsides. The model developed here maintains two boundary conditions: (1) at a depth a and below, the asthenospheric mantle is at a constant temperature T a throughout the stretching and cooling phase; and (2) the surface temperature remains constant at T s .
The 1-dimensional equation for conductive cooling is given by the following:
T t κ 2 T z 2 = 0
where κ is the thermal diffusivity, a material property, which is taken to be the same for all layers. This thermal diffusion equation is solved using an implicit Euler’s method [26].
Ongoing basin development owing to thermal subsidence leads to the deposition of a thickening sedimentary layer ( s t at any given time t ) on top of the initially deposited sediments, s I (see Figure 2). During each small time step t , the basin subsides by a small depth s and is instantaneously infilled by sediment. Therefore, s t is the sum of each s for each t up to t . The calculation of s , at each time step, depends upon the isostatic balance of pressure at the depth a . The isostasy equations at time t and t + t are given by Equations (9) and (10), respectively.
The equations compare pressure at depth a after initial stretching at the start of thermal cooling (on the left hand-side) and pressure at the same depth at time t (Equation (9)) and t + t (Equation (10)) respectively. At any time t , the isostasy equation is as follows:
0 s I ρ s d z + s I s I + c β ρ c ( T I ( z ) ) d z + s I + c β a ρ m ( T I ( z ) ) d z = 0 s I + s t ρ s d z + s I + s t s I + s t + c β ρ c ( T ( z , t ) ) d z + s I + s t + c β a ρ m ( T ( z , t ) ) d z 1 2 3 4 5 6
The integral terms are annotated in Figure 2 to their corresponding layers present in the system. They include the term T ( z , t ) , the thermal transient profile at any time t . The isostasy equation at the time t + t is given by the following:
0 s I ρ s d z + s I s I + c β ρ c ( T I ( z ) ) d z + s I + c β a ρ m ( T I ( z ) ) d z = 0 s I + s t + s ρ s d z + s I + s t + s s I + s t + s + c β ρ c ( T ( z , t + t ) ) d z + s I + s t + s + c β a ρ m ( T ( z , t + t ) ) d z 1 2 3 7 8 9
Replacing density terms by Equations (1) and (2) in Equation (10) gives the following:
0 s I ρ s d z + s I s I + c β ρ c , 0 ( 1 α T I ( z ) ) d z + s I + c β a ρ m , 0 ( 1 α T I ( z ) ) d z = 0 s I + s t + s ρ s d z + s I + s t + s s I + s t + s + c β ρ c , 0 ( 1 α T ( z , t + t ) ) d z + s I + s t + s + c β a ρ m , 0 ( 1 α T ( z , t + t ) ) d z
The thermal profile of the isostatic system considered during the cooling stage is affected by the sediments deposited after initial stretching and during the thermal subsidence phase. This can be noted from the inter-dependency of terms s t and T ( z , t ) in Equation (9) and the terms s t + s and T ( z , t + t ) in Equations (10) and (11). Using Equation (8), the thermal profile is calculated numerically at each time step (see Supplementary File: Implicit Method.docx; Numerical Model 1 code.ipynb). Next, the thermal subsidence s is calculated for the time step. This layer of sediment s is then added to the system for lithospheric cooling and the thermal profile is calculated for the next time step. However, because s is dependent upon the integral of the term T ( z , t + t ) in Equation (11), the following simplifying approximations are required to solve the equation:
q 1 = ρ c , 0 . α s I + s t + s s I + s t + s + c β T ( z , t + t ) d z ρ c , 0 . α s I + s t s I + s t + c β T ( z , t ) d z
q 2 = ρ m , 0 . α s I + s t + s + c β a T ( z , t + t ) d z ρ m , 0 . α s I + s t + c β a T ( z , t ) d z
In other words, the temperature profile in the lithosphere and asthenosphere throughout the time step, that is, from t to t + t , is approximated by the profile at time t . Using the approximations in Equations (12) and (13), the thermal subsidence for a given time step is calculated as follows:
s = c 1 + α T a ρ m , 0 ( a s I ) s t ( ρ m , 0 ρ s ) q 1 q 2 + c 2 ρ m , 0 ρ s
where the terms c 1 and c 2 are constants given by the following:
c 1 = α T a ( c 2 ( ρ c , 0 ρ m , 0 ) a 2 ρ m , 0 ) 2 a β
c 2 = α . T s ( c . ρ c , 0 ( 2 a c ) + ρ m , 0 ( a c ) 2 ) 2 a β
The thickness of the sedimentary layer deposited during thermal subsidence ( s t ) varies from 0 at the start of cooling to s F t at t . The depth a in the mantle is assumed to remain at a constant temperature T a according to the boundary condition. Thus, at t with the thermal equilibrium of the cooling system, the final thermal profile for this model will be T F ( z ) = T a z / a . Please note that the final thermal profile T F ( z ) is same as the thermal profile of the system before initial stretching T U ( z ) . Another numerical model was considered (see Supplementary File: Numerical Model 2.docx; Numerical Model 2 code.ipynb) in which the uppermost point in the asthenosphere, which remains at a constant temperature T a , subsides with the rate of thermal subsidence. However, it was found that the subsidence results do not vary significantly from the model presented here.

3. Curve Fitting Method
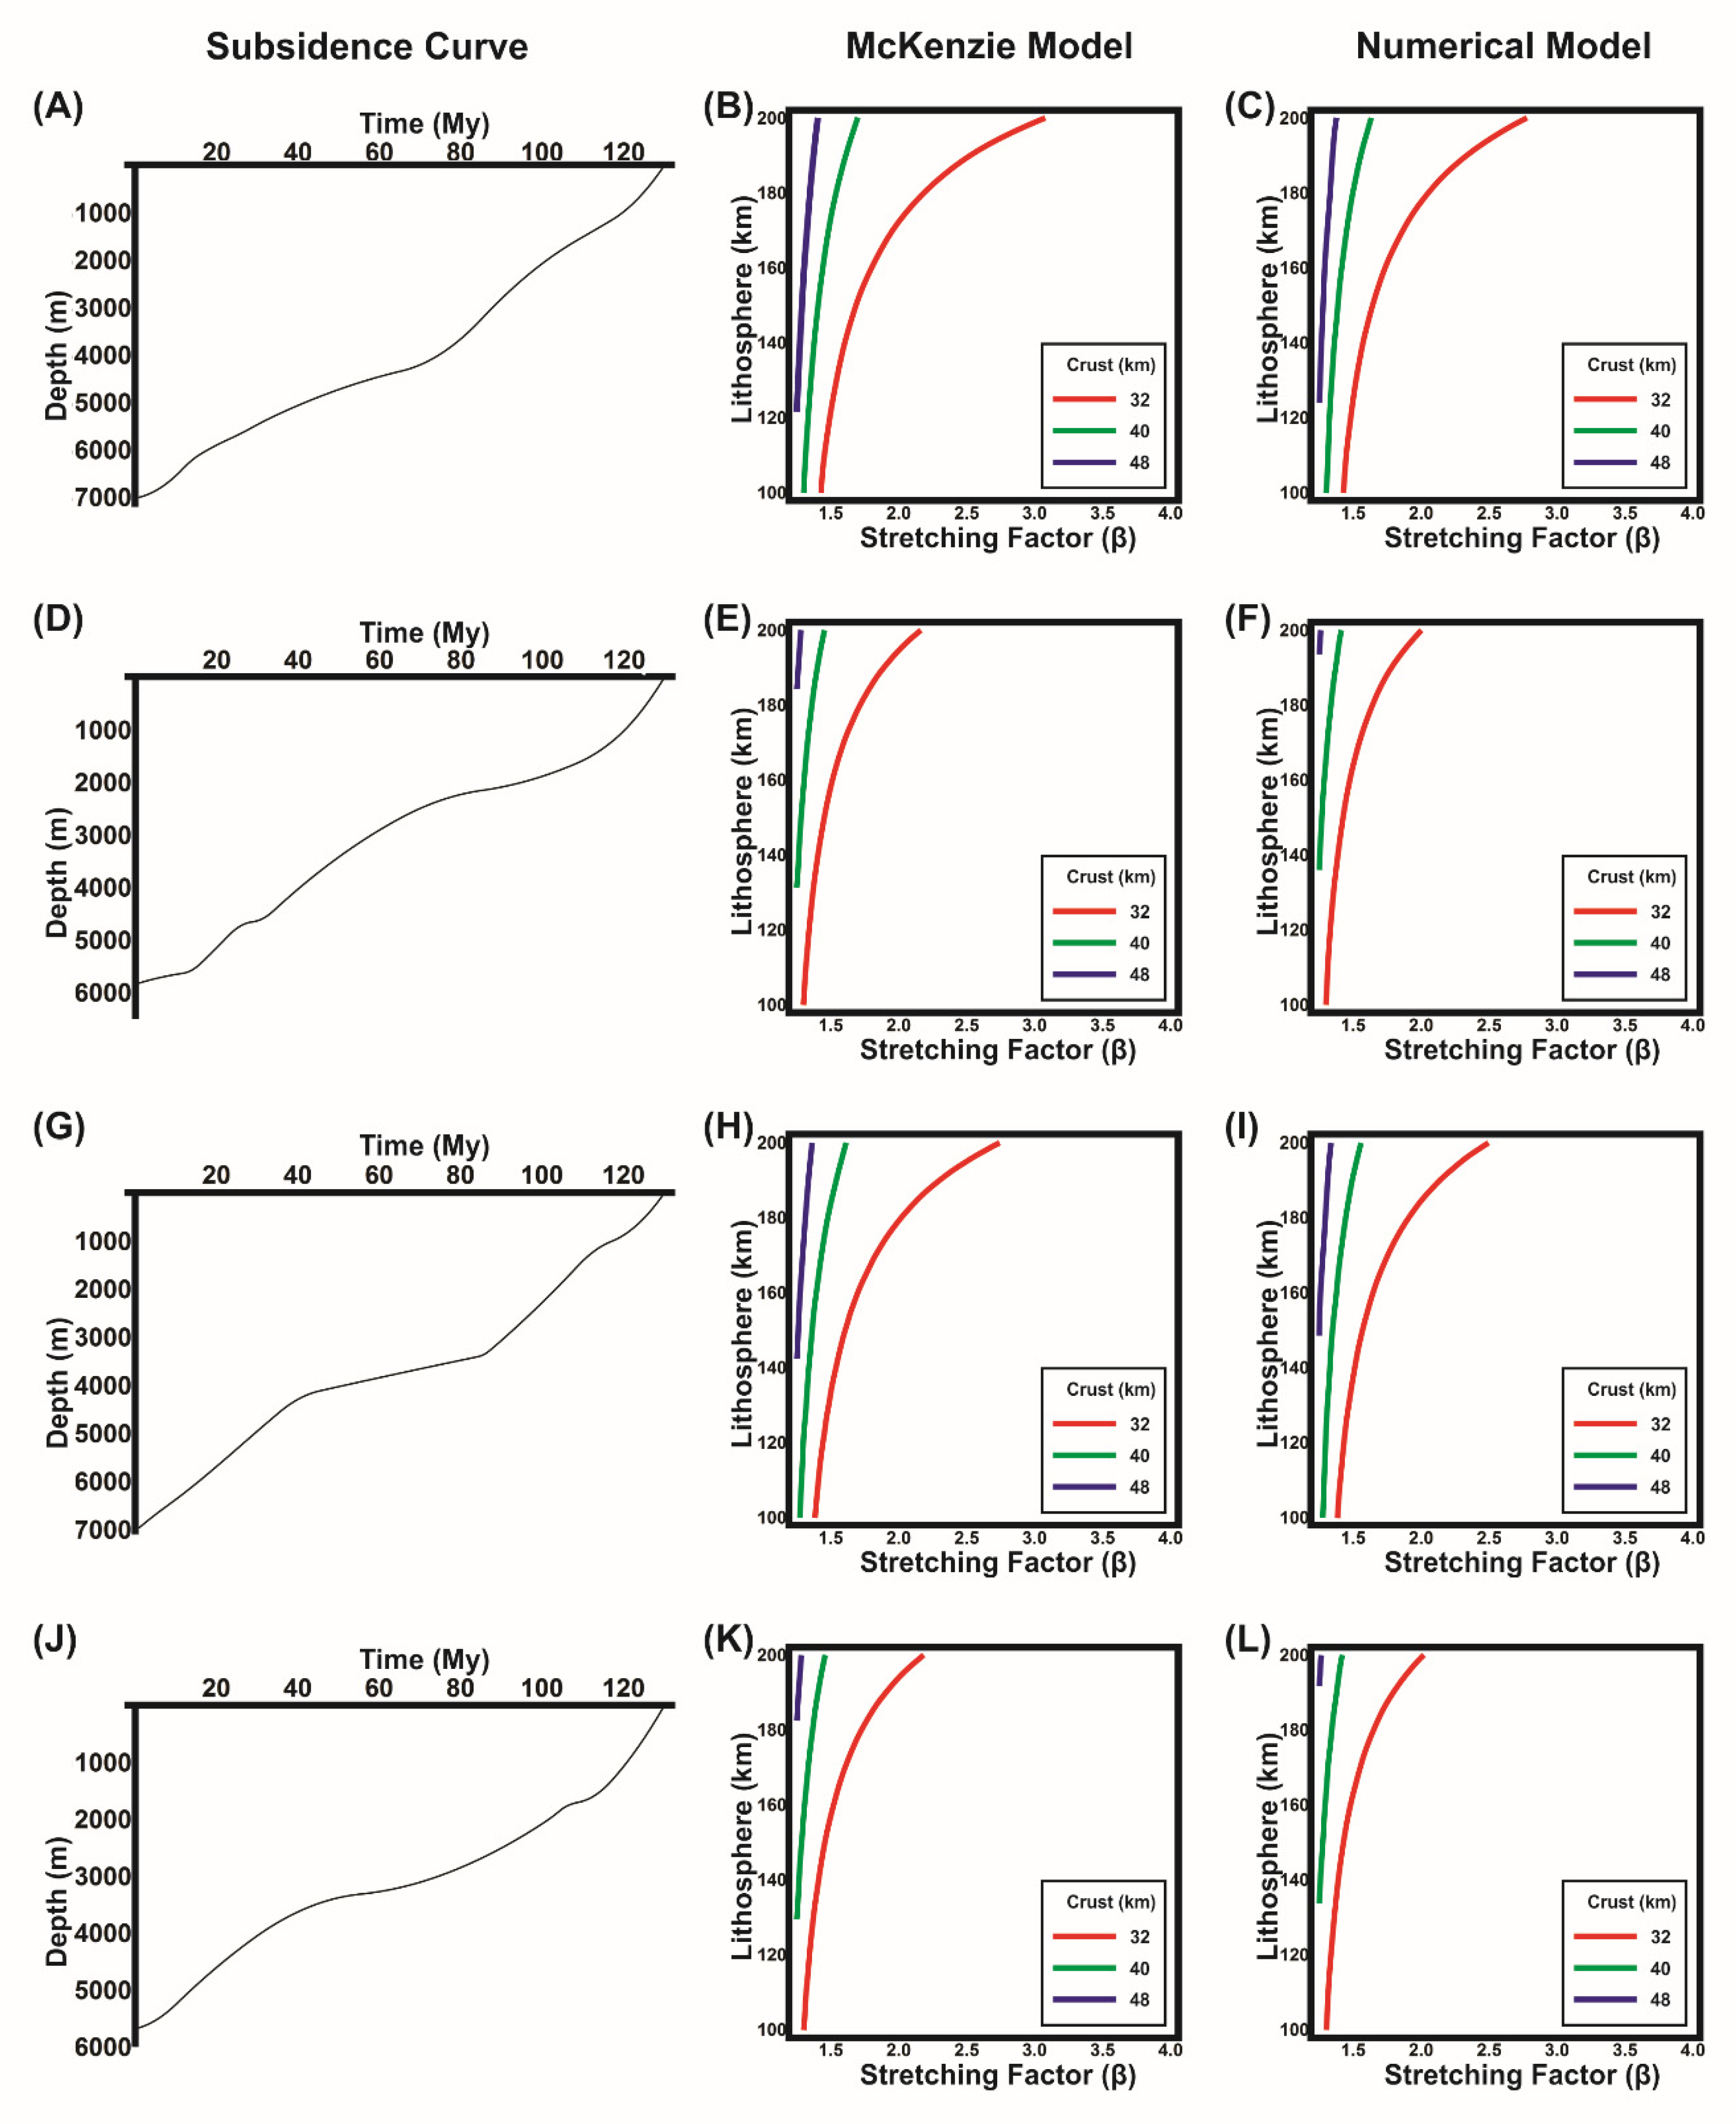
Subsidence modelling, either analytical (McKenzie’s model) or numerical, requires constant numerical values of model parameters for calculation. Some of the typical parameters used in the models are as follows: stretching factor ( β ) , lithospheric thickness ( a ) , crustal thickness ( c ) , density of sedimentary layer ( ρ s ) , crust ( ρ c ) and mantle ( ρ m ) , constants for thermal expansion ( α ) , and thermal diffusivity ( κ ) . The density of the different layers as well as thermal expansibility and diffusivity constant can be provided with known and estimated values of the parameters [16]. In the case of crustal thickness prior to stretching, estimates from deep seismic imaging and gravity profiling of adjoining unstretched crust can be used as proxies [27,28]. In the absence of such geophysical measurements, it is difficult to estimate either the crust or the stretching factor. The initial lithospheric depth, however, is difficult to estimate and there appears to be no immediate guidance on how to find location-specific values.
The fitting method described below uses a known subsidence history that can be estimated using the stratigraphic backstripping technique. Values of lithospheric thickness, stretching factor, or crustal thickness can be estimated using the fitting method described here. For a fixed value of crustal thickness, lithospheric thickness varies from 100 km to 200 km with a 5 km step. In the case of the stretching factor, the range is 1.25 to 4.00 with an increment of 0.05 at each step. The subsidence models are run for 1176 (21 × 56) combinations of lithospheric depth and stretching factor and for a fixed value of crustal depth.
For each parameter combination, the fit between the calculated subsidence curve and the known subsidence curve is estimated. The error between the two curves is estimated by the following:
E 1 = i = 0 n ( S k i S m i )
E 2 = i = 0 n ( S k i S m i ) 2
where S k i and S m i are the known subsidence and modelled subsidence at time step i , respectively. The modelled subsidence values may be from either the McKenzie model or the numerical model or some other model variation (not considered here). The variable i goes from 0 to n , which is the total number of time steps in the model. In the domain space for lithospheric thickness and stretching factor values, the minimum E 1 region represented by a zero-line on a contour plot corresponds to the region where the sum of the difference between subsidence and modelled subsidence curves is zero. It is not necessarily the best fit curve. Meanwhile, the minima of E 2 in the parameter domain representing the best fit curve can be quite an extensive region. Our results indicate that the minimum E 1 curve typically lies within the region of the minimum best fit curve (the minimum E 2 region) and that the zero-line of E 1 represents a good approximation for the lithospheric thickness and the corresponding stretching factor value for the best fit case. However, it must be checked that the zero-line of E 1 lies within the minima region of E 2 contour plot. The above steps can be repeated for different values of crustal thickness.
Synthetic subsidence profiles are generated and used to estimate the suitable best fit lithospheric thickness and stretching factors for a set of crustal thickness values (32, 40, and 48 km). The subsidence profiles were created by randomly generating intervals of subsidence rates for the time period 130 My to present. The first 20 My is assumed to be for initial subsidence by stretching and the remaining 110 My for thermal subsidence. These values are chosen because they are of the same order of magnitude of typical extensional basin systems [29,30] and match the primary example system investigated in this paper.
The curve fitting method is applied to a synthetic subsidence profile shown in Figure 3A. The contour-plots in Figure 3B,D,F show the result of E 1 values for the McKenzie model in the parameter domain space (lithosphere-stretching factor) for 32 km, 40 km, and 48 km of crustal thickness, respectively. Similarly, Figure 3C,E,G depict the E 2 values for the numerical model comparison with known subsidence curve of Figure 3A. The zero line transient of E 1 values, with varying crustal thickness for the two models are shown in the Figure 3H,I. It is to be noted that, with an increasing crustal thickness, a lower stretching factor is required for the same lithospheric thickness. On the other hand, a higher value of lithospheric thickness is required in the case of a constant stretching factor for increasing crustal thickness.
Furthermore, four synthetic subsidence curves are generated (see Figure 4A,D,G,J) and their subsidence history is compared for the models. The summary of best fit zero curve of E 1 values for both models for each synthetic curve is shown in Figure 4. It is worth noting that, with the same lithospheric thickness, a higher value of stretching factor is required for fitting the subsidence curve. This is because of the effect of sediments considered during the thermal cooling stage and the different crustal and mantle density considered in the numerical model compared with the McKenzie model.

4. Case Study

In this section, subsidence history from the Campos Basin, offshore Brazil, is used to apply the curve fitting method described in the previous section. Thanks to its hydrocarbon prospects, the geodynamic evolution and stratigraphy are well studied [25,31,32,33]. This basin experienced a rapid initial rifting phase [25], thus suggesting that the assumption of instantaneous stretching is valid [7].
The formation of Campos Basin is related to the Mesozoic break up of Gondwana and opening of the South Atlantic. The rifting within Gondwana initiated from the southern South Atlantic during Triassic–Early Jurassic (220–200 Ma) and propagated northwards along the North Argentinian margin during the middle Jurassic (180–160 Ma). The intra continental rifting reached the south-eastern Brazilian margin during late Jurassic–Early Cretaceous (140–132 Ma). The geodynamic evolution of the sedimentary basins along the southern Brazilian Atlantic margin is described in five tectonic phases [34,35].
The first is the pre-rift extensional phase that led to the onset of the separation between South America and Africa during Late Jurassic–Berriasian. The second phase represents the rapid lithospheric stretching and passive upwelling of asthenosphere during the Berriasian to late Barremian. This phase is associated with magmatic activity resulting in tholeiitic basalts flows along the newly formed continental margin. The third phase from Late Barremian to Late Aptian characterises the syn rift sag period and marks the end of extension in the region. Transitional to marine sediments were deposited during this phase. The fourth is the post rift stage from early to mid-Albian, which marks the development of mid Atlantic ridge and spreading of the sea floor. The thermal subsidence in the basins was typical of passive continental margins. Carbonates deposited during this phase signify deepening of the basin. The final phase stretches from late Albian to Holocene, characterising an increase in the bathymetry with time and resulting in deposition of deep water carbonates.
The subsidence rate for the depo-centre of the Campos basin was recently estimated by a study using backstripping and an inverse numerical modelling method [25]. This subsidence rate is used in this study to compare with the thermo-tectonic subsidence generated by the McKenzie model and the numerical model introduced in this study (see Figure 5A). The initial crustal thickness used for forward basin modelling is 32 km based on the result of deep seismic survey in the onshore region [28]. From the same study, values of sediment, crustal, and mantle density were used as 2300 kg/m3, 2800 kg/m3, and 3300 kg/m3, respectively. The constants for thermal expansion and thermal diffusivity are used as 3.28 × 10⁻⁵/°C and 10−6 m2/sec, respectively.
The result of comparing the subsidence trends provided from backstripping and the forward subsidence modelling for varying lithospheric thicknesses and stretching factors is shown in Figure 5B. For 32 km of crustal thickness, the zero curve of E 1 values vary within the range of 1.25 to 1.8. The corresponding lithospheric thickness increases with an increase in stretching factor from 100 km for 1.25 β value up to 200 for 1.8 β value. For a stretching factor in the range of 1.5 to 1.8, the suitable range of lithospheric thickness lies within 180 to 200 km.
In the past, using a visual comparison between the backstripped subsidence and McKenzie subsidence curve, the authors of [32] estimated the stretching factor to be 1.7 for the Campos basin. This lies within the range given in this study. However, an important distinction between the two comparisons is that thermal subsidence, in addition to initial subsidence, is calculated starting from the rift phase by [32], whereas it is estimated from the post rift phase in this study.
The numerical model, in comparison with the McKenzie model, is a more realistic model by incorporating the effect of sedimentary cover. The resulting difference can be seen in Figure 3, Figure 4, and more prominently in Figure 5. It can be noted from Figure 5B that, the higher the value of lithospheric thickness used, the greater the difference between the two models. The numerical model requires a lower stretching factor for the same lithospheric thickness for subsidence. The sedimentary cover considered in the numerical model accounts for the change in geothermal transients from instantaneous stretching until the basin reaches the state of geothermal equilibrium. This results in a comparatively lower thermal subsidence in the numerical model as compared with the McKenzie model for the same cooling period. Consequently, a higher amount of thermal subsidence is achieved through the McKenzie model for the same stretching factor as compared with the numerical model. This explains how a lower lithospheric thickness is required to achieve the same subsidence level in the numerical model with respect to the McKenzie model for a constant stretching factor.
Another major outcome from this study is the determination of constraints for acceptable lithospheric thickness together with the stretching factor. It can be noted from the case of the 1D model presented here that a variation in the value of lithospheric thickness can change the model output substantially. Thus, the estimation of lithospheric thickness is important for using the value as model input for further complex and sophisticated 2D and 3D thermo-tectonic numerical models. The curve fitting method presented here can be further generalised and applied for any number of physical parameters. This is a major deviation from earlier attempts at subsidence curve fitting where only the stretching factor was estimated (for example, [20,21,22]). In a comparative study [30], it has been shown that the subsidence patterns of sedimentary basins follow a pattern for certain tectonic settings. Thus, subsidence history can be used for tectonic interpretation based on subsidence curves.

5. Conclusions

A numerical approach to subsidence modelling in an extensional tectonic regime has been presented. The numerical model incorporates the effect of sedimentary cover in basin formation, which is absent in the McKenzie model. This difference leads to a comparatively lower thermal subsidence in the numerical model for (a) the same time period and (b) the same stretching factor, as compared with the McKenzie model. This discrepancy can have implications on basin subsidence histories and heat flow analysis.
Further, synthetically generated subsidence curves are compared with curves generated by the mathematical models using a least squares type approach. This allows estimation of valid combinations of stretching factor, crustal, and lithospheric thickness in basin models. If one of these parameters is known, that is, crustal thickness from seismic reflection analysis, then the other two parameters can be tightly constrained. This approach is used to fit model parameters to a known subsidence curve calculated from data gathered in the Campos Basin. The results indicate possible ranges of stretching factor values between 1.25 to 1.8 and corresponding lithospheric thickness between 100 and 200 km for the basin.
The work presented here can be applied to any other extensional sedimentary basin. Further complexities can be added in the model to include some modifications; for example, radiogenic heat production and finite stretching time. Further extension of this model, based on basin-specific requirements, in 2D and 3D could include the effect of spatial variations in rheological strength and lateral heat flow.

Supplementary Materials

The following are available online at https://www.mdpi.com/2076-3263/10/7/263/s1, File S1: Implicit Method.docx, File S2: Numerical Model 2.docx, File S3: Numerical Model 1.ipynb and File S4: Numerical Model 2.ipynb.

Author Contributions

Conceptualization, M.T. and K.F.M.; methodology, M.T. and K.F.M.; software, M.T.; data curation, M.T.; writing—original draft preparation, M.T.; writing—review and editing, M.T., K.F.M., and P.A.M.; visualization, M.T.; supervision, K.F.M. and P.A.M.; project administration, P.A.M. and K.F.M.; funding acquisition, P.A.M. and K.F.M. All authors have read and agreed to the published version of the manuscript.

Funding

This project was funded by the Irish Shelf Petroleum Studies Group (ISPSG) of the Irish Petroleum Infrastructure Programme (PIP) Group 4. The ISPSG comprises the following: Atlantic Petroleum (Ireland) Ltd, Cairn Energy Plc, Chrysaor E&P Ireland Ltd, Chevron North Sea Limited, ENI Ireland BV, Europa Oil & Gas (Holdings) plc, ExxonMobil E&P Ireland (Offshore) Ltd., Kosmos Energy LLC, Maersk Oil North Sea UK Ltd, Petroleum Affairs Division of the Department of Communications, Energy and Natural Resources, Providence Resources plc, Repsol Exploración SA, San Leon Energy Plc, Serica Energy Plc, Shell E&P Ireland Ltd, Sosina Exploration Ltd, Statoil (UK) Ltd, Tullow Oil Plc, and Woodside Energy (Ireland) Pty Ltd. PAM acknowledges financial support from Irish Centre for Research in Applied Geosciences (iCRAG) during this work.

Acknowledgments

The authors would like to thank the Editor and four anonymous reviewers for their feedback, which significantly improved the manuscript.

Conflicts of Interest

The authors declare no conflict of interest. The funders had no role in the design of the study; in the collection, analyses, or interpretation of data; in the writing of the manuscript; or in the decision to publish the results.

References

  1. McKenzie, D. Some remarks on the development of sedimentary basins. Earth Planet. Sci. Lett. 1978, 40, 25–32. [Google Scholar] [CrossRef]
  2. Wernicke, B. Low-angle normal faults in the Basin and Range Province: Nappe tectonics in an extending orogen. Nature 1981, 291, 645–648. [Google Scholar] [CrossRef]
  3. Wernicke, B. Uniform-sense normal simple shear of the continental lithosphere. Can. J. Earth Sci. 1985, 22, 108–125. [Google Scholar] [CrossRef]
  4. Kusznir, N.J.; Marsden, G.; Egan, S.S. A flexural-cantilever simple-shear/pure-shear model of continental lithosphere extension: Applications to the Jeanne d’Arc Basin, Grand Banks and Viking Graben, North Sea. Geol. Soc. Lond. Spec. Publ. 1991, 56, 41–60. [Google Scholar] [CrossRef]
  5. Rowley, D.B.; Sahagian, D. Depth-dependent stretching: A different approach. Geology 1986, 14, 32–35. [Google Scholar] [CrossRef]
  6. Royden, L.; Keen, C.E. Rifting process and thermal evolution of the continental margin of Eastern Canada determined from subsidence curves. Earth Planet. Sci. Lett. 1980, 51, 343–361. [Google Scholar] [CrossRef]
  7. Jarvis, G.T.; McKenzie, D.P. Sedimentary basin formation with finite extension rates. Earth Planet. Sci. Lett. 1980, 48, 42–52. [Google Scholar] [CrossRef]
  8. Lucazeau, F.; Le Douaran, S. The blanketing effect of sediments in basins formed by extension: A numerical model. Application to the Gulf of Lion and Viking graben. Earth Planet. Sci. Lett. 1985, 74, 92–102. [Google Scholar] [CrossRef]
  9. Wangen, M. The blanketing effect in sedimentary basins. Basin Res. 1995, 7, 283–298. [Google Scholar] [CrossRef]
  10. Hantschel, T.; Kauerauf, A.I. Fundamentals of Basin and Petroleum Systems Modeling; Springer Science & Business Media: Berlin, Germany, 2009. [Google Scholar]
  11. White, R.; McKenzie, D. Magmatism at rift zones: The generation of volcanic continental margins and flood basalts. J. Geophys. Res. Solid Earth 1989, 94, 7685–7729. [Google Scholar] [CrossRef] [Green Version]
  12. Stephenson, R.A.; Nakiboglu, S.M.; Kelly, M.A. Effects of asthenosphere melting, regional thermoisostasy, and sediment loading on the thermomechanical subsidence of extensional sedimentary basins. In Origin and Evolution of Sedimentary Basins and Their Energy and Mineral Resources; American Geophysical Union: Washington, DC, USA, 1989; pp. 17–27. [Google Scholar]
  13. Watts, A.B.; Karner, G.D.; Steckler, M.S. Lithospheric flexure and the evolution of sedimentary basins. Philos. Trans. R. Soc. Lond. Ser. A Math. Phys. Sci. 1982, 305, 249–281. [Google Scholar] [CrossRef]
  14. Kooi, H.; Cloetingh, S.; Burrus, J. Lithospheric necking and regional isostasy at extensional basins 1. Subsidence and gravity modeling with an application to the Gulf of Lions Margin (SE France). J. Geophys. Res. Solid Earth 1992, 97, 17553–17571. [Google Scholar] [CrossRef]
  15. Van Balen, R.T.; van der Beek, P.A.; Cloetingh, S.A.P.L. The effect of rift shoulder erosion on stratal patterns at passive margins: Implications for sequence stratigraphy. Earth Planet. Sci. Lett. 1995, 134, 527–544. [Google Scholar] [CrossRef] [Green Version]
  16. Wangen, M. Physical Principles of Sedimentary Basin Analysis; Cambridge University Press: Cambridge, UK, 2010; p. 527. [Google Scholar]
  17. Burov, E.; Poliakov, A. Erosion and rheology controls on synrift and postrift evolution: Verifying old and new ideas using a fully coupled numerical model. J. Geophys. Res. Solid Earth 2001, 106, 16461–16481. [Google Scholar] [CrossRef]
  18. Hölzel, M.; Faber, R.; Wagreich, M. DeCompactionTool: Software for subsidence analysis including statistical error quantification. Comput. Geosci. 2008, 34, 1454–1460. [Google Scholar] [CrossRef]
  19. Steckler, M.S.; Watts, A.B. Subsidence of the Atlantic-type continental margin off New York. Earth Planet. Sci. Lett. 1978, 41, 1–13. [Google Scholar] [CrossRef]
  20. van Wees, J.D.; Stephenson, R.A.; Stovba, S.M.; Shymanovskyi, V.A. Tectonic variation in the Dniepr-Donets Basin from automated modelling of backstripped subsidence curves. Tectonophysics 1996, 268, 257–280. [Google Scholar] [CrossRef]
  21. Van Wees, J.D.; van Bergen, F.; David, P.; Nepveu, M.; Beekman, F.; Cloetingh, S.; Bonté, D. Probabilistic tectonic heat flow modeling for basin maturation: Assessment method and applications. Mar. Pet. Geol. 2009, 26, 536–551. [Google Scholar] [CrossRef]
  22. Beglinger, S.E.; van Wees, J.-D.; Cloetingh, S.; Doust, H. Tectonic subsidence history and source-rock maturation in the Campos Basin, Brazil. Pet. Geosci. 2012, 18, 153–172. [Google Scholar] [CrossRef]
  23. Chen, L.; Zhang, Z.; Song, H.; Li, F.; Franke, D. Numerical modeling of extensional sedimentary basin formation with MATLAB: Application to the northern margin of the South China Sea. Comput. Geosci. 2013, 51, 153–165. [Google Scholar] [CrossRef]
  24. Lee, E.Y.; Novotny, J.; Wagreich, M. BasinVis 1.0: A MATLAB®-based program for sedimentary basin subsidence analysis and visualization. Comput. Geosci. 2016, 91, 119–127. [Google Scholar] [CrossRef]
  25. Contreras, J.; Zühlke, R.; Bowman, S.; Bechstädt, T. Seismic stratigraphy and subsidence analysis of the southern Brazilian margin (Campos, Santos and Pelotas basins). Mar. Pet. Geol. 2010, 27, 1952–1980. [Google Scholar] [CrossRef]
  26. Holmes, M.H. Introduction to Numerical Methods in Differential Equations; Springer: New York, NY, USA, 2007; p. 239. [Google Scholar]
  27. Lebedev, S.; Adam, J.M.C.; Meier, T. Mapping the Moho with seismic surface waves: A review, resolution analysis, and recommended inversion strategies. Tectonophysics 2013, 609, 377–394. [Google Scholar] [CrossRef]
  28. Mohriak, W.U.; Hobbs, R.; Dewey, J.F. Basin-forming processes and the deep structure of the Campos Basin, offshore Brazil. Mar. Pet. Geol. 1990, 7, 94–122. [Google Scholar] [CrossRef]
  29. Allen, P.A.; Allen, J.R. Basin Analysis: Principles and Application to Petroleum Play Assessment, 3rd ed.; Wiley-Blackwell: Hoboken, NJ, USA, 2013; p. 619. [Google Scholar]
  30. Xie, X.; Heller, P. Plate tectonics and basin subsidence historyBasin subsidence. GSA Bull. 2009, 121, 55–64. [Google Scholar] [CrossRef]
  31. Guardado, L.R.; Gamboa, L.A.; Lucchesi, C.F. Petroleum geology of the Campos Basin, Brazil, a model for a producing atlantic type basin: Part 1. In Divergent/Passive Margin Basins; Edwards, J.D., Santogrossi, P.A., Eds.; American Association of Petroleum Geologists: Tulsa, OK, USA, 1989; pp. 3–80. [Google Scholar]
  32. Mohriak, W.U.; Mello, M.R.; Dewey, J.F.; Maxwell, J.R. Petroleum geology of the Campos Basin, offshore Brazil. Geol. Soc. Lond. Spec. Publ. 1990, 50, 119–141. [Google Scholar] [CrossRef]
  33. Karner, G.D.; Driscoll, N.W. Tectonic and stratigraphic development of the West African and eastern Brazilian Margins: Insights from quantitative basin modelling. Geol. Soc. Lond. Spec. Publ. 1999, 153, 11–40. [Google Scholar] [CrossRef]
  34. Cainelli, C.; Mohriak, W.U. General evolution of the eastern Brazilian continental margin. Lead. Edge 1999, 18, 800–861. [Google Scholar] [CrossRef]
  35. Mohriak, W.; Nemčok, M.; Enciso, G. South Atlantic divergent margin evolution: Rift-border uplift and salt tectonics in the basins of SE Brazil. Geol. Soc. Lond. Spec. Publ. 2008, 294, 365–398. [Google Scholar] [CrossRef]
Figure 1. Thermal gradient before and after uniform instantaneous stretching by a factor β. The integrals of Equation (3) are annotated in front of the respective layers (sediment layer, crust, lithospheric mantle, and asthenospheric mantle are represented by yellow, green, orange, and purple colour, respectively). The crustal thickness is taken as 32 km, the lithospheric thickness before stretching is 120 km, and β is 2. The initial subsidence from Equation (7) is estimated to be 5.078 km.
Geosciences 10 00263 g001
Figure 2. Schematic diagram, not to scale, showing subsidence of thinned crust of thickness ( c / β ) and sediments deposited during initial subsidence ( s I ), as the model progresses (they are of constant thickness throughout). The integrals terms along with the different layers in the diagram correspond to their individual pressure as used in Equations (9) and (10). (A) Basin configuration just after initial subsidence. (B) Subsidence of thinned crust and s I at some time t after instantaneous stretching. s t denotes sedimentary layer deposited during time t owing to thermal subsidence. (C) Addition of sedimentary layer of thickness s during the time t after time t . Sediments deposited at each time step t fill up the space generated as a result of thermal subsidence during time t .
Geosciences 10 00263 g002
Figure 3. Comparison of known subsidence profile with the curves generated from subsidence models are shown in form of contour-plot of E i values. (A) A synthetically generated subsidence curve of 130 My with the first 20 My in the initial subsidence phase. The comparison results for the McKenzie model are shown for crustal thickness (B) 32 km, (D) 40 km, and (F) 48 km. The numerical model results of E 1 values for the numerical model are shown for crustal thickness (C) 32 km, (E) 40 km, and (G) 48 km. The zero-curve for the varying crustal thicknesses is presented for the (H) McKenzie model and (I) numerical model.
Geosciences 10 00263 g003
Figure 4. Four synthetically generated subsidence curves are shown in (A,D,G,J). The results, in comparison with the McKenzie model, give best fit curve in (B,E,H,K). The best fit E i curves for the numerical model for the four synthetic subsidence curves are presented in (C,F,I,L), respectively.
Geosciences 10 00263 g004
Figure 5. (A) Subsidence curve for Campos Basin from Lower Cretaceous to present. The post rift thermal subsidence onsets during the mid-Albian. (B) The best fit zero-curve line for comparison between the known subsidence curve and the curves generated from the models. The crustal thickness is considered to be 32 km.
Geosciences 10 00263 g005

