Abstract
Here, we report on a new geyser (named Shaman) formed in the Uzon caldera (Kronotsky Federal Nature Biosphere Reserve, Russia) in autumn 2008 from a cycling hot Na-Cl spring. The geyser is a pool-type CO2-gas lift driven. From 2012 to 2018, the geyser has shown a rather stable interval between eruptions (IBE) from 129 to 144 min with a fountain height up to 4 m, and the geyser conduit has gradually enlarged. In 2019, the Shaman geyser eruption mode significantly changed: cold water inflow from the adjacent stream was re-directed into the geyser conduit and the average IBE decreased to 80 min. We observed two eruptive modes: a cycling hot spring (June 2019) and a cycling geyser (after June 2019). Bottom-hole temperature recording was performed in the geyser conduit to understand its activity. The TOUGH2-EOS2 model was used to reproduce the obtained temperature records and estimate geyser recharge/discharge parameters in both modes. Modeling shows that a larger cold inflow into the conduit causes a switch from cycling geyser to hot cycling spring mode. It was also found that the switch to cycling geyser mode corresponds to a larger mass of CO2 release during the time of the eruption.
1. Introduction
A thorough analysis of world-wide geyser distributions and functionality performed by Hurwitz and Manga [1] showed that geysers mostly occur within high-temperature hydrothermal systems hosted in active silicic volcanic areas. Dissolved gas sample data from Yellowstone National Park (USA) suggest that the presence of magma-derived CO2 as well as N2 derived from air-saturated meteoric water reduced the near-surface saturation temperature in geyser conduits [2]. Thermodynamic calculations suggest that the dissolved CO2 and N2 modulate the dynamics of geysers and may trigger hydrothermal geyser eruptions when recharged into shallow reservoirs at high concentrations [2].
Cold CO2 gas-lift geyser behavior has been observed at abandoned oil and gas boreholes [3]. A recent studies of geysers in Iceland using submersible cameras showed detailed images from two of the largest geysers at depths exceeding 20 m: near the surface, the conduit of the geysers were near-circular, but at a depth of 9–12 m, the shape changed into a crack-like elongated fissure [4]. Experimental investigation of the importance of the conduit shape and cold water inflow for the type of discharge (geyser, fumaroles or boiling pool) have been reported [5].
Analysis of some particular cases from the Valley of Geysers (Kamchatka) highlights the two factors: (i) the possibility of high porosity-permeability conduit formation due to fast rhyolite/thermal water chemical interaction in thermal spring discharge areas [6,7]; and (ii) the importance of CO2-gas lift for driving geyser eruptions [8,9].
Nevertheless, partial destruction of geysers in the Valley of Geysers (03.June.2007) and the almost simultaneous creation of a new geyser in the same caldera (2008) further raises the questions of how, where, and why geysers exist. Why, despite similar hydrogeological conditions in Uzon and in the Valley (Figure 1), have most geysers formed in the Valley? What are the properties of the conduits where geyser behavior is preferred? How is geyser fountain power generated in underground reservoirs?
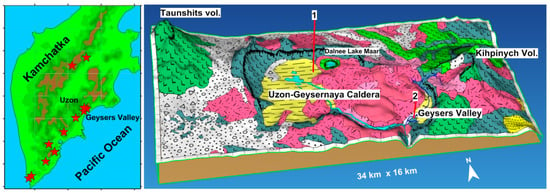
Figure 1.
Kamchatka high temperature geothermal systems (left) and schematic 3D view of the Uzon–Geysernaya caldera (right). The geological units are shown by the colors: alluvial and glacial deposits (light gray), caldera lake deposits (Q34) (yellow), rhyolite–dacite extrusions (ξQ34 and αξQ34) (pink), pre-caldera tuffs and sedimentary deposits (gray), and basalt-andesite lavas (green) (αQ31–2, αQ33, and Q33 ust). Geysers under monitoring: 1—Shaman geyser area, 2—Bolshoy, Velikan geysers area.
This paper examined a newly created geyser in Uzon (Appendix A, Figure A1, Figure A2, Figure A3, Figure A4, Figure A5, Figure A6, Figure A7 and Figure A8) as an example to address the above-mentioned issues. Another critical issue is whether a new Uzon geyser is a precursor of an on-going diatreme (Figure 2), which may eventually cause a catastrophic event in future. Thus, the modeling only focuses on the very last duration of the observations.
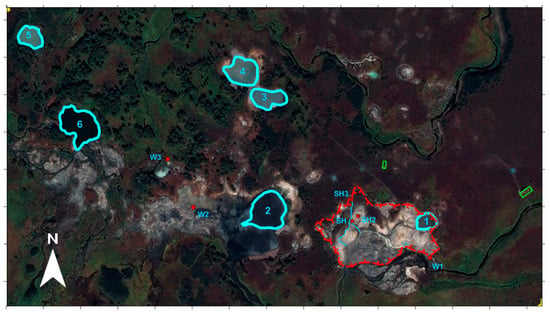
Figure 2.
Shaman geyser area. Air-photo (Google Earth, 19 September 2017) scheme of the East Uzon thermal field, where geyser Shaman is located. SH—Shaman geyser (Figure A1, Figure A2, Figure A3, Figure A4, Figure A5, Figure A6, Figure A7 and Figure A8 in Appendix A), SH2—hot CO2 spring adjacent to geyser (Figure A11 in Appendix A), SH3–hot spring where warm–cold creek started bypassing Shaman. Since 2019, a significant fraction of creek flow has diverted into the Shaman geyser conduit (Figure A6). Diatreme shapes: 1—Bannoe Lake (Figure A9 in Appendix A); 2—Chloridnoe Lake; 3,4—Lake Vosmerka; 5—Seroye Lake; 6—Utinoye Lake, Red hatched area—Shaman geyser “on-going” diatrem. Axes grid scale—100 m.
2. Geological Setting
The age of the Uzon–Geysernaya caldera (Figure 1) is estimated to be 39,600 ± 1000 years according to the radiocarbon dating of soil samples below the caldera-forming ignimbrites [10]. Uzon–Geysernaya pre-caldera deposits comprise dacite–andesite tuffs and lavas that are 40,000–140,000 years old (corresponding geological indexes are αQ31–2, αQ33, and Q33 ust). Initially, this caldera was an isolated hydrological basin, where volcanogenic and sedimentary lake deposits were formed (Q34). These deposits, which have thicknesses up to 400 m near the caldera rim, are represented by layered pumice tuffs and minor breccias and conglomerates. Caldera lake deposits are overlain by 15,000–20,000-year-old rhyolite to dacite lavas, which formed large domes and adjacent lava flows up to 100–150 m thick (corresponding geological indexes are ξQ34 and αξQ34 ). Approximately 9000 to 12,000 years ago, the southeastern wall of the caldera was eroded by the Shumnaya and Geysernaya Rivers, initiating the drainage and formation of intensive hydrothermal discharge in the Geysernaya River basin by 5000–6000 years ago [6].
The current magmatic activity in the Uzon–Geysernaya caldera was detected by uplift with an amplitude of up to 15 cm from 1999 to 2003 (around 4 cm per year), which was identified by radar interferometry data analysis [11]. The source of these deformations is supposed to be a partially molten magma body under the northeastern part of the Uzon–Geysernaya caldera.
On June 3, 2007, a catastrophic landslide occurred in the Valley of Geysers, Kamchatka [6]. Within a few minutes, 20 × 106 m3 of rocks shifted 2 km downstream in the Geysernaya River, creating a dam with Podprudnoe Lake and burying more than 23 geysers. After this partial loss of geysers in the Valley of Geysers from the catastrophic landslide in 2007, a new geyser appeared at 652 m.a.s.l. in the Uzon caldera in the autumn of 2008. The new geyser site is located in an active hydrothermal area (East of Uzon) composed of deeply altered caldera lake deposits. This area included several magma-hydrothermal eruption vents (Figure 1 and Figure 2) such as a 1.5 km maar of Dalnee Lake (8–10 kY old, Figure A10 in the Appendix A), and craters enclosing Khloridnoe Lake, Fumarolnoye Lake, and Bannoe Lake (all are less than 1.5 kY old). Bannoe Lake (Figure A9 in Appendix A) hosted the most recent phreatic eruption in 1989, which created a crater (4 × 3 × 8 m) at the bottom [12]. Shallow sills and the formation of geomechanical conditions may be associated with isotope signed magmatic CO2 discharge observed in this area (see Section 3 below).
At the time of creation, this geyser was named Mutny (Muddy in Russian) because it erupted pieces of clay rocks (Appendix A, Figure A1 and Figure A2). The geyser conduit was logged down to 2.3 m, with a diameter of 30 cm at a 60 cm depth. A bi-modal (12 and 20 min) interval between eruptions (IBE) was observed [13]. Geyser pool temperature varied from 64.4–94.9 °C, with a maximum temperature achieved 1–1.5 min before the eruption. Duration of eruptions were around of 25 s and the height of erupted fountains was up to ~4 m. It was also noted at that time, that the water level in the geyser conduit lowered by 60 cm after the eruption, then erupted water flowed back from the pool into the conduit.
A different name, Shaman, has been proposed for this geyser in the literature [14,15,16], so this name was adopted. It was noted that Shaman arose within a cycling chloride sodium hot spring with a temperature of 80 °C, geyser pool area of 4.5 × 6 m with two terraces with 40 cm elevation differences (terraces reflected water level in the pool before and after eruptions). After the switch from a hot spring to a geyser, its chemical composition remained relatively stable (Cl: 1223–1454 ppm; Na: 812–941 ppm) at least until 2009, while the temperature of eruption increased to 99 °C.
3. Gas-Chemistry Composition and Interval Between Eruption (IBE) History of the Shaman Geyser
In Figure 3, we show the time variation of the average IBE of this new geyser in the period 2012–2019. The average IBE for August 2012–May 2017 was rather stable in the range from 129 to 144 min, but in 2018, the average IBE dropped to 88 minutes, then to 80 minutes in August 2019. The chemical history of the Shaman geyser showed a significant dilution over time of the major components (Cl, Na, K, Ca, and H3BO3 decreased by a factor of ~3), pH decreased from 6.4 to 4.6; nevertheless, SO4 remains rather stable (Table 1). There is a trend of stable water isotopes (δD‰, δ18O‰) decreasing during the time period of 2015–2018. Gas composition was relatively stable with the dominance of CO2 (80% vol on average) (Table 2), which resulted in the lowering of the boiling temperature in the geyser pool to 82.7 °C (Figure A4 in Appendix A). It is worth noting the clear δ13C‰ signatures of magmatic CO2 (varies from −6.8‰ to −3.4‰) and abiotic-thermogenic CH4 (varies from −30.4‰ to −22.9‰) [17] in the gas components of the Shaman geyser (Table 2), and the N2/Ar ratios (varies from 50 to 492) also exceeds the atmospheric saturated water ratio, pointing to non-atmospheric origin of some N2. The NH4 increase on 24.08.2019 may have been caused by the dissolution of NH3 generated by the reaction N2 + 3H2 → 2NH3, if H2 generation in the magma–hydrothermal system increased at that time. Gas samples taken from both Shaman and from Shaman-2 on 02.05.2018 and the sample from Shaman-2 on 27.08.2019 were strongly contaminated with air. Concurrently, the surficial hydrological conditions changed: the temperature variations of the creek water, recharged from spring SH3, and rain/snow-melting (Figure 2, Figure A3 in Appendix A) partially re-directed (Figure A6 in Appendix A) their water flow into the Shaman pool, triggered by pool area subsidence (Figure A6 in Appendix A). The Shaman geyser conduit also significantly enlarged at that time (Figure A5 in Appendix A). Eruptions styles of the Shaman geyser in 2014 and 2019 are also shown in Figure A7 and Figure A8 in Appendix A.
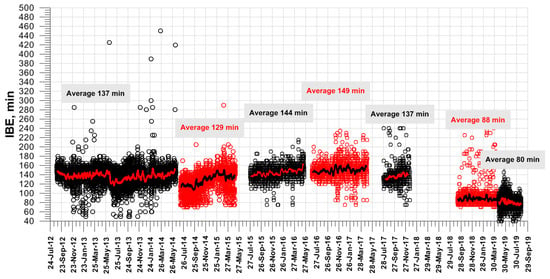
Figure 3.
IBE history of the Shaman geyser during the time period from 2012 to 2019. Note: black and red symbols show different times when the temperature loggers were replaced on site.

Table 1.
Chemical parameters of the Shaman geyser water (in ppm). Chemical composition of pre-Shaman hot spring (2006), sampling in 2006–2009 was performed by G.A. Karpov, and sampling in 2015–2019 was performed by A.V. Kiryukhin. Chemical analysis was performed in Central Chemical Lab Institute of Volcanology & Seismology Far East Branch Rassia Academy of Scieces (IVS FEB RAS). Isotope analysis was performed by P.O. Voronin using LGR IWA 35EP. Notes: SH—Shaman geyser, SH3—hot spring where warm–cold creek started bypassing Shaman (see Figure 2).

Table 2.
Gas composition (vol. %) of the Shaman geyser and adjacent gas-boiling hot spring Shaman-2 (Figure A11 in Appendix A). Gas sampling in 2009, 2012, 2014, and 05.09.2019 was performed by G.A. Karpov, and gas sampling in 2018–2019 was performed by A.V. Kiryukhin and N.B. Zhuravlev using the sampling method (RU patent # 195670)). Chemical analysis was performed at the Central Chemical Lab. IVS FEB RAS, isotope analysis was performed by V.Y. Lavrushin and B.G. Pokrovsky in GIN RAS (δ13C‰).
In April 2019, the Shaman geyser eruption style changed when compared to the regular cycling styles observed previously (match vertical images row of 06.09.2014 and 21.04.2019). During the period from 2008 to 2018, a single major eruption was observed, but in April 2019, multiple (from three to four) eruptions took place in a few minutes of geyser discharge (Figure A8). Then, in June 2019, the Shaman geyser eruptions ceased altogether. Only bubbling was observed at regular times when eruptions were expected. Nevertheless, in July 2019, the geyser cycling style (multiple eruption styles of three to five) was re-established and the geyser activity continued (Figure A7 and Figure A8 (12.09.2019)).
4. Bottom-Hole Temperature Tests and Sampling of Shaman Geyser in 2019
We performed two tests to measure the bottom hole transient temperature at the Shaman geyser. In both cases, a HOBO U12-015 temperature logger was used. Test #1 was carried out during the period from 25.06.2019 18:00 to 29.06.2019 18:00 (Figure 4). During the first part of test #1 (from 25.06.2019 18:00 to 27.06.2019 18:00), a 62 mm diameter iron pipe was installed in the geyser conduit to ensure that the logger reached the bottom. At that time, the pipe reached the depth of 286 cm, and then the temperature logger was installed inside the pipe at the bottom. Two days after the iron pipe was removed from the geyser conduit and the temperature logger was installed alone on a cable at the same depth of 286 cm (the second part of test #1 lasted from 27.06.2019 18:00 to 29.06.2019 18:00). These operations gave us some idea of the shape and geometry of the Shaman geyser conduit: (1) Penetrated depth to the bottom was 286 cm; (2) the geyser bottom was joined to some sub-horizontal cavern, from where the geyser was recharged by hot water and gas; (3) the geyser conduit was conical with a top diameter from 55 to 65 cm, medium diameter 17 cm at the depth of 180 cm, and a bottom diameter at least of 12.5 cm at the depth of 272 cm; and (4) the maximum bottom-hole temperature of 98.6 oC is significantly lower than the boiling temperature of pure water at the given hydrostatic pressure (104.8 oC). During this time, 73 cycles of temperature with an average interval of 78.4 min were observed, but no fountain eruptions took place, only intense gas bubbling.
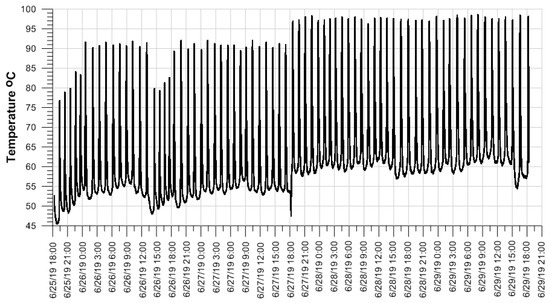
Figure 4.
Shaman geyser temperature cycling records obtained at the bottom of the conduit (depth of 2.9 m) during the time period of observations from 25.06.2019 18:00 to 29.06. 2019 18:00 (73 eruptions, 78.4 min). Note that a 5 °C temperature positive shift after the casing tube was removed on 27 June 2019 18:00.
Test #2 was a response to a Shaman geyser eruption that started in mid-July 2019. We used the same logger configuration and depth as in the second part of test #1. Test #2 was performed from 24.07. 2019 09:00 to 28.07. 2019 15:00 (Figure 5). During that time, we observed 77 eruptions with an IBE of 82.6 min. Each eruption was characterized by three to five sub-eruptions with a duration of 5–7 min, followed by a 1 m water level drawdown in a conduit. The eruption period temperature records were clearly in contrast to non-eruption ones with a minimum bottom hole temperature rise from 55 to 65 oC (Figure 4 and Figure 5). A 10 oC temperature increase in a geyser bottom during day-time (Figure 5) was also observed when the water temperature in the surface recharge creek rose. It is worth noting that the maximum bottom-hole temperature of ~99.4 °C was significantly lower than the boiling temperature of pure water at a given hydrostatic pressure (104.8 oC).
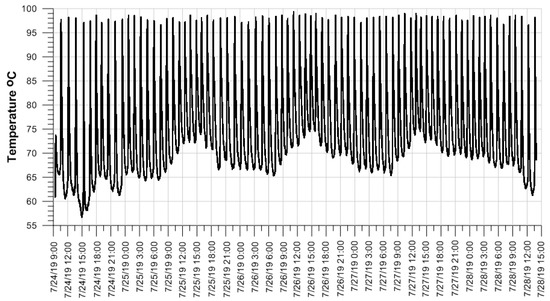
Figure 5.
Shaman geyser temperature cycling records obtained at the bottom of the conduit (depth of 2.9 m) during the time period of observations from 24.07.2019 09:00 to 28.07.2019 15:00 (77 eruptions, IBE = 82.6 min).
During the period from 24.08.2019 to 29.08.2019, the following parameters of the Shaman geyser were observed: (1) Gas rate 2.5 g/s of CO2 at the top of the conduit area (we used a sampling method with a down-hole probe connected by a stainless steel tube to a pump on a ground surface (RU patent # 195670)); (2) In the time between eruptions, a cold water inflow about 0.25 l/s (volume method of measurement, simply measuring with a 3 L bucket the volume of water per time) into the geyser conduit took place from the adjacent creek (T = 35 oC, pH 6.45); (3) Surface geyser pool temperature 80 oC (IR survey, see Figure A4 in Appendix A), geyser pool pH 5.53–5.6; (4) Tracer test using a mass of m = 1 kg NaCl (diluted in a 5 L bottle of geysers water before injection) shows an active volume of the Shaman geyser system of 3.8 m3. Cl concentration after eruption and before injection was C1 = 581.4 10−3 kg/m3, Cl concentration after salt brine injection and just before the next eruption was C2 = 737.9 10−3 kg/m3, thus the volume V of the conduit was determined by the formula V = 0.60684 m/(C2–C1) = 3.8 m3, where 0.60684 is the weight fraction of Cl in NaCl (tracer test methodology to estimate the geyser’s conduit volume was described in Section 3.3.2 [8]). This estimate is based on the assumption that injected salt is homogeneously distributed in all of the active geyser volume (conduit and adjacent caverns) during time between subsequent eruptions, thus this is a lower volume limit estimate; and (5) Opal deposition from geyser brine was found (on a logger surface) as a main secondary phase (Sergeeva A.V., pers. com. 2019).
5. Conceptual Model of Geyser Shaman Cycling
Based on the information above, a conceptual model of the Shaman geyser cycling in 2019 is shown in Figure 6. The geyser conduit has a 3 m depth and 0.3 m radius connected to the reservoir-cavern (yellow in a Figure 6) fed by two-phases (hot water + CO2) from a deeper reservoir (red arrows in a Figure 6). An active volume of the geyser system was estimated as no less than 3.8 m3, which includes the conduit volume 0.8 m3 (πr2H) and reservoir-cavern active volume of 3 m3. If we assume a cavern-reservoir porosity of 0.5 (as a maximum of the Uzon–Geysernaya caldera tuff unit porosity, which ranges from 0.16 to 0.52, see Section 2.8.1 [6]), then its actual volume should be 6 m3. The isometric shape of subsidence around the geyser conduit pointed to radial-cylindrical geometry, thus the cavern-reservoir radius should be 2 m if its thickness of 0.5 m is assumed. Surface boundary conditions must include constant atmospheric pressure on the top (average value for the Uzon caldera conditions is 0.93 bars). There is a possibility of self-discharge conditions and cold water injection from the adjacent creek (0.25 kg/s and 35 °C as estimated in August 2019, although colder temperature values like 30 °C may be assumed in July 2019). Mass output from 5 min of fountain discharge must be applied to within an 80 min interval of cycling. Bottom CO2 recharge was estimated at the top as 2.5 g/s and hot water recharge was 0.25 kg/s, if a water/gas mass rate ratio ~100 (observed during gas sampling) was used. Hot water recharge enthalpy may be slightly above 420 kJ/kg to match the bottom-hole maximum temperature records of 99.4 °C. Host rock for the active geyser system might be low permeability hydrothermally altered rocks.
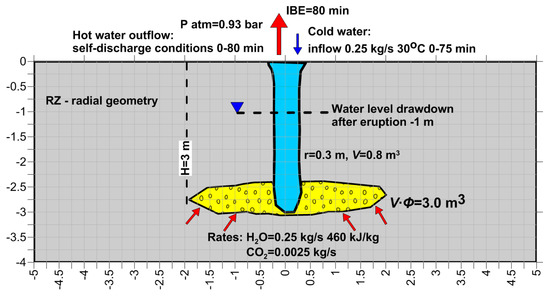
Figure 6.
Shaman geyser conceptual model of heat and mass recharge/discharge conditions, conduit (blue) and recharge reservoir (yellow) geometry.
Integrated Figure A7 in the Appendix A may be used as an illustration of the 5 min fountain eruption stage of the geyser, which was approximated as 5 min constant flow discharge, followed by the start of cold water injection in the geyser conduit.
6. TOUGH2-EOS2 Modeling of Shaman Cycling Conditions
6.1. Model Setup
The TOUGH2 program with EOS2 fluid module of state (water + CO2) [18] was used to reproduce the thermal–hydrodynamic processes in a geyser conduit and adjacent geothermal reservoir. The EOS2 fluid module describes single-phase and 2-phase conditions with two fluid components (H2O and CO2). In single-phase conditions, primary variables are P (pressure), T (temperature), and PCO2 (partial CO2 pressure). In 2-phase conditions, the primary variables are Pg (gas phase pressure), Sg (gas saturation), and PCO2 (partial CO2 pressure). In both cases, PCO2 is calculated using Henry’s law using the mole fraction of CO2 in a liquid phase XCO2liq and KH (Henry constant, non-linearly dependent of temperature) as input parameters. The CO2 component travels between phases according to the CO2 solubility defined by Henry’s law. Thus, if hot compressed single phase CO2-saturated water is going upward to a lower pressure discharge point, then it eventually comes into 2-phase conditions (when P minus PCO2 becomes less than saturation pressure at a given temperature (this is a check point in the TOUGH2 program to switch fluid phase conditions). Then, large volume changes may take place due to CO2 release from a dissolved state in a liquid to the gas phase.
A simple radial–cylindrical geometry with hot water feed and surface discharge/recharge conditions was used to describe the functionality of the Shaman geyser. Figure 7 shows the cross-section of this model including the numerical grid and boundary conditions.
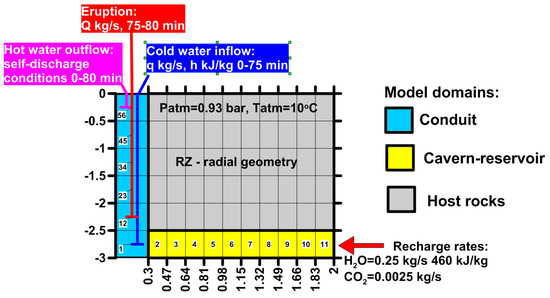
Figure 7.
Cross-section of the Shaman geyser RZ-model showing the numerical grid, model zonation, and boundary conditions. Numbers are the names of selected model elements.
Model geometry was assigned as a cylinder 3 m high with a 2 m radii, and a radial–cylindrical RZ-grid was used accordingly. Regular spacing in the Z direction (six elements) and non-regular spacing in the radial direction (0.3 m, 10 × 0.17 m) were applied.
Model zonation includes three domains: (i) the geyser conduit domain (CHAN) assigned to axial elements; (ii) adjacent reservoir domain (RESER) properties were assigned to the bottom layer of the model; and (iii) host–rock domain properties were assigned to the rest model elements (ROCK). All of the above model domain properties are shown in Table 3.

Table 3.
Material properties assigned in the model, linear relative permeabilities with zero residual saturations were assigned in all model domains.
Initial conditions in the top model layer elements (ROCK) were assigned as fixed temperature T = 10 °C and pressure P = 0.93 bars. Other model elements’ initial conditions were assigned as a result of natural state modeling with a constant flow/recharge boundary conditions.
Boundary conditions were defined in the following order: Hot water rate of 0.25 kg/s with enthalpy of 460 kJ/kg and CO2 rate of 0.0025 kg/s, with the same enthalpy assigned in the bottom layer. Surface discharge was assigned as a “well on deliverability” [17] in a top element of the geyser conduit (production index PI = 1 × 10⁻¹⁰ m3, bottom-hole pressure 0.95 bar, atmospheric pressure plus 0.2 m water column).
Another assumption of the model was the time-dependent cycling of sources and sinks. Cold water downflows were assigned at the bottom element of the geyser conduit with a rate q (unknown estimated parameter) and enthalpy h (unknown estimated parameter) as a time-dependent source active during the time interval [(k − 1) × IBE, 75 min + (k − 1) × IBE], where k is a cycle number (k = 1,2,3 … 10).
Geyser eruptions were assigned in a conduit element adjacent to the cold water injection element from above. Geyser eruptions were described in the model as a time-dependent sink with a rate Q (unknown estimated parameter), active during a 5 min time interval [75 min + (k − 1) × IBE, 80 min + (k − 1) × IBE], where k is a cycle number (k = 1,2,3 … 10).
6.2. Modeling Results
6.2.1. Steady-State Mode
Natural state (steady-state) modeling was run to define flow-gravitational equilibrium upon the boundary conditions defined above. During natural-state, run time-dependent sources and sinks were disabled in the model, hence this shows a constant rate of CO2-hot spring steady-state conditions. Figure 8 shows the P–T–Sg–PCO2–XCO2liq (pressure, temperature, gas saturation, partial CO2 pressure, and mass fraction of CO2 in liquid phase, respectively) conditions along streamlines from the point of reservoir recharge (element 11 of the model, where hot water inflow rate was assigned) to the point of discharge at the top of a vertical conduit (element 56 of the model, where self-discharge well on deliverability conditions were assigned) (see Figure 7 for numeration of the model elements).
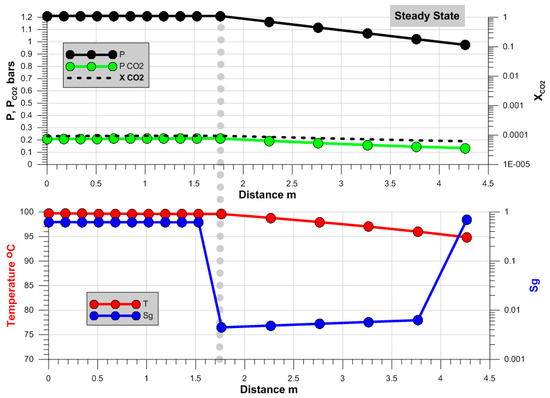
Figure 8.
Steady-state model (#8_A3_NS) parameter distributions (temperature in °C, gas saturation Sg, pressure and partial CO2 pressure PCO2 in bars, mass fraction of CO2 in a liquid phase) along a streamline from hot water recharge element #11 to discharge element #56 of the model (see Figure 7 for model element names references). Vertical dotted line corresponds to the position of flow direction change from radial-horizontal to ascending-vertical.
The first part of the streamline goes horizontally in the reservoir (distance from 0 to 1.77 m), then goes up vertically in the conduit (distance from 1.77 to 4.77 m). Two-phase flow conditions were observed throughout the entire model. Sg remained constant at 0.62 and temperatures were at an average of 99.7 °C in the reservoir, then Sg decreased to 0.004 at the bottom, slowly rising to 0.006 in the middle part, then sharply increasing to 0.70 in the shallow part of the conduit. Simultaneously, the temperature slowly declined in the conduit from 99.6 to 94.9 °C. Note that the temperature was significantly lower (from 4 to 5 °C) than the steam saturation temperature at a given pressure due to the lowering effect of PCO2 (from 0.21 to 0.14 bars). Mass fraction CO2 in a liquid phase varied from 9.21 × 10⁻⁵ to 6.21 × 10⁻⁵. Pressure drops along an upflow segment of the model (distance along a streamline from 1.77 to 4.27 m) from 1.21 (bottom) to 0.97 bars (top).
It is worth noting that total CO2 and H2O mass (in gas and liquid phases) stored in the system were 0.767 kg and 1842 kg, respectively (Table 4). This factor yielded a significantly lower (24 times) mass fraction of CO2 in the system (that is 0.00042) compared to the mass fraction of CO2 injected in the source (which was 0.01). This is an effect of the CO2 redistribution between phases. CO2 + H2O goes mostly in the gas phase in this case, as the liquid phase with low CO2 concentration was not in use, but accounted for bulk concentration estimates.

Table 4.
Mass in place (kg) during the three Shaman modes.
6.2.2. Geyser Cycling Mode
Once cycling model parameters appear in the model, then significant model cycling begins. We started from the steady-state discussed above, then applied 10 cycles. The model solution by cycle 10 was not sensitive to the initial conditions, which is was what we were looking for.
The cold water injection and geyser discharge rates in the model were adjusted to fit the in situ recorded temperature, when fountain activity was observed in the Shaman geyser (July 2019). The following estimates were obtained (using trial and error method) to obtain a match between a transient model and the observed temperatures: (1) Cold water injection q in the bottom of the geyser conduit (0.15 kg/s) with enthalpy h of 126 kJ/kg (water 30 °C) during a 75 min injection time; and (2) discharge rate Q = 3 kg/s during 5 min eruption time (Figure 9).
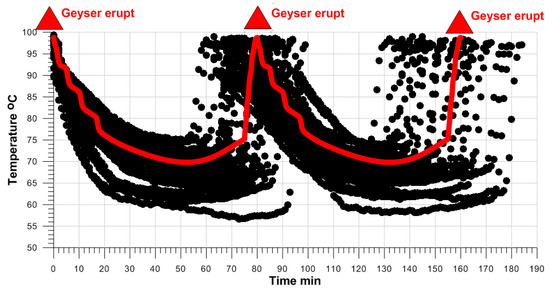
Figure 9.
Modeling (run #9B, unknown parameters estimations are: q = 0.15 kg/s, h = 126 kJ/kg (water 30 °C), Q = 3 kg/s) of the transient bottom temperature (red line) in the Shaman geyser vs. the bottom temperature records (dots) obtained during the time period of observations from 24.07.2019 09:00 to 28.07.2019 15:00.
Figure 10 shows the geyser pre-eruption conditions, which follow 75 min of cold water injection in the bottom of the geyser conduit (0.15 kg/s, 126 kJ/kg or 30 °C) as a distribution of P–T–Sg–PCO2–XCO2liq conditions along streamlines from the recharge (model element 11) to discharge point (model element 56) of the geyser system. Although the pressure profile remains similar to steady-state conditions, a significant difference from the steady-state in other model parameters was observed: (1) Temperature dropped from 100 °C to 72–75 °C in the geyser conduit; (2) Sg dropped to 0.001 in the lower and mid part of the conduit, the maximum was 0.201 in the top; (3) PCO2 rose to 0.63–0.82 bars in the conduit; and (4) Mass fraction CO2 in a liquid phase significantly rose to 4.6 × 10⁻⁴–3.7 × 10⁻⁴. We also noted that there was an increase in total CO2 and H2O mass (in gas and liquid phases) stored in the system: 1.081 kg and 2102.3 kg, correspondingly. Thus, total CO2 mass stored in the system increase was equal to 0.314 kg, compared to the steady state.
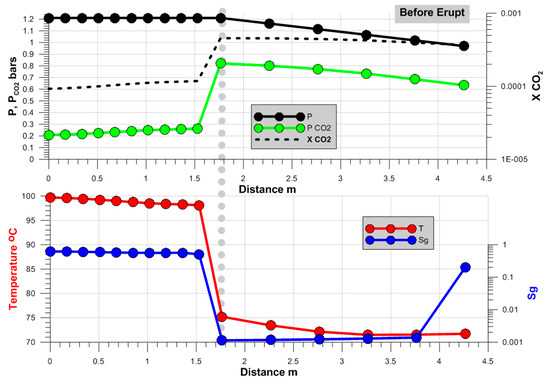
Figure 10.
State before eruption (run #9B): model parameter distributions (temperature in °C, gas saturation Sg, pressure and partial CO2 pressure PCO2 in bars, mass fraction of CO2 in a liquid phase) along a streamline from hot water recharge element #11 to discharge element #56 of the model (see Figure 7 for model element name references). Vertical dotted line corresponds to the position of flow direction change from radial-horizontal to ascending-vertical.
The geyser after eruption conditions are shown in Figure 11. This is what happens in a geyser system after 5 min of discharge with a rate of 3 kg/s as specified in the model. Sg rose to 1.0 in the middle and top parts of the geyser conduit, which showed that it was almost completely emptied from the liquid phase. Pressure dropped to 0.99 bar in the reservoir and to 0.95 bars in the conduit. CO2 mass fraction in a liquid phase varied from 0.18 × 10⁻⁴ to 4.5 × 10⁻⁴. Total CO2 and H2O mass (in gas and liquid phases) stored in the system was 0.650 kg and 1271.9 kg, correspondingly. Thus, CO2 mass release in a geyser model system during a geyser eruption was equal to 0.431 kg (corresponding to a volume of 219.4 L of CO2 at normal conditions) (Table 4).
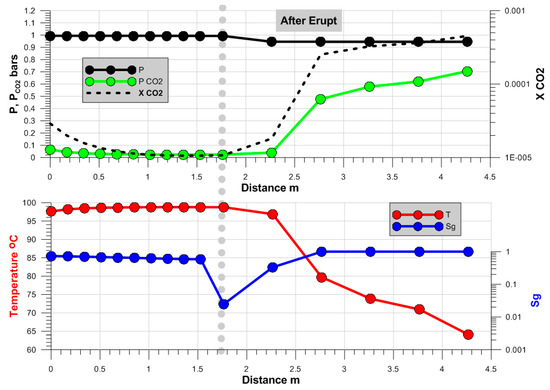
Figure 11.
State after eruption (run #9B): model parameter distributions (temperature in °C, gas saturation Sg, pressure and partial CO2 pressure PCO2 in bars, mass fraction of CO2 in a liquid phase) along a streamline from hot water recharge element #11 to discharge element #56 of the model (see Figure 7 for model element name references). Vertical dotted line corresponds to the position of flow direction change from radial-horizontal to ascending-vertical.
6.2.3. Cycling Flowrate Mode
Flowrate cycling mode was modeled in the same way as a geyser cycling mode. Cold water injection rate and hot spring discharge rate model parameters were adjusted to fit the transient temperature records during the time when no fountain activity was observed in the Shaman geyser (June 2019). The following estimates were obtained: (1) Cold water injection in the bottom of the conduit 0.15 kg/s (q), enthalpy 84 kJ/kg (h) (water 20 °C) during 75 min injection time; and (2) Discharge rate 2 kg/s (Q) during 5 min eruption time (Figure 12).
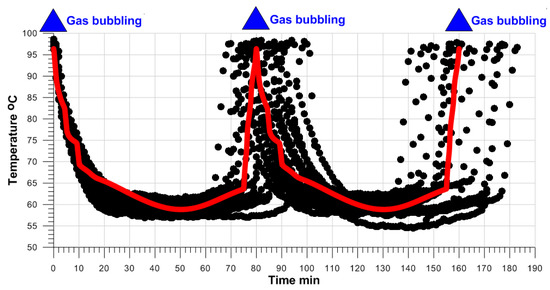
Figure 12.
Modeling (run #9A2, unknown parameter estimations were: q = 0.15 kg/s, h = 84 kJ/kg (water 20 °C), Q = 2 kg/s)) of the transient bottom temperature in the Shaman geyser vs. the bottom temperature records obtained during the time period of observations from 27.06.2019 18:00 to 29.06.2019 18:00 (Figure 5).
Figure 13 shows the P-T-Sg-PCO2-XCO2liq conditions along the streamline from the recharge (model element 11) to discharge point (model element 56) of the hot spring system at the following hot spring pre-eruption conditions: (1) Pressure profile remains similar to steady-state conditions; (2) Temperature dropped from 100 °C to 64 °C in a geyser conduit; (2) Sg dropped to 0.001 in the lower and mid part of the conduit, where the maximum was 0.124 in the top; (3) PCO2 rose to 0.77–0.94 bars in the conduit; and (4) Mass fraction CO2 in a liquid phase varied from 6.3 × 10⁻⁴ to 5.2 × 10⁻⁴ in the conduit. Total CO2 and H2O mass (in gas and liquid phases) stored in the system estimates: 1.199 kg and 2084.6 kg, respectively.
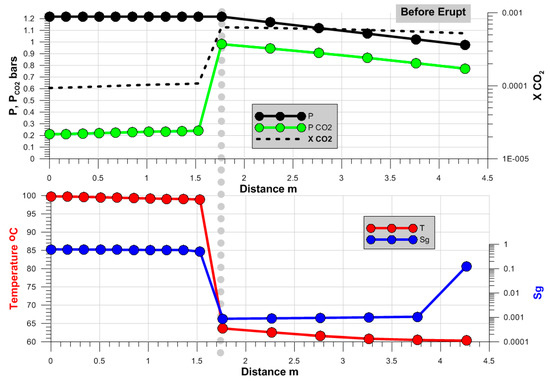
Figure 13.
State before eruption (run #9A2): model parameter distributions (temperature in °C, gas saturation Sg, pressure and partial CO2 pressure PCO2 in bars, mass fraction of CO2 in a liquid phase) along a streamline from hot water recharge element #11 to discharge element #56 of the model (see Figure 7 for model element names references). Vertical dotted line corresponds to the position of flow direction change from radial-horizontal to ascending-vertical.
Hot spring after eruption conditions are shown in Figure 14. This is what happens in the studied hot spring system after 5 min of discharge with a rate of 2 kg/s specified in the model. Sg rose to 1.0 in a top part of the geyser conduit. Pressure dropped to 1.05 bar in the reservoir and to 0.95 bars in the conduit. CO2 mass fraction in a liquid phase varied from 0.74 × 10⁻⁴ to 6.2 × 10⁻⁴. Total CO2 and H2O mass (in gas and liquid phases) stored in the system was 0.885 kg and 1551.7 kg, correspondingly. Thus, the CO2 mass release in a geyser model system during geyser eruption was equal to 0.314 kg (which corresponds to a volume of 159.9 L of CO2 at normal conditions) (Table 4).
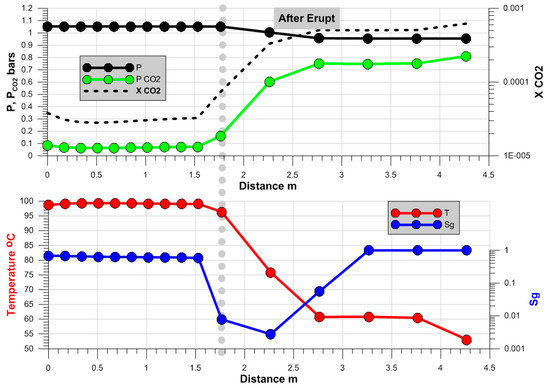
Figure 14.
State after eruption (run #9A2): model parameter distributions (temperature in °C, gas saturation Sg, pressure and partial CO2 pressure PCO2 in bars, mass fraction of CO2 in a liquid phase) along a streamline from hot water recharge element #11 to discharge element #56 of the model (see Figure 7 for model element names references). Vertical dotted line corresponds to the position of flow direction change from radial-horizontal to ascending-vertical.
7. Discussion and Conclusions
The Shaman geyser was formed in the Uzon caldera, Kamchatka in autumn 2008 in the place of a former hot spring. The initial eruptions with an IBE from 12 to 20 min from a conduit with a top diameter of 30 cm and depth of 2.3 m, enlarged the geyser conduit size to a top diameter of 60 cm and depth of 2.9 m. In a few years, the geyser achieved rather stable parameters of eruptions maintained in 2012–2017: an IBE from 129 to 144 min and fountain heights increased up to 4 m. In 2019, the geyser’s pool boiling temperature dropped to 80 °C, that is, a significantly lower value compared to the 97.6 °C of pure water under the local atmospheric pressure of 0.93 bar. That pointed to CO2-gas lift driven conditions during geyser eruptions [19]. CO2 dominance was proved by gas sampling and chemical analysis of non condensable gases NCG. Simultaneously, geyser pool subsidence took place, which caused the re-direction of the adjacent stream into the geyser conduit. As a sequence of cold water inflow, chemical component dilution was observed and IBE decreased to 80 min by 2019.
In June 2019, the Shaman geyser eruptions temporarily stopped, while cyclic discharge continued. Nevertheless, the Shaman geyser renewed its eruption mode in July 2019, when the cold water inflow rate declined and the inflow temperature rose due to seasonal change. Temperature records in the geyser bottom-hole conditions (depth of 2.9 m) were obtained in June and July 2019 in cyclic discharge and geyser mode correspondingly. Geyser conduit geometry, volume of geyser system, and CO2 discharge/recharge rate estimates were used to design a conceptual model of the Shaman geyser, relevant to conditions of 2019.
The TOUGH2-EOS2 numerical model was applied to reproduce the transient temperature records obtained in both modes (cycling hot spring and geyser). A simple R-Z model grid represents the geyser conduit joint to the cavern-reservoir at a depth of 3 m and host rocks. Matches of modeling results with temperature records yielded the following estimates of cold inflow rate and enthalpy and eruption rate, which were used as estimated model parameters. The geyser mode of cycling was realized in the model at an inflow rate of 0.15 kg/s and enthalpy of 126 kJ/kg (water 30 °C), and geyser eruption rate of 3 kg/s. Hot spring mode of cycling was realized in the model at an inflow rate of 0.15 kg/s and enthalpy of 84 kJ/kg (water 20 °C), and the geyser eruption rate of 2 kg/s.
Modeling showed that the geyser system CO2 storage capacity was significantly less (24 times), compared to the CO2 inflow concentration. Modeling also yielded estimates of net CO2 release during the geyser eruption cycle equal to 0.431 kg (corresponding to a volume of 219.4 L of CO2 at normal conditions), while net CO2 mass release during hot spring discharge cycle was equal to 0.314 kg (corresponding to a volume of 159.9 L of CO2 at normal conditions) (Table 4). Thus, 60 L of CO2 makes a difference for the Shaman geyser to be or not to be a “geyser”.
The following are concluding remarks on the uncertainties of the Uzon geyser TOUGH2-based model: (1) The geyser conduit was assumed to be a cylindrical domain with 99% porosity, while this is rather an empty nonregular-conically-shaped hole; (2) The geyser adjacent reservoir was assumed to be a horizontal layer with specified radius, while this was more likely to be a discrete fracture network system; (3) The geyser-reservoir system geometry was limited to a 3 m depth and 2 m in the radial direction, and a constant hot water and CO2 recharge was assumed; (4) Absence of the data of direct pressure measurements in a geyser conduit significantly restricted the inverse modeling capabilities; (5) Multiple fountain eruption was substituted by the piecewise constant discharge function; (6) Model grid sensitivity may be tested; and (7) Hot water and gas upflow recharge measurements using a probe with a pumping device atop may yield an overestimate of flow, while the tracer method may underestimate an active volume geyser system.
Nevertheless, one of the possible TOUGH2-model based solutions, which reasonably explained the geyser bottom hole transient temperature records, was obtained. We also used iTOUGH2-EOS2 inverse modeling capabilities [20] to verify the parameter estimates obtained above. This solution also explains the switch from cycling flowrate mode to geyser cycling mode in terms of maximizing the CO2 release on eruption stage.
Based on the above, measures to re-direct the cold stream from the geyser conduit to maintain Shaman geyser activity are recommended. We also recommend online monitoring of the Shaman geyser activity so that it might be a precursor of a new diatrem event (Figure 2).
Author Contributions
Conceptualization, A.V.K.; methodology, A.V.K.; software, A.V.K.; validation, A.V.K., G.K.; formal analysis, A.V.K.; investigation, A.V.K., G.K.; resources, A.V.K.; data curation, A.V.K., G.K.; writing—original draft preparation, A.V.K.; writing—review and editing, A.V.K.; visualization, A.V.K., G.K.; supervision, A.V.K.; project administration, A.V.K. All authors have read and agreed to the published version of the manuscript.
Funding
This work was supported by RFBR project #18-05-00052-20.
Acknowledgments
Significant logistic support during the field survey was given by Elena Subbotina. The authors also express their gratitude to G. Kroshkin, P. Shpilenok, D. Panicheva, A. Sergeyeva, N. Zhuravlev, T. Rychkova, A. Polyakov, E. Chernykh, P. Voronin, E. Kartasheva, V. Lavrushin, V. Grigoriyev, and N. Ostrik for transportation support, fruitful discussions, useful comments, participation in field surveys, sampling support and analysis, and manuscript preparation. We also appreciate the comments of Dr. Atsuko Namiki and four unknown reviewers, whose helpful advice was used to improve this manuscript. Thorough editing of the manuscript was performed by Prof. J.C. Eichelberger and is highly appreciated.
Conflicts of Interest
The funders had no role in the design of the study; in the collection, analyses, or interpretation of data; in the writing of the manuscript, or in the decision to publish the results.
Appendix A
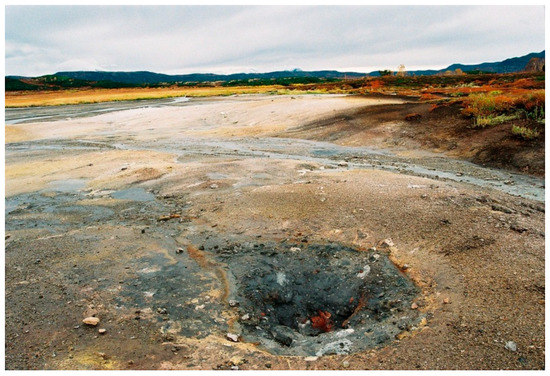
Figure A1.
Shaman conduit view in 2010 (photo by G. Karpov, south view).
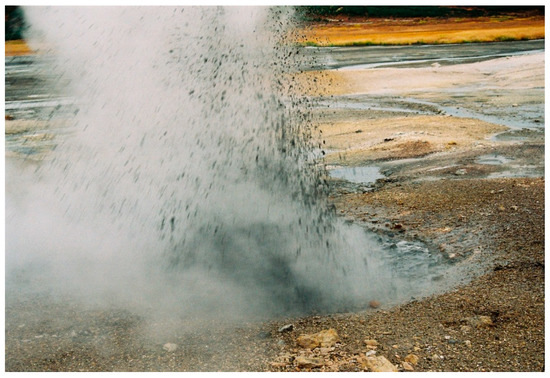
Figure A2.
Shaman geyser eruption in 2010 (photo by G. Karpov, south view).
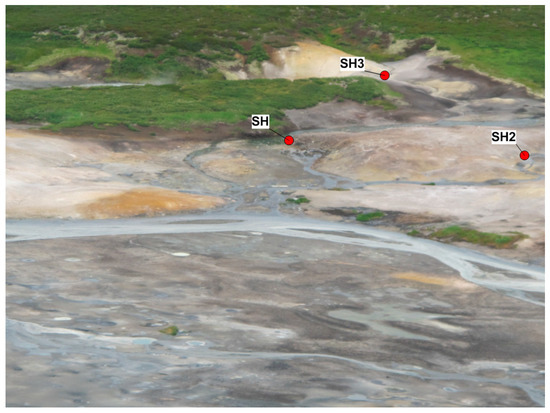
Figure A3.
Shaman geyser area view, SH—Shaman geyser, SH2—adjacent CO2 hot spring, SH3—hot spring in the upstream of creek, partially diverted into Shaman geyser conduit (photo by G. Karpov, 2015, northwest view).
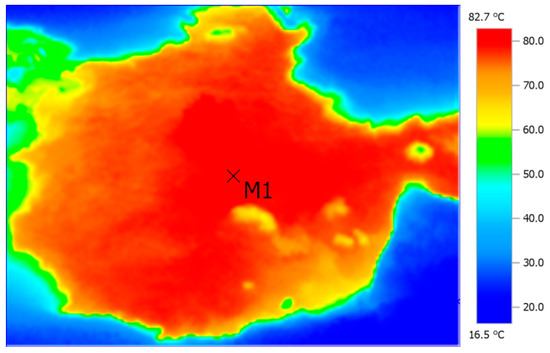
Figure A4.
Shaman geyser pool pre-eruption infrared (IR) (testo-865) view. Photo by A. Kiryukhin, 24 August 2019.
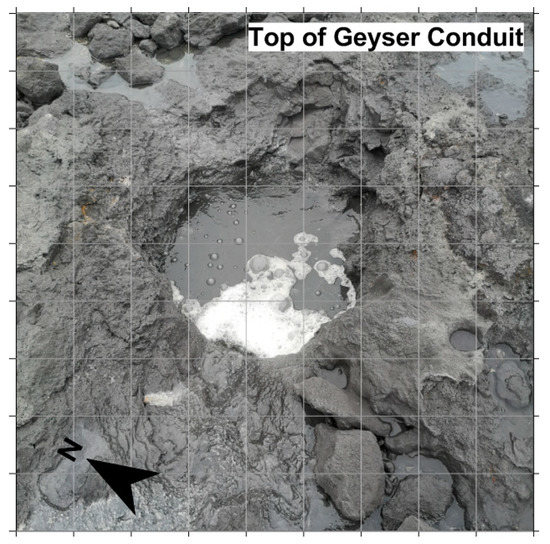
Figure A5.
Shaman geyser conduit top view, grid scale 20 cm. Photo by A. Kiryukhin, 24 August 2019.
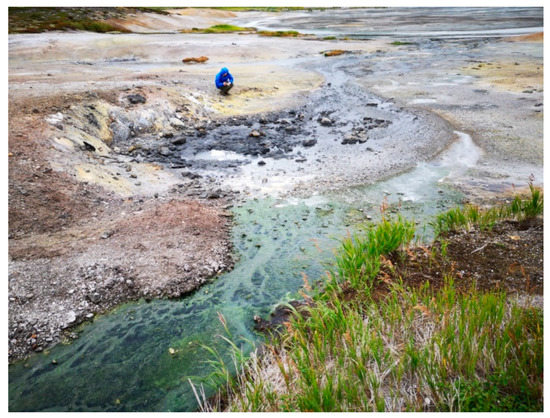
Figure A6.
Shaman geyser pool view, in front is partially diverted to the Shaman conduit creek, coming from SH3 (see Figure 2). Photo by A. Kiryukhin, 25 August 2019.
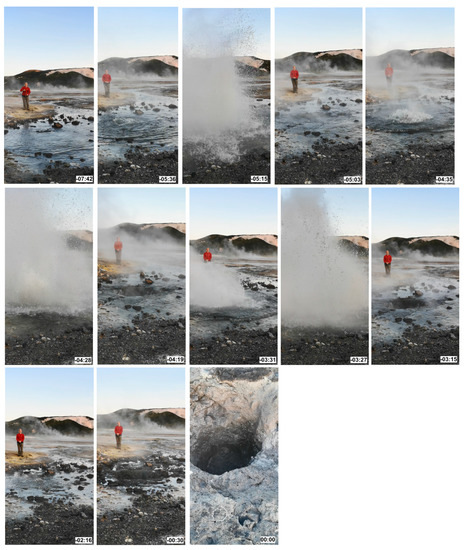
Figure A7.
Shaman geyser eruption events on 24 August 2019 20:01. Times (negative): −07:42—discharge; −05:36—discharge increase; −05:15—eruption #1; -05:03—some backflow; −04:35—discharge increase; -04:28—eruption #2; −04:19—some backflow; −03:31—discharge increase; −03:27—eruption #3; −03:15—some backflow; −02:16—discharge increase, but no eruption commenced; -00:30—backflow recharge start; −00:15, −00:08; 00:00—cold water inflow in geyser conduit starts and continues, water level in conduit is 1 m in depth. Time stamp format minutes:seconds. Photo by A. Kiryukhin, 24 August 2019.
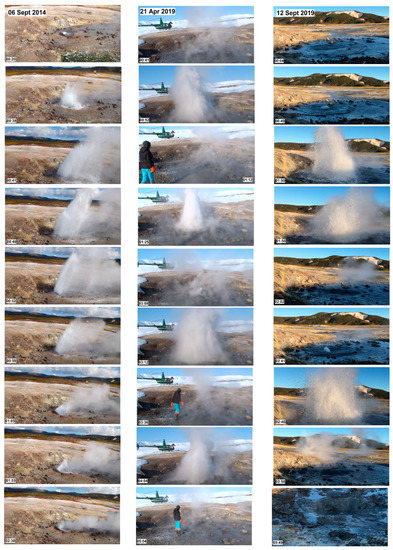
Figure A8.
Shaman geyser eruptions on 06.09.2014, 21.04.2019, and 12.09.2019 and the conduit top view in 2019. Time stamp format in a left-bottom minutes:seconds. (photo by A. Kiryukhin (06.09.2014, 21.04.2019) and N. Ostrik (12.09.2019)).
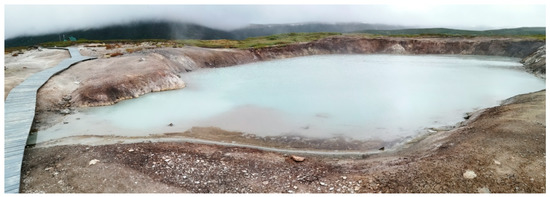
Figure A9.
Bannoye Lake/Maar. Photo by A. Kiryukhin, 24 August 2019.
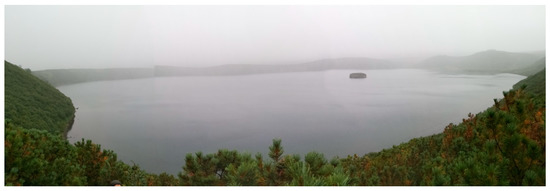
Figure A10.
Dalneye Lake/Maar. Photo by A. Kiryukhin, 24 August 2019.
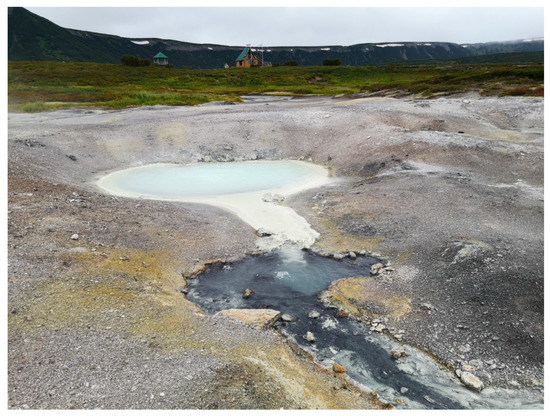
Figure A11.
Shaman-2 CO2-hot spring located adjacent to the Shaman geyser (next candidate to be a geyser in the Uzon caldera). Photo by A. Kiryukhin, 25 August 2019.
References
- Hurwitz, S.; Manga, M. The fascinating and complex dynamics of geyser eruptions. Annu. Rev. Earth Planet. Sci. 2017, 45, 31–59. [Google Scholar] [CrossRef]
- Hurwitz, S.; Clor, L.E.; McCleskey, R.B.; Nordstrom, D.K.; Hunt, A.G.; Evans, W.C. Dissolved gases in hydrothermal (phreatic) and geyser eruptions at Yellowstone National Park. USA Geol. 2016, 44, 235–238. [Google Scholar] [CrossRef]
- Han, W.S.; Lu, M.; MCPherson, B.J.; Keating, E.H.; Moore, J.; Park, E.; Watson, Z.T.; Jung, N.-H. Characteristics of CO2-driven cold-water geyser, Crystal Geyser in Utah: Experimental observation and mechanism analyses. Geofluids 2013, 13, 283–297. [Google Scholar] [CrossRef]
- Walter, T.R.; Jousset, P.; Allahbakhshi, M.; Witt, T.; Gudmundsson, M.T.; PállHersir, G. Underwater and drone based photogrammetry reveals structural control at Geysir geothermal field in Iceland. J. Volcanol. Geotherm. Res. 2018, 391. [Google Scholar] [CrossRef]
- Namiki, A.; Ueno, Y.; Hurwitz, S.; Manga, M.; Munoz-Saez, C.; Murphy, F. An experimental study of the role of subsurface plumbing on geothermal discharge, Geochem. Geophys. Geosyst. 2016, 17. [Google Scholar] [CrossRef]
- Kiryukhin, A.V.; Rychkova, T.V.; Dubrovskaya, I.K. Hydrothermal system in Geysers Valley (Kamchatka) and triggers of the Giant landslide. Appl. Geochem. 2012, 27, 1753–1766. [Google Scholar] [CrossRef]
- Kiryukhin, A.V.; Rychkova, T.V.; Sergeeva, A.V. Modeling conditions of permeable geyser conduit formations in silicic volcanism areas. J. Volcanol. Seismol. 2020, 2, 3–16. [Google Scholar]
- Kiryukhin, A. Modeling and observations of geyser activity in relation to catastrophic landslides–mudflows (Kronotsky nature reserve, Kamchatka, Russia). J. Volcanol. Geotherm. Res. 2016, 323, 129–147. [Google Scholar] [CrossRef]
- Kiryukhin, A.; Sugrobov, V.; Sonnenthal, E. Geysers Valley CO2 Cycling geological Engine (Kamchatka, Russia). Geofluids J. 2018, 17. [Google Scholar] [CrossRef]
- Leonov, V.L. Geological Structure and History of Geysers Valley. In The Valley of Geysers—The Pearl of Kamchatka (Scientific Guide); Petropavlovsk-Kamchatsky: Kamchatpress, Russia, 2009; pp. 45–51. [Google Scholar]
- Lundgren, P.; Lu, Z. Inflation model of Uzon caldera, Kamchatka, constrained by satellite radar interferometry observations. Geophys.Res. Lett. 2006, 33, L06301. [Google Scholar] [CrossRef]
- Karpov, G.A. Sulphur Melt in a Bottom of Thermal Lake in Uzon Caldera (Kamchatka). J. Volcanol. Seismol. 1996, 2, 34–47. (In Russian) [Google Scholar]
- Droznin, V.A. New Geyser in Uzon Caldera. Vestnik KRAUNC 2009, 2, 10–12. (In Russian) [Google Scholar]
- Karpov, G. New Geyser in Kronotsky Reserve. Characteristics and Reasons of Formation Proc. IVS FEB RAS Conf. Vulcan. Relat. Process. 2010. Available online: http://www.kscnet.ru/ivs/publication/volc_day/2010/art12.pdf (accessed on 14 May 2020).
- Karpov, G. Evolution of Regime and Physical-Chemical Characteristics of the New Formed Geyser in Caldera Uzon (Kamchatka). Volcanol. Seismol. 2012, 3, 3–14. [Google Scholar]
- Karpov, G.A.; Schroeder, P.A. and Nikolaeva, A.G. Geochemistry of rare-earth elements in thermal waters of the Uzon-Geyzernaya hydrothermal system (Kamchatka). Geol. Geophys. 2018, 59, 1152–1163. [Google Scholar]
- Etiope, G.; Lollar, B.S. Abiotic methane on Earth. Rev. Geophys. 2013, 51, 276–299. [Google Scholar] [CrossRef]
- Pruess, K.; Oldenburg, C.; Moridis, G. TOUGH2 User’s Guide, Version 2.0. Rep. LBNL-43134; Lawrence Berkeley Natl. Lab.: Berkeley, CA, USA, 1999; 198p.
- Rychkova, T.V. Hydrogeological Analysis of the Geysers Formation and Functionality (Kamchatka Hydrothermal Systems Examples). Ph.D. Thesis, F.O.N., OOO, Petropavlovsk-Kamchatsky, Russia, 2020; 20p.
- Finsterle, S. iTOUGH2 V7.0 Command Reference. In Rep. LBNL-40041 rev., 2014; Lawrence Berkeley Natl. Lab.: Berkeley, CA, USA; 130p.
© 2020 by the authors. Licensee MDPI, Basel, Switzerland. This article is an open access article distributed under the terms and conditions of the Creative Commons Attribution (CC BY) license (http://creativecommons.org/licenses/by/4.0/).