Abstract
The Kirishima Volcano Group is a volcanic field ideal for studying the mechanism of steam-driven eruptions because many eruptions of this type occurred in the historical era and geophysical observation networks have been installed in this volcano. We made regular geothermal observations to understand the hydrothermal activity in Ebinokogen Ioyama Volcano. Geothermal activity resumed around the Ioyama from December 2015. A steam blowout occurred in April 2017, and a hydrothermal eruption occurred in April 2018. Geothermal activity had gradually increased before these events, suggesting intrusion of the magmatic component fluids in the hydrothermal system under the volcano. The April 2018 eruption was a magmatic hydrothermal eruption caused by the injection of magmatic fluids into a very-shallow hydrothermal system as a bottom–up fluid pressurization, although juvenile materials were not identifiable. Additionally, the upwelling of mixed magma–meteoric fluids to the surface as a kick was observed just before the eruption to cause the top–down flashing of April 2018. A series of events was generated in the shallower hydrothermal regime consisting of multiple systems divided by conductive caprock layers.
1. Introduction
Explosive volcanic eruptions that do not contain juvenile materials have been called by several names, e.g., steam, phreatic or hydrothermal eruption. Although the terms phreatic eruption and hydrothermal eruption have similar meanings, the two are sometimes confused [1]. Hydrothermal eruption is often used in the geothermal fields in New Zealand and in the USA. The eruption termed here has both shallow and deep origins [2,3]. The general nomenclature for steam-driven eruptions is categorized into two types. First, phreatic eruption, which is an eruption that is caused by the heating and flashing of water produced when magma comes in contact with water. This results in the ejection of only country rock or overburden, i.e., no juvenile magmatic material. Second, hydrothermal eruption, which is an eruption that ejects at least some solid material and whose energy derives solely from heat loss and phase changes in a convecting hot water or steam-dominated hydrothermal system [3]. Steam-driven events are the most common phenomena in volcanic activity and are not easy to forecast, although there are many investigations on their precursory signals [1,4]. To explain steam-driven eruptions that contain non-juvenile materials, several mechanisms have been considered. The current perspective is that the eruption is triggered by the decompression driven boiling of ground hydrothermal fluids [2,3,5]. This type of mechanism is referred to as an abrupt departure from equilibrium conditions and has been experimentally produced by engineering researchers in Japan [6,7,8]. The 2014 eruption at Ontake Volcano in central Japan is considered one example of an abrupt departure from equilibrium conditions [9,10,11]. However, the true trigger of the eruption have not yet been made clear. One of the triggers of eruption in general may be pressurization of a hydrothermal system heated by input of magmatic fluids from the depths (bottom–up gas/fluid pressurization) [12]. In this case, an eruption is caused by the fluid pressure exceeding the lithostatic pressure [3,13]. Another trigger is decompression of the hydrothermal reservoir for external reasons. For example, a water level drop, drilling or a landslide can cause the flashing from the top to downward (top–down flashing) [12,14,15,16]. These processes are not simple, depending on the material heterogeneity under the ground, groundwater distribution and caprock development. In fact, the caprock structure is considered important for storing hydrothermal liquids. The caprock formation of silica or hydrothermal minerals is considered to be the layer that controls the sealing and release of hydrothermal fluids within different depths of a volcanic edifice e.g., [3,17,18,19]. In recent years, magnetotelluric (MT) surveys revealed the existence of highly conductive layers in the shallow parts of volcanic edifices, which are considered to be hydrothermally altered zones with an abundance of clay minerals such as smectite [20,21,22,23,24]. In Ebinokogen Ioyama Volcano, this conductive layer is located 200 to 700 m below the surface, with a pressure source below it [25]. It has been suggested that this layer is the low permeability.
Many casualties have been previously reported from steam-driven (phreatic) eruptions in Japan, including from events at Adatara Volcano in 1900, Kusatsu-Shirane Volcano in 1932, Aso Volcano in 1958 and Ontake Volcano in 2014 [10,26,27,28]. Meanwhile, geothermal areas—with the potential for steam-driven eruptions—often develop beneath a shallower hydrothermal system in a volcano and are beneficial as sightseeing spots. In the past, many laborers mined sulfur in these fumarolic areas in Japan. Expeditious information on the resumption of volcanic activity in such geothermal areas is crucial, and lack of timeliness has grave consequences. Sometimes, the occurrence of an explosive steam-driven eruption is preceded by a few signs. However, in other cases, an eruption may fail, even during an increase in geothermal activity. There are various precursory phenomena and event sequences that precede steam-driven eruptions: it is necessary to clarify what causes such a variety.
In Kirishima Volcano Group, steam-driven eruptions occurred at Shinmoedake in 1959, 1991–1992, 2008 and 2010 [29,30,31]. And they occurred at Ebinokogen Ioyama in 1768 [32]. These eruptions differed in impact and chronology. For example, at Shinmoedake Volcano, a phreatic eruption in 1959 was a strong explosive event with 8.6 million tons of ejecta in a short time and was accompanied by a blast [33]. However, the 1991–1992 eruption was extremely small, producing 360 tons of ejecta and leaving climbers unharmed on the summit crater rim [30]. Steam-driven eruptions have been dominant at Ebinokogen Ioyama Volcano over the long term, and there has been geothermal activity around there in recent times [32,34,35]. At Ebinokogen Ioyama located near tourist spots and mountain trails, volcanic activity has been observed since the 1910s. We recorded the activity just before the latest steam-driven eruption at Ebinokogen Ioyama Volcano in April 2018. Here, we discuss the sequence of geothermal activity and the possible phenomenology, especially focusing on the hydrothermal aquifer depth and the precursory signals of the eruption.
We use the above-mentioned terms of phreatic eruption and hydrothermal eruption, as suggested by Brown and Lawless [3]. Since juvenile materials were not found in the products from the 2018 Ebinokogen Ioyama eruption, hydromagmatic and phreatomagmatic eruptions are not considered here. In this study, a fumarolic jet is described as the phenomenon in which geothermal jetting occurs with jet-like roaring sounds [36], and the vent of such a fumarole is referred to as a jet fumarole vent. The term “fumarole area” refers to a place that contains many relatively weak to strong jet fumaroles. A small hole from which hot muddy hydrothermal fluids well up is called a mud pot [37], and a larger irregular-shaped pool with hydrothermal fluids is called a hydrothermal pond. The time description in this study is the Japan Standard Time (JST), UTC+9.
2. Geological Setting
The Kirishima Volcano Group is a compound group of volcanoes extending from the southeast to the northwest (Figure 1). This volcano has grown since the Kakuto ignimbrite eruption in 340 ka [38]. Shinmoedake, Nakadake, Ohachi and Takachihomine volcanoes produced frequent magmatic eruptions during the last 10 ky. Furthermore, Miike Volcano produced a Plinian eruption in 4.6 ka characterized a single massive eruption. Ebinokogen Ioyama and Ohatayama volcanoes produced dominant steam-driven eruptions during the last 10 ky e.g. [32]. The historical eruptions are recorded in Ebinokogen Ioyama, Shinmoedake and Ohachi volcanoes [29].
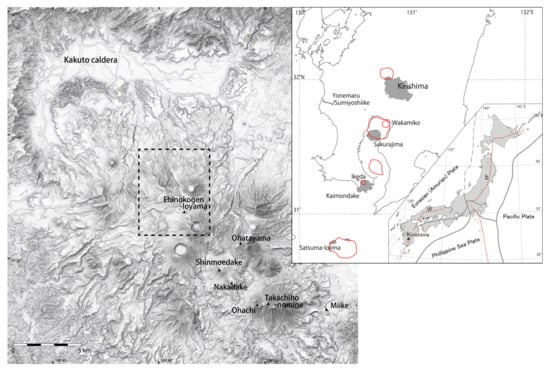
Figure 1.
Geographic map of Kirishima Volcano Group. Dashed box shows the map of the study area in Figure 2. The base map with Kashimir3D [39]. In the upper right corner, the red circles denote the calderas while the gray areas indicate active volcanoes. VF: Volcanic front.
Around the Ebinokogen area, Karakunidake Volcano produced a Plinian eruption in 16.7 ka, forming the present Karakunidake cone [29,40]. Magmatic eruptions did not occur in this area between 16.7 and 9 ka. The small eruptions were repeated in the saddle place surrounded by older Karakunidake, Koshikidake and Ebinodake volcanoes (Figure 2a). The eruption of Fudoike lava flow with tephra occurred at the Fudoike Crater in 9 ka. The small amphitheater topography was formed by steam-driven eruptions with an avalanche (Karakunidake debris avalanche) in 4.3 ka. It was followed by a steam-driven eruption in 1.6 ka at Fudoike Crater, a lava flow between 0.3 and 0.4 ka at Ioyama and a steam-driven eruption in 1768 AD at Ioyama east crater. Ebinokogen Ioyama Volcano has formed from 9 ka [32].
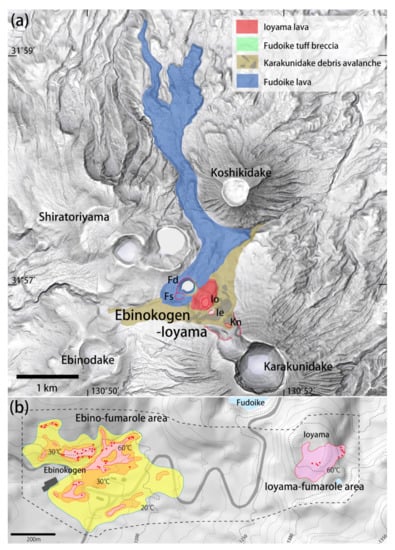
Figure 2.
Shaded relief maps showing geological and geothermal features around Ebinokogen Ioyama Volcano. (a) Distribution of lavas and craters over 10,000 years [32]. Kn: Karakunidake north crater, Ie: Ioyama east crater, Io: Ioyama crater, Fd: Fudoike Crater, Fs: Fudoike south crater. Red circular lines denote the crater, red curves with ticks denote the amphitheater. The relief map using Kashimir3D [39]; (b) The distribution of Ebino-fumarole and Ioyama-fumarole areas in the 1950s [41]. Red points: active fumaroles. Numerals: the temperature of isothermals.
Geothermal activity is known to have continued at Ebinokogen Ioyama since around the 1900s (Meiji Era). The geothermal area was divided into two areas in the east as the Ioyama-fumarole area and in the west as the Ebino-fumarole area in the 1950s (Figure 2b). The center of the Ebino-fumarole area was about 1 km west from the center of the Ioyama-fumarole area [41]. Sulfur mining was worked in the Ioyama-fumarole area in the 20th Century. A fumarole temperature in the Ioyama lava was over 80 °C on 12 August 1916 [42]. Akiko Yosano, a famous poet in Japan, described fumaroles in this area in one of her poems in 1929 [43]. The temperatures of the Ioyama-fumarole area were between 96 and 120 °C in 1954 [41]. The highest temperature recorded 247 °C in the Ioyama-fumarole area in March 1975 [34]. It gradually declined in the 1990s, and its activity had stopped by around 2008 [43].
Alteration identified kaolinite, alunite and montmorillonite zones at the geothermal or alteration areas in the western part of Kirishima Volcano Group. The kaolinite zone was distributed within small area around the Ioyama, while the alunite zone surrounded the kaolinite zone. The presence of the following minerals reported alunite, kaolinite, quartz, cristobalite, halloysite, montmorillonite, tridymite and jarosite in the alteration area [44].
3. Methods
3.1. Geothermal Observations
Geothermal features were ordinarily mapped to monitor changes in geothermal activity and were used to understand precursory signals in Ebinokogen Ioyama Volcano. We monitored changes in the geothermal area from December 2015 by measuring the temperatures of the springs and fumaroles at fixed points. A thermal anomaly was observed in the area about 10 cm below the surface where the temperatures were higher than 50 °C. In the early stage of this observation, the area of geothermal anomaly was measured by trilateration using measuring tapes. The measurements were plotted on a plan map to calculate the area that was 50 °C and above in temperature. However, the anomaly area rapidly expanded, and we put colored markers at 50 °C points on the ground and took aerial photographs using drones (DJI Phantom 3 and 4). The markers, 18 cm in diameter, were visible from tens of meters above. The areas over 50 °C in temperature were plotted on the ortho-image to measure the area based on the drone observation made (Figure 3). A Google Earth [45] map was also used for the area uncovered by the drone observation. Simultaneously, we measured the temperatures and pH values of water at the spring points west of the Ioyama.
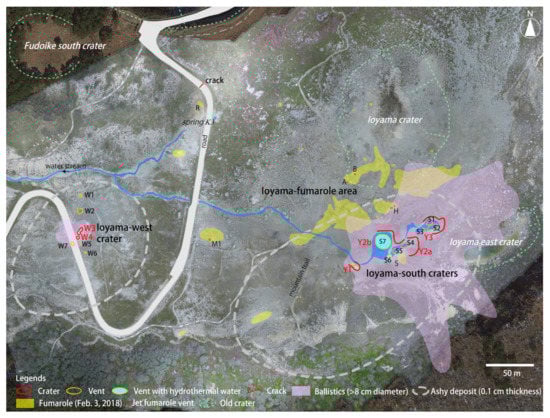
Figure 3.
Drone image showing the distribution of geothermal features, ejecta and craters formed during the April 2018 eruption. Yellow areas: fumaroles, as observed on 3 February 2018 and jet fumarole vents (thin red circles). Orange circles: Eruption and hydrothermal vents appeared as Y1 (7 April 2018), S1 to S7 (19 to 20 April 2018) and W1 to W7 (20 to 21 April 2018). The distribution of ballistics is shown for over φ8 cm. Gray dash lined: ashy deposit with a thickness of 0.1 cm. Bold red lines and texts: eruption craters Y2a, Y2b, Y3, Y1, W3 and W4. Blue areas: hydrothermal ponds and streams. R is a mud pot that appeared after the eruption. The red line on the road is a crack.
3.2. Geochemical Analyses
Analyses of eruption products from the 2017 event and the 2018 eruption at Ebinokogen Ioyama were conducted using X-ray diffraction (XRD). Samples smaller than 0.063 mm were washed in extra pure water and a randomly oriented powder prepared and mounted on a glass slide according to the method of Itoh et al. [46]. Rigaku MiniFlex 600 and the PDXL2.6 software were used. Smectite and chlorite peaks at 15 Å were determined by using the peak shift of smectite to 16–18 Å after the samples were treated in ethylene glycol. Kaolinite and chlorite peaks at 7 Å were determined by utilizing the peak disappearance of chlorite after treatment in HCl solution for 2 h. Relative amount of minerals was analyzed by Reference Intensity Ratio (RIR) in the PDXL 2.6 software.
Oxygen isotope ratios of water samples were analyzed using a mass spectrometer from Thermo Fisher Scientific, Inc. (Waltham, MA, USA) (MS: Delta plus) with the automated CO2–H2O equilibrium method or using a Cavity Ringdown Spectrometer from Picarro, Inc.(Santa Clara, CA, USA) (CRD: L2130-i Isotopic H2O). The precisions for both analyses are ±0.1‰.
Hydrogen isotope ratios of samples were analyzed using MS (Delta V) with automated H2–H2O reduction method (H-device) or by CRD. The precisions for both analyses are ±1‰.
4. Events at Ebinokogen Ioyama Volcano
4.1. Stage-1: December 2013 to December 2015
Seismic activity began in the northern area of Karakunidake in December 2013, after the sub-Plinian eruptions at Shinmoedake Volcano [47] in January 2011. A volcanic tremor event lasting 7 min was observed beneath Ebinokogen Ioyama Volcano on 20 August 2014 [48]. The seismic activity tended to gradually increase in 2015, swarmed in July, and tremor events were observed from July to October [49]. Very weak signs of unrest such as a hydrogen sulfide (H2S) smell near the western foot of the Ioyama lava were observed from October 2015 (Figure 4). Stage 1 therefore, is the period from December 2013 to December 2015, during which there was seismic activity, but without any noticeable geothermal activity on the surface.
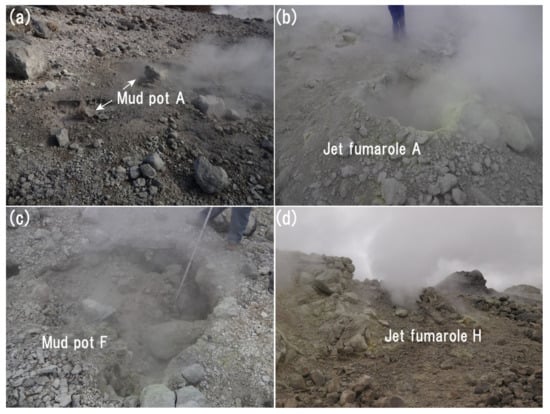
Figure 4.
The sequence of geothermal activities at Ebinokogen Ioyama Volcano from July 2014 to June 2018. Geothermal locations are shown in Figure 3. (a) Yellow areas and bars denote the activity of Ioyama-fumarole area. Light blue line indicates a sulfur smell. Orange line denotes a jet fumarole. Blue line denotes a mud pot or hydrothermal pond. Tremor and low-frequency earthquake (LFE) based on the Japan Meteorological Agency (JMA) web site [50]; (b) Temperature observed at point A, before turning into a jet and the jet fumarole A; (c) Temperature observed at point H, before turning into a jet and the jet fumarole H; (d) Water temperature observed at the spring K3; (e) pH of water observed at the spring K3; (f) Geothermal anomaly (>50 °C) area in the summit of Ioyama. Triangles include larger error values.
4.2. Stage-2: December 2015 to January 2017
On the afternoon (around 4 pm) of 14 December 2015, a hiker found a very small fumarole on the southwest rim of the Ioyama old crater at the A point in Figure 4. The location had previously been identified as the area of fumaroles [34]. The fumarole temperature was measured at 80 °C that day. On 25 and 27 December, temperatures of between 93 and 96 °C were recorded at the summit area of Ioyama. The water boiling temperature at an altitude of 1300 m is about 96 °C. Since then, the area with a thermal anomaly expanded north and east, mainly in the southern part of the Ioyama lava (Figure S1a–f). The water temperature at the spring K3 increased from about 21 °C at the end of December 2015 to about 27 °C in March 2016, synchronized with the expansion of the thermal anomaly area. There was a brief stability of the area of thermal anomaly from April to August 2016. The thermal anomaly area began to expand again from late 2016 (Figure S1g), and the expansion rate increased from early 2017. From December 2015 to January 2017, Stage-2, there was small expansion of the thermal anomaly area, but temperatures of the fumaroles remained about 96 °C (Figure 4).
4.3. Stage-3: January 2017 to February 2018
The geothermal anomaly area expansion rate increased from early 2017 and continued until early summer 2017 (Figure S1h–j). During the expansion of the thermal anomaly area, the jet fumaroles H and A were formed. The mud pot A was observed at the point A on 19 March (Figure 5a), and another pot appeared at F between 19 and 21 March (Figure 5c). Hydrothermal fluids continued to well at these pots and the jet fumarole H, 30 m east of the mud pot F, started roaring between 15 and 18 April. This activity around the fumarole H was reported in the “YamaReco” web site [51]. We surveyed the roaring jet fumarole H on 22 April 2017 (Figure 5d). Then the jet fumarole vent A with a 1.5 m diameter was first observed about 10 m away from the mud pot A on 5 May (Figure 5b). The area near the jet fumarole vent A was covered with a thin layer of light gray ash-sized altered material (ashy deposit) with block-sized altered host rock ejecta over a distance of a few meters. The surface on the southwestern area of the jet fumarole vent A became grayish-white.
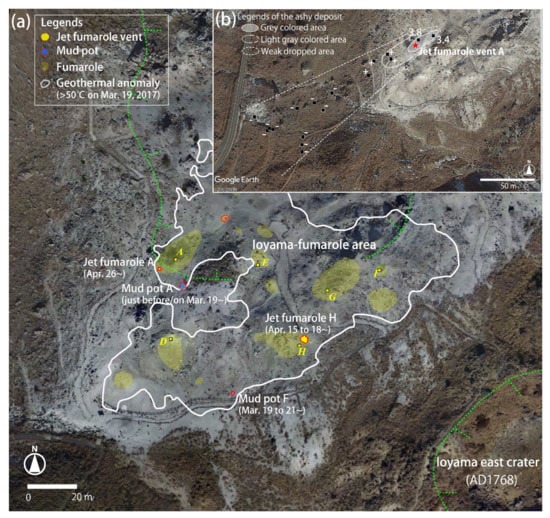
Figure 5.
Details of geothermal activity at Ioyama fumarole area during Stage-3. (a) Mud pot A appeared just before/on 19 March 2017 (Photo on 19 March); (b) Jet fumarole A appeared on 26 April 2017 (Photo on 7 May); (c) Mud pot F appeared between 19 and 21 March 2017 (Photo on 22 April); (d) Jet fumarole H appeared between 15 and 18 April 2017 (Photo on 22 April).
That ashy deposit was found on green leaves and could be traced to about 200 m from the vent (Figure 6). The amounts of the deposit at two points around the jet fumarole vent A were 3.8 kg/m2 and 3.4 kg/m2. As the thickness of the deposit was nearly the same, the mass was estimated to be roughly 1 ton. The amount of deposit around the jet fumarole vent A coincided with the volume of the vent. We did not notice any change in the fumarole activity in this area until the morning of 26 April, according to the video footage of the Ioyama–south web camera maintained at the Japan Meteorological Agency (JMA) [50]. However, the footage showed a gray-white steam rising from the fumarole A at 11:29 am on 26 April 2017. The steam moved to the southwest from 10:20 am to 11:30 am, which coincided with the area covered with the ashy deposit. Therefore, it was concluded that the altered material ashy deposit was blown out from the jet fumarole vent A around 11:29 am on 26 April. The high rates of geothermal activity at the jet fumarole vents continued until July 2017. The temperature of the jet fumarole H was 134.2 °C on 24 September 2017. The geothermal anomaly area decreased from late summer or early autumn in 2017 (Figure S1k).
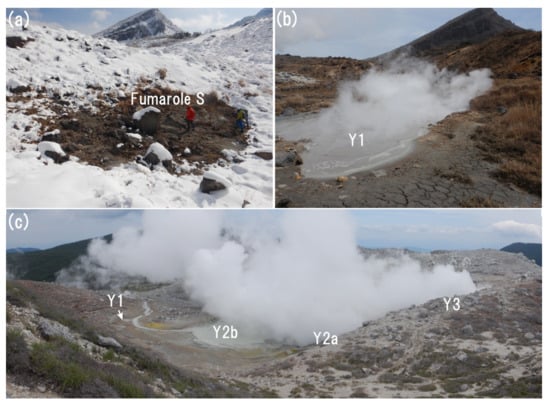
Figure 6.
Drone and satellite map of the Ioyama-fumarole area. (a) Locations of mud pot A, jet fumarole vent A, mud pot F and jet fumarole vent H. Observation points are indicated by italic alphabet.; (b) Distribution of ashy deposit from the jet fumarole vent A on a Google Earth map [45]. +: coated, -: visible, two values of ashy deposit weight per a square (kg/m2).
4.4. Stage-4: February 2018 to December 2018
The expansion of the geothermal anomaly area resumed around February 2018 (Figure 4). The fumarole S appeared about 30 m south of the Ioyama-fumarole area on 3 February 2018 (Figure 7a and Figure S1l). While the previous fumarole spots were named sequentially, beginning with A, this was named S.
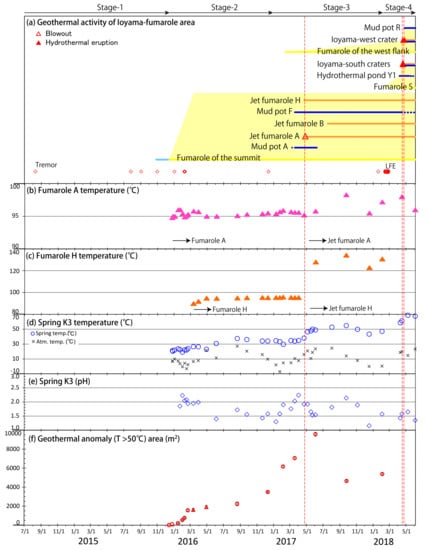
Figure 7.
Photos showing the geothermal activity around Ioyama-fumarole area in 2018. (a) New fumarole S appeared at the south side of Ioyama-fumarole area (Photo on 3 February); (b) Hydrothermal pond Y1, 9 m long and 5 m wide that formed on 7 April (Photo on 16 April); (c) Distribution of craters of the steam driven eruption on 19 April (Photo on 4 June).
The outline of the eruption at the southern and western parts of the Ioyama-fumarole area in April 2018 (the 2018 Ebinokogen Ioyama eruption) was presented in our previous report [52]. The first sign, just 12 days before the eruption, was the appearance of the hydrothermal pond Y1 from around 2 am on 7 April 2018 [53]. The size of the pond Y1 was 9 m long and 5 m wide, and hydrothermal water had welled out and flowed downstream from the pond under observation on 16 April (Figure 7b). The temperature of the hydrothermal pond Y1 was 93.0 °C at that time. The activity of the fumarole S continued on 16 April, and the jet fumarole H was accompanied with vigorous roaring.
An eruption began on the south side of Ioyama at 3:39 pm on 19 April [53]. It took place first at the vent S5 near fumarole S, and almost immediately the vent S2 opened, expelling vigorous white steam moving about 30 m northeast from the vent S5 (Figure 3). This succession was captured in the NHK news video. Both vents appeared almost simultaneously within a span of one minute, and the vigorous steams developed into white to pale gray-white plumes with heights of 100 to 200 m. Subsequently, the plume from vent S5 heightened, and the basal jet part of the plume changed color intermittently from gray-white to brown. The size of the vent S2 also widened, and steams also rose from small vents around the vent S2. During an aerial survey with an airplane on the morning of 20 April, we found a new jetting fountain of dark-colored hydrothermal fluids at the vent S7 as a pond. The vents S1 to S7 (4–19 vents) were mapped via analysis of video camera images, and the details are reported separately [54]. The subsequent survey showed that the vents S1 to S3, the vents S4 to S6, and the vent S7 were merged later into craters. The vents S1 to S3 became the crater Y3, the vents S4 to S6 formed the crater Y2a, and the vent S7 formed the crater Y2b (Figure S2). These craters are collectively referred to as the Ioyama-south craters including the pond Y1. The deposit thickness of the 19 April 2018 eruption ejecta varied from a few centimeters to 45 cm of the Ioyama-south craters. It was composed of a bluish very fine ash-sized material layer at the bottom, a second layer of very fine to fine ash-sized material with coarse ash-sized material and lapilli-sized material, a third layer of fine to coarse ash-sized material with lapilli-sized material, and the uppermost layer of coarse ash-sized material and rounded lapilli to block sized material. The details of these layers will be reported subsequently. Host altered rocks of ballistics ejecta reaching 30 cm in diameter (φ) were distributed around the Ioyama-south craters as Y2a, Y2b and Y3 (Figure 8). An altered ejecta of the host rock of φ100 cm was found at the northern edge of the crater Y3, and an ejecta of φ70 cm was found at the southern edge of the crater Y2a. Altered host volcanic block and lapilli sized ejecta were distributed radially from the craters Y3 and Y2a, and we observed φ4 cm (diameter) altered ejecta at a distance of 140 m, and φ9 cm altered ejecta at a distance of the 125 m at the southeastern part of the crater Y2a.
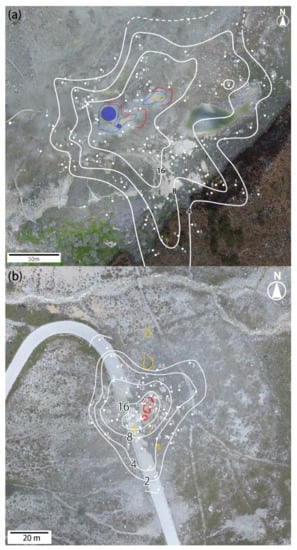
Figure 8.
Distribution of ejected blocks and fragments from the Ioyama-south and west craters in April, 2018. (a) Block and fragment ejecta distribution from Ioyama-south craters using a drone map on a Google Earth map [45]; (b) Block and fragment ejecta distribution from the Ioyama-west crater. The value indicates the size of the diameter in centimeters.
It was reported that the steaming could have started at a distance 500 m west of the Ioyama-south craters on the evening of 20 April [53]. A fissure vent composed of seven small hydrothermal explosion or steam vents (4–20 vents) was confirmed by later observations (Figure 8 and Figure S2). We did not notice any anomaly such as steaming around this area at about 4:30 pm on 20 April, and it is believed that the eruption occurred after 4:30 pm on 20 April [52]. Altered material ashy deposit and altered ejecta distribution around the two hydrothermal explosion vents W3 and W4 of the Ioyama-west crater were considered to be accompanied by a very small eruption (Figure 8). The time of deposition was considered the evening of 20 April. Photographs taken on the evening of 21 April showed that the large blocks near the Ioyama-west crater were covered with the ashy deposit. We observed the ashy deposit around the Ioyama-west crater, whose lower part was composed of fine to coarse ash-sized material, and the upper part was composed of fine ash-sized material. In addition, we observed altered ejecta comprising of different sizes of block and lapilli distributed at a distance of about 50 m from the Ioyama-west crater. The ejecta of φ8 cm was deposited over a distance of about 25 m, while that of φ4 cm was deposited about 40 m, and that of φ1 cm went as far as about 50 m (Figure 8).
Observations under a microscope showed that ashy deposits from both the Ioyama-south craters and the Ioyama-west crater were composed of altered materials and rounded crystals. Furthermore, we could not find any juvenile magmatic material under a microscope (Figure S3).
Other land features related to the April eruption were the crack and the mud pot R that formed south of the Fudoike Crater. Those were observed on 4 June 2018. The crack went across a road about 90 m southeast of the Fudoike Crater, and showed the rupture with a 3.5 cm south–up displacement and N44°E strike (Figure 3). Since we had not observed this crack before the eruption was presumed to have formed related to the eruptive activity. Furthermore, the mud pot R consisting of three small potholes, was formed to the south of the crack, and hydrothermal fluids were pouring out of one of them.
The vents S1 to S7 observed on 19 and 20 April. However, S1 and S7 subsequently became the three larger depression-shaped craters (Figure 3 and Figure 7c). The crater Y2a was formed within two depressions extending from east–northeast to west–southwest, 37 m long and 15 m wide. Subsidence depth on the cliff of the Y2a varied in height ranging from 10 m to 3 m. The crater Y2b appeared almost circular but elongated slightly from east–northeast to west–southwest, 26 m long and 19 m wide. Subsidence depth on the cliff of the Y2b varied in height from 8 m to 2 m. The crater Y3 also elongated from east–northeast to west–southwest. Subsidence depth on the cliff of the Y3 varied in height from 12 m to 3 m (Table 1). We calculated elliptical shape areas of craters Y2a, Y3 and Y2b by using the long and short radii. Using the mean value of depths of the produced depressions, we calculated a total depression volume of approximately 8400 m3 (min. 3500 m3 to max. 13,400 m3). It is assumed that three depression craters were formed between the time of the aerial survey on 20 April and 4 June, and that hydrothermal fluids continued to gush out from these craters. Furthermore, the ground uplifts and tilt–displacements continued until December 2018 [55].

Table 1.
Topographical values of Ioyama-south craters.
5. Results of Geochemical Analyses
We analyzed ash-sized particles from the 2017 and 2018 events using XRD. Relative amounts (reference intensity ratios, RIR) in the XRD software of minerals are shown in Table 2.
Table 2.
Relative intensities of hydrothermal minerals by the XRD analyses.
An altered material ashy deposit sample from the April 2018 eruption (20180419-Ash) was collected on a shrub near the Ioyama-south craters, avoiding contamination by ground surface material. The sample was observed to contain significantly altered white colored fragments, light white to frosted clear-colored weakly altered fragments, and slightly altered black to gray to brown colored lithic fragments. It also contained rounded crystals of plagioclase and pyrite when observed under a microscope (Figure S3). Plagioclase, quartz, alunite (soda), kaolinite, cristobalite, pyrite, smectite and sulfur were detected by the XRD analysis (Table 2 and Figure S4). Plagioclase, pyroxenes and olivine are part of phenocrysts in volcanic rocks in this area, while quartz is not [32]. Therefore, quartz, alunite, kaolinite, cristobalite, pyrite, smectite, and sulfur in the ash-sized particles samples are considered to be the minerals produced by the hydrothermal activity or alteration. The RIR analysis showed quartz plus alunite as the major components of this sample, comprising of more than 70% in weight, and was followed by pyrite and plagioclase. The analysis also showed little amounts of kaolinite (about 10 wt%), cristobalite of about 5 wt% and smectite of about 1 wt%. These minerals are considered to have been produced primarily in acidic to neutral environments [56].
Ashy deposit from the April 2017 event (20170426-Ash) was collected from a large stone surface around the jet fumarole vent A, with minor contamination from ground surface material. The sample contained strongly and weakly altered fragments as well as slightly altered lithic fragments. Rounded plagioclase and pyroxenes were also observed using the microscope (Figure S3). Quartz, alunite (soda) cristobalite and sulfur were detected with the XRD analysis, as minerals associated with hydrothermal activity or alteration (Table 2 and Figure S4). The RIR analysis showed quartz plus alunite of nearly 90% in weight.
We collected fluid samples at the spring K3 on 16 and 21 February, and on 12 and 30 March 2016 and at the hydrothermal pond Y1 on 16 April 2018. We analyzed the abundances of ions of elements and the ratios of oxygen and hydrogen isotopes in those samples in Table S1. The water at the spring K3 in 2016 had δD values of −53‰ to −54‰ and δ18O values of −8.0‰ to −8.3‰, and the compositions fall on the meteoric water lines with δD = δ18O +10 to +20. However, the hydrothermal fluids sampled at the Y1 had a δD value of −31.3‰ and a δ18O value of −0.0‰, which are values between those of Andesitic magmatic water (AMW) [57,58] and global meteoric water line (GMWL) [59] in Figure 9.
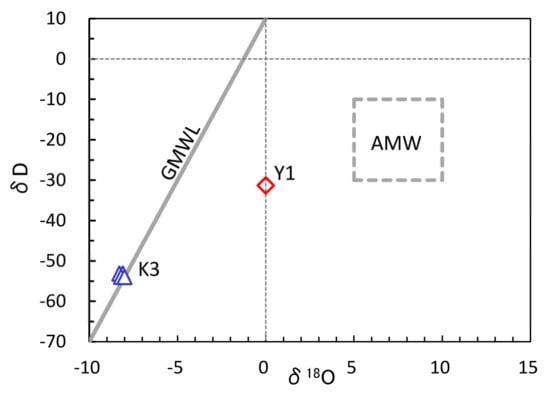
Figure 9.
Oxygen and hydrogen isotope ratios of the spring K3 and the hydrothermal pond Y1 water. The “Andesitic magmatic water” (AMW) [57,58] and “global meteoric water line” (GMWL) [59] are also shown.
6. Discussions
6.1. Relationship between Observed Geothermal Activities and Underlying Geothermal System
Recently, MT inversion analysis showed that an extremely conductive layer of resistivity less than several Ω-m existed beneath 200 to 700 m depth (elevation 1100 m to 600 m) from the surface of the Ioyama [25]. This conductive layer was interpreted as composed of a hydrothermally altered clay-rich layer containing copious amounts of smectite [20]. Kagiyama et al. [60] also reported the presence of a conductive layer of 3- to 30-Ω-m resistivity with a thickness of 120 to 150 m beneath the area around the Ioyama. Inverse modeling, based on repeatedly operated and precise leveling survey data, revealed an inflation source at a depth of 600 to 700 m, just under the conductive layer [61]. Thus, it is suggested that the conductive layer behaved as a caprock preventing the up-flow of pressurized hydrothermal fluids [25]. This caprock, likely corresponding to a low permeable layer, can explain the activity sequence from Stage-1 to Stage-4. Furthermore, the geological setting identified Ebinokogen Ioyama Volcano can be considered to represent a Type 1 system described by Stix and Moor [11].
Another deeper pressure source, likely related to a magma reservoir, is present between 8 and 10 km below Ebinokogen. It appeared that this source was inflated before the eruption at Shinmoedake in 2011 and was deflated during the early large eruptions (subplinian and lava-accumulation stages) in 2011 [47]. Further, it was re-inflated after the early large eruption stages, and almost stagnated around January 2012 at Shinmoedake [62,63]. Seismicity then increased at the northern side of Karakunidake from December 2013 [48], implying the possibility that magmatic fluids started to be supplied from the deeper parts under Karakunidake to the shallow hydrothermal system under Ebinokogen Ioyama Volcano. The volcanic tremor event that took place on 20 August, 2014, may represent the beginning of the activation of the shallow hydrothermal system under the conductive caprock in Stage-1. As no manifestation was observed at the surface in this stage, it is hypothesized that the fluid-driven heating and pressurization of the shallow hydrothermal system beneath the Ioyama-fumarole area developed gradually (Figure 10). Incidentally, the deep system is the magmatic reservoirs in Kirishima Volcano Group [62,64,65].
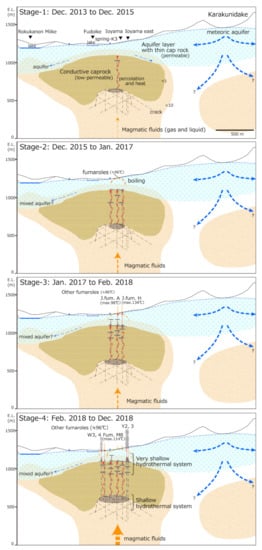
Figure 10.
Conceptual sketch showing the different stages of geothermal activity in Ebinokogen Ioyama Volcano. Numerical values in Stage-1 denote Ω-m [25].
The temperatures of fumaroles during Stage-2 were almost constant at around 96 °C (Figure 4), the boiling point temperature at an altitude of 1300 m. The relationship between the δD and the δ18O ratio showed that the water from the spring K3 at this stage was derived from the meteoric water (Figure 9). Most likely the high-temperature hydrothermal fluids accumulated below a depth of 600 to 700 m in Stage-1 started to percolate through the conductive caprock layer during Stage-2. Thus, fumaroles began to appear at the ground surface (Figure 10).
The successive period was characterized by the appearance of mud pots and jet fumaroles between March and April 2017 in Stage-3. The stage was defined by a rapid expansion of the thermal anomaly area from early 2017, and a temperature rose in the spring K3 in early April (Figure 4). The mud pot A appeared just before/on 19 March, and the mud pot F appeared between 19 and 21 March (Figure 5). The jet fumarole H appeared about 30 m east of the mud pot F between 15 and 18 April, and the jet fumarole A appeared about 10 m northwest of the mud pot A on 26 April. Hydrothermal minerals of the blowout deposit from the jet fumarole A contained mostly quartz and alunite (soda) and almost no smectite (Table 1). The mineral assemblage of the blowout deposit well matches the surficial alteration near Ioyama, characterized by the alunite zone with quartz, cristobalite and tridymite [44]. In other cases, the lower limit of the alunite zone is at a 380 m depth in the Hatchobaru geothermal area in Kuju Volcano [66,67], as well alteration zones containing alunite develop in very shallow parts of Hakone and Ontake volcanoes [68,69]. The XRD analysis for a drilling core at Owakudani in Hakone showed that alunite was distributed up to a depth of 100 m from the surface [23]. A key information for estimating depth of hydrothermal fluids in the Ebino-fumarole area comes from the geothermal drilling carried in the 1950s, in which blowout occurred at two wells while drilling at depth between 18.3 and 18.4 m below the surface [41]. The hot groundwater (aquifer) at a depth of 20 m in the western part of Ioyama with the same topographical gradient is considered to have been at a 50 to 70 m depth below the summit of Ioyama in the 1950s. Currently, the height difference between the spring K3 and the summit is about 50 m. The temperature of the spring K3 at the time of the blowout event was relatively low, 40 °C, and it was probable that there was a hot confined aquifer located deeper than 50 m. Alunite is widely stable in a low pH environment, and its deposition or accumulation is known to form altered layers of low-permeability [70,71]. Recently, alunite filling among mineral grains was reported [72]. Therefore, the 2017 blowout event at the jet fumarole A with the products abundant in alunite can be considered as a phenomenon that originated from low pH hydrothermal liquids at a very shallow depth (mostly up to a depth of 100 m). Alunite, quartz, cristobalite, tridymite, kaolinite, smectite and halloysite were found on the surface around the Ioyama-fumarole area in 1950s [44]. It was probable that the alunite accumulation had formed low permeability layers (or spots) before the year 2008, under which developed pockets of hydrothermal fluids or confined groundwater (Figure 10 and Figure 11).
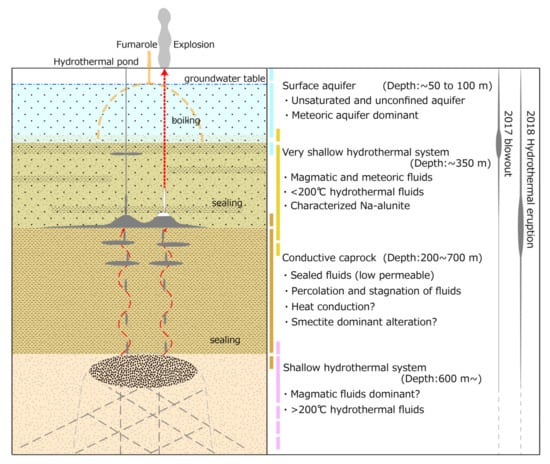
Figure 11.
The schematic image of the shallow (ca. 600 m) and very shallow (ca. 350 m) systems beneath Ebinokogen Ioyama Volcano (See more details in Section 6.1 and Section 6.2).
The high heat and gas emission released at the jet fumaroles H and A resulted in a decrease in the thermal anomaly area since August 2017. The temperature of the K3 spring rose again in February 2018, with the simultaneous appearance of the fumarole S. In this stage, a continuous uplift of the summit area was observed by the JMA tilt meter from 2018 mid-March. The Global Navigation Satellite System (GNSS) observations showed inflation prior to the 2018 eruption. The geophysical pressure source was estimated to be around 950 m altitude (about 350 m below the ground) [53]. The 2018 eruption deposits contained dominant quartz and alunite (soda) similar to those in the 2017 event deposits, and both probably came from similar hydrothermal environments. The smectite content of the 2018 eruption deposit was about 1 wt%, implying that the April 2018 eruption originated from a smectite depleted hydrothermal environment. The surface altered areas at the Ioyama contained minor amounts of the smectite mineral [44]. Less kaolinite (about 10 wt%) from the April 2018 eruption were derived from the hydrothermal region in an acidic environment. Part of the kaolinite or minor smectite may also have been taken from very shallow altered host rocks. The hydrothermal pond Y1 appeared on 7 April, and a large amount of hydrothermal fluids gushed out. The relationship between δD and δ18O ratio of the water in the Y1 pond just before the eruption indicated that the pond liquid was a mixture of meteoric and magmatic liquids, creating an environment in which both end member liquids probably mixed. Thus, geological and geochemical observations show that the main excavation of the 2018 eruption may have been at a very shallow depth around the top of conductive layer. It is probable that the pressure source of about 350 m, indicated by low-resistivity implies the stagnation of magmatic–hydrothermal water. Seki et al. [73] suggested that a low-resistivity layer in the shallow part was formed due to the percolation of acidic hydrothermal fluid into the clayey lacustrine sediment at Midagahara Volcano in Tateyama. The resistivity >10 Ω-m was observed down to a depth of about 150 m (1150 m altitude) beneath Ioyama [60]. The similar interpretation is also possible here for the aquifer of hydrothermal fluids at depths of between 150 m and 350 m. We defined those systems above the 350 m depth as the very-shallow hydrothermal system (Figure 10). The main zone of acid alteration is the kaolinite zone without dickite which registered temperatures of up to 120 °C [13]. The temperature of 130 °C at the jet fumarole H in Stage-3 may suggest a leakage from this hydrothermal system (Figure 11).
The geology of Ioyama and the surrounding area consists of thin debris avalanche and thick welded pyroclastic deposits from Karakunidake [29,32]. The borehole survey at 1.1 km west of Ioyama [74] indicated that an upper boundary of the welded pyroclastic deposit was about 50 m depth. This deposit is exposed on the surface near the Ioyama-south craters. The elevation difference between the two sites is about 170 m. Assuming horizontally flat deposition, the welded pyroclastic deposit is distributed down to about 170 m depth under the Ioyama-south craters, corresponding to the distribution of a moderate resistivity layer down to 200 m depth. This welded pyroclastic deposit is interfingered pumice fall layers [75]. It is considered that pumice layers behave as permeable layers for ground water, where meteoric and magmatic liquids mix.
The conductive caprock layer with a low resistivity of <1 Ω-m at depths from 200 to 700 m was considered to have smectite as its main altered mineral [25]. In the laboratory experiments, higher contents of smectite achieved a lower resistivity [76]. Smectite exceeding 10% of maximum intensity by the XRD analyses was contained in the drilling core from the conductive layer in Hakone [23]. However, the lithological resistivity measured in the laboratory indicated a conductivity of about one order of magnitude higher than those in borehole observation. This difference was possibly affected by the pore fluid conductivity [24]. Additionally, the results of the effect of acidity on the conductivity were significant [77]. We will need further discussions about the morphology of the conductive layer.
For magma with a temperature of 870 °C such as the 2011 Shinmoedake silicic andesite magma [64] located at a depth of 600 to 700 m, the conductive, smectite-bearing caprock would not be observed around the inflation source because of the instability of smectite at temperatures above 200 °C [13]. It is known the high electrical conductivity is enhanced by the higher temperature e.g., [24,76]. Therefore, it was reasonable to assume that the main component of the inflation source was magmatic–hydrothermal fluids at a temperature slightly higher than 200 °C. Thus, we tentatively propose a hydrothermal reservoir system at the inflation source at around 600 to 700 m in depth (Figure 11). A high-temperature fumarole of 247 °C had previously developed at the summit of Ioyama in the 1970s [34], where gases probably originated from this depth.
6.2. A Kick Sign before the April 2018 Eruption
In order to forecast a steam-driven eruption, it is essential to understand how an aquifer of hydrothermal system is depressurized or heated and what triggers an eruption.
During the events of March to April 2017, the jet fumarole A blew out on 26 April, after the appearance of the mud pot A just before/on 19 March. The jet fumarole A blew out about a ten meter away from the mud pot A. Furthermore, welling-up of a large amount of fluids in the hydrothermal pond Y1 continued for 12 days immediately before the steam-driven eruption on 19 April, 2018 at Ioyama south craters (4–19 vents). The locations of the upwelling of hydrothermal fluids and of the eruption were about 60 m apart.
The characteristic feature in both the blowout and eruption is that the upwelling of hydrothermal fluids began just before the events. The technical report on drilling describes a phenomenon referred to as a “kick”, in which fluid leaks into a borehole, which typically occurs before blowouts of pressurized fluid [3]. It was known that two boreholes blew out after reaching 18.3 to 18.4 m below the surface in the Ebino-fumarole area during a geothermal survey [41]. In this event, hot water welled up and steam blowout occurred after sudden increase of the borehole temperature. In the geothermal excavation, the pressurized hot water leaked, resulting in blowing through the wells. In addition, it is known that the cyclic behaviors of the lake water level and temperature in a hydrothermal system can be explained by the “two-phase boiling systems” phenomenon observed at the Inferno Crater Lake in New Zealand [78,79].
One question remains open about why hydrothermal fluids upwelling site and the explosion site were different. There appeared depressions of 3 to 10 m in the crater Y2a, 2 to 8 m in the crater Y2b, and 3 to 12 m in the crater Y3, a little time after the April 2018 eruption. The total depression volume was about 8400 m3. And the depression volume of the Y2a and Y3 craters was about 6500 m3 (Table 1). Those values are clearly larger than the ejecta volume of about 1500 m3, assuming the density of the deposit as 1500 t [54] is 1000 kg/m3. Therefore, the mechanism such as the crushing of the host rock around the conduit as in a maar formation [80] is not plausible. A hydrothermal dissolution [81] may be possible by continuous hydrothermal water outflow after the eruption. However, it is unclear if dissolution of a large volume in a short time. Therefore, we conclude that a certain amount of space had existed underground (Figure 11). The coupling between the geyser conduit and a laterally offset reservoir system [82] in the geyser eruption may be constructed under Ebinokogen Ioyama Volcano. However, the geyser system does not eject directly from a laterally offset reservoir, so it is difficult to apply this model for the April 2018 eruption. Likely, when the relatively low-temperature hydrothermal fluids in the upper layer leak and reduce the groundwater level, the resultant decreasing of hydrostatic pressure causes boiling to start. An instance of a similar trigger was seen when the dropping water levels at Gengissig lake in Kverkfjöll Volcano (Iceland) were observed to decompress the pressured aquifers, resulting in explosions due to boiling [15]. Additional explanation for the separation between the upwelling and eruption sites may originate from the fluid percolation pattern dictated by the deposit heterogeneity in the very-shallow hydrothermal system. Therefore, several mechanisms are possible for this eruption.
In summary, the pressurization of hydrothermal system is considered to be caused first as a bottom–up. The increase in fumarolic activity and the spring K3 temperatures from February 2018 indicated that the magmatic liquids were supplied to the very-shallow hydrothermal system. Second, hydrothermal fluids were observed to comprise mixed magmatic and meteoric waters up-welled at the Y1 just before the eruption in April 2018. We conclude that an initial bottom–up fluid pressurization (kick) destabilized the shallow part of the hydrothermal system, producing a boiling-front that penetrated downwards into the hydrothermal reservoir, followed by the explosion according to a top–down mechanism [12,83]. The expanding steam fragmented and dispersed the broken host rocks until the boiling decreased and stopped supplying sufficient energy to break and ejected rocks from the crater. Such mechanisms may explain the 2018 Ebinokogen Ioyama eruptions. Based on our observations, we also conclude that sudden injection and up-welling of hot magmatic fluids may cause an increase in temperature of very-shallow hydrothermal systems, and in turn produce changes in geothermal features at the surface. Thus, rapid increases in the geothermal manifestation over a short period of time, as in the case of Ebinokogen Ioyama Volcano, should be taken as a sign for caution in geothermal areas.
6.3. Issues of Steam-Driven Eruptions for the Volcanic Disaster Prevention
Information pertaining to the level of damage corresponding to steam driven eruptions originating in hydrothermal aquifer systems should be provided at tourist spots near and in geothermal areas. The magmatic–hydrothermal fluids storage system may have developed at two different levels in Ebinokogen Ioyama Volcano, contained by the conductive caprock layer (Figure 11).
Steam driven explosions from very-shallow levels are known to occur in some geothermal areas [84,85,86,87]. In a hydrothermal blowout event at the jet fumarole vent A, altered volcanic fragments of block size were scattered only a few meters from the vent. The magmatic hydrothermal eruption at Ioyama in April 2018 may have involved hydrothermal liquids shallower than 350 m depth. Based on past activity [32], larger steam-driven eruptions ejecting larger volumes of debris and producing tens-to-hundreds-meter-diameter craters at the Fudoike and Karakunidake north craters, occurred in Ebinokogen Ioyama Volcano. These explosions may involve greater depth, similarly to phreatic or phreato–magmatic eruptions, yet likely have a steam-driven dominant component e.g., [88,89,90]. The question remains, what may be the signs of bigger eruptions. The geophysically detected source of the 2014 phreatic eruption at Ontake Volcano, which scattered ballistics ejecta over 1 kilometer away [91], was thought to be from 600 to 1000 m deep [92,93]. Kato et al. [94] proposed that hot fluids infiltrated to cracks from the deeper magma chamber in middle September 2014 before the September 27 phreatic eruption in Ontake. The break of the seal of the conduit for hydrothermal fluids at a shallow level began just prior to the eruption [94], resulting in the decompression that led flashing of hydrothermal fluids from the top to downward. Recent research [95] supports this model by the finding of a small amount of juvenile material in the 2014 eruption products in Ontake. A steam-driven eruption at Sinmoedake Volcano in 2008 scattered ballistics as far as 800 m [31]. The geophysically detected source of the inflation and deflation in the eruption was estimated to be at a depth of 500 to 600 m below the volcano [96]. These are similar to the VLP events, 700 ± 200 m below the lake, in Kawah Ijen (Indonesia) and that of 850 ± 150 m below the crater at White Island (New Zealand) [97].
In case of Ebinokogen Ioyama in 2018, it took over two months for magmatic fluids to be supplied into shallow hydrothermal system before the eruption from the deep system, contrasting to about two weeks (11 to 16 days) in Ontake. In Ebinokogen Ioyama, the supplied amount and rate of magmatic fluids of the 2018 eruption may be much smaller than the 2014 eruption in Ontake. In summary, smaller events could be better understood as result of our study. And more energetic steam-driven eruptions may occur in this area if larger amount of magmatic fluid is injected rapidly and a wider area of the shallow hydrothermal system is destabilized. However, more studies are needed to improve our knowledge of triggers, mechanisms and potential precursors of steam-driven eruptions at Ebinokogen Ioyama. Additionally, we need to consider repetitive highly hazardous hydrothermal eruptions like that of Lake Okaro in New Zealand [12].
The technology to forecast very-shallow hydrothermal eruptions has developed by combining observations of hydrothermal phenomena such as increasing activity of geothermal areas, a welling-up kick, results of In-SAR and precise leveling observations. In the small eruption of Hakone 2015, In-SAR observed an uplift deformation area of approximately 200 m in diameter immediately before the eruption, along with a ground uplift of up to 30 cm. The vents appeared at the southern edge of deformation [98]. Locations of the fumarole S and the Y1 hydrothermal pond at Ebinokogen Ioyama may be possible sites for future eruption. A hydrothermal eruption occurred from the Ioyama-south craters on 19 April 2018. The next day, vents (Ioyama-west crater) formed 500 m away from the Ioyama-south craters. The impact area of the ejecta from the latter vents was as small as ~50 m. The outside of the alert level 2 area possibly impacted by ballistics, within a one-kilometer radius from the Ioyama crater, shown in the volcanic hazard map of Ebinokogen Ioyama [99,100], was not affected. Given that the tourist facility is relatively close to the potential venting area, in addition to addressing the 19 April vents, there is also the need to highlight the occurrence of the 20 April.
7. Conclusions
Geothermal activity resumed at Ebinokogen Ioyama Volcano in December 2015. We observed the very shallow hydrothermal event of a blowout and jet fumaroles from March to April 2017. This event was accompanied by a thermal anomaly expansion and rapid increase in the water temperature at the spring K3. The transformation of a hydrothermal mud pot A to jet fumarole A over one month following the blowout steaming event in 2017.
The magmatic hydrothermal eruptions took place in the Ioyama–south craters on 19 April and in the Ioyama-west crater on the evening of 20 April 2018. The increasing of geothermal anomaly phenomena before the eruption indicated that the magmatic liquid may be stored in a very-shallow hydrothermal system. Upwelling of hydrothermal water was observed to pour out at the hydrothermal pond Y1 just before the eruption in April 2018. The relationship of the δD and δ18O ratio of this water in the Y1 indicated that the liquid was a mixture of meteoric and magmatic liquids. Lastly, the upwelling caused by a kick may have led to the eruption at about 60 m away from the upwelling center. Hydrothermal mineral analyses and geochemical observations suggest that the mixture was spouted from the very-shallow hydrothermal system (less than 350 m depth) at the top of the conductive caprock layer. In addition, the inflation source at 600 to 700 m depth was likely the shallow hydrothermal system (reservoir). Thus, we propose an underground hydrothermal structure consisting of two systems. The secondary eruptive event on the evening of 20 April, 2018 occurred 500 m away from the eruption site on 19 April, and it is necessary to investigate the formation mechanism and evaluation method for this event in more detail.
Supplementary Materials
The following are available online at https://www.mdpi.com/2076-3263/10/5/183/s1, Figure S1: The distribution of geothermal anomaly area over 50 °C in Ioyama fumarole area; Figure S2: Digital elevation models and photographs; Figure S3: Photomicrographs of ashy deposit grains; Figure S4: XRD analyses; Table S1: The oxygen and hydrogen isotope analyses of hydrothermal water from the Ioyama.
Author Contributions
Y.T.; geological and geothermal investigation, XRD analyses, project administration and writing—Original draft preparation, S.N.; supervision, geological investigation and writing—Review and editing. F.M.; drone investigation and project administration, T.H.; temperature investigation and geothermal monitoring, M.T. and A.I.; oxygen and hydrogen isotope analyses, T.M.; review and project administration, M.N.; geological investigation, J.F.; water investigation. All authors have read and agreed to the published version of the manuscript.
Funding
This research received no external funding.
Acknowledgments
The authors thank K. Ishihara, M. Ichihara, A. Takagi for offering helpful comments. The authors thank H. Shinohara, J. Itoh, N. Morikawa of GSJ and H. Suzuki, J. Teruya, A. Hasegawa of Nippon Koei for helping the field or laboratories. The Kirishima Nature Guide Club member as K. Haraguchi, T. Higashi, H. Yoshinaga, M. Baba, Y. Matsumura, T. Miyagawa, T. Nagatomo, S. Takada, S. Watanabe are thanked for helping with our field observations. We contacted the Kagoshima Meteorological Office of JMA when we entered the restricted area. In addition, permissions were obtained from the Ebino city and the Kyusyu Regional Forest Office at Miyakonojo during the investigation involving drones in the restricted access area. We thank J. Vandemeulebrouck, anonymous reviewers and J.C. Eichelberger editor for great constructive suggestions and helpful comments on this manuscript. We extend our heartfelt condolence to H. Itoh.
Conflicts of Interest
The authors declare no conflict of interest.
References
- Barberi, F.; Bertagnini, A.; Landi, P.; Principe, C. A review on phreatic eruptions and their precursors. J. Volcanol. Geotherm. Res. 1992, 52, 231–246. [Google Scholar] [CrossRef]
- Muffler, L.J.P.; White, D.E.; Truesdell, A.H. Hydrothermal explosion craters in Yellowstone National Park. Geol. Soc. Am. Bull. 1971, 82, 723–740. [Google Scholar] [CrossRef]
- Browne, P.R.L.; Lawless, J.V. Characteristics of hydrothermal eruptions, with examples from New Zealand and elsewhere. Earth Sci. Rev. 2001, 52, 299–331. [Google Scholar] [CrossRef]
- Mordret, A.; Jolly, A.D.; Duputel, Z.; Fournier, N. Monitoring of phreatic eruptions using interferometry on retrieved cross-correlation function from ambient seismic noise: Results from Mt. Ruapehu, New Zealand. J. Volcanol. Geotherm. Res. 2010, 191, 46–59. [Google Scholar] [CrossRef]
- Yamamoto, T.; Nakamura, Y.; Glicken, H. Pyroclastic density current from the 1888 phreatic eruption of Bandai volcano, NE Japan. J. Volcanol. Geotherm. Res. 1999, 90, 191–207. [Google Scholar] [CrossRef]
- Kitagawa, T. Bakuhatsu Saigai No Kaiseki (Explosion Disaster Analysis); Nikkankogyoshinbunsha: Tokyo, Japan, 1980; pp. 277–324. (In Japanese) [Google Scholar]
- Ogiso, C.; Uehara, Y. Experimental study of vapor explosions caused by the abrupt destruction of phase equilibrium. J. Jpn. Soc. Saf. Eng. 1985, 24, 192–198. (In Japanese) [Google Scholar]
- Takashima, T.; Iida, Y. Joukibakuhatsu No Kagaku (The Science of Vapor Explosion); Shoukabou: Tokyo, Japan, 1998; p. 172. (In Japanese) [Google Scholar]
- Yamamoto, T. The pyroclastic density currents generated by the September 27, 2014 phreatic eruption of Ontake Volcano, Japan. Bull. Geol. Surv. Japan. 2014, 65, 117–127. (In Japanese) [Google Scholar] [CrossRef]
- Oikawa, T.; Yoshimoto, M.; Nakada, S.; Maeno, F.; Komori, J.; Shimano, T.; Takeshita, Y.; Ishizuka, Y.; Ishimine, Y. Reconstruction of the 2014 eruption sequence of Ontake Volcano from recorded images and interviews. Earth Planet. Space 2016, 68, 489. [Google Scholar] [CrossRef]
- Stix, J.; Moor, J.M. Understanding and forecasting phreatic eruptions driven by magmatic degassing. Earth Planet. Space 2018, 70, 83. [Google Scholar] [CrossRef]
- Montanaro, C.; Cronin, S.; Scheu, B.; Kennedy, B.; Scott, B. Complex crater fields formed by steam-driven eruptions: Lake Okaro, New Zealand. GSA Bull. 2020, 1–17. [Google Scholar] [CrossRef]
- Stimac, J.; Goff, F.; Goff, C.J. Intrusion-Related Geothermal Systems. In The Encyclopedia of Volcanoes, 2nd ed.; Sigurdsson, H., Houghton, B., McNutt, S.R., Rymer, H., Stix, J., Eds.; Academic Press: Amsterdam, The Netherlands, 2015; pp. 799–822. [Google Scholar] [CrossRef]
- Miyake, Y.; Osaka, J. Steam explosion of February 11th, 1995 at Nakanoyu hot spring, Nagano prefecture, central Japan. Bull. Volcanol. Soc. Jpn. 1998, 43, 113–121. (In Japanese) [Google Scholar] [CrossRef]
- Montanaro, C.; Scheu, B.; Gudmundsson, M.T.; Vogfjörd, K.; Reynolds, H.I.; Dürig, T.; Strehlow, K.; Rott, S.; Reuschlé, T.; Dingwell, D.B. Multidisciplinary constraints of hydrothermal explosions based on the 2013 Gengissig lake events, Kverkfjöll volcano, Iceland. Earth Planet. Sci. Lett. 2016, 434, 308–319. [Google Scholar] [CrossRef]
- Montanaro, C.; Scheu, B.; Cronin, S.J.; Breard, E.C.P.; Lube, G.; Dingwell, D.B. Experimental estimates of the energy budget of hydrothermal eruptions; application to 2012 Upper Te Maari eruption, New Zealand. Earth Planet. Sci. Lett. 2016, 452, 281–294. [Google Scholar] [CrossRef]
- Hedenquist, J.W.; Henley, R.W. Hydrothermal eruptions in the Waiotapu geothermal system, New Zealand: Their origin, associated breccias, and relation to precious metal mineralization. Econ. Geol. 1985, 80, 1640–1668. [Google Scholar] [CrossRef]
- Facca, A.; Tonani, F. The self-sealing geothermal field. Bull. Volcanol. 1967, 30, 271–273. [Google Scholar] [CrossRef]
- Fournier, R.O. Hydrothermal processes related to movement of fluid from plastic into brittle rock in the magmatic-epithermal environment. Econ. Geol. 1999, 94, 1193–1211. [Google Scholar] [CrossRef]
- Aizawa, K.; Ogawa, Y.; Ishido, T. Groundwater flow and hydrothermal systems within volcanic edifices: Delineation by electric self-potential and magnetotellurics. J. Geophys. Res. 2009, 114, B01208. [Google Scholar] [CrossRef]
- Aizawa, K. Groundwater flow beneath volcanoes inferred from electric self-potential and magnetotellurics. Bull. Volcanol. Soc. Jpn. 2010, 55, 251–259. (In Japanese) [Google Scholar] [CrossRef]
- Kanda, W.; Utsugi, M.; Tanaka, Y.; Hashimoto, T.; Fujii, I.; Hasenaka, T.; Shigeno, N. A heating process of Kuchi-erabu-jima volcano, Japan, as inferred from geomagnetic field variations and electrical structure. J. Volcanol. Geotherm. Res. 2010, 189, 158–171. [Google Scholar] [CrossRef]
- Mannen, K.; Tanada, T.; Jomori, A.; Akatsuka, T.; Kikugawa, G.; Fukazawa, Y.; Yamashita, H.; Fujimoto, K. Source constraints for the 2015 phreatic eruption of Hakone volcano, Japan, based on geological analysis and resistivity structure. Earth Planet. Space 2019, 71, 1–20. [Google Scholar] [CrossRef]
- Lévy, L.; Maurya, P.K.; Byrdina, S.; Vandemeulebrouk, J.; Sigmundsson, F.; Árnason, K.; Ricci, T.; Deldicque, D.; Roger, M.; Gibert, B.; et al. Electrical resistivity tomography and time-domain induced polarization field investigations of geothermal areas at Krafla, Iceland: Comparison to borehole and laboratory frequency-domain electrical observations. Geophys. J. Int. 2019, 218, 1469–1489. [Google Scholar] [CrossRef]
- Tsukamoto, K.; Aizawa, K.; Chiba, K.; Kanda, W.; Ueshima, M.; Koyama, T.; Utsugi, M.; Seki, K.; Kishita, T. Three-dimensional resistivity structure of Iwo-yama volcano, Kirishima volcanic complex, Japan: Relationship to shallow seismicity, surface uplift, and a small phreatic eruption. Geophys. Res. Lett. 2018, 45. [Google Scholar] [CrossRef]
- Fujinawa, A.; Kamoshida, T.; Tanase, A.; Tanimoto, K.; Nakamura, Y.; Kontani, K. Reconsideration of the 1900 explosive eruption at Adatara volcano, northeastern Japan. Bull. Volcanol. Soc. Jpn. 2006, 51, 311–325. (In Japanese) [Google Scholar] [CrossRef]
- Sudo, Y. Aso Ni Manabu (Learn. from Aso); Toukashobou: Fukuoka, Japan, 2007; p. 319. (In Japanese) [Google Scholar]
- Kawanabe, Y.; Nogami, K. Kusatsu-Shiranesan. In National Catalogue of the Active Volcanoes in Japan, 4th ed.; Japan Meteorological Agency: Tokyo, Japan, 2013; pp. 1–25. [Google Scholar]
- Imura, R.; Kobayashi, T. Geological Map of Kirishima Volcano (Geological Map of Volcanoes 11); Geological survey of Japan: Tsukuba, Japan, 2001; pp. 1–8. (In Japanese) [Google Scholar]
- Imura, R. Minor phreatic activity of Shinmoedake, Kirishima volcanoes, in 1991–1992. Bull. Volcanol. Soc. Jpn. 1992, 37, 281–283. (In Japanese) [Google Scholar] [CrossRef]
- Geshi, N.; Takarada, S.; Tsustui, M.; Mori, T.; Kobayashi, T. Products of the August eruption of Shinmoedake Volcano, Kirishima Volcanic Group, Japan. Bull. Volcanol. Soc. Jpn. 2010, 55, 53–64. (In Japanese) [Google Scholar] [CrossRef]
- Tajima, Y.; Matsuo, Y.; Shoji, T.; Kobayashi, T. Eruptive history of Ebinokogen volcanic area of Kirishima volcanoes for the past 15,000 years in Kyushu, Japan. Bull. Volcanol. Soc. Jpn. 2014, 59, 55–75. (In Japanese) [Google Scholar] [CrossRef]
- Fukuoka District Meteorological Observatory; Kagoshima Local Meteorological Observatory; Miyazaki Local Meteorological Observatory. Showa 34 Nen 2 Gatsu 17 Nichi No Kirishimayama Shinmoedake No Bakuhatsu (Eruption of Shinmoedake, Kirishima Volcano, on 17 February 1959); Fukuoka District Meteorological Observatory: Tokyo, Japan, 1959; p. 15. (In Japanese) [Google Scholar]
- Kagiyama, T.; Uhira, K.; Watanabe, T.; Masutani, F.; Yamaguchi, M. Geothermal survey of the volcanoes Kirisima. Bull. Earthq. Res. Inst. 1979, 54, 187–210. (In Japanese) [Google Scholar]
- Kagiyama, T. Eruption dominant volcanism vs. geothermal activity dominant volcanism—New aspect in volcanism. J. Geotherm. Res. Soc. Jpn. 2008, 30, 193–204. (In Japanese) [Google Scholar] [CrossRef]
- McKee, K.; Fee, D.; Yokoo, A.; Matoza, R.S.; Kim, K. Analysis of gas jetting and fumarole acoustics at Aso volcano, Japan. J. Volcanol. Geotherm. Res. 2017, 340, 16–29. [Google Scholar] [CrossRef]
- Heasler, H.P.; Jaworowski, C.; Foley, D. Geothermal systems and monitoring hydrothermal features. In Geological Monitoring; Young, R., Norby, L., Eds.; Geological Society of America: Boulder, CO, USA, 2009; pp. 105–140. [Google Scholar] [CrossRef]
- Machida, H.; Arai, F. Atlas of Tephra in and around Japan; University of Tokyo Press: Tokyo, Japan, 2003; pp. 185–188. (In Japanese) [Google Scholar]
- Kashmir3d, Ver.9.3.4; Sugimoto Tomohiko©. 2005. Available online: http://www.kashmir3d.com (accessed on 10 January 2020).
- Okuno, M. Chronology of tephra layers in southern Kyushu, SW Japan, for the last 30,000 years. Quat. Res. 2002, 41, 225–236. (In Japanese) [Google Scholar] [CrossRef]
- Geothermal Research Department, Geological survey of Japan. Studies on natural steam at Ebino hot spring in Miyazaki prefecture. Bull. Geol. Surv. Jpn. 1955, 10, 611–626. (In Japanese) [Google Scholar]
- Oda, R. Kirishima kazan tiiki chishitu chousa houbun (Report of geological survey in Kirishima volcano area). Bull. Imp. Earthq. Investig. Comm. 1921, 96, 1–58. (In Japanese) [Google Scholar]
- Funasaki, J.; Shimomura, M.; Kuroki, C. Document on geothermal activities at Ebino highland including Iou-yama, Kirishima volcano, since the Meiji era. Quart. J. Seismol. 2017, 80, 1–11. (In Japanese) [Google Scholar]
- Kimbara, K.; Sakaguchi, K. Geology, distribution of hot springs and hydrothermal alteration zones of major geothermal areas in Japan. Rept. Geol. Surv. Jpn. 1989, 270, 1–428. (In Japanese) [Google Scholar]
- Google Earth Pro, 7.3.2.5776; ZENRIN: Fukuoka, Japan, 2020.
- Itoh, J.; Hamasaki, S.; Kawanabe, Y. Re-evaluation of explosive activities of Iwate Volcano in the last 10,000 years: Spatial and temporal relationship of phreatic and magmatic explosions. J. Geol. Soc. Jpn. 2018, 124, 271–296. (In Japanese) [Google Scholar] [CrossRef]
- Nakada, S.; Nagai, M.; Kaneko, T.; Suzuki, Y.; Maeno, F. The outline of the 2011 eruption at Shinmoe-dake (Kirishima), Japan. Earth Planet. Space 2013, 65, 475–488. [Google Scholar] [CrossRef]
- Kagoshima Meteorological Office, JMA. Fukuoka Regional Headquarters, JMA. Volcanic Activity of Kirishimayama Volcano—May–October 2014. Rep. Coord. Comm. Predict. Volcan. Erupt. 2016, 119, 213–259. (In Japanese) [Google Scholar]
- Fukuoka Regional Headquaters, JMA. Volcanic Activity of Kirishimayama Volcano—June–October 2015. Rep. Coord. Comm. Predict. Volcan. Erupt. 2018, 122, 347–379. (In Japanese) [Google Scholar]
- Japan Meteorological Agency Website. Available online: http://www.data.jma.go.jp/svd/vois/data/tokyo/volcano.html (accessed on 20 January 2019).
- YamaReco. Available online: https://www.yamareco.com/ (accessed on 10 January 2019).
- Tajima, Y.; Nakada, S.; Nagai, M.; Maeno, F.; Watanabe, A. Small eruption at the Ebinokogen Ioyama volcano of the Kirishima Volcano Group in April 2018. Bull. Volcanol. Soc. Jpn. 2019, 64, 147–151. (In Japanese) [Google Scholar] [CrossRef]
- Kagoshima Local Meteorological Office, JMA. Regional Volcanic Observation and Warning Center, Fukuoka Regional Headquarters, JMA. Volcanic Activity of Kirishimayama Volcano—1 February 2018 –31 May 2018. Rep. Coord. Comm. Predict. Volcan. Erupt. 2018, 130, 213–284. (In Japanese) [Google Scholar]
- Nagai, M.; Tajima, Y.; Maeno, F.; Nakada, S.; Furuzono, T.; Watanabe, A. Products of the 2018 eruption around Ioyama in Ebino kogen area, Kirishima Volcano Group, Southern Kyushu, Japan. In Proceedings of the Programme and Abstracts of the Volcanological Society of Japan 2018 Fall Meeting, Akita, Japan, 26 September 2018; p. 7. (In Japanese). [Google Scholar]
- Kagoshima Local Meteorological Office, JMA. Regional Volcanic Observation and Warning Center, Fukuoka Regional Headquarters, JMA. Volcanic Activity of Kirishimayama Volcano—1 September 2017–31 January 2019. Rep. Coord. Comm. Predict. Volcan. Erupt. 2019, 132, 240–311. (In Japanese) [Google Scholar]
- White, N.C.; Hedenquist, J.W. Epithermal gold deposits: Styles, characteristics and exploration. SEG Newsl. 1995, 23, 9–13. [Google Scholar]
- Taran, Y.A.; Pokrovsky, B.G.; Dubik, Y.M. Isotopic composition and origin of water from andesitic magmas. Dokl. Acad. Nauk. USSR 1989, 304, 440–443. [Google Scholar]
- Giggenbach, W.F. Isotopic shifts in waters from geothermal and volcanic systems along convergent plate boundaries and their origin. Earth Planet. Sci. Lett. 1992, 113, 495–510. [Google Scholar] [CrossRef]
- Craig, H. Isotopic variations in meteoric waters. Science 1961, 133, 1702–1703. [Google Scholar] [CrossRef]
- Kagiyama, T.; Yamaguchi, M.; Masutani, F.; Utada, H. VLF, ELF-MT survey around Iwo-yama, Kirishima Volcanoes. Bull. Earthq. Res. Inst. 1994, 69, 211–239. (In Japanese) [Google Scholar]
- Morita, K.; Matsushima, T.; Yokoo, K.; Miyamachi, R.; Teguri, Y.; Fujita, S.; Nakamoto, M.; Shimizu, H.; Chiba, K.; Koga, Y.; et al. Vertical ground deformation of Iwoyama, Kirishima volcanoes measured by precise leveling survey (during June 2015–February 2017). In Proceedings of the Japan Geoscience Union Meeting 2018, Chiba, Japan, 20–24 May 2018. [Google Scholar]
- Nakao, S.; Morita, Y.; Yakiwara, H.; Oikawa, J.; Ueda, H.; Takahashi, H.; Ohta, Y.; Matsushima, T.; Iguchi, M. Volume change of the magma reservoir relating to the 2011 Kirishima Shinmoe-dake eruption—Charging, discharging and recharging process inferred from GPS measurements. Earth Planet. Space 2013, 65, 505–515. [Google Scholar] [CrossRef]
- Kagoshima Local Meteorological Office, JMA. Regional Volcanic Observation and Warning Center, Fukuoka Regional Headquarters, JMA. Volcanic Activity of Kirishimayama Volcano—June–October 2012. Rep. Coord. Comm. Predict. Volcan. Erupt. 2014, 113, 148–172. (In Japanese) [Google Scholar]
- Suzuki, Y.; Yasuda, A.; Hokanishi, N.; Kaneko, T.; Nakada, S.; Toshitsugu, F. Syneruptive deep magma transfer and shallow magma remobilization during the 2011 eruption of Shinmoe-dake, Japan—Constraints from melt inclusions and phase equilibria experiments. J. Volcanol. Geotherm. Res. 2013, 257, 184–204. [Google Scholar] [CrossRef]
- Aizawa, K.; Koyama, T.; Hase, H.; Uyeshima, M.; Kanda, W.; Utsugi, M.; Yoshimura, R.; Yamaya, Y.; Hashimoto, T.; Yamazaki, K.; et al. Three-dimensional resistivity structure and magma plumbing system of the Kirishima Volcanoes as inferred from broadband magnetotelluric data. JGR Solid Earth. 2014, 119, 198–215. [Google Scholar] [CrossRef]
- Hayashi, M. Hydrothermal alteration in the Otake geothermal area, Kyushu. J. Jpn. Geotherm. Energy Assoc. 1973, 38, 9–46. [Google Scholar]
- Kiyosaki, J.; Tanaka, K.; Taguchi, S.; Chiba, H.; Takeuchi, K.; Motomura, Y. Hypogene alunite from acid alteration zone in Hatchobaru geothermal field, Kyushu, Japan. J. Geotherm. Res. Soc. Jpn. 2006, 28, 287–297. (In Japanese) [Google Scholar] [CrossRef]
- Hiraon, T. Hydrothermal alteration of volcanic rocks in the Hakone and northern Izu geothermal area. Bull. Hot Springs Res. Inst. Kanagawa Pref. 1986, 17, 73–166. [Google Scholar]
- Minami, Y.; Imura, T.; Hayashi, S.; Ohba, T. Mineralogical study on volcanic ash of the eruption on September 27, 2014 at Ontake volcano, central Japan: Correlation with porphyry copper systems. Earth Planet. Space 2016, 68, 1841. [Google Scholar] [CrossRef]
- Zimbelman, D.R.; Rye, R.O.; Breit, G.N. Origin of secondary sulfate minerals on active andesitic stratovolcanoes. Chem. Geol. 2005, 215, 37–60. [Google Scholar] [CrossRef]
- Mayer, K.; Scheu, B.; Yilmaz, T.I.; Montanaro, C.; Gilg, H.A.; Rott, S.; Joseph, E.P.; Dingwell, D.B. Phreatic activity and hydrothermal alteration in the Valley of Desolation, Dominica, Lesser Antilles. Bull. Volcanol. 2017, 79, 82. [Google Scholar] [CrossRef]
- Imura, T.; Ohba, T.; Nakagawa, M. Characteristics of hydrothermally altered minerals in volcanic products at Tokachidake volcano, central Hokkaido, Japan. Jour. Geol. Soc. Jpn. 2019, 125, 203–218. (In Japanese) [Google Scholar] [CrossRef]
- Seki, K.; Kanda, W.; Ogawa, Y.; Tanbo, T.; Kobayashi, T.; Hino, Y.; Hase, H. Imaging the hydrothermal system beneath the Jigokudani valley, Tateyama volcano, Japan: Implications for structures controlling repeated phreatic eruptions from an audio-frequency magnetotelluric survey. Earth Planet. Space 2015, 67, 539. [Google Scholar] [CrossRef]
- Akasaki, A.; Imura, R. Reconstruction of eruptive history of the central part of Kirishima Volcano from the drill core at Ebino Highland. In Proceedings of the Programme and abstracts of the Volcanological Society of Japan 2018 Fall Meeting, Akita, Japan, 26 September 2018; p. 217. (In Japanese). [Google Scholar]
- Imura, R. Geology of Kirishima Volcano. Bull. Earthq. Res. Inst. Univ. Tokyo. 1994, 69, 189–209. (In Japanese) [Google Scholar]
- Takakura, S. Influence of pore-water salinity and temperature on resistivity of clay-bearing rocks. Butsuri Tansa. 2009, 62, 385–396. (In Japanese) [Google Scholar] [CrossRef][Green Version]
- Byrdina, S.; Grandis, H.; Sumintadireja, P.; Caudron, C.; Syahbana, D.K.; Naffrechoux, E.; Gunawan, H.; Suantika, G.; Vandemeulebrouck, J. Structure of the acid hydrothermal system of Papandayan volcano, Indonesia, investigated by geophysical methods. J. Volcanol. Geotherm. Res. 2018, 358, 77–86. [Google Scholar] [CrossRef]
- Vandemeulebrouck, J.; Stemmelen, D.; Hurst, T.; Grangeon, G. Analogue modeling of instabilities in crater lake hydrothermal systems. JGR Solid Earth. 2005, 110, B02212. [Google Scholar] [CrossRef]
- Legaz, A.; Vandemeulebrouck, J.; Revil, A.; Kemna, A.; Hurst, A.W.; Reeves, R.; Papasin, R. A case study of resistivity and self-potential signatures of hydrothermal instabilities, Inferno Crater Lake, Waimangu, New Zealand. Geophys. Res. Lett. 2009, 36, L12306. [Google Scholar] [CrossRef]
- White, J.D.L.; Ross, P.-S. Maar-diatreme volcanoes: A review. J. Volcanol. Geotherm. Res. 2011, 201, 1–29. [Google Scholar] [CrossRef]
- Morgan, L.A.; Shanks, W.C.P.; Pierce, K.L. Hydrothermal processes above the Yellowstone magma chamber: Large hydrothermal systems and large hydrothermal explosions. GSA Spec. Pap. 2009, 459, 1–95. [Google Scholar] [CrossRef]
- Vandemeulebrouck, J.; Sohn, R.A.; Rudolph, M.L.; Hurwitz, S.; Manga, M.; Johnston, M.J.S.; Soule, S.A.; McPhee, D.; Glen, J.M.G.; Karlstrom, L.; et al. Eruptions at Lone Star geyser, Yellowstone National Park, USA: 2. Constraints on subsurface dynamics. JGR Solid Earth. 2013, 119, 8688–8707. [Google Scholar] [CrossRef]
- McKibbin, R.; Smith, T.A.; Fullard, L. Components and phases: Modelling progressive hydrothermal eruptions. Anziam J. 2009, 50, 365–380. [Google Scholar] [CrossRef][Green Version]
- Allis, R.G. Thermal history of the Karapiti area, Wairakei. Geophys. Div. N. Z. 1981, 137, 1–38. [Google Scholar]
- Allis, R.G. The 9 April 1983 steam eruption at Crater of the Moon thermal area, Wairakei. Geophys. Div. N. Z. 1984, 196, 1–25. [Google Scholar]
- Doke, R.; Harada, M.; Mannen, K.; Itadera, K.; Tatenaka, J. InSAR analysis for detecting the route of hydrothermal fluid to the surface during the 2015 phreatic eruption of Hakone Volcano, Japan. Earth Planet. Space 2018, 70, 63. [Google Scholar] [CrossRef]
- Mannen, K.; Yukutake, Y.; Kikugawa, G.; Harada, M.; Itadera, K.; Tatenaka, J. Chronology of the 2015 eruption of Hakone volcano, Japan: Geological background, mechanism of volcanic unrest and disaster mitigation measures during the crisis. Earth Planet. Space 2018, 70, 68. [Google Scholar] [CrossRef]
- Mastin, L.G. The roles of magma and groundwater in the phreatic eurptions at Inyo Craters, Long Valley Caldera, California. Bull. Volcanol. 1991, 53, 579–596. [Google Scholar] [CrossRef]
- Valentine, G.A.; Graettinger, A.H.; Sonder, I. Explosion depths for phreatomagmatic eruptions. Geophys. Res. Lett. 2014, 41, 3045–3051. [Google Scholar] [CrossRef]
- Valentine, G.A.; Sottili, G.; Palladino, D.M.; Taddeucci, J. Tephra ring interpretation in light of evolving maar–diatreme concepts: Stracciacappa maar (central Italy). J. Volcanol. Geotherm. Res. 2015, 308, 19–29. [Google Scholar] [CrossRef]
- Kaneko, T.; Maeno, F.; Nakada, S. 2014 Mount Ontake eruption: Characteristics of the phreatic eruption as inferred from aerial observations. Earth Planet. Space 2016, 68, 1226. [Google Scholar] [CrossRef]
- Maeda, Y.; Kato, A.; Terakawa, T.; Yamanaka, Y.; Horikawa, S.; Matsuhiro, K.; Okuda, T. Source mechanism of a VLP event immediately before the 2014 eruption of Mt. Ontake, Japan. Earth Planet. Space 2015, 67, 716. [Google Scholar] [CrossRef]
- Takagi, A.; Onizawa, S. Shallow pressure sources associated with the 2007 and 2014 phreatic eruptions of Mt. Ontake, Japan. Earth Planet. Space 2016, 68, 119. [Google Scholar] [CrossRef]
- Kato, A.; Terakawa, T.; Yamanaka, Y.; Maeda, Y.; Horikawa, S.; Matsuhiro, K.; Okubo, T. Preparatory and precursory processes leading up to the 2014 phreatic eruption of Mount Ontake, Japan. Earth Planet. Space 2015, 67, 111. [Google Scholar] [CrossRef]
- Miyagi, I.; Geshi, N.; Hamasaki, S.; Oikawa, T.; Tomiya, A. Heat source of the 2014 phreatic eruption of Mount Ontake, Japan. Bull. Volcanol. 2020, 82, 1–17. [Google Scholar] [CrossRef]
- Takagi, A. Ground deformation around the Shinmoedake crater before the 2011 Kirishimayama eruption. In Development of quantitative detection techniques of magma activity and improvement of evaluation of volcanic activity level. Tech. Rep. Meteorol. Res. Inst. 2013, 146–151. (In Japanese) [Google Scholar]
- Caudron, C.; Taisne, B.; Neuberg, J.; Jolly, A.D.; Christenson, B.; Lecocq, T.; Suparjan; Syahbana, D.; Suantika, G. Anatomy of phreatic eruptions. Earth Planet. Space 2018, 70, 168. [Google Scholar] [CrossRef]
- Kobayashi, T.; Morishita, Y.; Munekane, H. First detection of precursory ground inflation of a small phreatic eruption by InSAR. Earth Planet. Sci. Lett. 2018, 491, 244–254. [Google Scholar] [CrossRef]
- Volcanic Alert Levels of Kirishimayama (Around Ebinokogen (Ioyama)). Available online: https://www.data.jma.go.jp/svd/vois/data/tokyo/keikailevel.html (accessed on 10 January 2020).
- Volcanic Disaster Prevention Map of Mt. Kirishima. Available online: https://www.pref.miyazaki.lg.jp/kiki-kikikanri/kurashi/bosai/bousai-kikikanri/kazan_bousai_map.html (accessed on 10 January 2020).


© 2020 by the authors. Licensee MDPI, Basel, Switzerland. This article is an open access article distributed under the terms and conditions of the Creative Commons Attribution (CC BY) license (http://creativecommons.org/licenses/by/4.0/).