Article

The Rockall and the Orphan Basins of the Southern North Atlantic Ocean: Determining Continuous Basins across Conjugate Margins

1
Department of Earth Sciences, Memorial University of Newfoundland, St. John’s, NL A1B 3X5, Canada
2
School of Geography and Earth Sciences, McMaster University, Hamilton, ON L8S 4K1, Canada
*
Author to whom correspondence should be addressed.
Geosciences 2020, 10(5), 178; https://doi.org/10.3390/geosciences10050178
Submission received: 2 March 2020 / Revised: 3 May 2020 / Accepted: 8 May 2020 / Published: 13 May 2020

Abstract

:
Reconstructions of the opening of the North Atlantic Ocean generally result in the Orphan Basin, offshore Newfoundland, Canada, lying approximately conjugate to the rift basins on the Irish Atlantic margin at the onset of seafloor spreading toward the end of the Early Cretaceous. Most of these plate reconstructions have involved rigid plates with plate motions based solely on the interpretation of oceanic magnetic anomalies. In particular, these reconstructions often show the Rockall Basin, west of Ireland, forming a continuous Mesozoic basin with the West Orphan Basin, offshore Newfoundland. However, more recent plate reconstructions involving deformable plates have called this conjugate relationship into question. The goal of this study is to investigate the validity of this potentially continuous basin system by reconstructing and restoring present-day seismically-constrained geological models both spatially and temporally back to their original configurations pre-rift. By comparing the reconstructions in terms of sedimentary package thicknesses and crustal thicknesses in 3D, using both rigid and deformable plate reconstructions to orient the reconstructed models, we are able to test different basin connectivity scenarios using a multidisciplinary approach. Our analysis provides subsurface geophysical support for the hypothesis that the Rockall Basin was originally conjugate to and continuous with the East Orphan Basin during Jurassic rifting, later linking to the West Orphan Basin as rifting evolved during the Early Cretaceous. This complex basin evolution example highlights the need for using 3D rifting mechanism models to properly understand the fundamental driving forces during rifting and has significant implications for assessing basin prospectivity across conjugate margin pairs.

1. Introduction

Several petroliferous Mesozoic sedimentary basins (e.g., the Orphan Basin, the Flemish Pass Basin and the Jeanne d’Arc Basin) are located offshore Newfoundland and Labrador, eastern Canada, which were formed during the Late Triassic to Early Jurassic rifting that proceeded to the opening of the modern North Atlantic Ocean [1,2,3] (Figure 1B). On the conjugate Irish Atlantic margin, several basins were formed at approximately the same time (Late Triassic to Early Jurassic; e.g., the Rockall Basin and the Porcupine Basin; [4,5,6,7,8]; Figure 1C). While separation of the Irish continental margin from its conjugate pair, the Orphan Basin region, through seafloor spreading that occurred during the Mid- Late Cretaceous [3,6,9,10], the preceding rifting episodes were regionally extensive, reaching as far north as between Canada and Greenland possibly as early as the Triassic [11,12,13], with simultaneous, intermittent rifting episodes affecting the Rockall [4,14] and Orphan [2,15] basins during the entire Jurassic period.
Rigid plate palaeoreconstructions of the North Atlantic Ocean to approximately 200 Ma show that the East and West Orphan basins appear to align with the Porcupine and the Rockall basins, respectively [17,18,19,20]. Consequently, the basins on both margins have generally been considered to be conjugate, with the expectation that they exhibit comparable stratigraphic and structural features, and experienced similar crustal syn-rift evolution [21]. However, palaeoreconstructions of the North Atlantic that allow for the inclusion of microcontinental fragments and deformable plates have challenged these basin linkages [22,23], with [24] suggesting that the Rockall Basin was originally conjugate to the East Orphan Basin, eventually abandoning this linkage in favour of the West Orphan Basin after the Jurassic.
The purpose of this paper is to investigate whether 2D geological models derived from interpretation of seismic reflection profiles, and then restored back through time to their pre-rift state, can be used as an additional tool to support or refute the basin connectivity scenarios suggested by different published plate reconstructions. Specifically, we look at the relationship between the Orphan Basin on the Newfoundland margin and the Rockall Basin on the Irish margin (both highlighted in Figure 1). This work complements that done by [25] in challenging classically accepted basin connectivity across the Newfoundland-Ireland conjugate margins in light of new plate reconstructions [22,23,24]. Cognizant of the lack of deep well control, we compare seismic characteristics, sedimentary layer and crustal geometries, 2D structural reconstructions, and 3D kinematic evolution models, and assume that they reveal basin connectivity when analyzed jointly with the plate reconstructions.

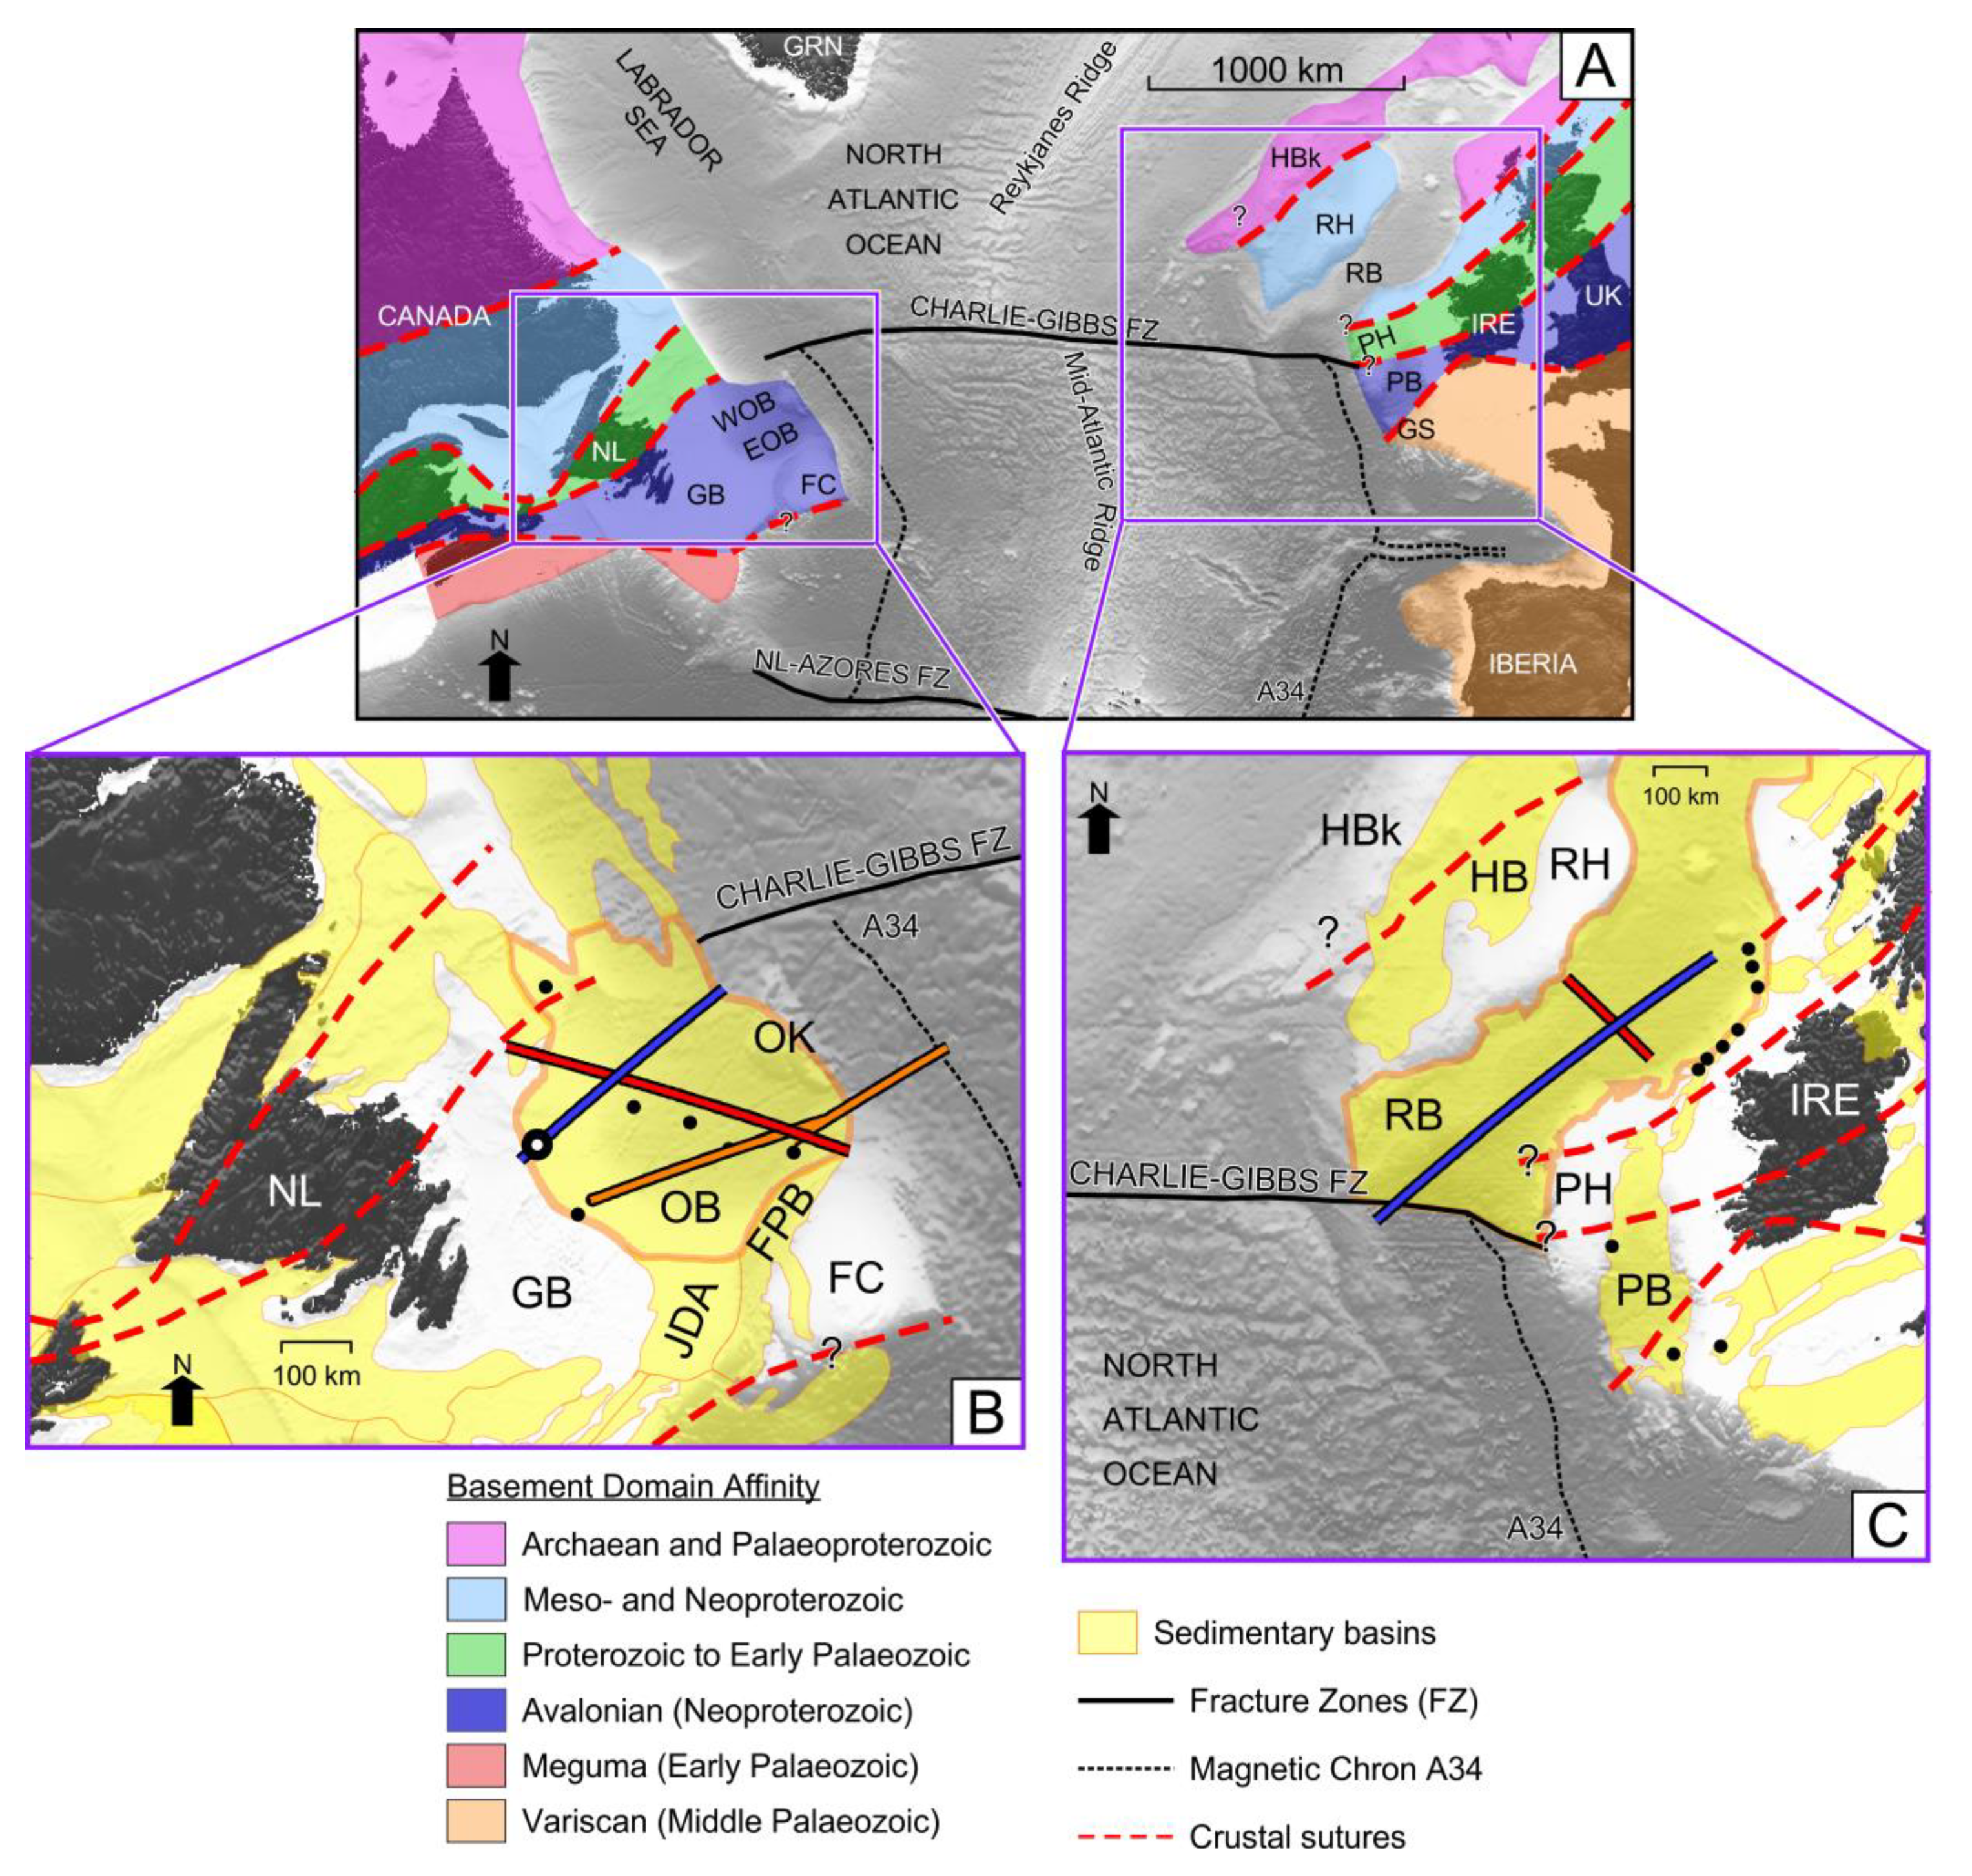
2. Geological Setting

A number of deep-water sedimentary basins are located west of Ireland on the Atlantic continental margin (Figure 1C), with the two largest being the Rockall Basin and the Porcupine Basin. The Rockall Basin is the largest sedimentary basin on the Irish Atlantic continental margin [26], with a NE-SW orientation for the long axis of the basin, while the Porcupine Basin lies to the south within the continental shelf, with a N-S orientation.
The Orphan Basin lies at the eastern limit of the North American continent, approximately 300 km seaward of the island of Newfoundland (Figure 1B). The Orphan Basin lies northeastward of the continental shelf (GB in Figure 1) and is bordered to the southeast by the Flemish Cap continental ribbon [27] (FC in Figure 1). A system of NE–SW trending ridges and faults divide the Orphan Basin into a generally shallower eastern sub-basin (EOB), and a deeper western sub-basin (WOB) [3] (Figure 1A).

3. Basin Evolution

3.1. Rockall Basin

The distribution of inherited basement domains (Figure 1A), established during the Caledonian Orogeny [16,28,29,30], influenced the development of the entire North Atlantic [31,32], including the Irish Atlantic Margin [14,33]. Due to the reactivation of basement lineaments and crustal sutures during east-west extension affecting the supercontinent Pangaea [34], the Rockall Basin began to develop in the Permian [4,14] (Figure 2). Triassic basin formation continued in a broadly similar setting [14]. During the Early Jurassic, there was a period of inactivity following the cessation of the Triassic rifting. In the Late Jurassic a period of major rifting began, continuing into the Early Cretaceous, across the Irish Atlantic margin [14,35]. In the Rockall Basin, the Early Cretaceous rifting is thought to have been more significant than Jurassic rifting [28] (Figure 2). Thermal subsidence began in the Late Cretaceous as basin rifting gave way to a phase of drift [4], continuing into the Cenozoic.
Cenozoic tectonic activity is reflected in the interplay of post-rift thermal subsidence [5,26] and compression from the Alpine Orogeny [4]. In the Rockall Basin, thermal subsidence continued through this period until it was interrupted by a major uplift [4]. The resulting unconformity is likely due to sea-floor spreading in the North Atlantic, causing crustal heating and uplift [4]. This era is marked by a period of intense igneous activity [28,34] that was interpreted by [14] to be associated with the British-Irish Thulean Province, a large igneous province in the North Atlantic. Accompanying this activity were large swarms of sills and flows that were intruded into the Rockall region [36,37,38].

3.2. Orphan Basin

The closure of the Iapetus Ocean during the Caledonian-Appalachian Orogeny produced structures that ran NE-SW, along the strike of the orogeny [41,42]. The formation of the Orphan Basin was largely controlled by these pre-existing basement structures (Figure 1A). The initial phase of rifting affected mainly the East Orphan Basin and is thought to have occurred as early as the Triassic [2,15,43] (Figure 2). Rifting is interpreted to have begun in the East Orphan Basin and progressed westward, as evidenced by the change in orientation of faults and basement ridges from NE-SW to N-S within the Orphan Basin [2].
During the Late-Jurassic to Early Cretaceous, the second phase of rifting occurred [2,15], resulting in enlargement of the Orphan Basin. During this time, the Orphan Basin is interpreted to have been divided into a younger West Orphan Basin and an older East Orphan Basin [2,21]. The West Orphan Basin is inferred to have only begun opening in the Late Jurassic [2]. However, this conclusion may simply reflect a lack of deep well control [15] or the possibility of erosion of the Jurassic sequence in the West Orphan Basin [21].
During the Aptian-Albian (113 Ma), a third phase of extension occurred that was oriented NE-SW, overprinting the two previous rift phases [2,15]. As a result of the change in extension direction, structures in the East Orphan Basin were reactivated and the basin widened. Structures in the West Orphan Basin were also reactivated during this phase of rifting. This reactivation in the West Orphan Basin was likely related to the northward propagation of extension and the opening of the Labrador Sea between Labrador and southwest Greenland [12,44,45].
The Mid-Late Cretaceous extension also separated the Newfoundland margin from the conjugate Irish margin [6,9,15,21]. Doré et al. [35] interpreted this event as a reactivation of the Caledonian-Appalachian basement structures (Figure 1A). The East and West Orphan basins experienced extension and minor transtension from this Late Cretaceous rift to drift episode [2]. During the Paleocene, the Orphan Basin evolved in a post-rift setting, with a long period of thermal subsidence resulting in the deposition of a thick Cenozoic succession [21].

4. Previously Published Plate Reconstructions

Using a proprietary 4D modelling software package, Skogseid [24] performed a kinematic plate reconstruction of the North Atlantic margins. This restoration focused on the role of the Orphan Basin, as well as the rotation of the Flemish Cap away from the Bonavista Platform, during the formation of the North Atlantic Ocean. The reconstruction generated during the Jurassic at 180 Ma suggests that the Rockall Basin and the East Orphan Basin are in N-S alignment and form a singular basin, which extends southward to the Jeanne d’Arc Basin. During the Early Cretaceous, at 140 Ma, the Flemish Cap and East Orphan Basin rotate eastward with respect to the Eurasian Plate, thus causing the Rockall Basin to abandon its linkage with the East Orphan Basin. At this stage, the West Orphan Basin is argued to have been established from a westward rift axis jump and southward rift propagation from the Rockall Basin. The Porcupine Basin appears to align NNE-SSW with the East Orphan Basin at this time. At 120 Ma, the reconstruction depicts the Orphan Basin in its final stage of tectonic development, with the West Orphan Basin aligned N-S with the Rockall Basin and the East Orphan Basin aligned NNE-SSW with the Porcupine Basin. Ultimately, Skogseid [24] conclude that the main Mesozoic NE Atlantic rift centre was the Rockall Basin, which was directly involved in the two-stage opening of the East and West Orphan basins.
The results of the kinematic plate reconstruction carried out by [24] conflict with the results of the widely-used rigid-plate reconstruction published by [46,47] using GPlates, a freely-available plate reconstruction software platform (http://gplates.org). Their model shows that the Rockall Basin was possibly never continuous with the Orphan Basin, but, if a possible connection was to be assumed from their reconstruction, only the West Orphan Basin would have been connected to the Rockall Basin.
Nirrengarten et al. [22] investigated the partitioning and propagation of deformation in the southern North Atlantic using kinematic modelling in GPlates, with continental undeformable micro-blocks included (i.e., the Orphan Knoll, the Flemish Cap, the Rockall High, and the Porcupine High). The restoration of the Newfoundland-Ireland conjugate margins was not the primary focus of their paper; however, they generated a plate model in GPlates that restored the two basins and showed a possible evolutionary link in which the Rockall Basin was initially conjugate to the East Orphan Basin and later the West Orphan Basin.
A recent paper, [23], builds on the work of [22] by constructing deformable plate tectonic models for the southern North Atlantic, again using GPlates. One of their goals was to investigate the implications of the spatial-temporal evolution of the region, including the consequences for conjugate margin, and connected basin studies. Peace et al. [23] determine that the inclusion of rotating, independent, continental fragments and ribbons within the rift has profound implications for conjugate margin studies. They state that some ‘conjugate margin’ studies may be over-simplistic in areas such as the southern North Atlantic where multiple, continental fragments and ribbons may have originally been part of the same rift system. According to the reconstructions presented by [22], which were built upon by [23], the Rockall Basin may not have originally been conjugate to the West Orphan Basin and, furthermore, the Rockall Basin may be more akin to the East Orphan Basin. This point is also addressed in the work by [25] who state that the connection between the East Orphan and the Porcupine basins is unlikely. Instead, Sandoval et al. [25] posit ancient connections between the Porcupine and Galicia Interior basins (with the latter on the Iberian margin), and the East Orphan and Rockall basins, respectively. Based on new insights from these plate reconstructions, we investigate the possible connections between the East and West Orphan basins and the Rockall Basin by adding the depth dimension to existing plate reconstructions, using seismic reflection data interpretation and basin restoration.

5. Methodology

5.1. Data

The geophysical data used in this work were primarily seismic reflection data. The seismic reflection data were acquired in 2013 and 2014 within the Rockall Basin, offshore Ireland, and were provided by the Department of Communications, Climate Action & Environment of Ireland. The seismic reflection data in the Orphan Basin, offshore Newfoundland, were acquired in 2001 and were provided by TGS-NOPEC Geophysical Company (TGS).
A total of five seismic lines, NL1, NL2, NL3, IR1, and IR2, were chosen for the seismic interpretation and reconstructions (line locations shown in Figure 1). The main seismic line used in the West Orphan Basin, NL1, lies across strike of the rifted margin, whereas the main seismic line in the Rockall Basin, IR1, lies along strike of the rifting axis. To compensate for the variability in the observed faulting trends and styles across the two basins, additional intersecting seismic lines, NL2 and IR2, were incorporated into the interpretation and analysis of this study. The addition of these intersecting seismic lines allows for a more direct comparison between the basins. The main seismic line in the East Orphan Basin (NL3) is a composite line that spans across the rift axis.

5.2. Seismic Interpretation

Building on the well correlations and methodology of [43] in the Orphan Basin, seismic sequences in both basins were defined based on syn-rift and post-rift characteristics. As syn-rift sequences are accumulations of sedimentary rocks deposited during rifting, these sequences are generally heavily faulted and deformed as well as displaying characteristic growth fault geometries. Post-rift sequences are sedimentary rocks that accumulated after rifting has ceased. Generally, post-rift layers are more laterally continuous than syn-rift deposits.
Within the Rockall and the East and West Orphan basins, five seismic sequences were identified and interpreted (Figure 3). These sequences are: acoustic basement, Jurassic sedimentary rocks (only in the Orphan Basin), Lower Cretaceous sedimentary rocks, Upper Cretaceous sedimentary rocks, and Cenozoic sedimentary rocks. Each sequence was identified and mapped in two-way travel time (TWT) along the interpreted seismic lines. The interpretations of lines NL1 and IR1 are provided in Figure 4 and Figure 5, respectively.
Due to the lack of deep well control in the Rockall Basin (as demonstrated in Figure 1C) and extensive Paleogene igneous intrusions [48] (as shown in Figure 5C), the seismic interpretation in the Rockall Basin was correlated with previously published interpretations [37]. Seismic interpretations were also correlated with the Porcupine Basin through regional seismic lines and jump correlation. The lack of deep well control in the Orphan Basin (where drilling has been focused on basement highs) led to seismic interpretations being checked against previously published interpretations [21].
Magnetic Chron A34, associated with the onset of seafloor spreading as interpreted by [16], was used to position the boundary between transitional crust and oceanic crust. As the focus of this study is on the acoustic basement continental crust and the associated syn-rift and post-rift sedimentary rocks, the oceanic crust was excluded from the analysis. Thus, the seismic sequences and faults located on the oceanward side of Chron A34 along line IR1 were excluded from the basin reconstruction (Figure 1C and Figure 5).
The base of the Cenozoic sequence in both the Rockall and Orphan basins corresponds to an unconformity resulting from a temporary hiatus in deposition of post-rift sedimentary rocks. The top of the Cenozoic sequence is the first positive, high amplitude event observed and therefore allows for excellent seismic correlation and a high level of confidence in the pick. Due to the deeper focus of this study, the Cenozoic sequence was not subdivided into multiple sub-sequences. Numerous seismic characteristics occur within this undivided sequence (Figure 3).
The Upper Cretaceous sequence represents post-rift sedimentation, as the Rockall and Orphan basins transitioned to thermal subsidence following Lower Cretaceous rifting [21]. The continuously high amplitude reflection associated with the top of the Upper Cretaceous horizon allowed it to be picked with high confidence. This sequence contains numerous parallel, laterally continuous reflectors in both the Rockall and Orphan basins (Figure 3).
The Lower Cretaceous sequence is a syn-rift sedimentary sequence within the Orphan and the Rockall basins. This sequence is generally continuous and is only interrupted by the intrusion of the younger Paleogene sills in the Rockall Basin [5,48] (Figure 5C). Interpretation of deep strata in the Rockall Basin was hindered by the presence of these sills. In the Rockall Basin, the Lower Cretaceous sequence is characterized by relatively high amplitude continuous to discontinuous reflections (Figure 3). In the Orphan Basin, the top of the Lower Cretaceous sequence is marked by a high amplitude reflector that is continuous throughout the entire basin. The seismic character of the sequence is chaotic with minimal internal coherency (Figure 3).
The Jurassic sequence is also a syn-rift sedimentary sequence, with highly variable seismic characteristics. In the Orphan Basin, a package of high amplitude, chaotic reflectors is typically associated with this sedimentary sequence. These reflectors are not parallel and have minimal lateral continuity (Figure 3). Due to the prevalence of the large igneous sills within the Rockall Basin and the lack of deep coherent reflections in the seismic data, no Jurassic or Triassic sedimentary rocks could be reliably interpreted therein.
The top of the acoustic basement structure was interpreted beneath the last laterally coherent seismic event observed in both the Rockall and Orphan basins (Figure 3). This horizon separates the pre-rift sedimentary rocks and basement from the syn-rift sedimentary rocks that were deposited during rift episodes [4,49]. Due to the lack of additional constraints, such as well data or prominent crustal features, the interpretation of the top of the basement horizon is poorly constrained in the Rockall Basin.

5.3. 2D Modelling

Following seismic interpretation (seismic lines NL1 and IR1 shown in Figure 4 and Figure 5, respectively), the interpretations were imported into the software package MOVETM, by Petroleum Experts Ltd. and Midland Valley, to carry out 2D structural reconstructions. First, the seismic interpretations were converted from time to depth using the velocities in Table 1. Next, the software was used to decompact each sedimentary layer and restore thermal subsidence while back stripping/removing successive layers of sedimentary rock.
Decompaction involves compensating for the weight of overlying sedimentary sequences by restoring porosity as each overlying layer is removed. This was undertaken using the 2D Decompaction module in MOVETM and requires knowledge of compaction curves with depth. The default compaction curves, based on the work by [50] using North Sea data, were used in this study. Basin-specific and lithology-specific parameters used in this study for the decompaction and thermal subsidence restoration are listed in Table 2, Table 3, and Table 4. As each layer was removed, a local Airy isostasy assumption was used to calculate the isostatic response.
Based on the Moho proxy provided by [15], a crust-mantle boundary was added to the interpretation. The influence of the crust-mantle boundary did not contribute to the restoration of the continental crust across the conjugate margin. However, the crust-mantle boundary (or Moho) was moved passively throughout the reconstruction, so that a pre-rift crustal thickness could be obtained after the restoration was complete.
Thinning of the lithosphere is eventually accompanied by thermal subsidence once the thermal buoyancy forces reduce through thermal diffusion. This thermal subsidence must be considered for each post-rift layer, prior to decompaction, to accurately restore each basin. Note that erosion cannot be accurately constrained and was not accounted for in this work, which represents an important limitation of our results. Other limitations include lack of constraints on paleobathymetry, sea level change, and sampled lithological densities.
The parameters used for the 2D Thermal Subsidence module in MOVETM are shown in Table 2, Table 3 and Table 4. The average amount of post-rift and syn-rift sedimentary rock was calculated from the combination of the Cenozoic and Upper Cretaceous sedimentary sequences (post-rift sequences), and the Lower Cretaceous and, where applicable, the Jurassic sedimentary sequences (syn-rift sequences), respectively.
One of the parameters needed to calculate thermal subsidence is the whole crustal beta factor (β), which represents the ratio of final crustal thickness to the original crustal thickness. For the purpose of this study, a single average cumulative stretching factor was used for the restoration throughout geological time due to lack of constraints on the incremental variation of β through time. Estimates of cumulative β across the basins can be obtained by using modern crustal thicknesses derived from constrained gravity inversion [15] and assumptions about the original crustal thickness prior to rifting. Tests were performed for line NL1 (results not shown) to determine how the choice of β affected the subsidence calculation and the overall restoration, specifically whether a constant β for the whole basin region or a variable β should be used. These tests revealed only minor differences between the restored 2D geological models. Consequently, based on β value maps derived by [15], a constant β value of 2.0 was chosen as regionally representative and used across the Newfoundland-Ireland conjugate margin pair. The same value was used by [21].
After the decompaction and the thermal subsidence calculations have restored each interpreted seismic line down to a horizon that has been heavily faulted due to rifting, fault modeling was performed using the 2D Move-on-Fault module also from MOVETM. A shear angle of ±60° was used, with the polarity depending on the dip direction of the fault [52].
Figure 6 summarizes each of the stages of the decompaction, thermal subsidence restoration, and fault restoration for lines NL1 (left column) and IR1 (right column). The topmost profiles (Figure 6A,B) show the effect of the depth conversion. The reconstruction progressed through the Cenozoic sedimentary layer decompaction and thermal subsidence restoration (Figure 6C), Upper Cretaceous sedimentary layer decompaction and thermal subsidence restoration (Figure 6D), Lower Cretaceous sedimentary layer decompaction (Figure 6E), Jurassic sedimentary layer decompaction, fault restoration and unfolding (Figure 6F) and acoustic basement rebound, fault restoration and unfolding (Figure 6G). Note that for the Cenozoic subsidence calculation, a paleo-water depth must be assumed. For this study, the paleo-water depth determined by [43] was used.
Prior to the fault restorations, following the interpretations of [21,43] and the definition of the brittle-ductile transition zone [53], a crustal boundary between the upper and lower crust was interpreted along all five seismic lines in the Rockall Basin and the East and West Orphan basins based on the maximum depth of interpreted faulting (Figure 6F). Following fault restoration, the interpreted models were assumed to represent a pre-rift state.
The amount of extension observed from faulting in the Rockall and West Orphan basins was measured in MOVETM based on the distance from the edge of the fully restored upper crustal section to the original extent of the seismic line. The distance measured represents the amount of extension, based solely on observed upper crustal brittle faulting for each basin. For comparison, the poles of rotation from [22] were used in GPlates to estimate the amount of expected extension in each basin by measuring the change in length of the basins along the seismic line as the model changed through time (details below).

5.4. 3D Modelling

To construct evolving 3D geological models, the GPlates software was used (version 2.2). GPlates is a freeware plate reconstruction software package in which plate reconstructions based on published Euler pole and timing constraints can be visualized [54]. In GPlates, the restored lines NL1, NL2, NL3, IR1, and IR2, which represent temporally evolving 2D geological models, needed to be properly oriented in 3D space relative to each other through geological time. This was achieved, spanning back to 201 Ma, by pinning the locations of the modern seismic lines to the rigid plates in the plate reconstruction by [46,47]. Deformable reconstructions were not used to build the 3D geological models as the seismic lines cannot be easily pinned to deforming regions without warping the lines.

6. Results

6.1. Orphan Basin

6.1.1. Seismic Interpretation

In the West Orphan Basin (Figure 4), the Cenozoic sequence is thickest to the SW, over the continental shelf, and thins gradually towards the NE (oceanward). The Upper Cretaceous sequence is thickest over depocentres and thins slightly over local basement highs. The Lower Cretaceous sequence is thicker in localized basins and depocentres and also thins over local basement highs. The thickest portion of the Lower Cretaceous sequence is observed along the southwestern half of NL1, approaching the continental shelf. A syn-rift sequence would typically be moderately faulted because the sedimentary rocks are being deposited while rifting is occurring. However, in the West Orphan Basin, along NL1, the Lower Cretaceous sequence displays a post-rift character, in that the sequence is not heavily faulted. The thickness of the sequences of Jurassic sedimentary rocks in the West Orphan Basin is moderately laterally continuous (approximately 1.3 km), with some depocentres exhibiting thicker deposition (up to approximately 5 km). The Jurassic sedimentary rocks are absent only over the basement highs, for example, where the highlighted well was drilled (location shown in Figure 1B). The interpreted Jurassic sedimentary features abut and/or pinch out against a listric fault or the basement horizon. In the West Orphan Basin, the structure of the basement shows multiple tilted fault blocks, primarily dipping NE.
Based on the seismic interpretation for the West and East Orphan basins, an average of ~3.7 km and 3.8 km of post-rift sedimentary rock accumulated after rifting, respectively, and an average of ~2.4 km and 3.8 km of syn-rift sedimentary rock accumulated during rifting, respectively.

6.1.2. 2D Basin Modelling

The Cenozoic sequence along seismic line NL1 (Figure 6C) appears to have been most affected by the decompaction in the southwest-central portion of the seismic line compared to the NE, where the sediment thins and the crust transitions from continental to oceanic crust. During the Cenozoic, the continental crust subsided by approximately 770 m and 900 m, in the West and East Orphan basins, respectively.
For the Upper Cretaceous period (Figure 6D), the decompaction process resulted in a relatively uniform lateral decompaction while the continental crust was restored for a subsidence of approximately 790 m and 950 m, in the West and East Orphan basins, respectively. After the Lower Cretaceous decompaction (Figure 6E), as observed for shallower decompactions, thicker interpreted sedimentary cover resulted in greater amounts of decompaction.
The decompaction of the Jurassic sedimentary rocks in the West Orphan Basin did not have a significant effect on their overall thickness (Figure 6F). As a result of the restoration of the Jurassic faults, 25 km of lateral extension was restored along profile NL1.
Rebound of the acoustic basement/upper crust in Figure 6G following removal of the Jurassic sedimentary rocks was not significant. Meanwhile, restoration of the upper crustal faults compensated for 35 km of lateral extension in the West Orphan Basin, along NL1. The average pre-rift crustal thickness, calculated from the MOVETM models, using the crust-mantle boundary (Moho) from [15] that had passively been displaced during the restoration, was 12.3 km for the West Orphan Basin and 8.6 km for the East Orphan Basin.

6.2. Rockall Basin

6.2.1. Seismic Interpretation

The thickness of the Cenozoic sequence in the Rockall Basin is laterally consistent until the transition from continental to oceanic crust where the package thins dramatically (Figure 5). The Upper Cretaceous sequence thins toward the SW (oceanward) and thickens toward the NE (landward) and is not heavily faulted. The top of the Lower Cretaceous sequence does not pinch-out against faults or horizons. Instead the sequence maintains a relatively constant thickness across numerous faults. The basement is dissected by numerous listric faults and multiple horst and graben structures. Based on the seismic interpretation, an average thickness of ~2.4 km of syn-rift sedimentary rock and an average thickness of ~3.5 km of post-rift sedimentary rock accumulated in the Rockall Basin.

6.2.2. 2D Basin Modelling

During the Cenozoic, the continental crust subsided by approximately 740 m in the Rockall Basin (Figure 6C). Along seismic line IR1, the decompaction process had a stronger effect towards the NE, where more Upper Cretaceous sedimentary rocks were interpreted. Towards the SW, where only a thin veneer of sedimentary rocks was interpreted, the decompaction process had minimal effect. For the Upper Cretaceous period (Figure 6D), subsidence of the continental crust was approximately 805 m in the Rockall Basin. After the Lower Cretaceous decompaction (Figure 6E), as previously observed for shallower decompactions, where thicker sedimentary cover was initially interpreted, a greater amount of decompaction was required. In the Rockall Basin along line IR2, which lies across the rift axis (not shown in Figure 6) approximately 7.5 km of extension was restored based on interpreted faulting. The average pre-rift crustal thickness, calculated from the MOVETM models, using the crust-mantle boundary (Moho) from [15] that had passively been displaced during the restoration, was 8.5 km for the Rockall Basin.

6.3. 3D Basin Modelling across the Margins

3D geological models for both the Orphan Basin and the Rockall Basin combined, incorporating the individual 2D reconstructed models for the individual seismic lines, were generated for present day (Figure 7), 66 Ma (Figure 8A), 100 Ma (Figure 8B), 145 Ma (Figure 9A), and 201 Ma (Figure 9B). The models were oriented in space through geological time using the rigid plate reconstruction from [46,47].
Present day, a distance of approximately 1900 km extends from the northeastern limit of seismic line NL1, in the West Orphan Basin, to the continental crust of seismic line IR1, in the Rockall Basin, as measured in GPlates (Figure 7). Consequently, the individual 2D geological models from both margins cannot be effectively combined into one 3D plot at the correct spatial scale for analysis. Nonetheless, the individual models show comparable sedimentary and crustal thickness variations, with more faulting observed on the Newfoundland margin, likely due to the absence of interfering igneous features in the seismic data.
During the Upper Cretaceous (66 Ma) time period (Figure 8A), the distance between the endpoints of NL1 and IR1 is reduced to approximately 300 km. The resulting 3D geological model, while still not perfectly to scale in terms of the spatial distancing between the lines, shows cross-sections that seemingly should approximately match up at their oceanward ends in terms of sedimentary and crustal thicknesses.
At 100 Ma during the Lower Cretaceous (Figure 8B), the rigid reconstruction in GPlates of [46,47] shows the two basins approximately connecting as the North Atlantic Ocean opens, with a distance of approximately 60 km between their seaward limits. The thickness of the Lower Cretaceous sedimentary package appears similar at the oceanward ends of the lines while the crustal thickness on the Irish margin appears greater, as can also be observed in Figure 6E.
When restoring the conjugate margins at 145 Ma (Figure 9A), the rigid plate model shows the primary lines on each margin missing each other with a lateral offset of approximately 160 km. Nonetheless, they are combined into one model where the restored Jurassic sequence in the Orphan Basin is juxtaposed against the rebounded crust model for the Rockall Basin, prior to fault restoration. The resulting 3D geological model shows nice continuity in terms of both upper crustal and lower crustal thicknesses where the lines approximately match up.
Finally, the fully restored crustal reconstruction in GPlates at 201 Ma is shown in Figure 9B as a continuous megatransect, despite the ends of the original primary seismic lines being laterally offset by 280 km. This offset, due to the lines being pinned to rigid plates in the reconstruction in GPlates, results in an overlap of the ends of the lines and a corresponding misfit in the 3D geological model where there appears to be thicker upper and lower crust on the Newfoundland margin compared to the Irish margin.
To contrast with the 3D models derived using the rigid plate model of [46,47], the same 2D restored sections were also used to construct 3D models based on the reconstructions generated by [24] using proprietary deformable plate reconstruction software. Without access to that software, the locations of the seismic lines had to be approximated relative to the published snapshots from the reconstructions of [24]. The resulting models, along with simplified reconstructed maps, are presented in Figure 10, Figure 11 and Figure 12, corresponding to 180 Ma, 140 Ma, and 120 Ma, respectively.
The deformable reconstruction to 180 Ma during the Lower Jurassic from [24] results in line NL3 in the East Orphan Basin being connected to line IR1 in the Rockall Basin. The resulting megatransect (A to A’ in Figure 10) shows a good match in terms of upper crustal thickness where the lines match up but a large misfit in terms of lower crustal thickness. It should be stressed again that the line locations and orientations are approximate due to not having access to the deformable reconstruction directly.
The deformable reconstruction to 140 Ma during the Lower Cretaceous from [24] shows a similar result to the rigid plate reconstruction from [46,47] such that transect A to A’ in Figure 11 essentially reproduces the result in Figure 9A. The only addition is the 2D model for line NL3 (profile B to B’ in Figure 11), which exhibits significantly more faulting.
Finally, in the deformable reconstruction from [24] at 120 Ma (Figure 12), which is at a later point during the Lower Cretaceous, a similar result to the rigid plate reconstruction from [46,47] for transect A to A’ in Figure 8B can be seen. The addition of the 2D model for line NL3 (profile B to B’ in Figure 12) highlights the presence of more Jurassic sedimentary rocks in the East Orphan Basin compared to the West Orphan Basin, and again, a greater degree of faulting in the East Orphan Basin.

7. Discussion

7.1. Interpreted Jurassic Sedimentary Rocks (or Lack Thereof)

The extent and location of Jurassic sedimentary rocks in the West Orphan Basin has recently been debated [3,21]. We appreciate that the amount of Jurassic sedimentary rocks interpreted in this work, in the West Orphan Basin, is controversial; however, the interpretation is based on the continuity of structures and the seismic character described in the Methodology section. Additionally, it is important to note that no wells have been drilled through sequences of Jurassic sedimentary rocks in the deepest extents of the West Orphan Basin, so their presence has not been confirmed. The 3D geological model in Figure 12 provides a visual representation of the distribution of Jurassic sedimentary rocks across the Orphan Basin, with more significant accumulations in the East Orphan Basin (profile B to B’) compared to the West Orphan Basin (profile A to A’).
No Jurassic sedimentary rocks have been interpreted in the Rockall Basin in this study, due to the widespread extent of Paleogene sills that obscure the deep seismic data (Figure 5C). However, [37] interpret Jurassic sedimentary rocks throughout the entire Rockall Basin using constraints from previous work [55,56,57,58]. No wells have been drilled in the centre of the Rockall Basin to confirm or refute the presence of any Jurassic sedimentary rocks but their presence would be geologically consistent with the regional rift evolution at that time (Figure 2) and with the potential communication with the West Orphan Basin (Figure 8B and Figure 12).

7.2. Sedimentary Layer Thickness

The average syn-rift thickness in the East Orphan Basin is significantly higher than the syn-rift thicknesses recorded in the West Orphan Basin and the Rockall Basin (Table 5), which is visually evident in Figure 12. Although it should be noted that interpreting syn-rift thickness, especially in the Rockall Basin, is particularly problematic. The similarity in the syn-rift sedimentary thicknesses between the West Orphan and Rockall basins could potentially imply that both of the basins were subjected to similar processes and sediment accumulation rates during rifting. Obviously, there are numerous factors that control sedimentation rates and thicknesses (i.e., thermal subsidence, erosion, varying sources and structural highs) and we understand this assumption/comparison is speculative. However, to first order, these sedimentary thickness comparisons, when combined with the plate reconstructions by [22,23,24], allow us to propose the possibility of basin connectivity during the latter stages of rifting during the Lower Cretaceous.
During the preceding Late Jurassic rifting, the deformable reconstruction from [24] suggests connectivity between the East Orphan Basin and the Rockall Basin, as illustrated in Figure 10. It is possible that during the North Atlantic rifting events that occurred at ~160–140 Ma [4], the Rockall Basin abandoned its original linkage to the East Orphan Basin and became continuous with the West Orphan Basin. This change in the Rockall Basin’s linkage from the East to the West Orphan Basin could potentially explain the discrepancy in syn-rift sedimentary rock thickness observed between the Rockall Basin and the East Orphan Basin and the similarities observed between the West Orphan Basin and the Rockall Basin. The exact timing of the basin connectivity realignment of the Rockall Basin, from the East to the West Orphan Basin, is difficult to quantify due to the lack of Jurassic sedimentary rocks interpreted in the Rockall Basin. Therefore, it is difficult to state whether the connectivity realignment of the Rockall Basin from the East to the West Orphan Basin happened around 160 Ma, during the Late Jurassic, as the West Orphan Basin began to open [2], or around 140 Ma, after Jurassic rifting had ceased across the margins [3,51]. Since the age constraints for this study are not accurate enough to specify a time period of the basin connectivity realignment, the time period used by the model generated by [24] is chosen, 140 Ma, based on the derived 3D geological model (Figure 11).
Skogseid et al. [24] state that the reason that the Rockall Basin abandoned its linkage with the East Orphan Basin was due to the relative eastward movement of the East Orphan Basin and Flemish Cap with respect to the Irish margin. Therefore, it is likely that, as the East Orphan Basin rotated further east following the motion of the Flemish Cap, the Rockall Basin remained stationary, seeking a weaker, more accessible rift zone. As rifting propagated westward from the East Orphan Basin during the Late Jurassic, the West Orphan Basin began to open [2]. This potentially put the Rockall Basin in closer proximity to a weaker rifting zone, the West Orphan Basin, therefore causing the basin connectivity realignment.
At 120 Ma (Figure 12), the Rockall Basin and the West Orphan Basin likely remained connected based on the combination of new plate reconstructions [22,23,24] and the similarities in syn-rift thicknesses observed in this study, until the North Atlantic began to open through seafloor spreading around 100 Ma [4].
Focusing on the large-regional scale, both the Rockall and Orphan basins experienced a similar amount of post-rift sedimentary rock accumulation, even though the basins were drifting apart during this time (Table 5). Nonetheless, it is expected that the East and West Orphan basins experienced similar amounts of post-rift deposition due to their similar geographic location. Following rifting, the East and West Orphan sub-basins evolved in a relatively similar manner [2].

7.3. Amount of Extension

In the West Orphan Basin, the amount of extension observed along seismic line NL1, lying across the rift axis, was approximately 60 km. The amount of extension calculated along seismic line IR2, in the Rockall Basin, based on observed faulting, was 7.5 km. According to the model of [22], it was estimated that the West Orphan Basin and Rockall Basin extended approximately 200 km and 130 km, respectively. Following a similar methodology, [25] calculated a total of 34.5 km of extension in the East Orphan Basin. According to the model of [22], the amount of extension for the East Orphan Basin is approximately 87 km.
Numerous authors have reported similar extensional discrepancies across rifted margins [21,25,59,60,61]. There are multiple explanations for the extensional discrepancies observed. The first possible explanation suggests that faulting has been severely under interpreted, either due to insufficient data quality or possibly due to polyphased faulting. For both scenarios, the brittle extension would be greatly underestimated [62]. The second possible explanation is depth-dependent stretching, which suggests that the lower crust has been thinned considerably more than the brittle upper crust and the interpreted faulting represents only the amount of brittle extension [59,60,63,64] We are unable to address the degree of stretching in the upper mantle due to a lack of constraints. Therefore, we infer that differential stretching occurred in the crust and can only presume that similar behavior occurred throughout the lithosphere.

7.4. Continental Crustal Thickness

The initial crustal thickness of the Newfoundland-Ireland conjugate margins was assumed to be 30 km [15,21]. The discrepancy between the assumed and observed pre-rift crustal thickness is possibly the result of missing deformation that was not accounted for (i.e., polyphased faulting and depth-dependent stretching, as previously discussed). The reconstructions done in this study can only restore the faults that are visible on the seismic data. As a result, older faults and sub-parallel faults are not interpreted and therefore cannot aid in the restoration process. It is likely that this under interpretation of faulting and the inability to capture the effects of depth-dependent stretching resulted in the thin pre-rift crustal thicknesses relative to the assumed original thickness of 30 km.
Overall, the average thickness of the pre-rift crust in the East Orphan Basin is very similar to the average thickness of pre-rift crust in the Rockall Basin (Table 5), despite significant crustal thickness variability along lines NL3 and IR1 as observed in Figure 10. By comparison, the pre-rift crustal thickness in Figure 9B appears significantly thicker than along line IR1. This pre-rift similarity between the East Orphan and Rockall basins, combined with the crustal characteristics, the seismic sequences, the structural reconstructions of all the lines in the study along with the new plate reconstructions of [22,23,24], suggest the possibility that the two basins were connected at ~180 Ma (3D model for this time period can be seen in Figure 10).

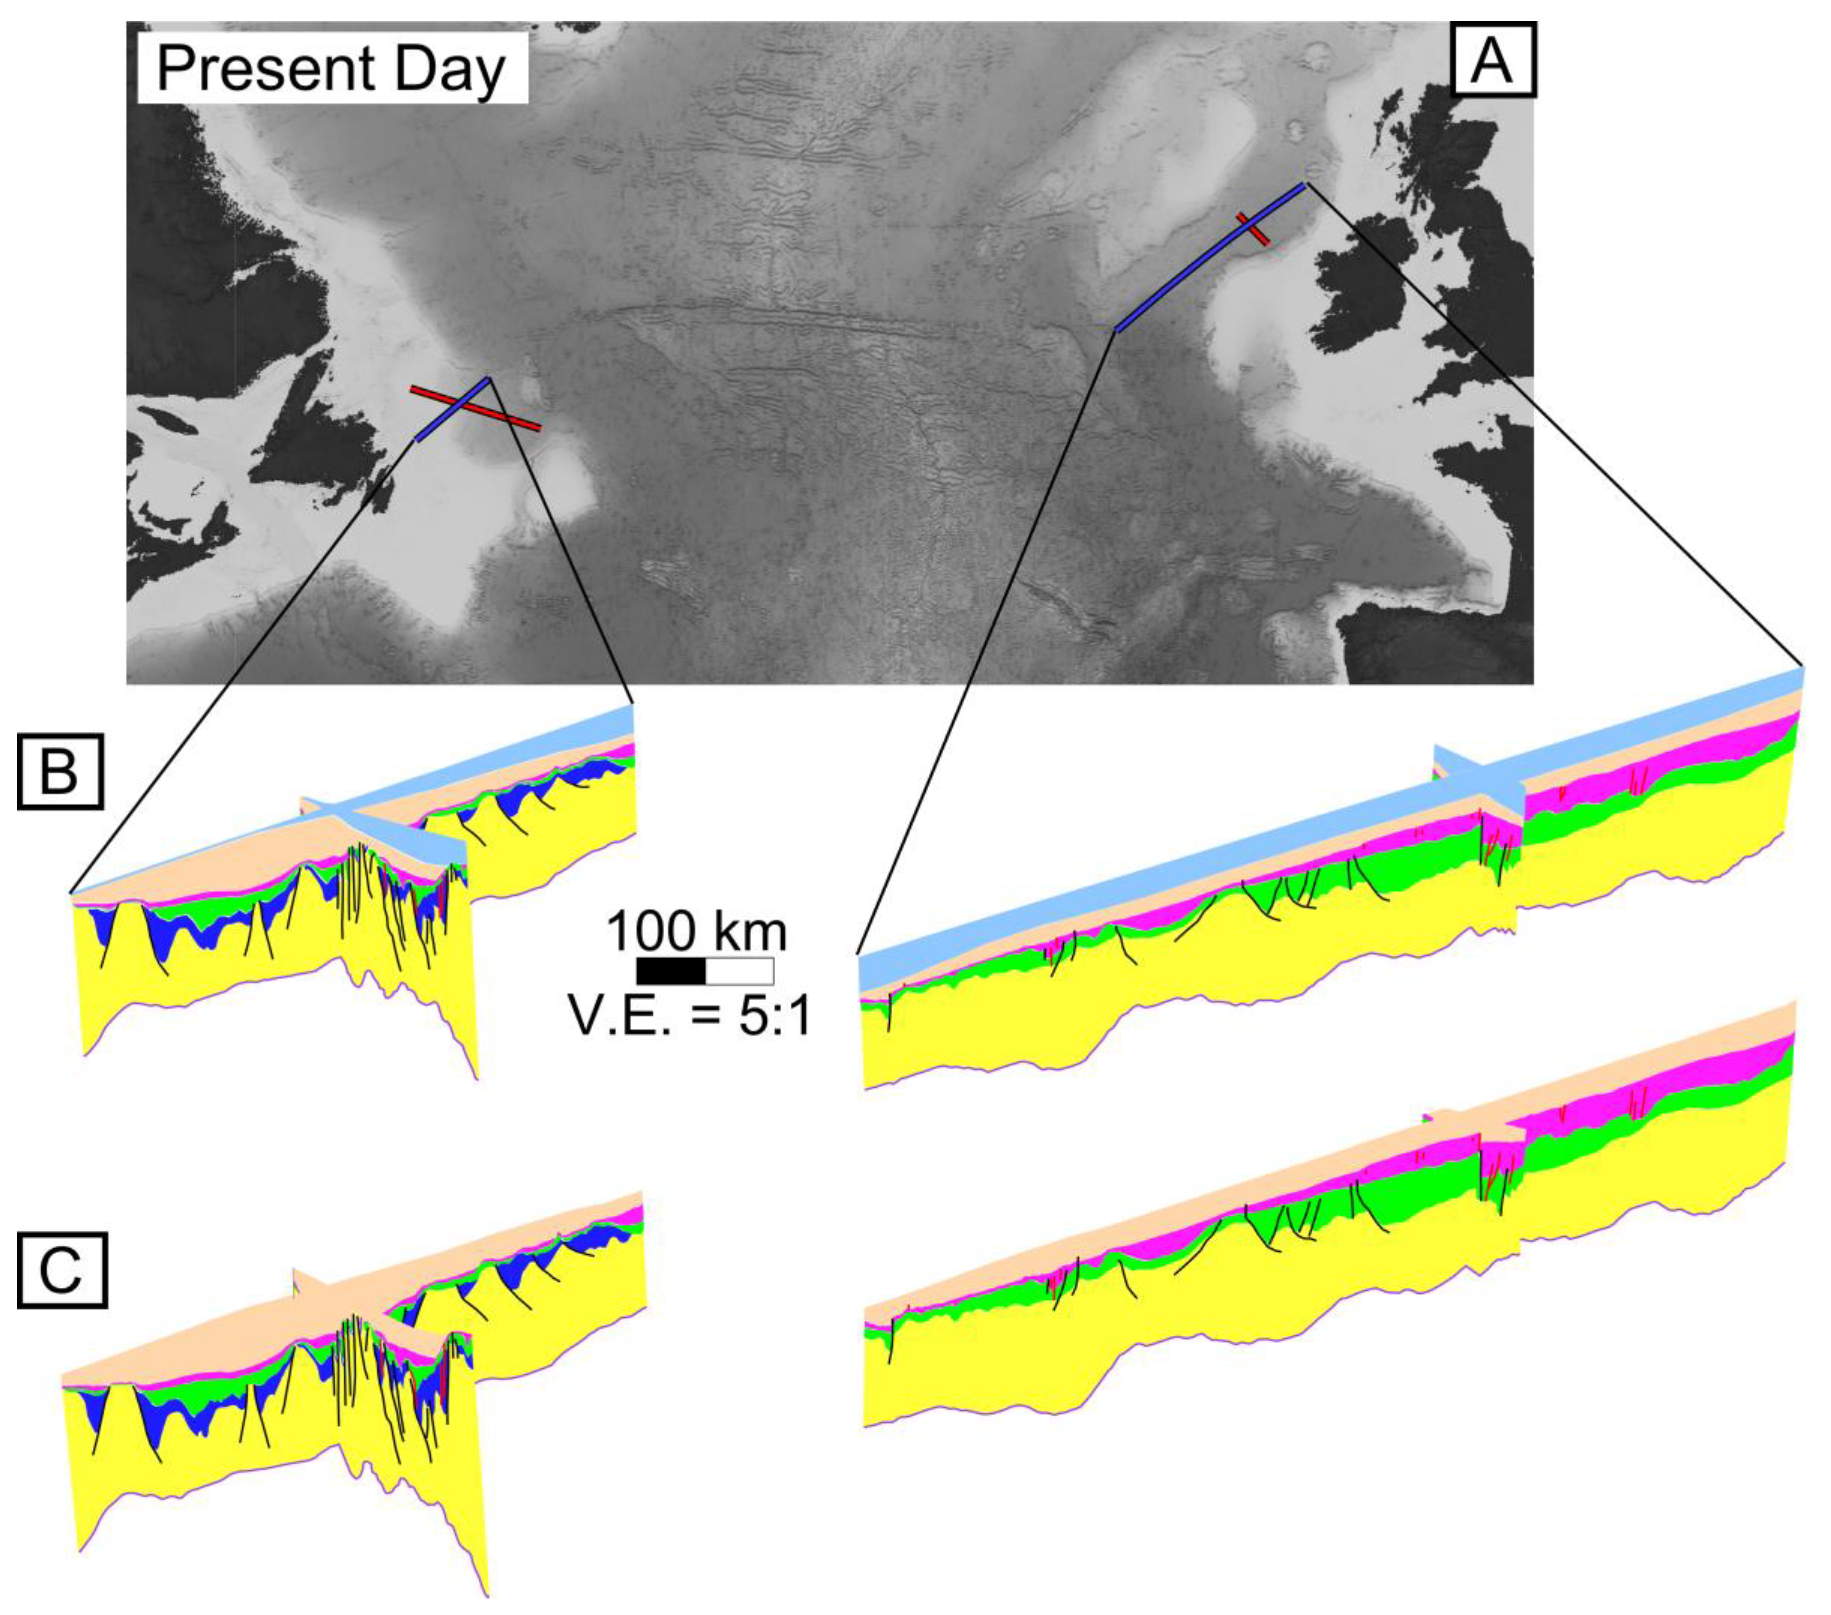
7.5. 3D Geological Models for the Newfoundland-Ireland Conjugate Margins

Based on the 3D geological models generated with the rigid plate reconstruction in GPlates from [46,47], the best match between the individual margin models seems to occur at 145 Ma, at the end of the Jurassic and beginning of the Early Cretaceous (Figure 9A). Meanwhile, the pre-rift reconstruction to 201 Ma at the beginning of the Jurassic produces a poorer match, with the Rockall Basin transect appearing to have experienced more extension than the West Orphan Basin transect (Figure 9B). This pre-rift mismatch from the rigid plate reconstruction can be alleviated by using the deformable plate reconstruction from [24] and connecting the East Orphan Basin to the Rockall Basin at the onset of rifting in the Early Jurassic (Figure 10).

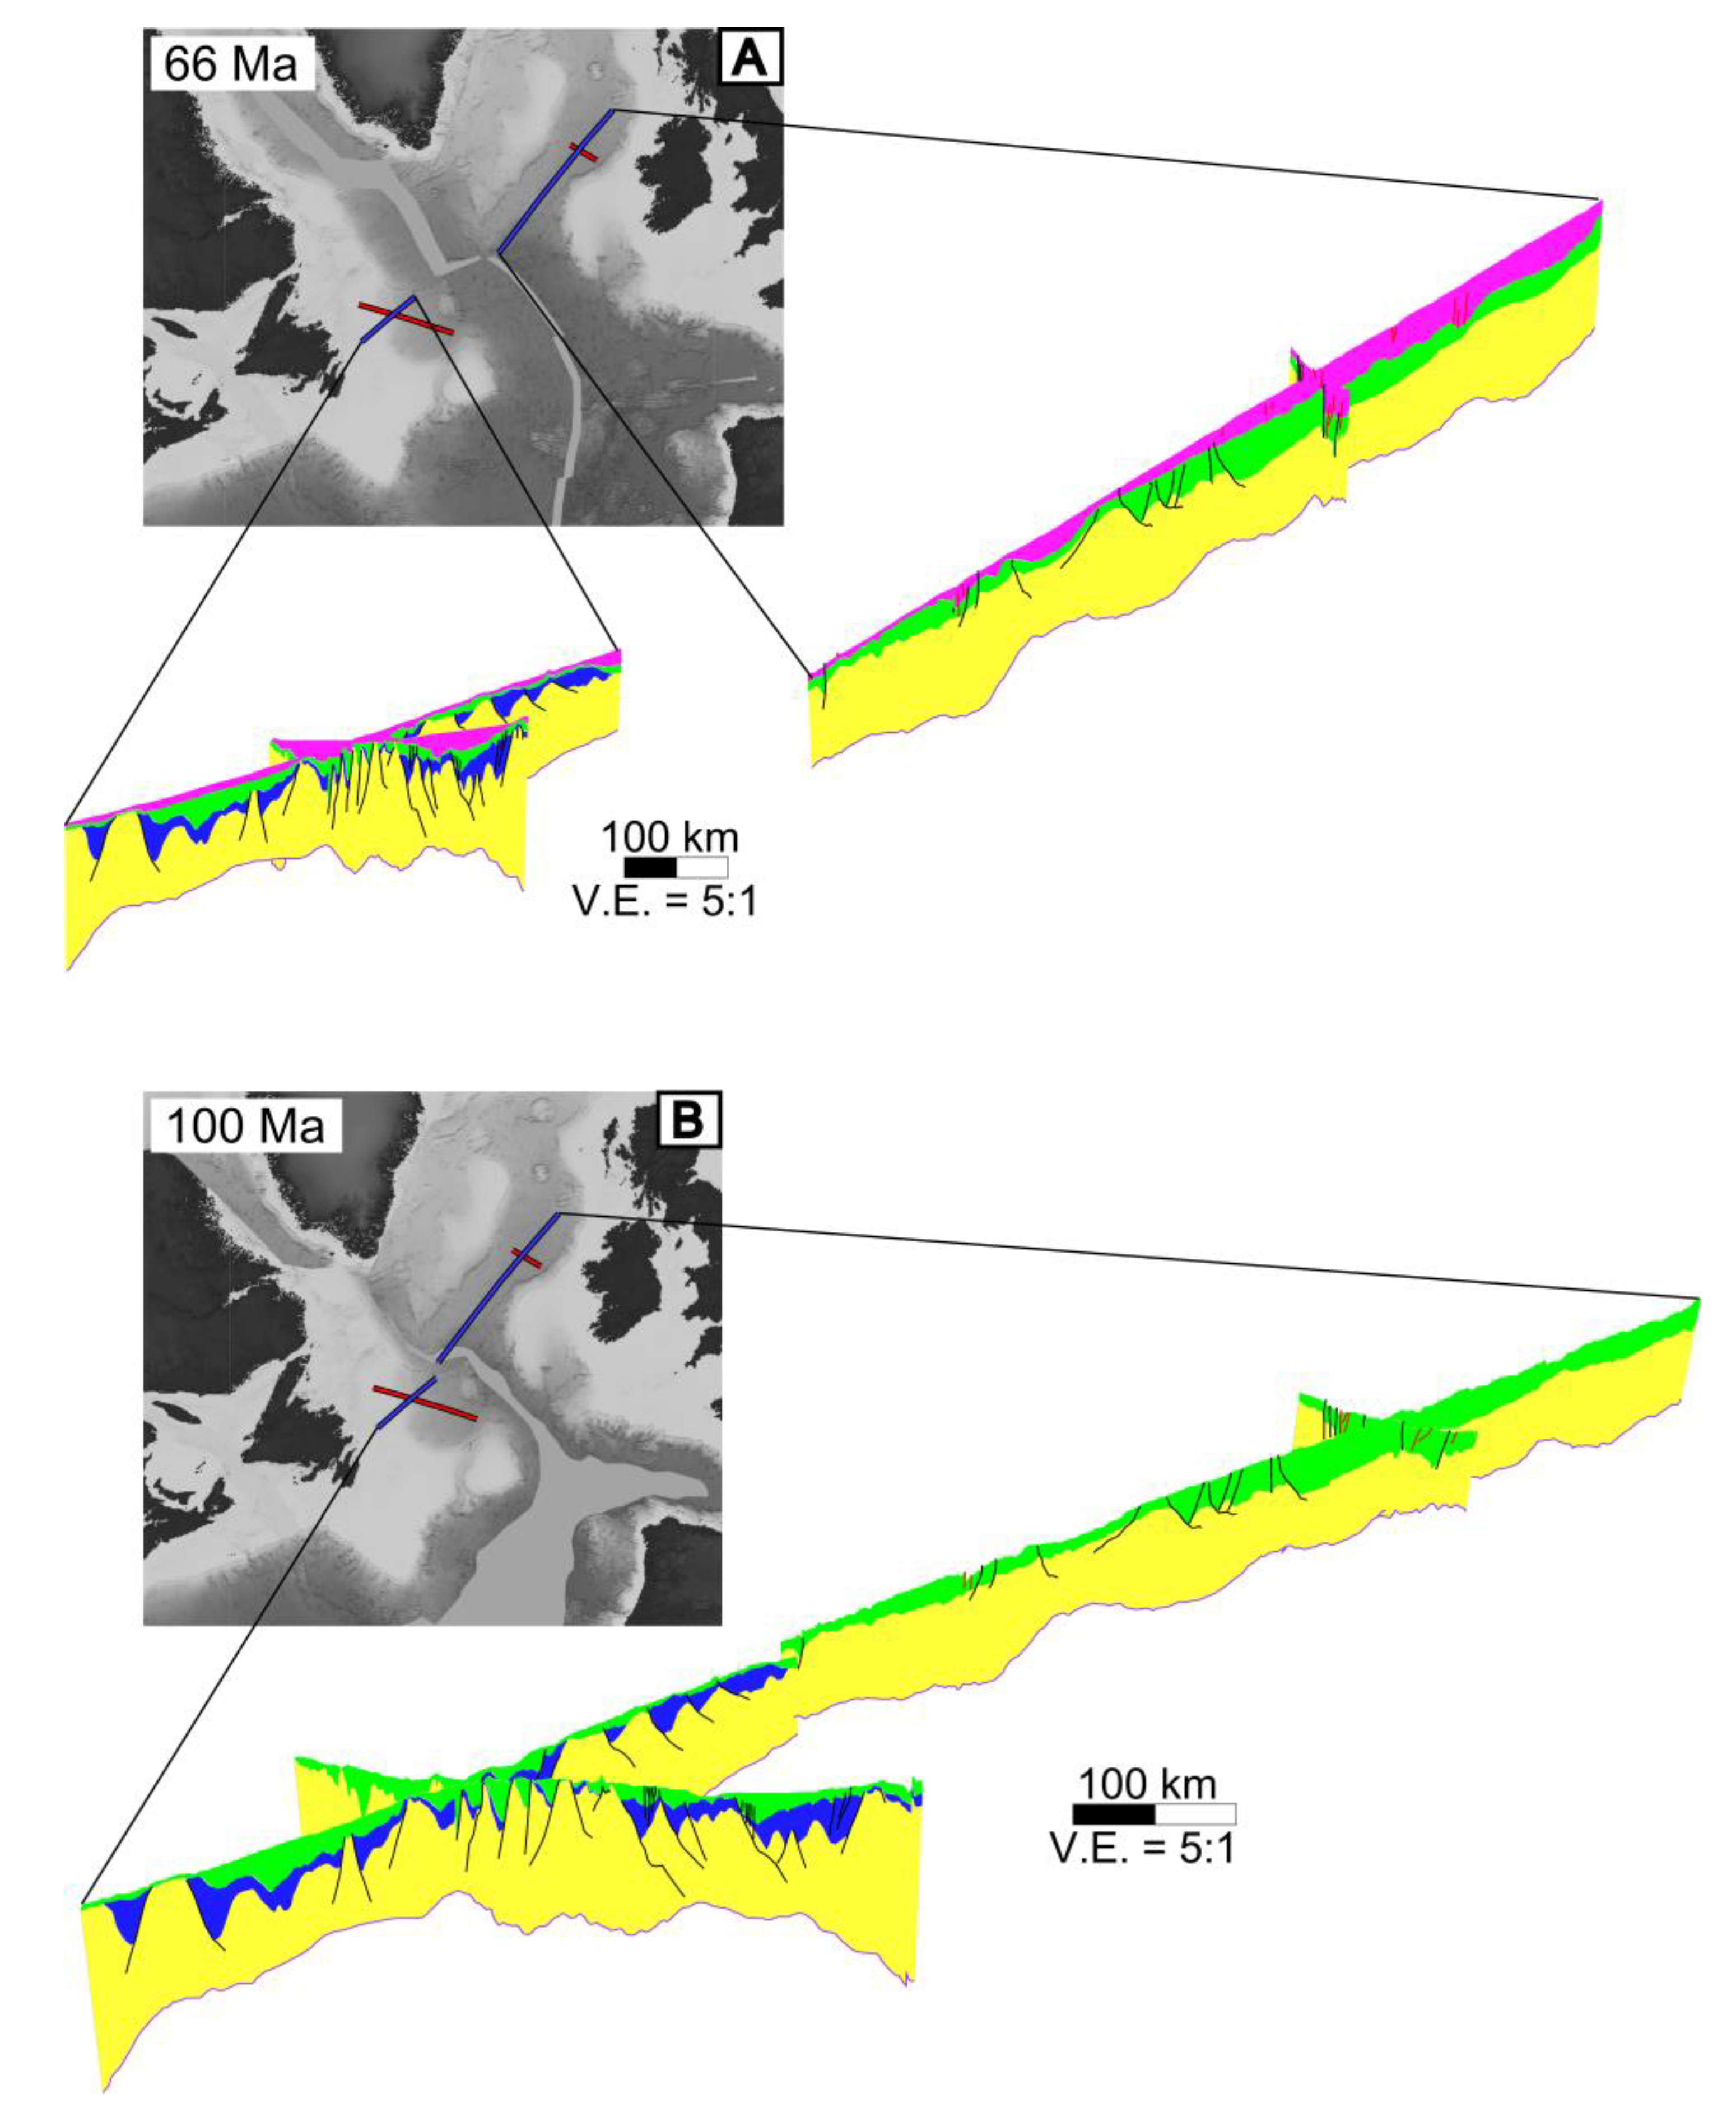
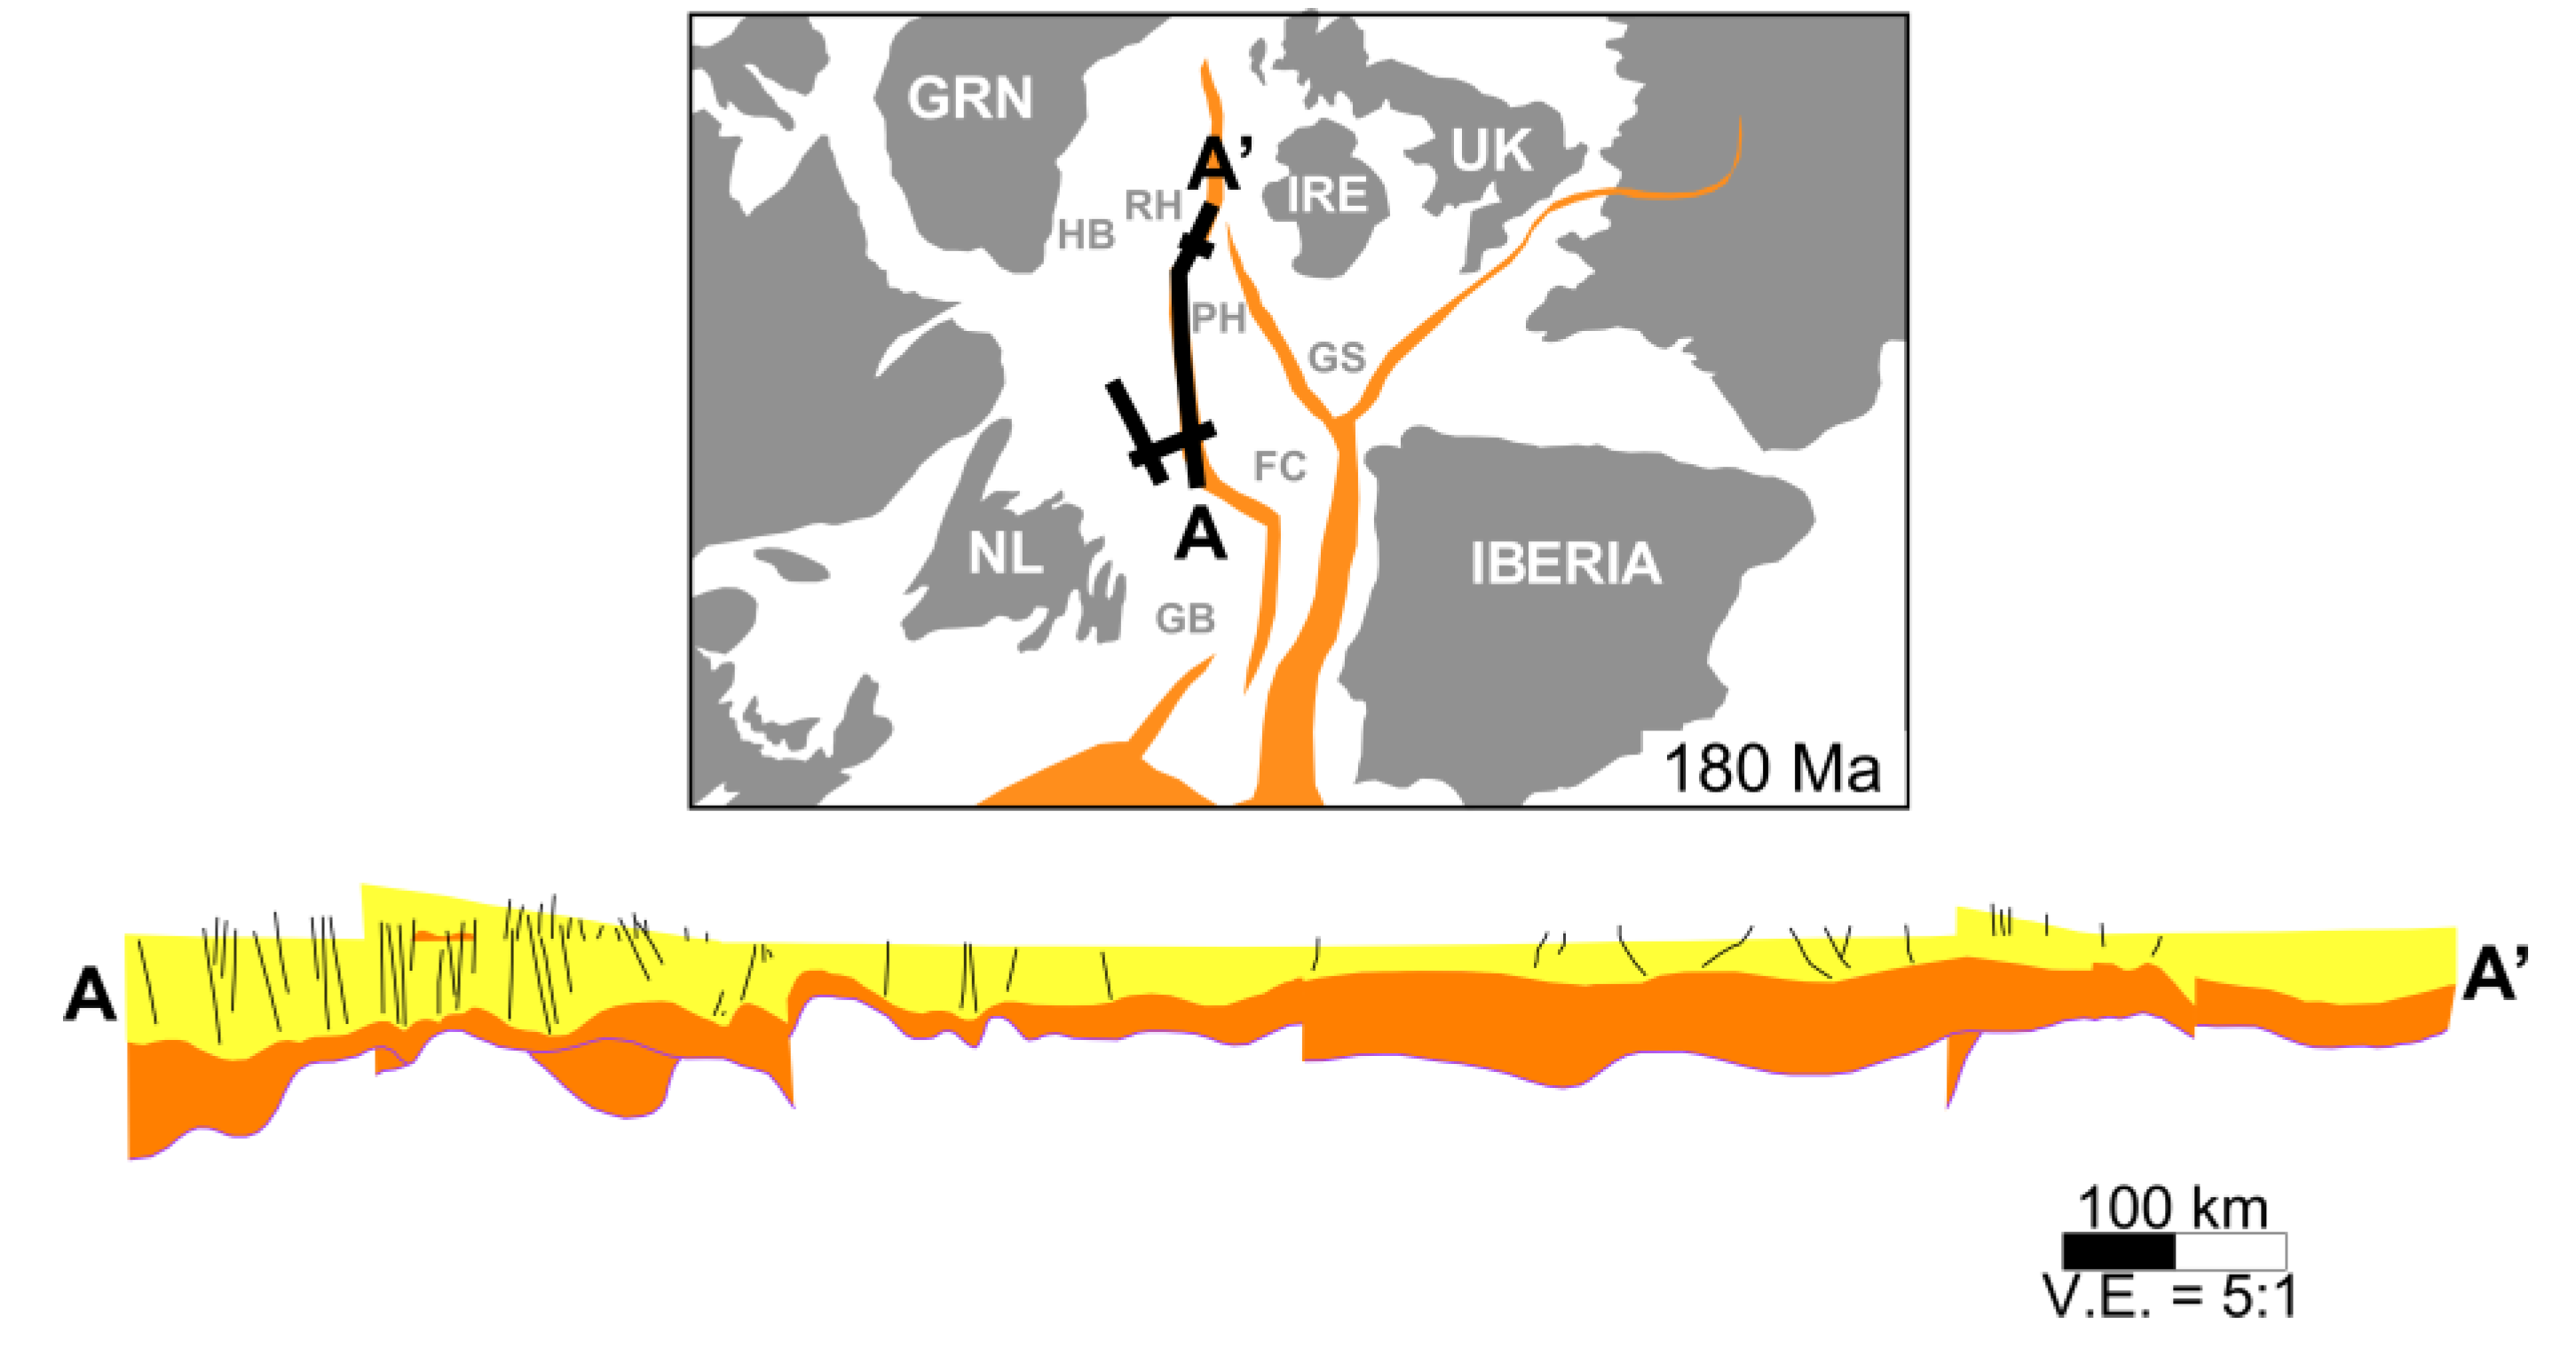
7.6. Evolutionary History of the Newfoundland-Ireland Conjugate Margins

Three scenarios are envisaged to explain the evolutionary history of the Newfoundland- Ireland conjugate margins with respect to the Rockall Basin and the Orphan Basin: 1) the Rockall Basin was never conjugate to, or continuous with, the West Orphan Basin; 2) the Rockall Basin was always conjugate to, and continuous with, the West Orphan Basin; 3) the Rockall Basin was originally continuous with the East Orphan Basin, but ultimately became continuous with the West Orphan Basin.
The rigid plate reconstruction generated by [46,47] shows the possibility that the West Orphan Basin and the Rockall Basin were never conjugate, continuous basins. Their reconstruction places the Rockall Basin further to the north than the West Orphan Basin (Figure 9B). However, the plate model generated by [46,47] does not account for any internal deformation of the plates, which is not geologically realistic. Therefore, we feel this scenario is unlikely.
The evidence suggesting that the Rockall Basin and the West Orphan Basin were always conjugate, continuous basins includes the simple closing of the North Atlantic Ocean and fitting together of the basins [15,17,18,19,20], again without any internal plate deformation, which is unlikely.
The evidence to support scenario three comes from the new plate reconstructions [22,23,24] in association with the calculations of the thicknesses of the post-rift and syn-rift sedimentary packages and the pre-rift crust across the East and West Orphan basins and the Rockall Basin. The thickness of the post-rift sedimentary rock is similar in the East and West Orphan basins and slightly less in the Rockall Basin. This variance is expected due to the fact that the basins evolved independently and were subjected to a variety of factors that would influence sedimentation rates. The thicknesses of the syn-rift sedimentary packages in the West Orphan Basin and the Rockall Basin are similar, compared to a significantly thicker syn-rift package in the East Orphan Basin. The similar syn-rift thicknesses, in combination with the new plate reconstructions, could potentially imply that the West Orphan Basin and the Rockall Basin were possibly connected during early rifting. The pre-rift crustal thicknesses of the East Orphan Basin and the Rockall Basin are strikingly similar to one another, compared to the pre-rift crustal thickness observed in the West Orphan Basin (Table 5). These similarities, which have been derived from geophysical data constraints at depth, coupled with the modern plate reconstructions previously mentioned, support the possibility that the Rockall Basin was continuous with the East Orphan Basin prior to and during the very early stages of rifting.

8. Conclusions

Based on the interpretation of seismic reflection lines acquired on the conjugate Newfoundland and Irish Atlantic margins, we have restored those 2D interpretations back through time and used them to build temporally and spatially evolving 3D geological models, constrained by published plate reconstructions. Through comparison of syn-rift sedimentary layer thicknesses through time, the Rockall Basin appears to bear the greatest similarity to the West Orphan Basin during rifting in terms of sediment accumulation. Meanwhile, based on crustal thicknesses and restored faulting, the Rockall Basin appears to have experienced deformation more akin to the East Orphan Basin. Ultimately, our results support the evolutionary scenario in which the Rockall Basin may have been originally conjugate to, and continuous with, the East Orphan Basin before rifting began in the Jurassic, as proposed by recent plate reconstructions. The East Orphan Basin then potentially began rotating further to the east due to the rotation of Flemish Cap, while the Rockall Basin is assumed to have remained relatively stationary. During the Early Cretaceous, it is proposed that the West Orphan Basin, which began to form in the Late Jurassic, offered a more accessible and weaker rifting zone in closer proximity to the Rockall Basin such that a basin connectivity realignment occurred. The Rockall Basin potentially remained conjugate to, and continuous with, the West Orphan Basin during the remaining rifting episodes during the Early Cretaceous.

Author Contributions

Conceptualization, H.M., J.K.W., L.S. and A.L.P.; methodology, J.K.W.; supervision, J.K.W. and A.L.P.; writing—original draft preparation, H.M., J.K.W., L.S. and A.L.P. All authors have read and agreed to the published version of the manuscript.

Funding

This research was funded by Innovate NL who provided support for H.M. and L.S. through an Ignite Grant to J.K.W.

Acknowledgments

We thank the Department of Communications, Climate Action & Environment of Ireland for generously providing the Rockall Basin and Porcupine Basin 2D seismic data set. Thank you to TGS for providing the Orphan Basin 2D seismic data set. Thank you to the Canadian-Newfoundland and Labrador Offshore Petroleum Board (C-NLOPB) for providing additional geological and geophysical well logs within the Orphan Basin. Innovate NL are thanked for providing funding support for H.M. and L.S. through an Ignite Grant to J.K.W. Finally, we would like to thank the two anonymous reviewers for their constructive comments that helped to improve the paper.

Conflicts of Interest

The authors declare no conflict of interest. The funders had no role in the design of the study; in the collection, analyses, or interpretation of data; in the writing of the manuscript, or in the decision to publish the results.

References

  1. Chian, D.; Reid, I.D.; Jackson, H.R. Crustal structure beneath Orphan Basin and implications for nonvolcanic continental rifting. J. Geophys. Res. Solid Earth 2001, 106, 10923–10940. [Google Scholar] [CrossRef]
  2. Enachescu, M.; Meyer, K.; Hogg, J. East Orphan Basin: Structural setting and evolution with seismic and potential fields arguments. In Proceedings of the CSEG Annual Convention, Calgary, AB, Canada, 10–13 May 2004; p. 4. [Google Scholar]
  3. Lau, K.W.H.; Watremez, L.; Louden, K.E.; Nedimovíć, M.R. Structure of thinned continental crust across the Orphan Basin from a dense wide-angle seismic profile and gravity data. Geophys. J. Int. 2015, 202, 1969–1992. [Google Scholar] [CrossRef]
  4. Shannon, P.M. The development of Irish offshore sedimentary basins. J. Geol. Soc. London. 1991, 148, 181–189. [Google Scholar] [CrossRef]
  5. O’Reilly, B.M.; Hauser, F.; Jacob, A.W.B.; Shannon, P.M. The lithosphere below the Rockall Trough: Wide-angle seismic evidence for extensive serpentinisation. Tectonophysics 1996, 255, 1–23. [Google Scholar] [CrossRef]
  6. Hopper, J.R.; Funck, T.; Tucholke, B.E.; Louden, K.E.; Holbrook, W.S.; Larsen, H.C. A deep seismic investigation of the Flemish Cap margin: Implications for the origin of deep reflectivity and evidence for asymmetric break-up between Newfoundland and Iberia. Geophys. J. Int. 2006, 164, 501–515. [Google Scholar] [CrossRef] [Green Version]
  7. Peace, A.L.; Welford, J.K. “Conjugate margins?”–An oversimplification of the complex southern North Atlantic rift and spreading system? Interpretation 2020, 8, 1–54. [Google Scholar] [CrossRef] [Green Version]
  8. Yang, P.; Welford, J.K.; Peace, A.L.; Hobbs, R. Investigating the Goban Spur rifted continental margin, off shore Ireland, through integration of new seismic reflection and potential field data. Tectonophysics 2020, 777, 228364. [Google Scholar] [CrossRef]
  9. Tucholke, B.E.; Austin, J.A., Jr.; Uchupi, E. Crustal Structure and Rift-Drift Evolution of the Newfoundland Basin: Chapter 16: North American Margins. In Extensional Tectonics and Stratigraphy of the North Atlantic Margins: Introduction; Tankard, A.J., Balkwill, H.R., Eds.; AAPG: Tulsa, Ok, USA, 1989. [Google Scholar]
  10. Lundin, E.R.; Doré, A.G. Hyperextension, serpentinization, and weakening: A new paradigm for rifted margin compressional deformation. Geology 2011, 39, 347–350. [Google Scholar] [CrossRef]
  11. Watt, W. The coast-parallel dike swarm of southwest Greenland in relation to the opening of the Labrador Sea. Can. J. Earth Sci. 1969, 6, 1320–1321. [Google Scholar] [CrossRef]
  12. Chian, D.; Keen, C.; Reid, I.; Louden, K.E. Evolution of nonvolcanic rifted margins: New results from the conjugate margins of the Labrador Sea. Geology 1995, 23, 589–592. [Google Scholar] [CrossRef]
  13. Larsen, L.M.; Heaman, L.M.; Creaser, R.A.; Duncan, R.A.; Frei, R.; Hutchison, M. Tectonomagmatic events during stretching and basin formation in the Labrador Sea and Davis Strait: Evidence from age and composition of Mesozoic to Palaeogene dyke swarms in West Greeland. J. Geol. Soc. Lond. 2009, 166, 999–1012. [Google Scholar] [CrossRef]
  14. Naylor, D.; Shannon, P.M. The structural framework of the Irish Atlantic Margin. In Proceedings of the Petroleum Geology: North-West Europe and Global Perspectives, Proceedings of the 6th Petroleum Geology Conference, London, UK, 6–9 October 2003; pp. 1009–1021. [Google Scholar]
  15. Welford, J.K.; Shannon, P.M.; O’Reilly, B.M.; Hall, J.; Reilly, B.M.O.; Hall, J. Comparison of lithosphere structure across the Orphan Basin – Flemish Cap and Irish Atlantic conjugate continental margins from constrained 3D gravity inversions. J. Geol. Soc. Lond. 2012, 169, 405–420. [Google Scholar] [CrossRef]
  16. Srivastava, S.P.; Roest, W.R.; Kovacs, L.C.; Oakey, G.; Lévesque, S.; Verhoef, J.; Macnab, R. Motion of Iberia since the Late Jurassic: Results from detailed aeromagnetic measurements in the Newfoundland Basin. Tectonophysics 1990, 184, 229–260. [Google Scholar] [CrossRef]
  17. Srivastava, S.P.; Verhoef, J. Evolution of Mesozoic sedimentary basins around the North Central Atlantic: A preliminary plate kinematic solution. Geol. Soc. Lond. Spec. Publ. 1992, 62, 397–420. [Google Scholar] [CrossRef]
  18. Knott, S.D.; Burchell, M.T.; Jolley, E.J.; Fraser, A.J. Mesozoic to Cenozoic Plate Reconstructions of the North Atlantic and Hydrocarbon Plays of the Atlantic Margins; Geological Society, London, Petroleum Geology Conference series; Geological Society of London: London, UK, 1993; Volume 4, pp. 953–974. [Google Scholar]
  19. Louden, K.E.; Tucholke, B.E.; Oakey, G.N. Regional anomalies of sediment thickness, basement depth and isostatic crustal thickness in the North Atlantic Ocean. Earth Planet. Sci. Lett. 2004, 224, 193–211. [Google Scholar] [CrossRef]
  20. Enachescu, M.E. Structural Setting and Petroleum Potential of the Orphan Basin, offshore Newfoundland and Labrador. Can. Soc. Explor. Geophys. Rec. 2006, 31, 5–13. [Google Scholar]
  21. Gouiza, M.; Hall, J.; Welford, J.K. Tectono-stratigraphic evolution and crustal architecture of the Orphan Basin during North Atlantic rifting. Int. J. Earth Sci. 2017, 106, 917–937. [Google Scholar] [CrossRef] [Green Version]
  22. Nirrengarten, M.; Manatschal, G.; Tugend, J.; Kusznir, N.; Sauter, D. Kinematic evolution of the southern North Atlantic: Implications for the formation of hyper-extended rift systems. Tectonics 2018, 37, 89–118. [Google Scholar] [CrossRef] [Green Version]
  23. Peace, A.L.; Welford, J.K.; Ball, P.J.; Nirrengarten, M. Deformable plate tectonic models of the southern North Atlantic. J. Geodyn. 2019, 128, 11–37. [Google Scholar] [CrossRef]
  24. Skogseid, J. The Orphan Basin—A key to understanding the kinematic linkage between North and NE Atlantic Mesozoic rifting. In Proceedings of the II Central & North Atlantic Conjugate Margins Conference, Lisbon, Portugal, 29 September–1 October 2010; Volume II, pp. 13–23. [Google Scholar]
  25. Sandoval, L.; Welford, J.K.; MacMahon, H.; Peace, A.L. Determining continuous basins across conjugate margins: The East Orphan, Porcupine, and Galicia Interior basins of the southern North Atlantic Ocean. Mar. Pet. Geol. 2019, 110, 138–161. [Google Scholar] [CrossRef]
  26. Morewood, N.C.C.; Mackenzie, G.D.D.; Shannon, P.M.M.; Reilly, B.M.O.; O’Reilly, B.M.; Readman, P.W.; Makris, J. The crustal structure and regional development of the Irish Atlantic margin region. In Proceedings of the Petroleum Geology: North-West Europeand Global Perspectives—Proceedings of the 6th Petroleum Geology Conference, London, UK, 6–9 October 2003; Volume 6, pp. 1023–1033. [Google Scholar]
  27. Keen, C.E.; Barrett, D.L. Thinned and subsided continental crust on the rifted margin of eastern Canada: Crustal structure, thermal evolution and subsidence history. Geophys. J. Int. 1981, 65, 443–465. [Google Scholar] [CrossRef] [Green Version]
  28. Musgrove, F.W.; Mitchener, B. Analysis of the pre-Tertiary rifting history of the Rockall Trough. Pet. Geosci. 1996, 2, 353–360. [Google Scholar] [CrossRef]
  29. Shannon, P.M.; Jacob, A.W.B.; O’Reilly, B.M.; Hauser, F.; Readman, P.W.; Makris, J. Structural setting, geological development and basin modelling in the Rockall Trough. Pet. Geol. Northwest Eur. Proc. 5th Conf. Pet. Geol. Northwest Eur. 1999, 5, 421–431. [Google Scholar] [CrossRef]
  30. Peace, A.; McCaffrey, K.; Imber, J.; van Hunen, J.; Hobbs, R.W.; Wilson, R. The role of pre-existing structures during continental breakup and transform system development in the Davis Strait, offshore West Greenland. Basin Res. 2018, 30, 373–394. [Google Scholar] [CrossRef] [Green Version]
  31. Foulger, G.R.; Doré, T.; Emeleus, C.H.; Franke, D.; Geoffroy, L.; Gernigon, L.; Hey, R.; Holdsworth, R.E.; Hole, M.; Höskuldsson, Á.; et al. The Iceland Microcontinent and a continental Greenland-Iceland-Faroe Ridge. Earth Sci. Rev. 2019, 102926. [Google Scholar] [CrossRef]
  32. Foulger, G.R.; Schiffer, C.; Peace, A.L. A new paradigm for the North Atlantic Realm. Earth Sci. Rev. 2020, 103038, In press. [Google Scholar] [CrossRef]
  33. Schiffer, C.; Doré, A.G.; Foulger, G.R.; Franke, D.; Geoffroy, L.; Gernigon, L.; Holdsworth, R.E.; Kusznir, N.; Lundin, E.; McCaffrey, K.J.; et al. Structural inheritance in the North Atlantic. Earth Sci. Rev. 2019, 102975. [Google Scholar] [CrossRef]
  34. Peace, A.; Phethean, J.; Franke, D.; Foulger, G.R.; Schiffer, C.; Welford, J.K.; McHone, G.; Rocchi, S.; Schnabel, M.; Doré, A. A review of Pangaea dispersal and Large Igneous Provinces – In search of a causative mechanism. Earth Sci. Rev. 2019, 196, 102865. [Google Scholar] [CrossRef]
  35. Doré, A.G.; Lundin, E.R.; Jensen, L.N.; Birkeland, Ø.; Eliassen, P.E.; Fichler, C. Principal tectonic events in the evolution of the northwest European Atlantic margin. Pet. Geol. Northwest Eur. Proc. 5th Conf. 1999, 5, 41–61. [Google Scholar] [CrossRef]
  36. Hitchen, K. The geology of the UK Hatton-Rockall margin. Mar. Pet. Geol. 2004, 21, 993–1012. [Google Scholar] [CrossRef]
  37. Morewood, N.C.; Shannon, P.M.; Mackenzie, G.D. Seismic stratigraphy of the southern Rockall Basin: A comparison between wide-angle seismic and normal incidence reflection data. Mar. Pet. Geol. 2004, 21, 1149–1163. [Google Scholar] [CrossRef]
  38. Magee, C.; Jackson, C.A.L.; Schofield, N. Diachronous sub-volcanic intrusion along deep-water margins: Insights from the Irish Rockall Basin. Basin Res. 2014, 26, 85–105. [Google Scholar] [CrossRef]
  39. Stoker, M.S.; Stewart, M.A.; Shannon, P.M.; Bjerager, M.; Nielsen, T.; Blischke, B.O.; Hjelstuen, B.O.; Gaina, C.; McDermott, K.; Olavsdottir, J. An overview of the Upper Palaeozoic-Mesozoic stratigraphy of the NE Atlantic region. Geol. Soc. Lond. Spec. Publ. 2016, 447, 11–68. [Google Scholar] [CrossRef] [Green Version]
  40. Gradstein, F.M.; Ogg, J.G.; Schmitz, M.D.; Ogg, G.M. The Geological Time Scale; Elsevier: Amsterdam, The Netherlands, 2012. [Google Scholar]
  41. Williams, H. Miogeoclines and suspect terranes of the Caledonian–Appalachian Orogen: Tectonic patterns in the North Atlantic region. Can. J. Earth Sci. 1984, 21, 887–901. [Google Scholar] [CrossRef]
  42. Williams, H. Geology of the Appalachian—Caledonian Orogen in Canada and Greenland; Geological Society of America: Boulder, CO, USA, 1995; ISBN 0813754518. [Google Scholar]
  43. Gouiza, M.; Hall, J.; Bertotti, G. Rifting and pre-rift lithosphere variability in the Orphan Basin, Newfoundland margin, Eastern Canada. Basin Res. 2015, 27, 367–386. [Google Scholar] [CrossRef]
  44. Chian, D.; Louden, K.E.; Reid, I. Crustal structure of the Labrador Sea conjugate margin and implications for the formation of nonvolcanic continental margins. J. Geophys. Res. 1995, 100, 24239. [Google Scholar] [CrossRef] [Green Version]
  45. Peace, A.L.; McCaffrey, K.J.W.; Imber, J.; Phethean, J.; Nowell, G.; Gerdes, K.; Dempsey, E. An evaluation of Mesozoic rift-related magmatism on the margins of the Labrador Sea: Implications for rifting and passive margin asymmetry. Geosphere 2016, 12, 1701–1724. [Google Scholar] [CrossRef] [Green Version]
  46. Matthews, K.J.; Maloney, K.T.; Zahirovic, S.; Williams, S.E.; Seton, M.; Müller, R.D. Global plate boundary evolution and kinematics since the late Paleozoic. Glob. Planet. Chang. 2016, 146, 226–250. [Google Scholar] [CrossRef]
  47. Müller, R.D.; Seton, M.; Zahirovic, S.; Williams, S.E.; Matthews, K.J.; Wright, N.M.; Shephard, G.E.; Maloney, K.T.; Barnett-Moore, N.; Hosseinpour, M.; et al. Ocean Basin Evolution and Global-Scale Plate Reorganization Events Since Pangea Breakup. Annu. Rev. Earth Planet. Sci. 2016, 44, 107–138. [Google Scholar] [CrossRef]
  48. Archer, S.G.; Bergman, S.C.; Iliffe, J.; Murphy, C.M.; Thornton, M. Palaeogene igneous rocks reveal new insights into the geodynamic evolution and petroleum potential of the Rockall Trough, NE Atlantic Margin. Basin Res. 2005, 17, 171–201. [Google Scholar] [CrossRef]
  49. O’Reilly, B.M.; Hauser, F.; Ravaut, C.; Shannon, P.M.; Readman, P.W. Crustal thinning, mantle exhumation and serpentinization in the Porcupine Basin, offshore Ireland: Evidence from wide-angle seismic data. J. Geol. Soc. Lond. 2006, 163, 775–787. [Google Scholar] [CrossRef]
  50. Sclater, J.G.; Christie, P.A.F. Continental stretching: An explanation of the post-Mid-Cretaceous subsidence of the Central North Sea Basin. J. Geophys. Res. Solid Earth 1980, 85, 3711–3739. [Google Scholar] [CrossRef]
  51. Mackenzie, G.D.; Shannon, P.M.; Jacob, A.W.B.; Morewood, N.C.; Makris, J.; Gaye, M.; Egloff, F. The velocity structure of the sediments in the southern Rockall Basin: Results from new wide-angle seismic modelling. Mar. Pet. Geol. 2002, 19, 989–1003. [Google Scholar] [CrossRef]
  52. Fossen, H. Structural Geology; Cambridge University Press: Cambridge, UK, 2016; ISBN 1316472957. [Google Scholar]
  53. Pérez-Gussinyé, M.; Reston, T.J. Rheological evolution during extension at nonvolcanic rifted margins: Onset of serpentinization and development of detachments leading to continental breakup. J. Geophys. Res. Solid Earth 2001, 106, 3961–3975. [Google Scholar] [CrossRef]
  54. Boyden, J.A.; Müller, R.D.; Gurnis, M.; Torsvik, T.H.; Clark, J.A.; Turner, M.; Ivey-Law, H.; Watson, R.J.; Cannon, J.S. Next-generation plate-tectonic reconstructions using GPlates. In Geoinformatics: Cyberinfrastructure for the Solid Earth Science; Keller, G.R., Baru, C., Eds.; Cambridge University Press: Cambridge, UK, 2011; pp. 95–114. [Google Scholar]
  55. Shannon, P.M.; Moore, J.G.; Jacob, A.W.B.; Makris, J. Cretaceous and Tertiary basin development west of Ireland; Geological Society, London, Petroleum Geology Conference series; Geological Society of London: London, UK, 1993; Volume 4, pp. 1057–1066. [Google Scholar]
  56. Shannon, P.M.; Murphy, N.; Ireland. Department of Marine and Natural Resources. Irish Rockall Basin region-a standard structural nomenclature system; Ireland. Department of the Marine and Natural Resources, 1999; ISBN 0707662893. [Google Scholar]
  57. Stoker, M.S.; Van Weering, T.C.E.; Svaerdborg, T. A mid-to late Cenozoic tectonostratigraphic framework for the Rockall Trough. Geol. Soc. Lond. Spec. Publ. 2001, 188, 411–438. [Google Scholar] [CrossRef]
  58. McDonnell, A.; Shannon, P.M. Comparative Tertiary stratigraphic evolution of the Porcupine and Rockall basins. Geol. Soc. London, Spec. Publ. 2001, 188, 323–344. [Google Scholar] [CrossRef]
  59. Driscoll, N.W.; Karner, G.D. Lower crustal extension across the Northern Carnarvon basin, Australia: Evidence for an eastward dipping detachment. J. Geophys. Res. Solid Earth 1998, 103, 4975–4991. [Google Scholar] [CrossRef]
  60. Sibuet, J.-C. New constraints on the formation of the non-volcanic continental Galicia–Flemish Cap conjugate margins. J. Geol. Soc. Lond. 1992, 149, 829–840. [Google Scholar] [CrossRef]
  61. Davis, M.; Kusznir, N.J. Depth-dependent lithospheric stretching at rifted continental margins. Proc. NSF Rift. Margins Theor. Inst. 2004, 136, 92–137. [Google Scholar]
  62. Reston, T.J. Polyphase faulting during the development of the west Galicia rifted margin. Earth Planet. Sci. Lett. 2005, 237, 561–576. [Google Scholar] [CrossRef]
  63. Kusznir, N.J.; Hunsdale, R.; Roberts, A.M.; Team, I. Norwegian margin depth-dependent stretching. In Proceedings of the Petroleum Geology: North-West Europe and Global Perspectives-Proceedings of the 6th Petroleum Geology Conference, London, UK, 6–9 October 2003; Dore, A.G., Vining, B.A., Eds.; pp. 767–783. [Google Scholar]
  64. Reston, T. Extension discrepancy of North Atlantic nonvolcanic rifted margins: Depth-dependent stretching or unrecognized faulting? Geology 2007, 35, 367–370. [Google Scholar] [CrossRef]
Figure 1. (A) Bathymetry map of the North Atlantic Ocean subdivided by inferred basement affinity of continental crust [15]. (B) Enlarged bathymetry map with sedimentary basins (yellow) of the region surrounding the highlighted Orphan Basin (OB), with the locations of seismic lines NL1, NL2, and NL3, and nearby well tops (circles). The primary seismic line NL1 is shown in blue, the secondary seismic line NL2 is shown in red and NL3 is shown in orange. (C) Enlarged bathymetry map with sedimentary basins (yellow) of the region surrounding the highlighted Rockall Basin (RB), with the locations of seismic lines IR1 and IR2, and nearby well tops (circles). The primary seismic line IR1 is shown in blue and the secondary seismic line IR2 is shown in red. Magnetic Chron A34 from [16]. The enlarged circle in (B) corresponds to the well used to support the seismic interpretation. Sedimentary basin outlines for the offshore Newfoundland and Labrador margin from the Department of Natural Resources, Government of Newfoundland Labrador, for the Irish margin from the Department of Communications, Climate Action & Environment of Ireland, and for everywhere else from CGG’s Robertson Basins & Plays. Abbreviations: EOB, East Orphan Basin; FC, Flemish Cap; FPB, Flemish Pass Basin; FZ, Fracture Zone; GB, Grand Banks; GS, Goban Spur; GRN, Greenland; HB, Hatton Basin; HBk, Hatton Bank; JDA, Jeanne d’Arc Basin; IRE, Ireland; NL, Newfoundland; OK, Orphan Knoll; PB, Porcupine Basin; PH, Porcupine High; RH, Rockall High; WOB, West Orphan Basin.
Geosciences 10 00178 g001
Figure 2. Simplified lithostratigraphic chart from the Permian to the Cretaceous for the Orphan Basin and the Rockall Basin. Orphan Basin chart adapted from [25] and Rockall Basin chart adapted from [39]. Timescale based on [40].
Geosciences 10 00178 g002
Figure 3. Examples from both the Rockall and West Orphan basins of individual lithological sequences defined on the basis of seismic character along lines NL1 (middle column) and IR1 (right column). Note: lack of division of the Cenozoic sequence as well as the lack of Jurassic sedimentary layers interpreted in the Rockall Basin.
Geosciences 10 00178 g003
Figure 4. (A) Uninterpreted seismic line NL1 in the Orphan Basin (blue line in Figure 1B). (B) Interpreted seismic line NL1. Seismic horizons: basement, yellow; top of the Jurassic, dark blue; top of the Lower Cretaceous, green; top of the Upper Cretaceous, pink; top of the Cenozoic, orange. The solid black lines indicate faults. Location of the highlighted well (large circle in Figure 1B) is shown by dotted black line topped by the circle in panel B. The dashed black line indicates the intersection with NL2.
Geosciences 10 00178 g004
Figure 5. (A) Uninterpreted seismic line IR1 in the Rockall Basin (blue line in Figure 1C). The dotted black line depicts the intersection of magnetic Chron A34 with seismic line IR1. (B) Interpreted seismic line IR1. Seismic horizons: basement, yellow; top of Lower Cretaceous, green; top of Upper Cretaceous, pink; top of Cenozoic, orange. Solid black lines represent primary faults and solid red lines represent secondary faults. The dashed black line indicates the intersection with IR2. (C) Enlarged section of IR1 showing sills that obscure deeper reflections.
Geosciences 10 00178 g005
Figure 6. Left column shows the reconstruction of seismic line NL1 in the West Orphan Basin (blue line in Figure 1B). Right column shows the reconstruction of seismic line IR1 in the Rockall Basin (blue line in Figure 1C). (A) Seismic lines NL1 and IR1 in the time domain. (B) Seismic lines NL1 and IR1 in the depth domain. (C) Seismic lines NL1 and IR1 showing the results of the Cenozoic sedimentary layer decompaction and restoration of thermal subsidence. (D) Seismic lines NL1 and IR1 showing the results of the Upper Cretaceous sedimentary layer decompaction and restoration of thermal subsidence. (E) Seismic lines NL1 and IR1 showing the results of the Lower Cretaceous sedimentary layer decompaction. (F) Seismic line NL1 showing the results of the Jurassic sedimentary layer decompaction, fault restoration and unfolding. (G) Seismic lines NL1 and IR1 showing the final reconstruction, after the rebound of the crust (which is bounded on the top by the interpreted acoustic basement), fault restoration and unfolding. Purple line represents the Moho proxy from [15].
Geosciences 10 00178 g006
Figure 7. (A) Model in GPlates of the Newfoundland-Ireland conjugate margins, present day, with background image showing bathymetry. (B) 3D model of seismic lines NL1 and NL2 (left) in the Orphan Basin and 3D model of seismic lines IR1 and IR2 (right) in the Rockall Basin, present day. (C) 3D model of seismic lines NL1 and NL2 (left) in the Orphan Basin and 3D model of seismic lines IR1 and IR2 (right) in the Rockall Basin with the Cenozoic sedimentary sequence decompacted. Black lines represent primary faults and red lines represent secondary faults. For meaning of layer colours, see legend in Figure 6.
Geosciences 10 00178 g007
Figure 8. (A) Model in GPlates of the Newfoundland-Ireland conjugate margins with modern bathymetry reconstructed to 66 Ma with 3D model of seismic lines NL1 and NL2 (left) in the Orphan Basin and 3D model of seismic lines IR1 and IR2 (right) in the Rockall Basin with the Upper Cretaceous sedimentary sequence decompacted and thermal subsidence restored. (B) Model in GPlates of the Newfoundland-Ireland conjugate margins with modern bathymetry reconstructed to 100 Ma with 3D model of seismic lines NL1 and NL2 (left) in the Orphan Basin and of seismic lines IR1 and IR2 (right) in the Rockall Basin with the Lower Cretaceous sequence decompacted and thermal subsidence restored. Black lines represent primary faults and red lines represent secondary faults. For meaning of layer colours, see legend in Figure 6.
Geosciences 10 00178 g008
Figure 9. (A) Model in GPlates of the Newfoundland-Ireland conjugate margins with modern bathymetry reconstructed to 145 Ma with 3D model of seismic lines NL1 and NL2 (left) in the Orphan Basin and of seismic lines IR1 and IR2 (right) in the Rockall Basin with the Jurassic sedimentary sequence decompacted, restored and unfolded for the Newfoundland margin. (B) Model in GPlates of the Newfoundland-Ireland conjugate margins with modern bathymetry reconstructed to 201 Ma with 3D model of seismic lines NL1 and NL2 (left) in the Orphan Basin and of seismic lines IR1 and IR2 (right) in the Rockall Basin with the upper and lower crustal sequences rebounded, restored and unfolded. Black lines represent primary faults and red lines represent secondary faults. For meaning of layer colours, see legend in Figure 6.
Geosciences 10 00178 g009
Figure 10. Simplified map of reconstruction from [24] at 180 Ma showing modern landmasses (gray), rifts (orange), and locations of the investigated seismic lines (thick black lines) above a 3D reconstruction from NL3 to IR1 (A to A’ on the map). Note that the locations of the seismic lines on the map are an approximation, as the [24] model is proprietary and not available for academic use. Note also that the 2D geological model for NL1 is not included in this plot. Black lines represent primary faults and red lines represent secondary faults. For meaning of layer colours, see legend in Figure 6.
Geosciences 10 00178 g010
Figure 11. Simplified map of reconstruction from [24] at 140 Ma showing modern landmasses (gray), rifts (orange), and locations of the investigated seismic lines (thick black lines) above a 3D reconstruction with profile A to A’ connecting seismic lines NL1 and IR1 and profile B to B’ representing seismic line NL3. Black lines represent primary faults and red lines represent secondary faults. For meaning of layer colours, see legend in Figure 6.
Geosciences 10 00178 g011
Figure 12. Simplified map of reconstruction from [24] at 120 Ma showing modern landmasses (gray), rifts (orange), and locations of the investigated seismic lines (thick black lines) above a 3D reconstruction with profile A to A’ connecting seismic lines NL1 and IR1 and profile B to B’ representing seismic line NL3. Black lines represent primary faults and red lines represent secondary faults. For meaning of layer colours, see legend in Figure 6.
Geosciences 10 00178 g012
Table 1. Density parameters for each layer for both the Orphan and Rockall basins derived from seismic interval velocities [21]. Velocity parameters for each layer for the Orphan Basin interpreted from [3,21]. Velocity parameters for each layer from the Rockall Basin interpreted from [26,51]. Average present day thicknesses for each of the sequences in each of the basins are also provided from the depth conversion.
Density (kg/m3)Velocity for the Orphan Basin (m/s)Velocity for the Rockall Basin (m/s)Thickness of Layers in the Orphan Basin (m)Thickness of Layers in the Rockall Basin (m)
Water Column10301450145020003000
Cenozoic25002500250050002000
Upper Cretaceous2500400045007501000
Lower Cretaceous27004500510012001500
Jurassic27005000N/A2000N/A
Basement/ Continental Crust28706700670070007000
Table 2. Rifting timetable for the West Orphan Basin used for 2D Thermal Subsidence module calculations. For the Rockall Basin, only the Mid Cretaceous rift event was used to calculate the thermal subsidence, due to the fact that no Jurassic sedimentary rocks could be interpreted within the basin due to the quality of the deep seismic data. Parameters from [14,29].
Age of Rifting OnsetSyn-Rift Duration
Late Jurassic Rift Event164.0 Ma19.0 Ma
Mid Cretaceous Rift Event113.0 Ma13.0 Ma
Table 3. Lithological compositions (as per [43]) and porosity values (for each basin) for each stratigraphic unit used in the decompaction calculations within MOVETM.
Orphan BasinRockall Basin
Sandstone (%)Shale (%)Limestone (%)Porosity at Surface
Water Column0001.01.0
Cenozoic080200.370.37
Upper Cretaceous8010100.30.2
Lower Cretaceous208000.370.37
Jurassic6030100.300.37
BasementN/AN/AN/A0.10.1
Table 4. Additional parameters used in both the decompaction and thermal subsidence calculations within MOVETM. Values are identical to those used by [43].
Orphan BasinRockall Basin
Beta Value2.02.0
Initial Crustal thickness30 km30 km
Initial lithosphere thickness125 km125 km
Surface Temperature0 °C
Asthenosphere temperature1333 °C
Coefficient of thermal expansion0.34 × 10−4 °C
Thermal diffusivity7.8 × 10−7 m2 s−1
Compaction depth constant0.55 km−1
Poisson Ratio0.25
Table 5. Average thicknesses of the pre-rift crust, the syn-rift sediment and the post-rift sediment in the West and East Orphan basins and the Rockall Basin. Values measured from 2D reconstructions generated in MOVETM.
West Orphan BasinEast Orphan BasinRockall Basin
Average thickness of pre-rift crust12.3 km8.6 km8.5 km
Average thickness of syn-rift sediment2.4 km3.8 km2.4 km
Average thickness of post-rift sediment3.7 km3.8 km3.4 km

