1. Introduction
Historically, the management of landslide risk within chain areas has been hardly sustainable, due to the cost of the engineering interventions [
1,
2,
3,
4,
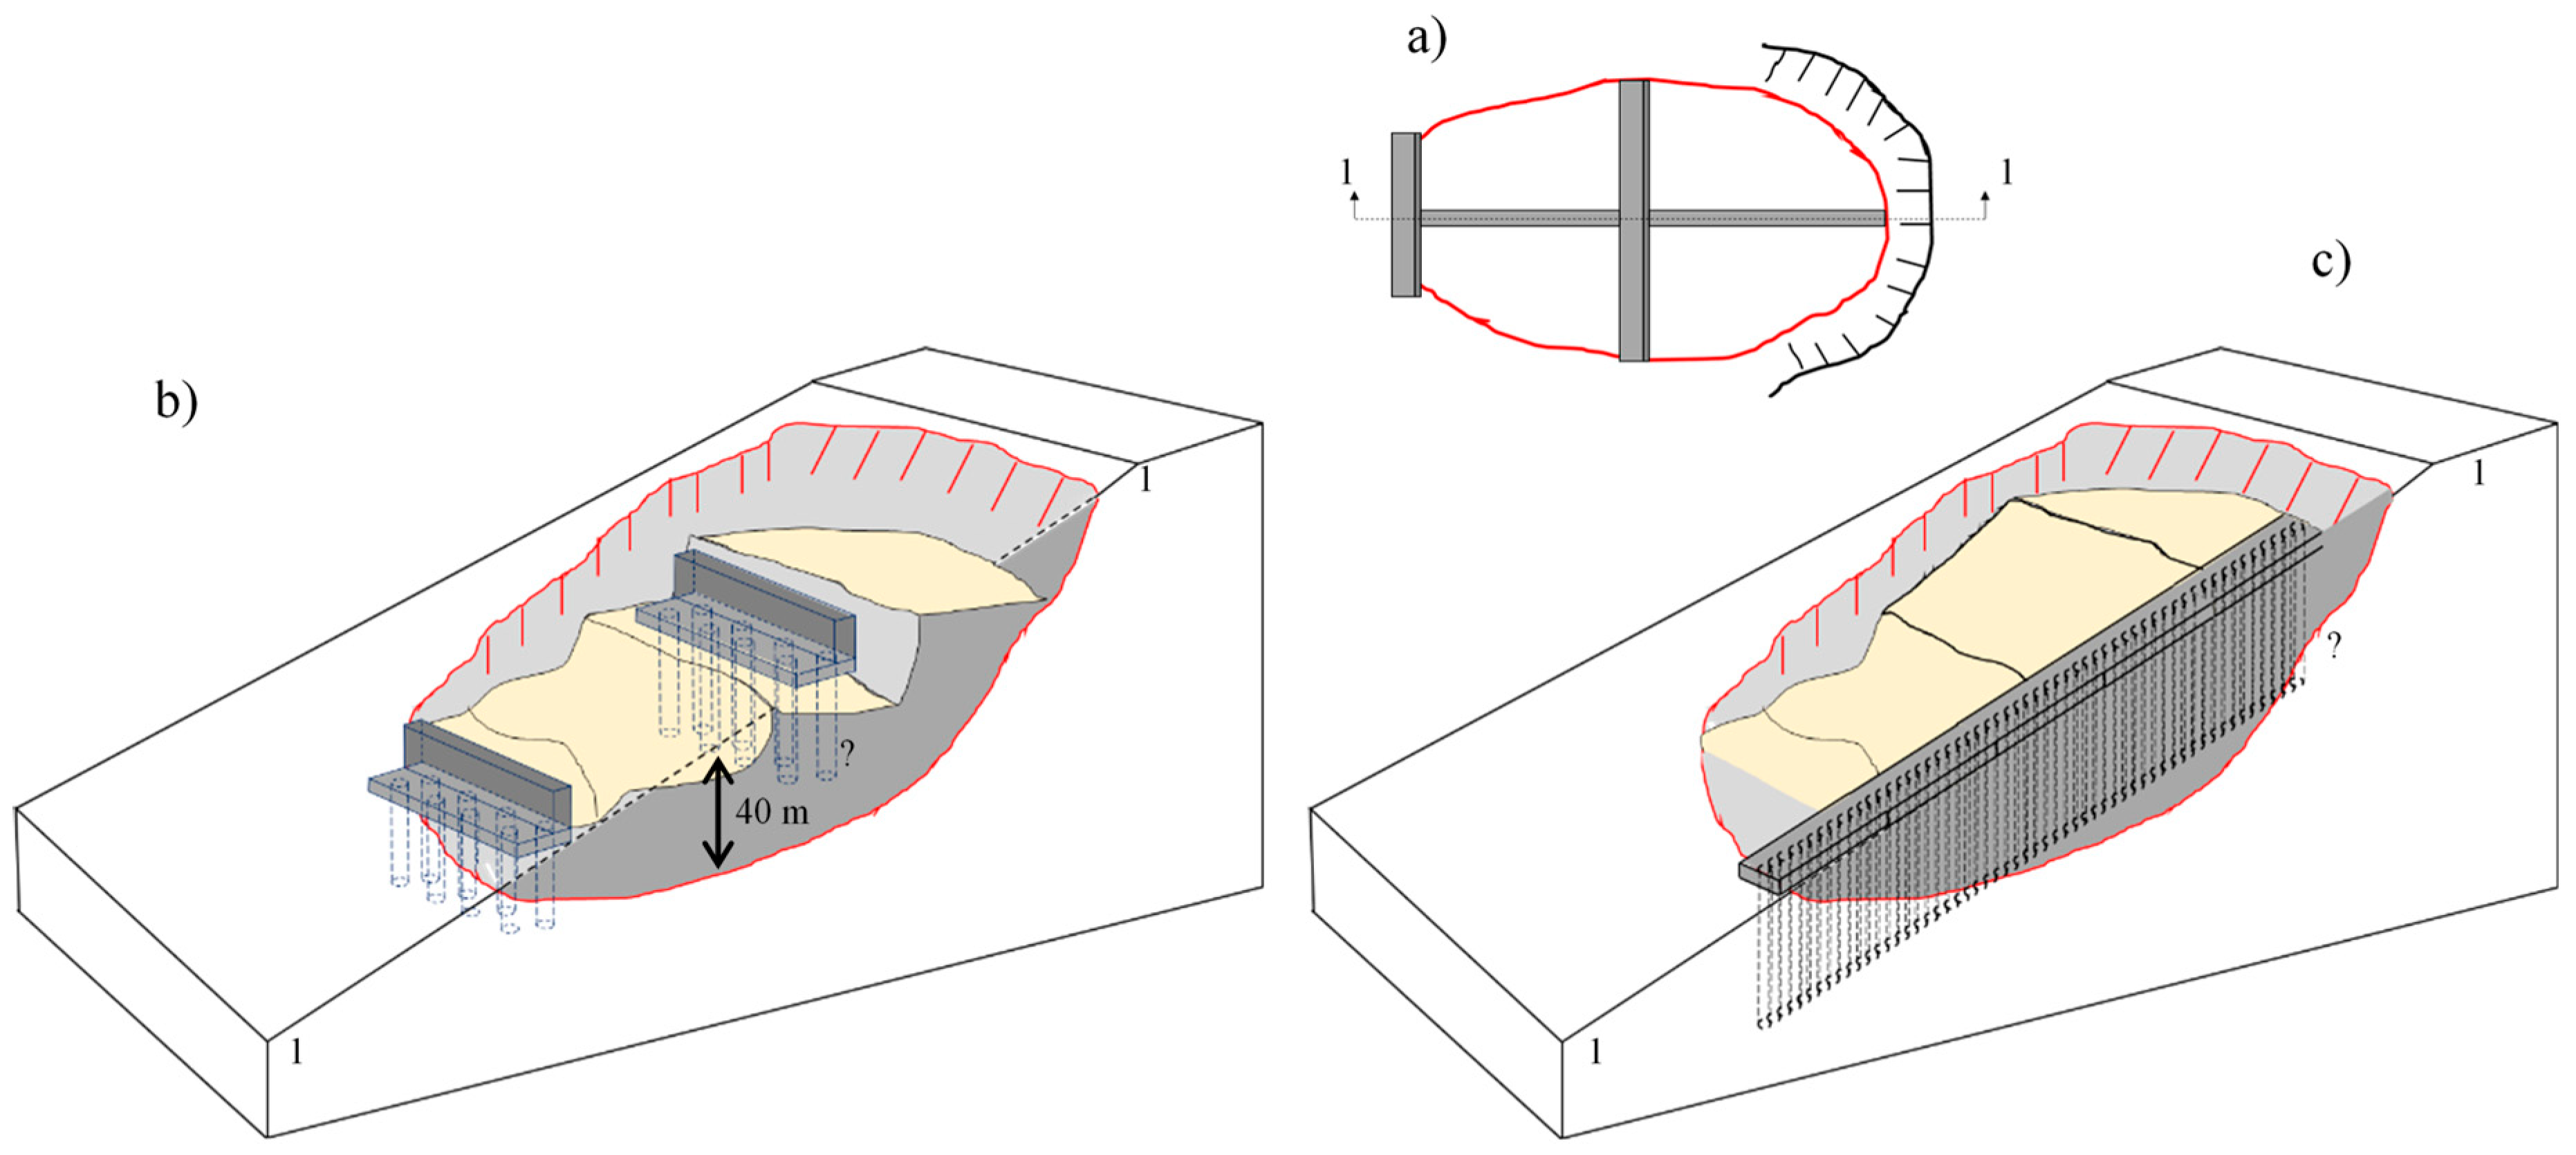
5]. This is especially the case in regions where deep slow landslides are widespread, as with deep landslides, the installation of earth retaining structures, representing the traditional mitigation measure, does not provide long-lasting successful mitigation effects. This is because of the large size of deep landslide bodies (maximum depth higher than 30 m, according to Cruden & Varnes [
6]), whose kinematics may be not influenced significantly by the installation of either transversal pile diaphragms (e.g., at the landslide toe, or at mid-height;
Figure 1a,b), or longitudinal ones (
Figure 1a–c [
7]). Eventually, a combination of various retaining diaphragms of significant depth (e.g., piles of more than 40 m depth in
Figure 1), might provide a mitigation effect. Such intervention strategy, though, is recognizably highly expensive and does not necessarily restrain the development of new shear bands and further progressive failure [
8].
For those slopes where the piezometric regime acts as landslide predisposing factor [
9], drainage may represent a more effective mitigation measure. This is the case, for example, in deep landslides whose displacement rates are related to the piezometric excursions at depth, which are in turn connected to the slope–atmosphere interaction [
10,
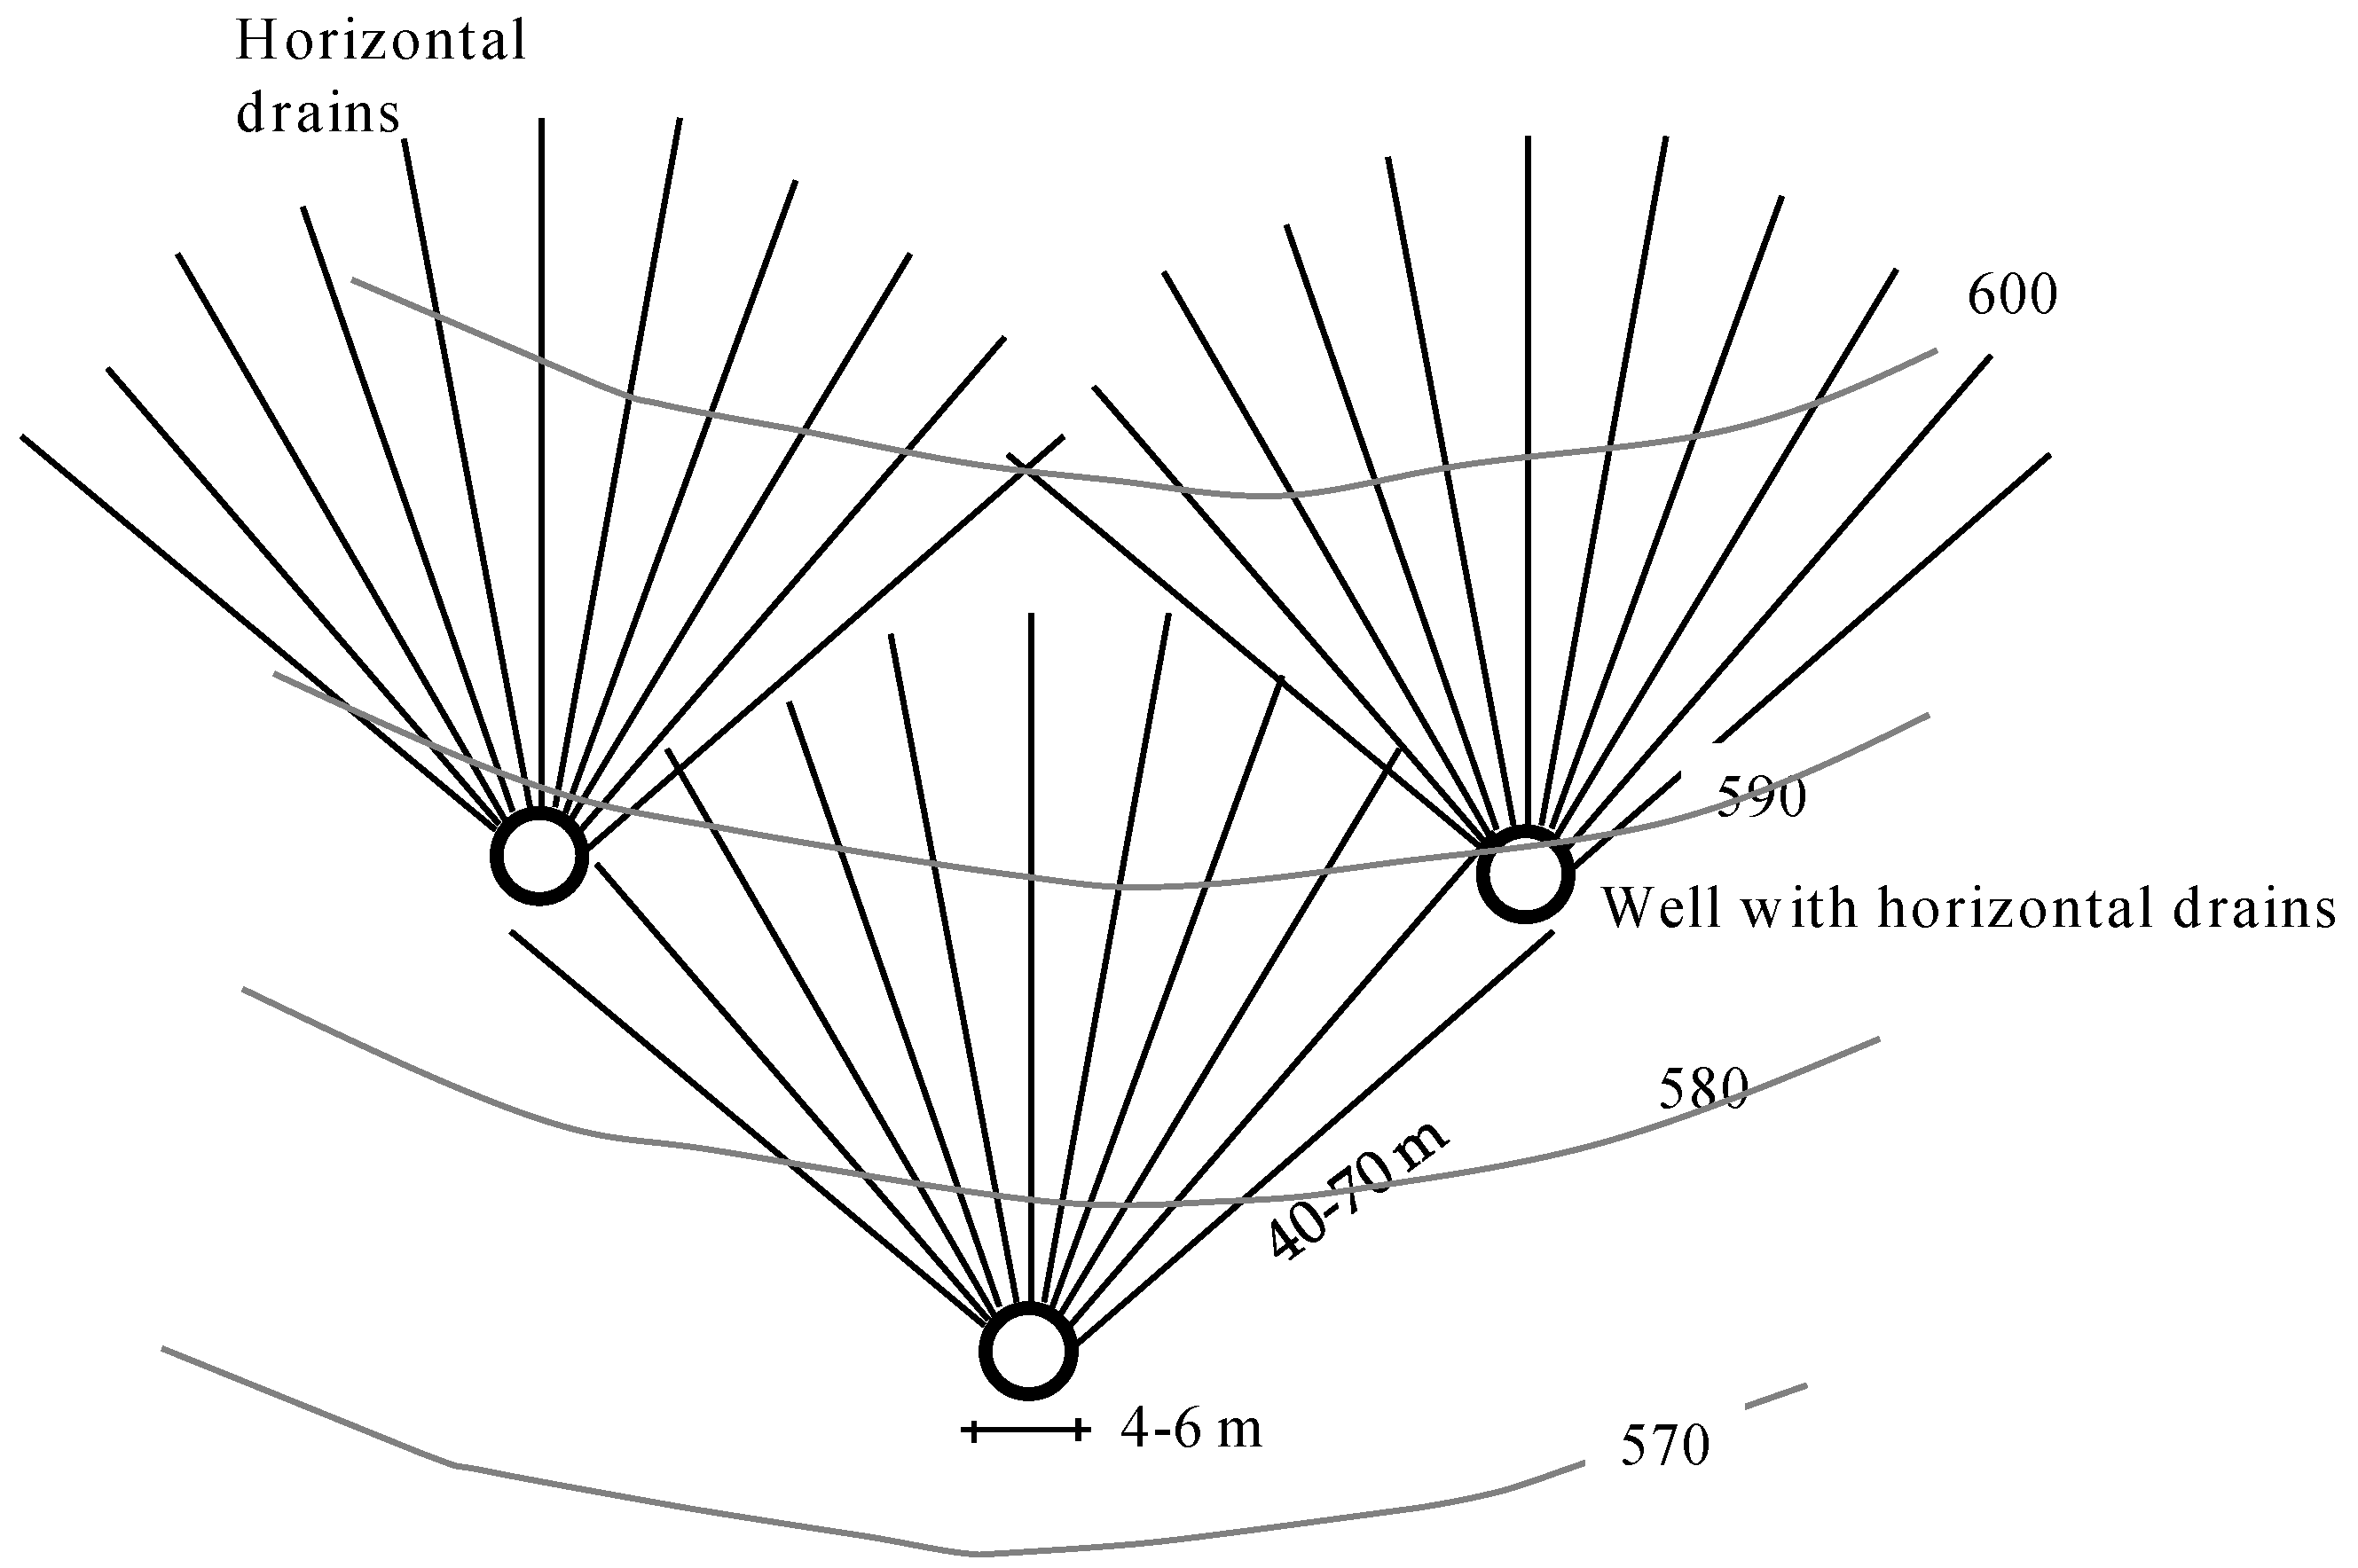
11]. However, the traditional drainage systems used for the mitigation of deep landsliding, such as deep drainage wells combined with sub-horizontal drainage pipes (
Figure 2 [
3,
12]), are also costly and of expensive maintenance. Furthermore, the drainage capacity of the sub-horizontal drainage pipes is easily jeopardized by their interaction with the moving landslide, which may cause the pipe failure.
In the past decades, significant research has been addressed to the hydraulic efficiency of drainage trench systems, which are a robust and relatively not expensive engineering opera [
3,
12]. In particular, since the late 1970s, research in the field of slope stabilization has paid attention to the effects of drainage trench systems on the slope stability factor, F, in order to optimize the design of such mitigation measure.
However, these drainage trenches have been generally considered as mitigation measure solely for shallow landslides [
1,
3,
13,
14,
15]. Based on in situ monitoring after the installation of longitudinal drainage trenches, Hutchinson [
3] formulated the piezometric head distribution that may be achieved through the use of 2 to 5 m depth longitudinal trenches (i.e., shallow trenches), for depths only slightly higher than the trench depth. In 1984, Stanic [
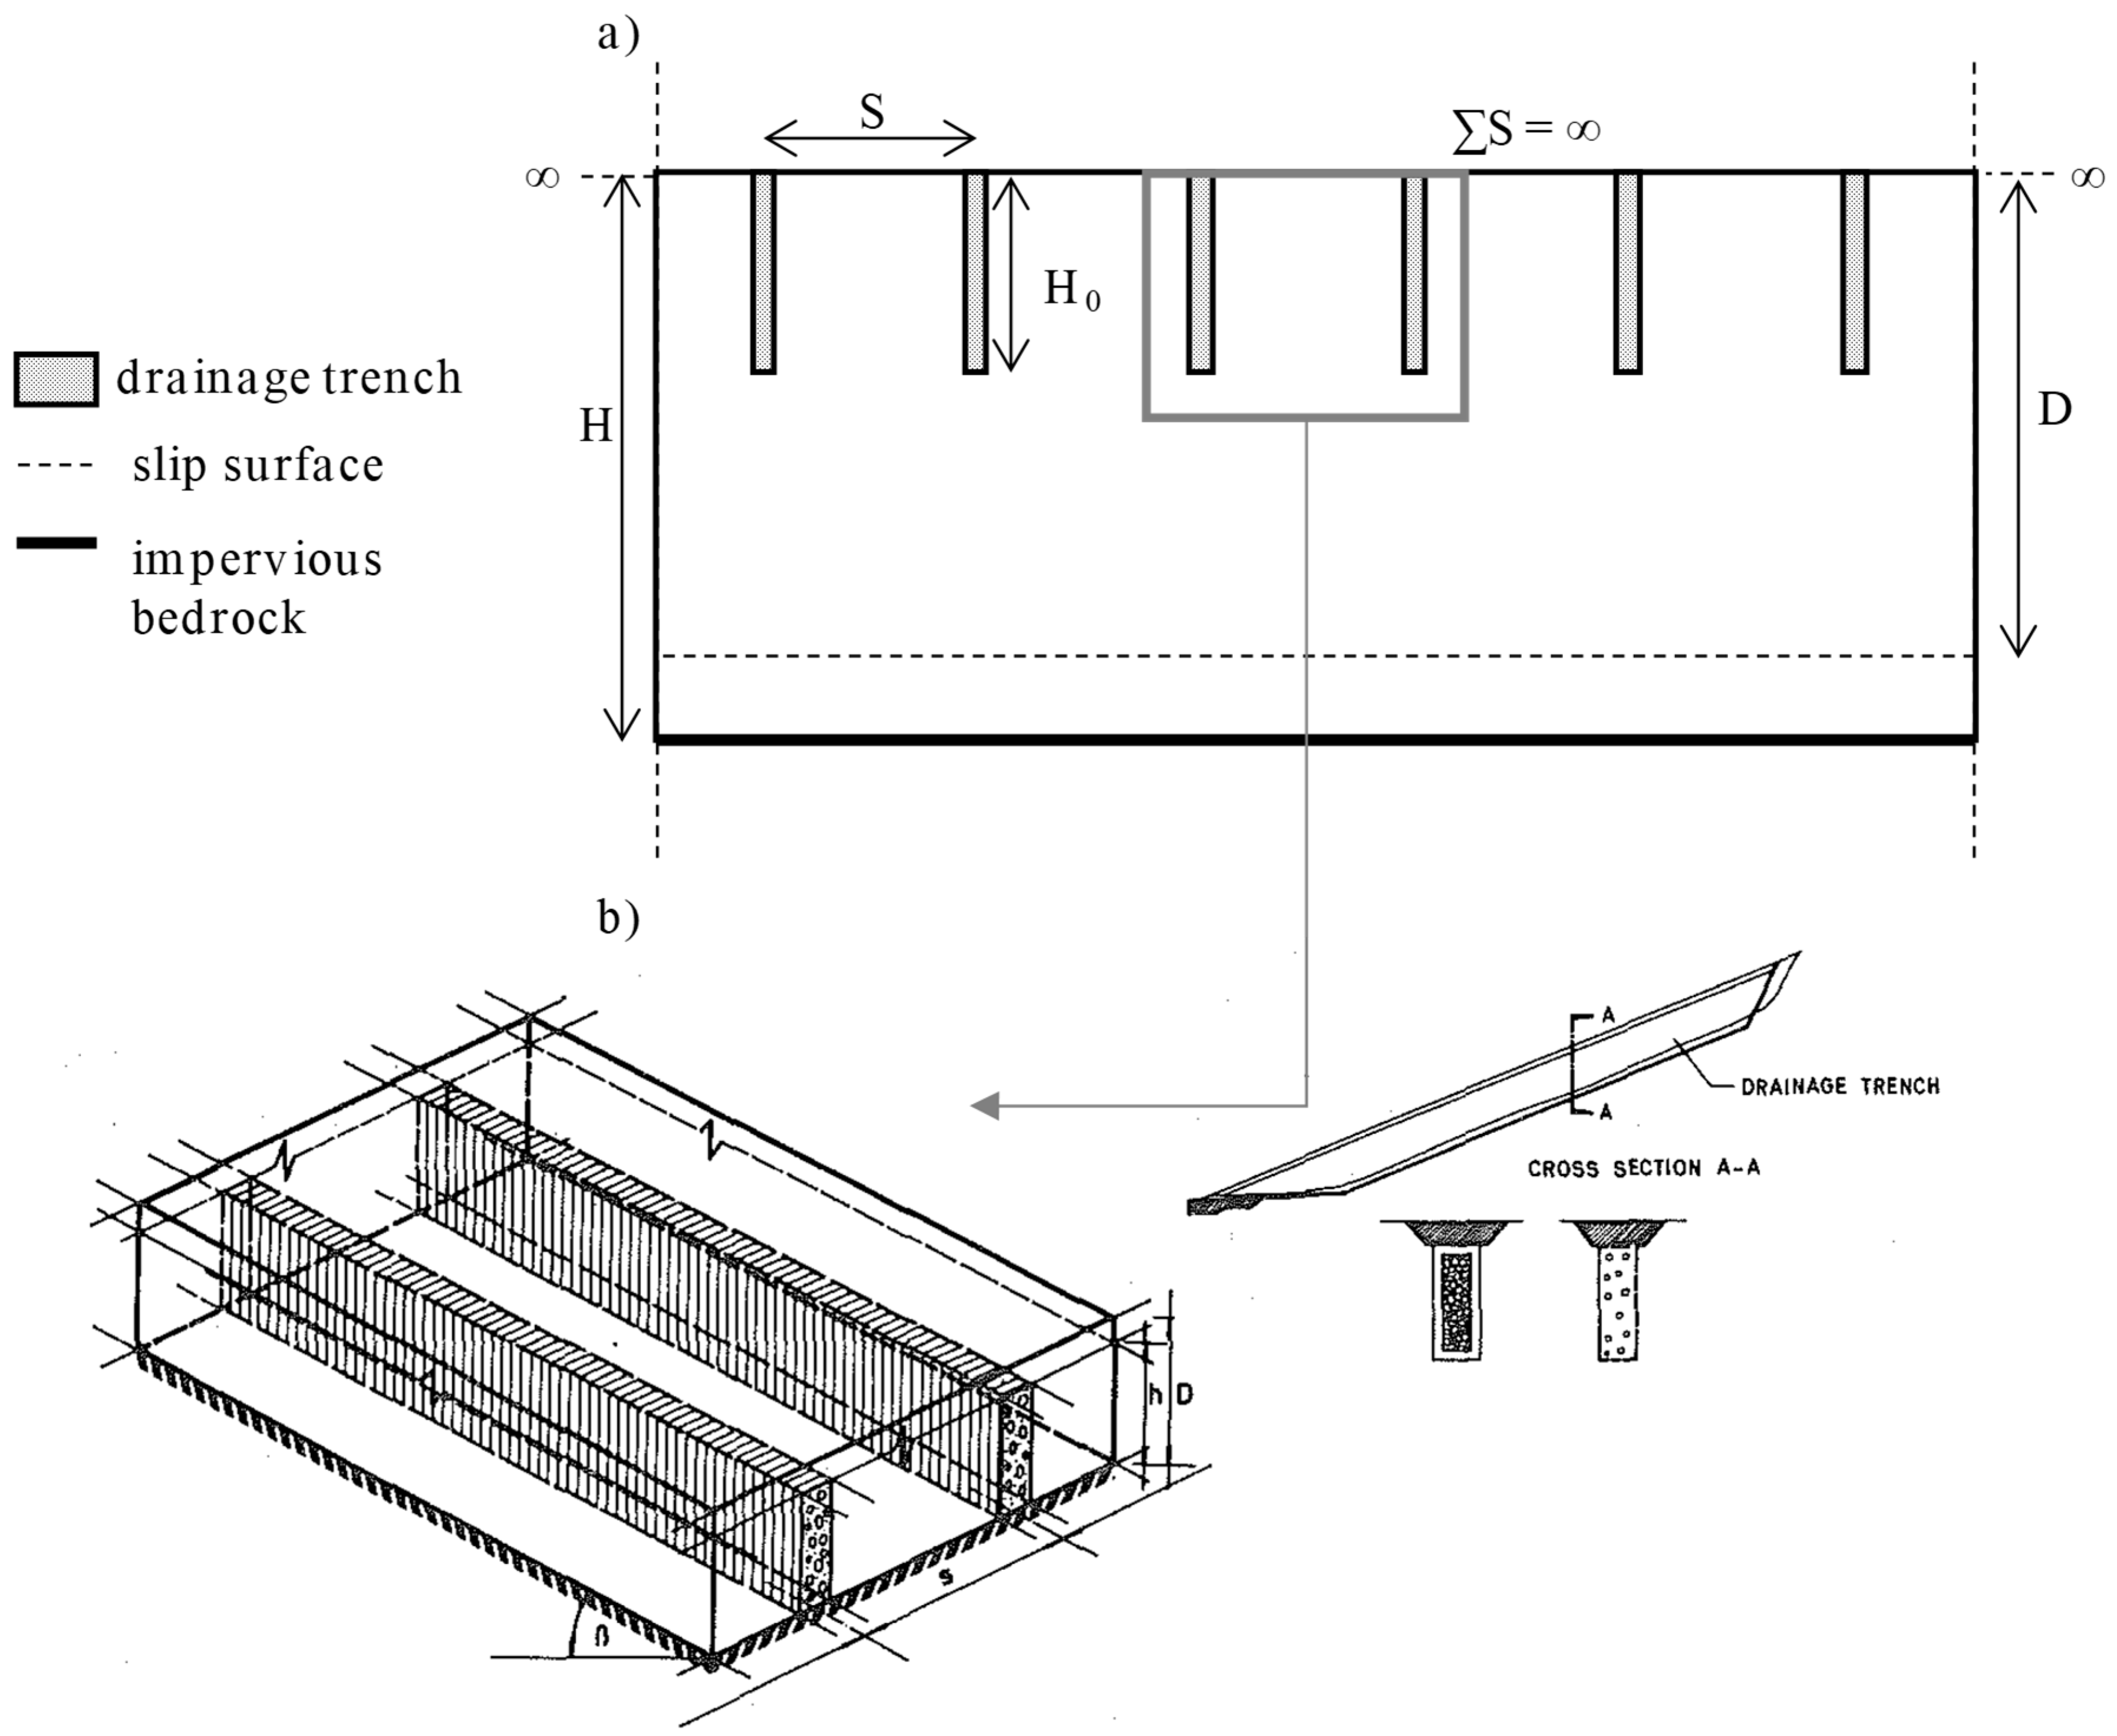
13] proposed a rational assessment of the influence on the F value for elongated shallow landslide bodies, assuming the number of trenches to be infinite. Through a parametric study of the variation in drainage steady-state efficiency, E, with the trench spacing S (
Figure 3), Stanic provides the prediction of the variation in F, calculated according to the infinite slope model and assuming full saturation of the soils in the whole slope.
Later on, based on the results of a set of parametric numerical analyses performed with reference to the same scheme used by Stanic [
13] and sketched in
Figure 3, Desideri et al. [
16], following Di Maio et al. [
17], proposed design charts relating the hydraulic efficiency at small depth of shallow longitudinal trench systems (
Figure 3), with their geometric parameters. Moreover, these authors assumed fully saturated conditions; furthermore, they used the Terzaghi-Rendulic approach to compute the transient seepage in a deformable soil and calculated the variation with time of the drainage efficiency, accordingly. More recently, the mitigation effects of medium depth drainage trenches, e.g., of 10–12 m depth, have been formulated for medium depth landsliding [
12,
18], according to the same modeling approach and calculation scheme used by Desideri et al. [
16].
Di Maio et al. [
17] highlighted how the drainage efficiency of the trench system is affected by the hydraulic boundary conditions at the ground surface, hence, by the slope–atmosphere interaction. In 2005, D’Acunto & Urciuoli [
19] proposed a parametric numerical analysis (in saturated conditions) of the effects on the stability of shallow landslides of drainage trenches, showing that implementing realistic infiltration at the ground level provides the prediction of larger efficiency than that calculated in presence of a permanent film of water at the ground surface.
The development of numerical modeling of partially saturated soil behavior has allowed for more accurate predictions of the transient seepage due to rainfall infiltration in slopes. Accordingly, today the transient seepage, triggered by the installation of the trench systems, can be predicted more accurately accounting for partial soil saturation and the slope–atmosphere interaction (i.e., unsteady boundary conditions at the ground level). Furthermore, also the features of the trench system to be input in the analyses could be more realistic than those assumed in all the studies quoted above. In particular, the effects of the trench system have, so far, always been evaluated with reference to shallow depths (no more than 5–6 m b.g.l.), i.e., where such effects are not much influenced by the transversal extension of the system, ΣS (
Figure 3), so that an infinite number of trenches have been always assumed in the modeling. Therefore, the seepage has been always modeled making reference to a set of two trenches, as shown in
Figure 3b. According to the results of the numerical modeling following such approach, the effects of the drainage trench system on the piezometric conditions at depths larger than twice the trench depth, have always been considered negligible [
16]. Therefore, the trench system has always appeared to be an engineering measure not useful for the mitigation of deep landslide activity.
More recently, Cotecchia et al. [
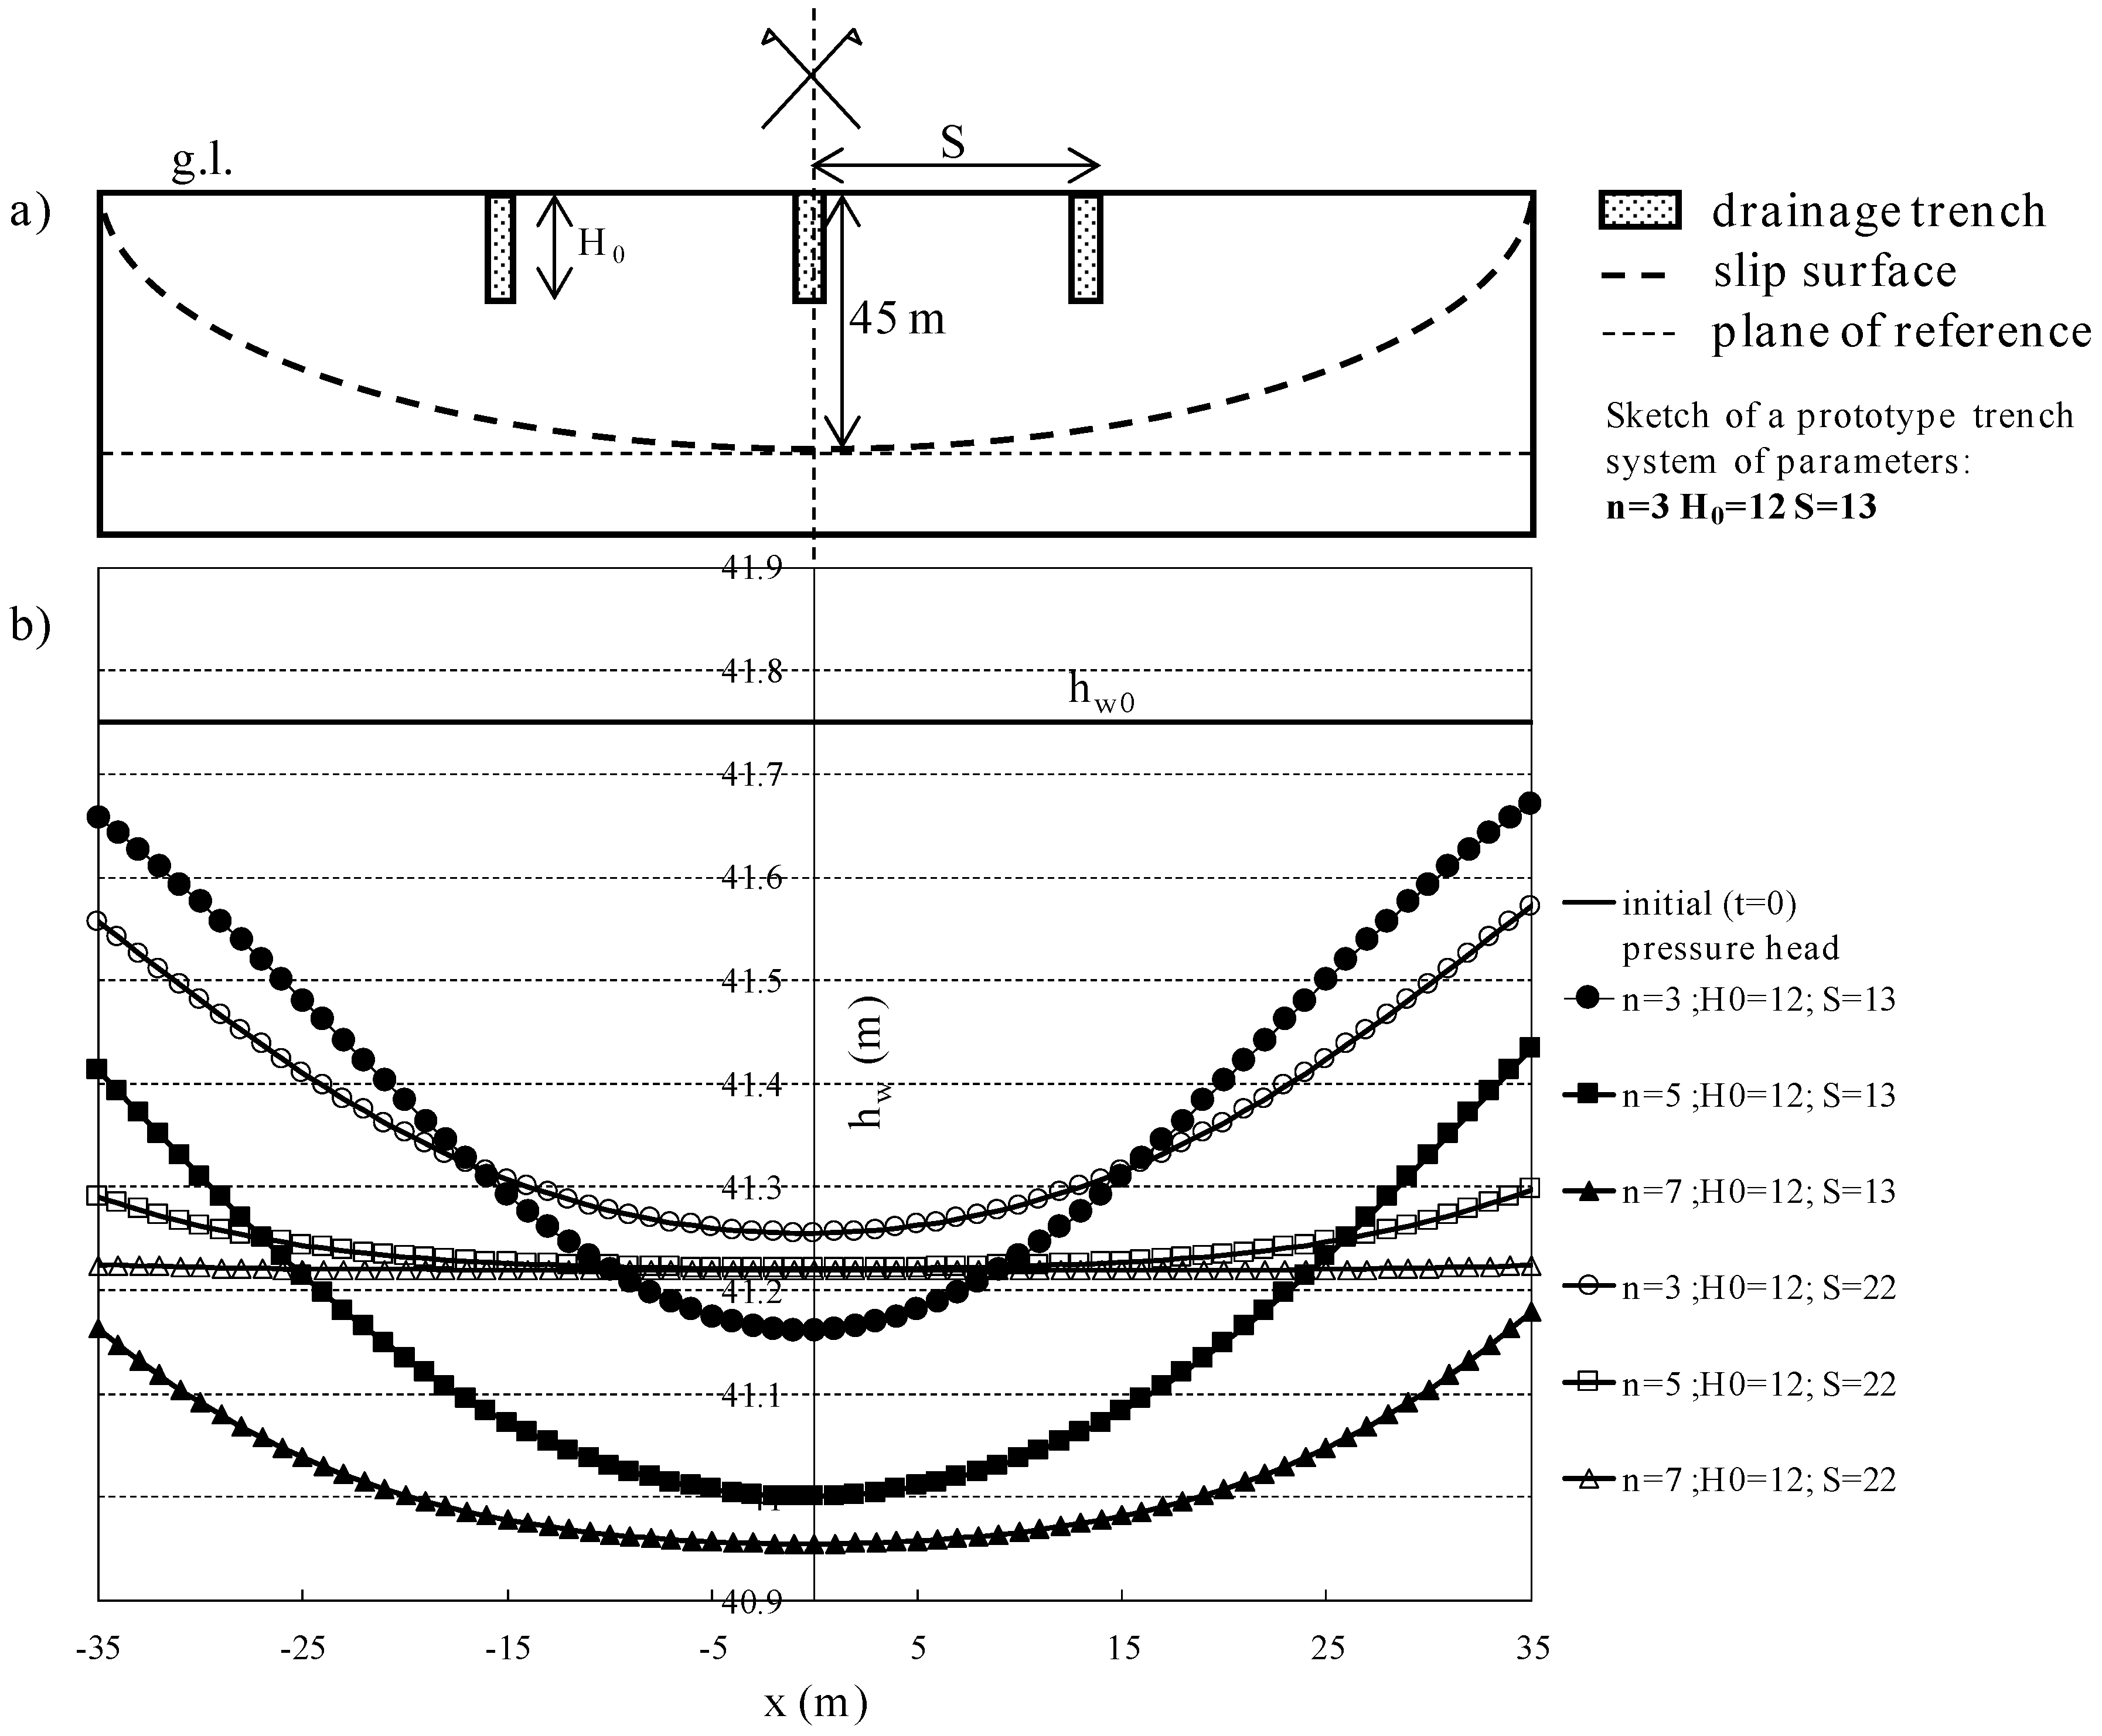
11] have proposed the finite element modeling of the transient seepage triggered by a finite number of medium depth drainage trenches, making reference to the whole system (n being the finite number of trenches). In the analyses, the authors implemented partially saturated conditions above the water table and unsteady boundary conditions at the ground level, to represent the effects of climate. The modeling results provide evidence of piezometric head reductions at large depth which vary with the distance “x” from the plane of symmetry of the system (
Figure 4) and are not always negligible. The authors have shown that the maximum drop in piezometric head caused by the trench system occurs below the center of the system; they have then defined such lateral variability in piezometric drop caused by the trench system installation as “group effect”. The authors have then shown that the group effect is beneficial for the mitigation of the activity of deep landslides having a “bowl-shaped” sliding surface (see
Figure 4a), even in low permeability slopes (e.g., clayey slopes). This is because, if the central plane of the trench system corresponds to the central longitudinal section of the landslide (
Figure 4), the group effect makes the reduction in piezometric head at depth be maximum where the bowl-shaped slip surface reaches the maximum depth. In this case, the deepest portion of the slip surface benefits from the “group effect” (
Figure 4).
With regard to the technical feasibility of excavating deep trenches in slopes, according to Pun et al. [
12], drainage trenches can reach a depth as high as 25–30 m through the currently available technologies. They are usually excavated by means of grab shells, using slurry to sustain the vertical walls of the trench (e.g., polymeric mud). Urciuoli & Pirone [
18] report a couple of innovative construction technologies. In particular, for deep trenches the most recent construction procedure makes use of aerated concrete [
20,
21] precast panels, manufactured by mixing gravel of high permeability and cement of a good compression strength. This system can also be installed through the excavation and filling of a diaphragm made of secant piles. Its beneficial features are high permeability, the filtering capacity preventing the internal erosion of the filling soils, sufficient shear strength after a short curing time, avoiding the instability of adjacent previously built panels.
Therefore, much progress has been made in developing both the efficiency prediction and the installation technique of medium depth to deep longitudinal drainage trench systems. Such progress makes the mitigation of deep landslide activity through such measure more sustainable, given the lower cost and the longer life of drainage trenches. The drainage effects can be nowadays predicted more accurately and controlled through the monitoring of the indicators of the landslide activity, such as the pore water pressures.
The aim of the present paper is to provide a methodology for an innovative design of systems of longitudinal medium depth drainage trenches, showing that these can allow for pore water pressure reductions at depth, relevant to the slope stabilization. In particular, through 2D finite element analyses in the transversal slope section (e.g.,
Figure 4), the study is aimed at exploring the variation of the hydraulic efficiency, E, on deep sliding surfaces, with the change in the geometric and hydraulic parameters of the trench system. From the analysis results, the assessment of the increase of the slope stability factor, F, is derived. As the research work is framed in a larger study about the mitigation measures most sustainable in a pilot region, the Daunia Apennines (Southern Italy), the results will make reference to the slope features in such region. Nevertheless, the results are deemed to be extended to contexts of similar geo-hydro-mechanical features to those of the Daunia Apennines.
2. The Deep Landsliding of Reference in the Study
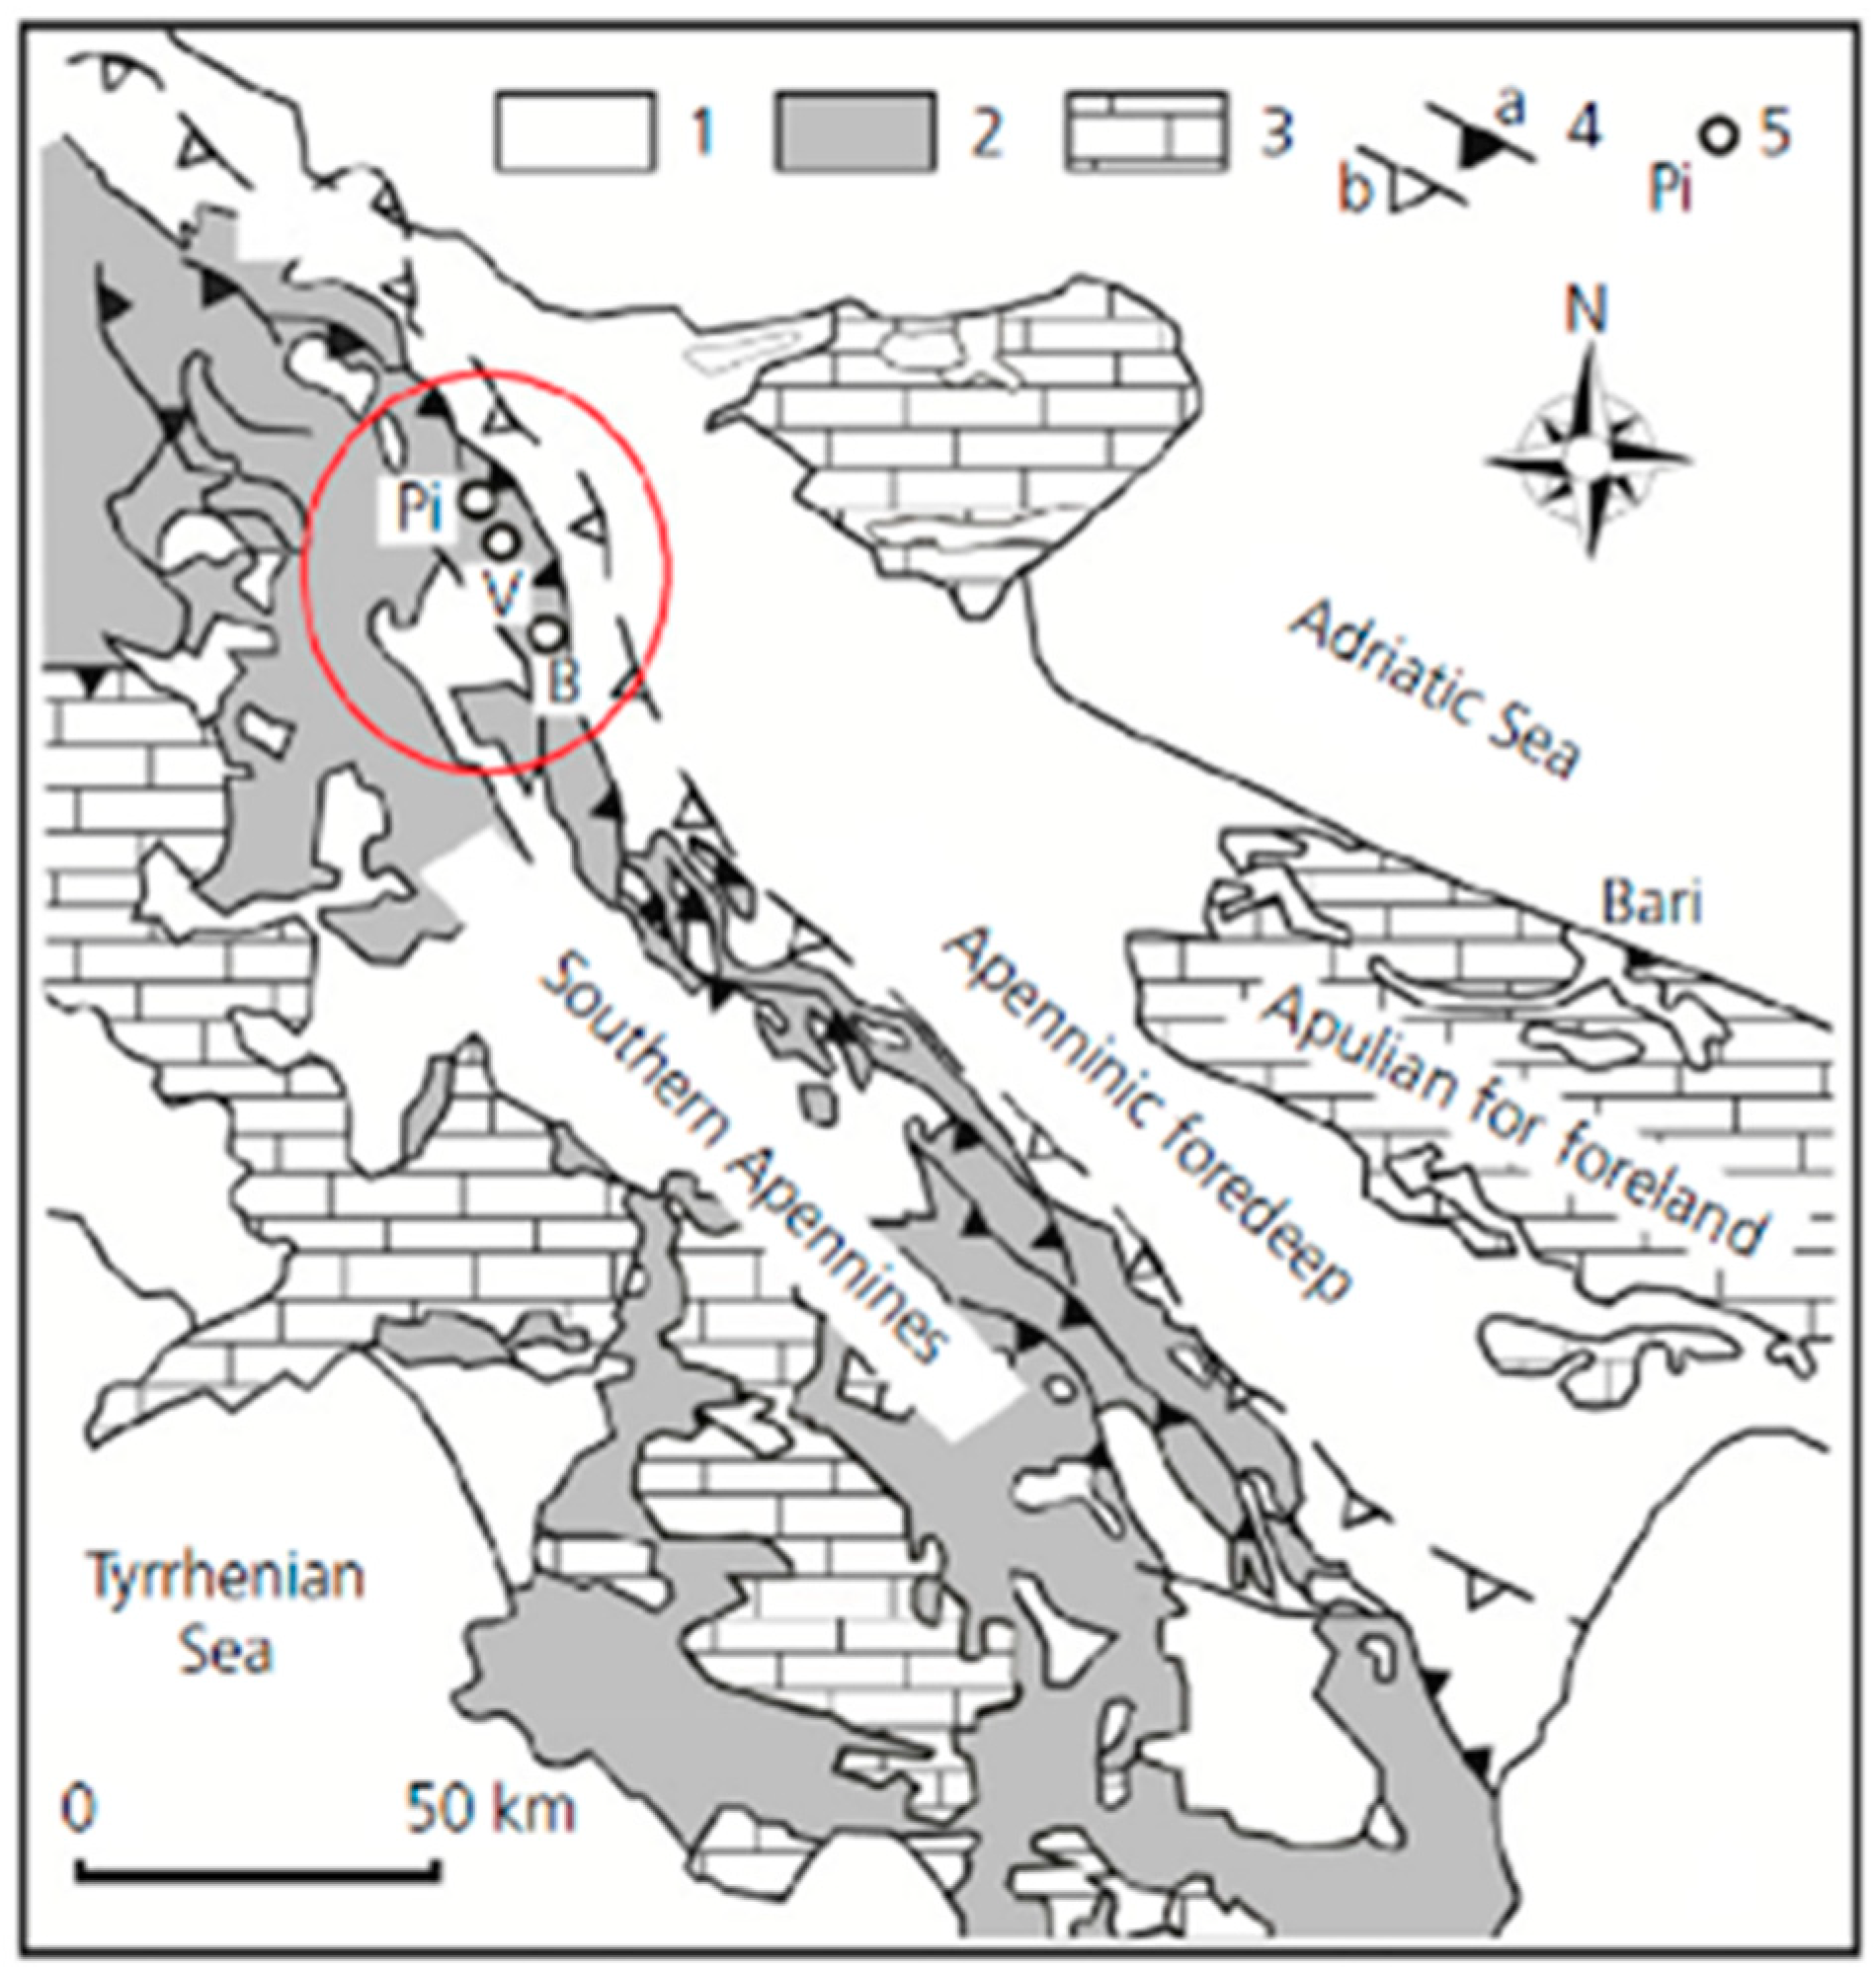
The Daunia Apennines (
Figure 5) are located in the eastern sector of the southern Italian Apennines. Here, clayey slopes have been involved in intense tectonic processes, so that the clays are often intensely fissured and characterized by rather low strength parameters, with fractured rocks floating in the clay matrix. Furthermore, deep slow historical landslides recur in such slopes, whose activity is often connected to the slope–atmosphere interaction [
10,
22,
23,
24,
25].
In particular, Cotecchia et al. [
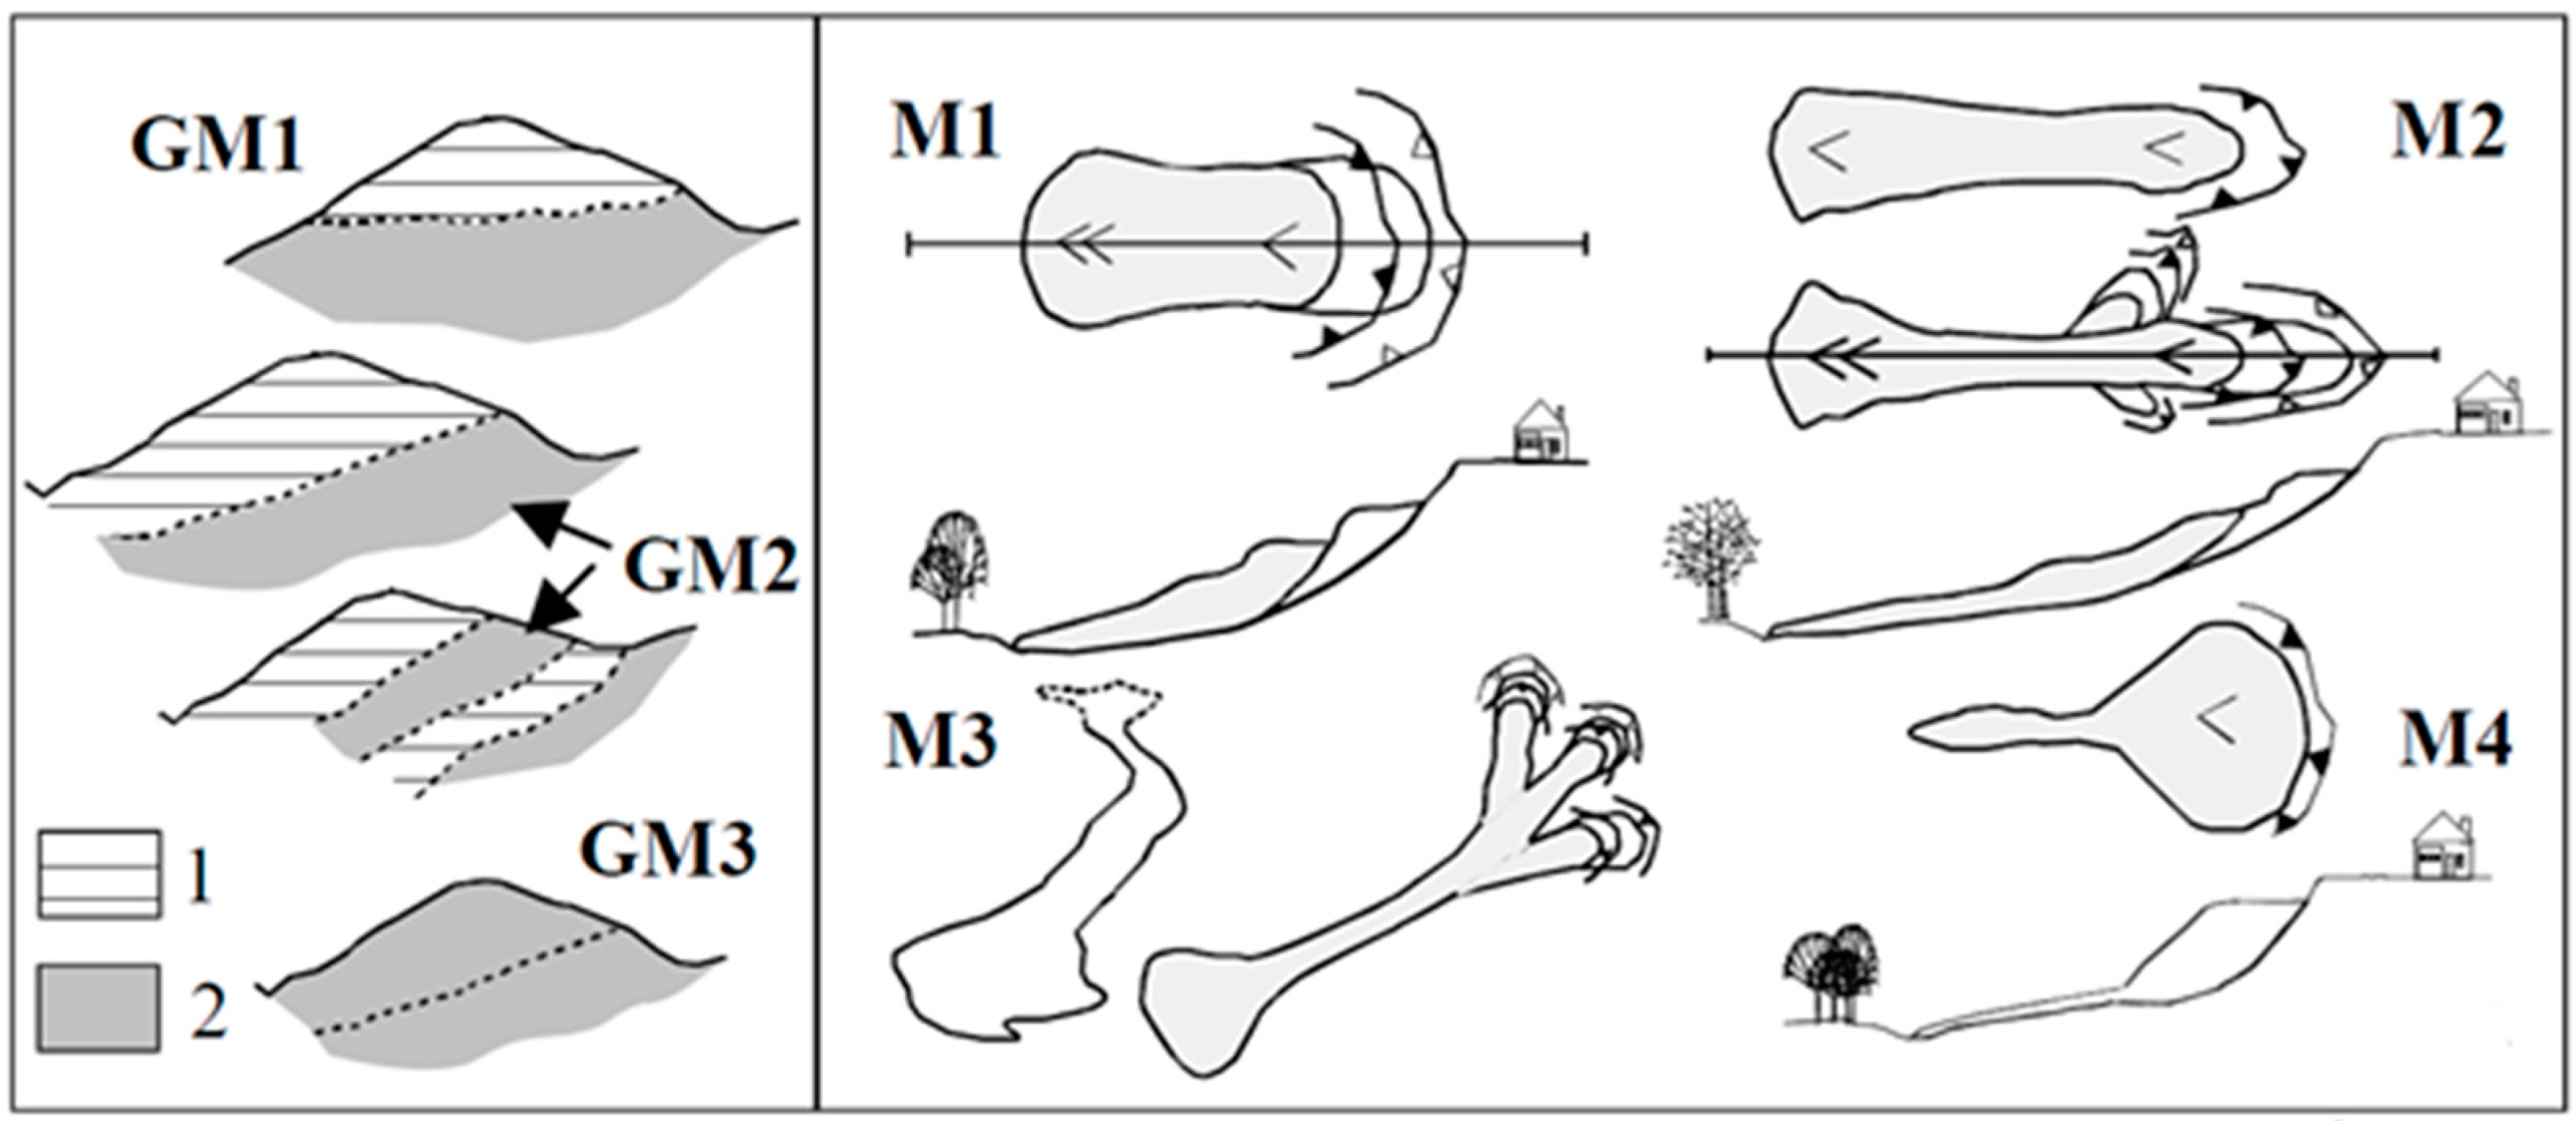
26] recognized three recurrent geo-hydro-mechanical set-ups in the region, named GM1, GM2, and GM3 (
Figure 6), characterized by the alternation of rock layers and clay layers. These set-ups differ mainly for the trend of the contact between the rock layer and clay layer. Furthermore, based on extensive field surveys and monitoring, Cotecchia et al. [
26] recognized four main classes of landslide mechanism in the region: class M1 (
Figure 6) includes compound slides, usually deeper than 30 m, whose length is comparable with the width; Class M2 (
Figure 6) corresponds to mudslides that can have one or more source areas and whose body can be either elongate or lobate; class M3 (
Figure 6) includes the most complex landslides, such as shallow earth sliding-flows or flow-slides [
27]; and finally, M4 (
Figure 6) is represented by deep rotational landslides evolving into an earth-flow downslope. Inclinometer monitoring has given evidence to the evolution with time of the sliding rates of several bodies, of either M1 or M2 type (
Figure 6), with slip surfaces reaching 30 to 50 m maximum depth. Moreover, the piezometric monitoring has given evidence to concurrence of a slow rise in piezometric head (from the end of August to late winter/early spring) and the increase in sliding rate of the cited landslide bodies. At the stage of maximum piezometric head, the landslide rates reach maximum values [
10], showing that the seasonal piezometric rise causes acceleration of landsliding.
Cotecchia et al. [
22,
28] have demonstrated, based on both the above cited field data (
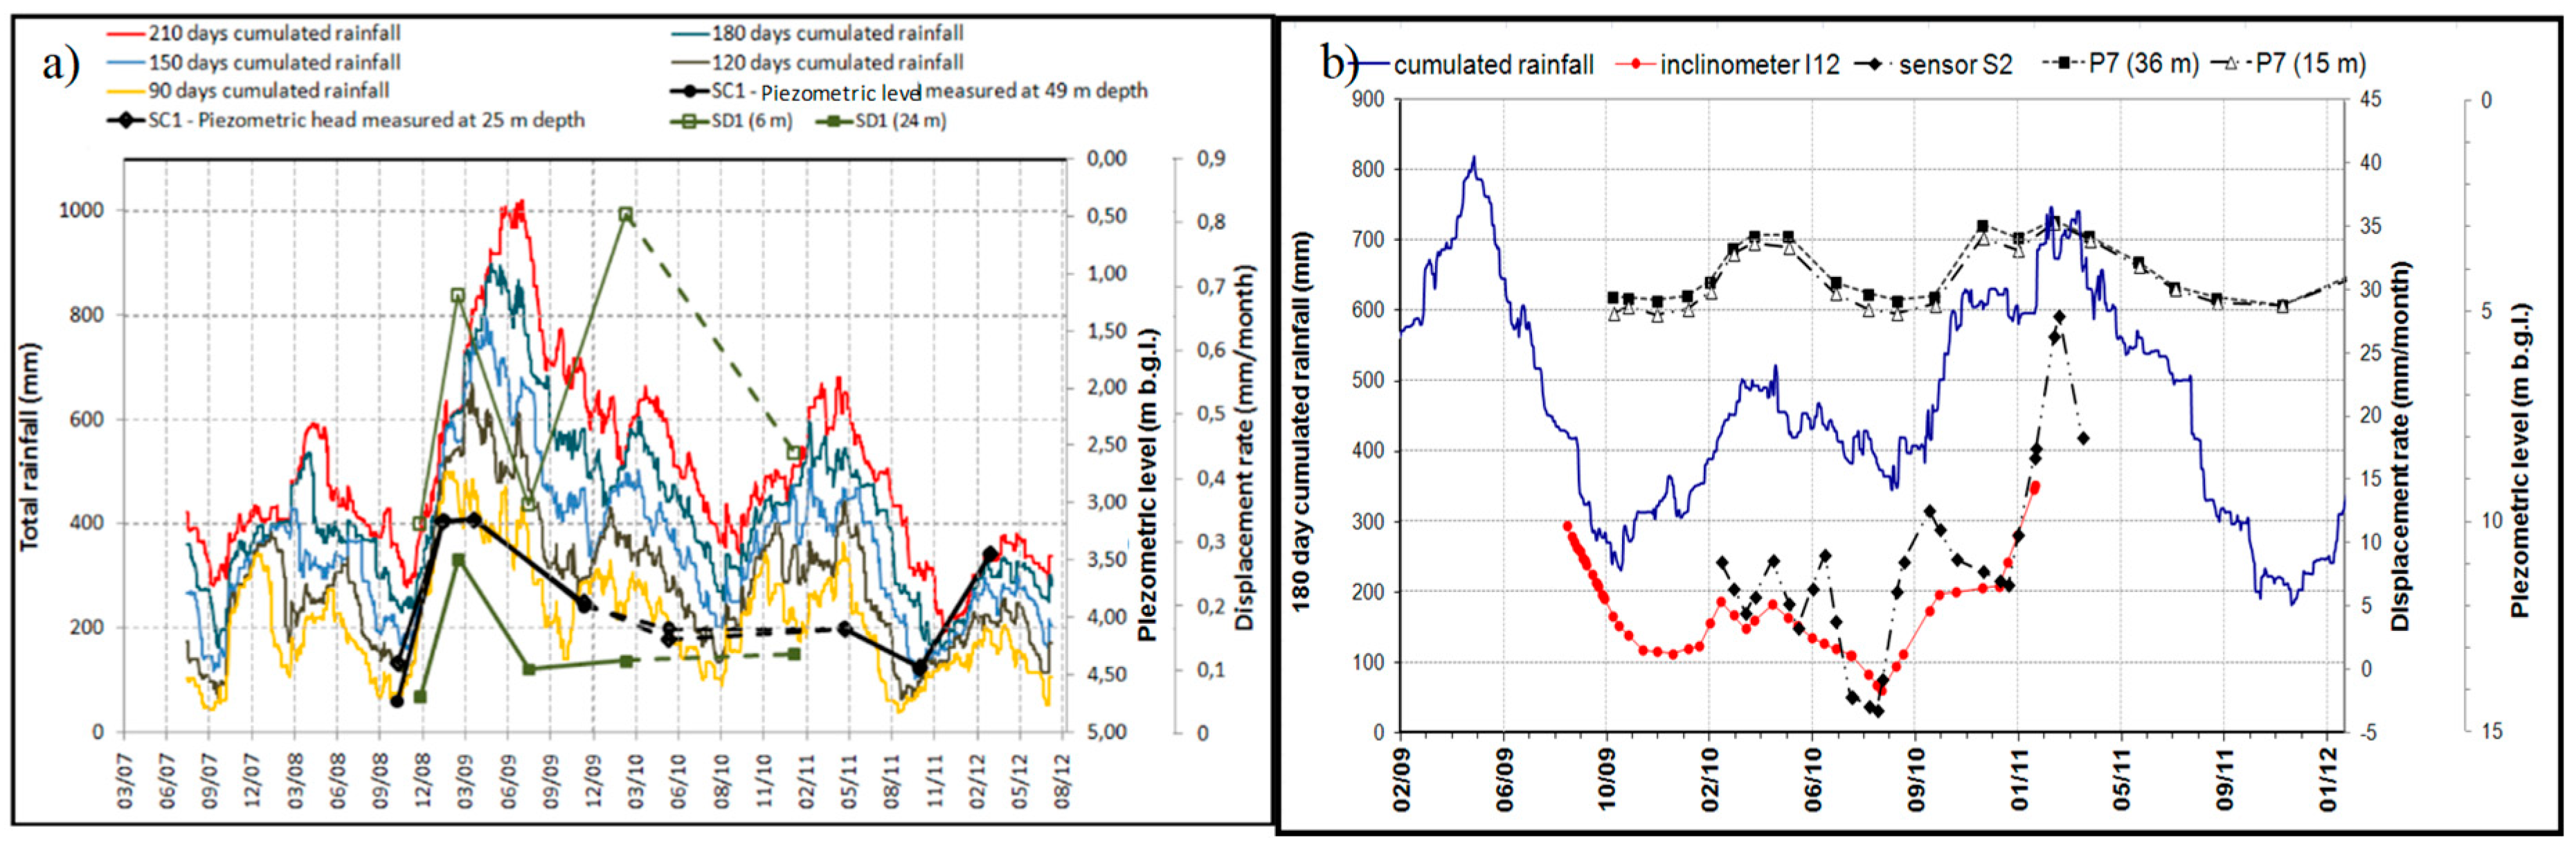
Figure 7) and numerical modeling, that the quoted relation between the piezometric head rise and the sliding acceleration is consequent to the seasonal infiltration in the slopes of the region of the net rainfalls, equal to the difference between the total rainfalls, the runoff, and the evapotranspiration rates triggered by the regional climate. The infiltration in the fissured clay slopes generates, over the year, seasonal fluctuations of the pore water pressures down to large depth, given the hydraulic properties (water retention curve and permeability function) of the clayey soils forming the flysches. The excursions in the available shear strength consequent to the pore water pressure variations, result in accelerations and decelerations of pre-existing landslide bodies (
Figure 7). As can be observed at the two pilot sites, Volturino and Pisciolo (
Figure 7a,b), representative of several other hillslopes in the region and where monitoring was carried out (
Figure 5), the maximum piezometric heads concur with both the maximum values of the long term cumulative rainfalls (90 to 180 days), and the maximum deep displacement rates. The latter are measured in correspondence of the shear bands intercepted by the inclinometers, at the end of winter (
Figure 7). At Pisciolo, the maximum displacement rate of the landslide body at the end of winter, detected through inclinometric monitoring, is also confirmed by means of GPS monitoring (sensor S2 in
Figure 7b).
Given the diagnosis of the deep landslide mechanisms discussed so far [
10], the adoption of drainage measures to reduce the high piezometric heads in the slopes represents a rational strategy to mitigate the landsliding. In particular, following the earlier work from Cotecchia et al. [
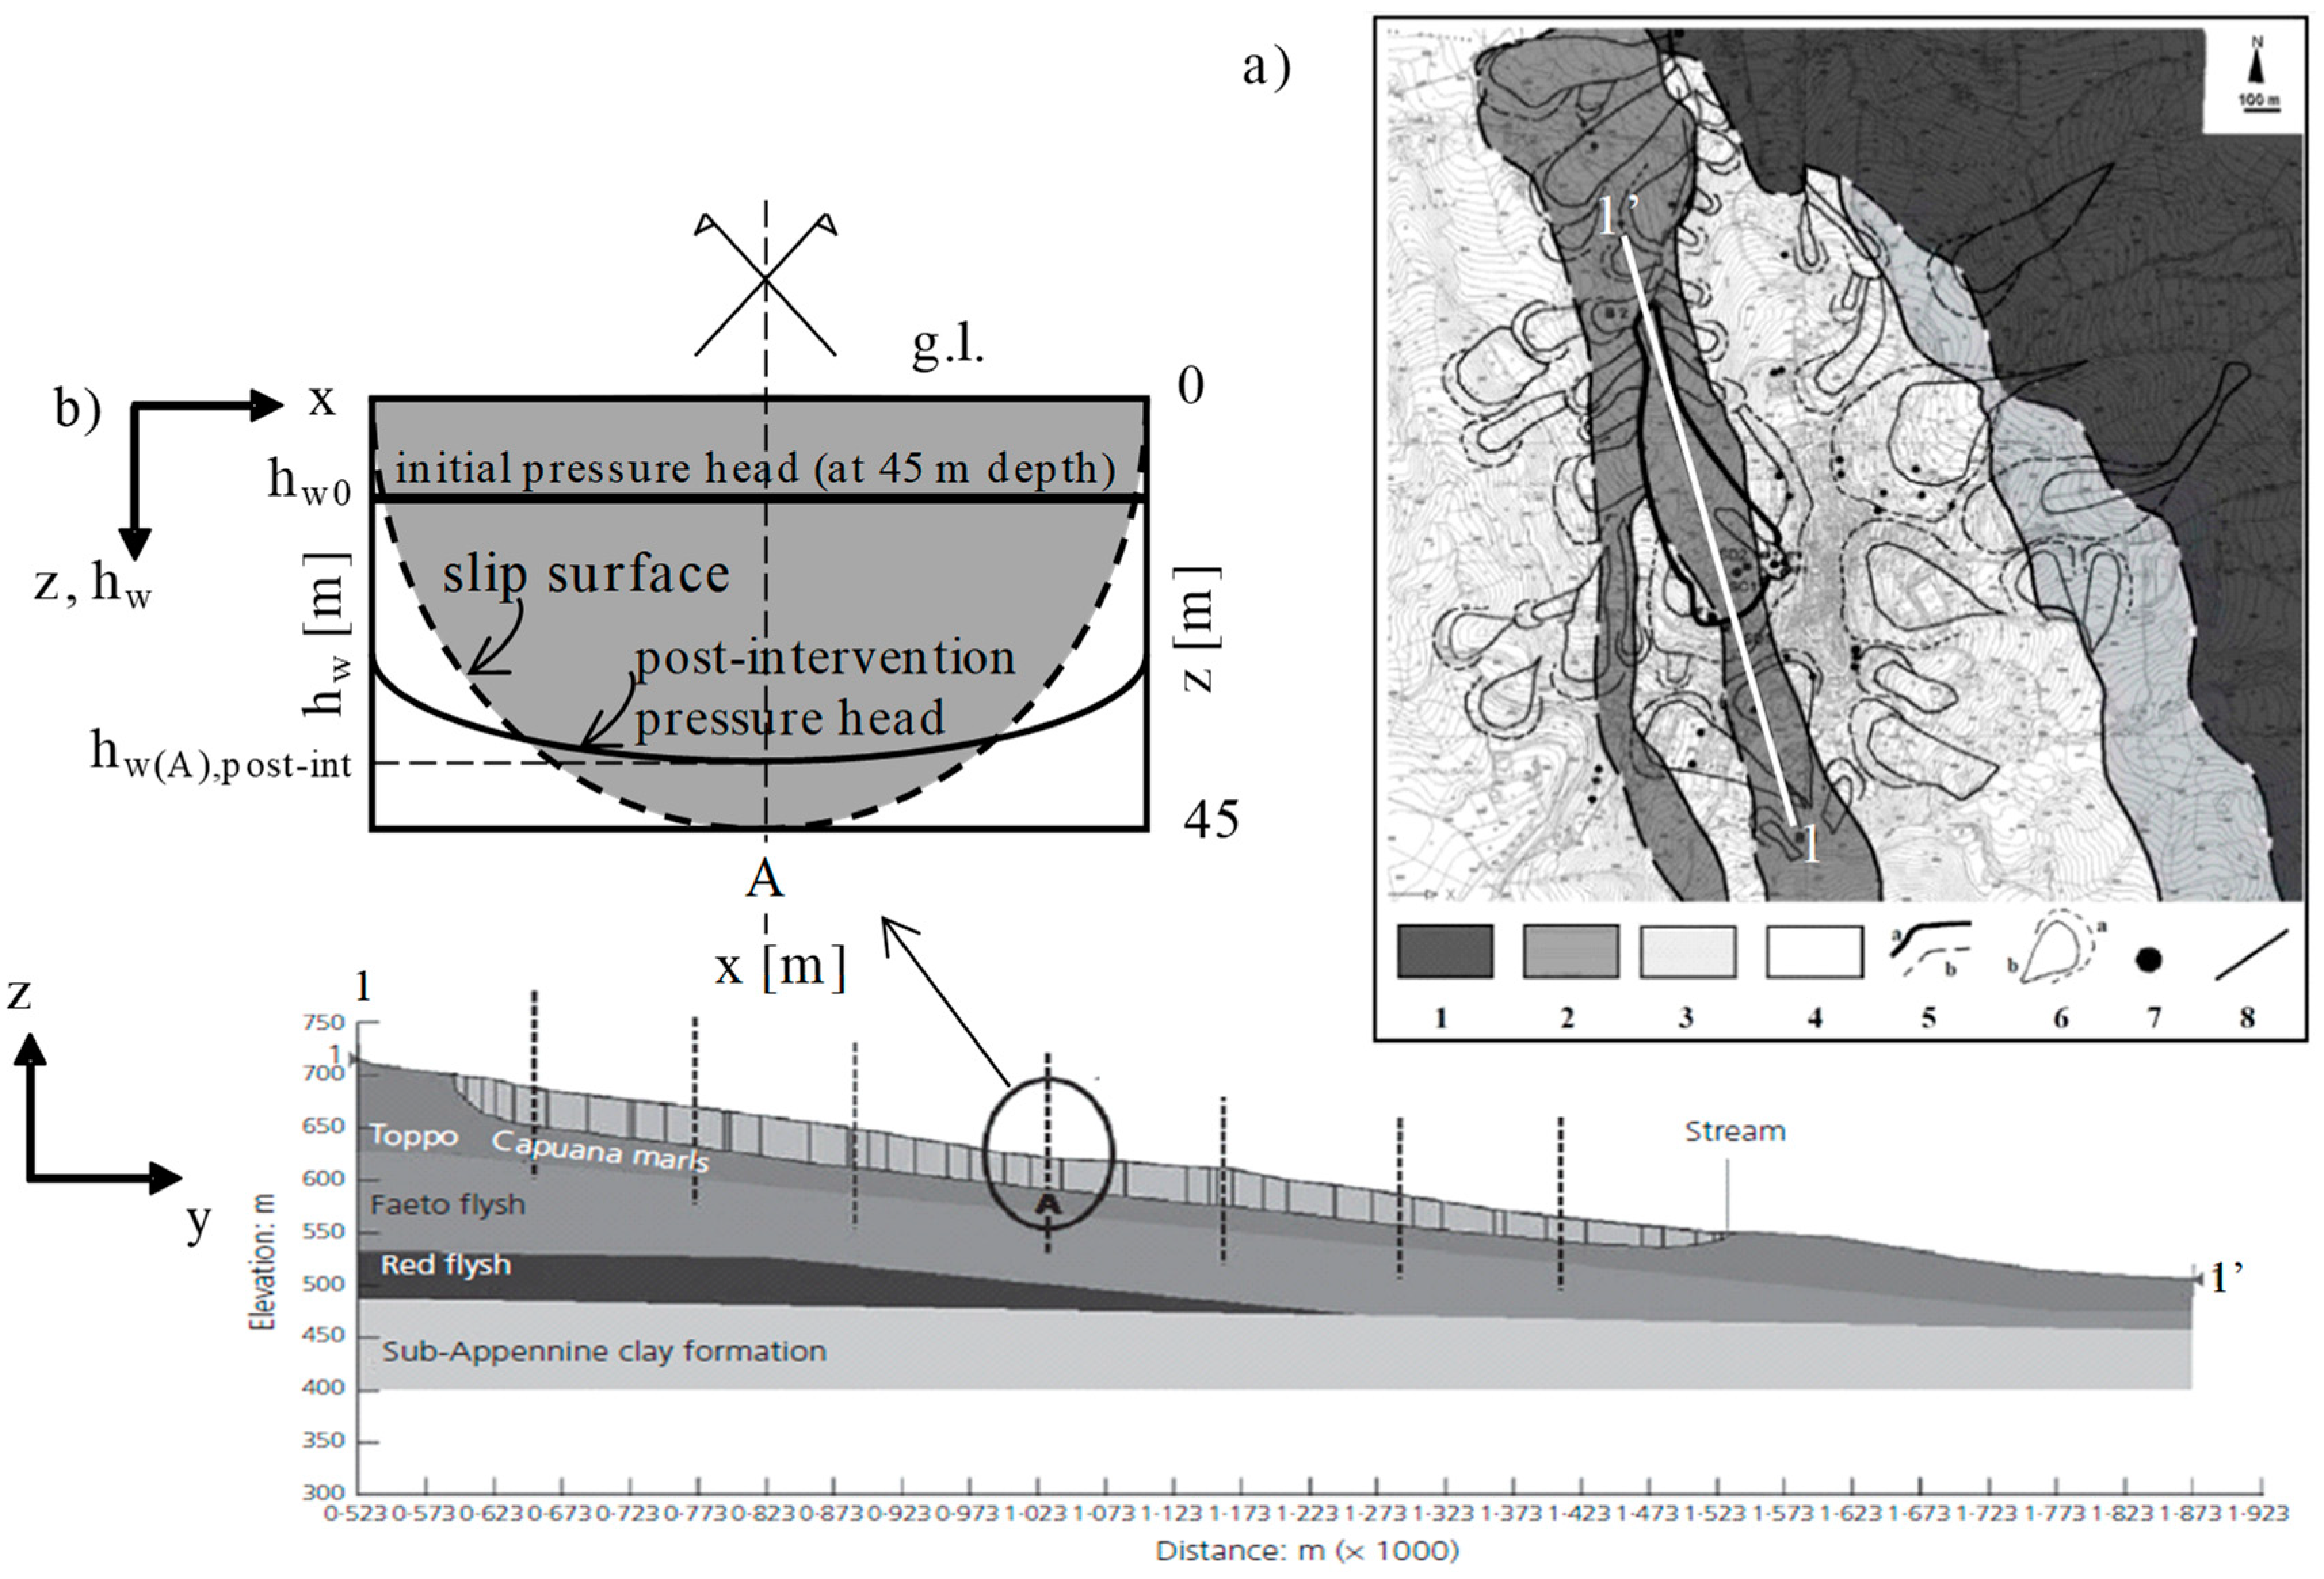
11] and accounting for the geometric features of the landslide bodies in the region, a system of longitudinal medium depth drainage trenches (
Figure 4a), of depth H
0 ranging between 12 and 22 m, is here proposed as a landslide mitigation technique, that conjugates mitigation efficacy, durability and sustainability. As field studies have led to recognize for most of the landslides in the pilot region a “bowl-shaped” slip surface, of the type sketched in
Figure 4a, the study aims at providing indications about the design of the drainage trenches to reduce the pore water pressures on a slip surface of such type. In the following, the results of finite element analyses of the transient seepage induced by the installation of systems of drainage trenches of different geometric and hydraulic parameters are discussed. The Fontana Monte landslide at Volturino has been selected as prototype landslide in the assessment of the stabilization efficacy of the deep drainage trench systems, discussed in the following (
Figure 8 [
30]). It is a M2 type active landslide, lying in a slope formed of fissured stiff clays, the Toppo Capuana clays, alternating with fractured rock layers. In the following, the analysis of the seepage through the slope after the installation of various drainage trench systems is presented. By comparing the piezometric heads post-installation “h
w” (after 5 years since the trench system setting up, see
Figure 8b) and the initial piezometric heads, “h
w0”, the efficiency E(t) of the trench system across the slope is discussed. Thereafter, the effects of the piezometric head reduction generated by the trench system, on the stability factor F of the Fontana Monte landslide (
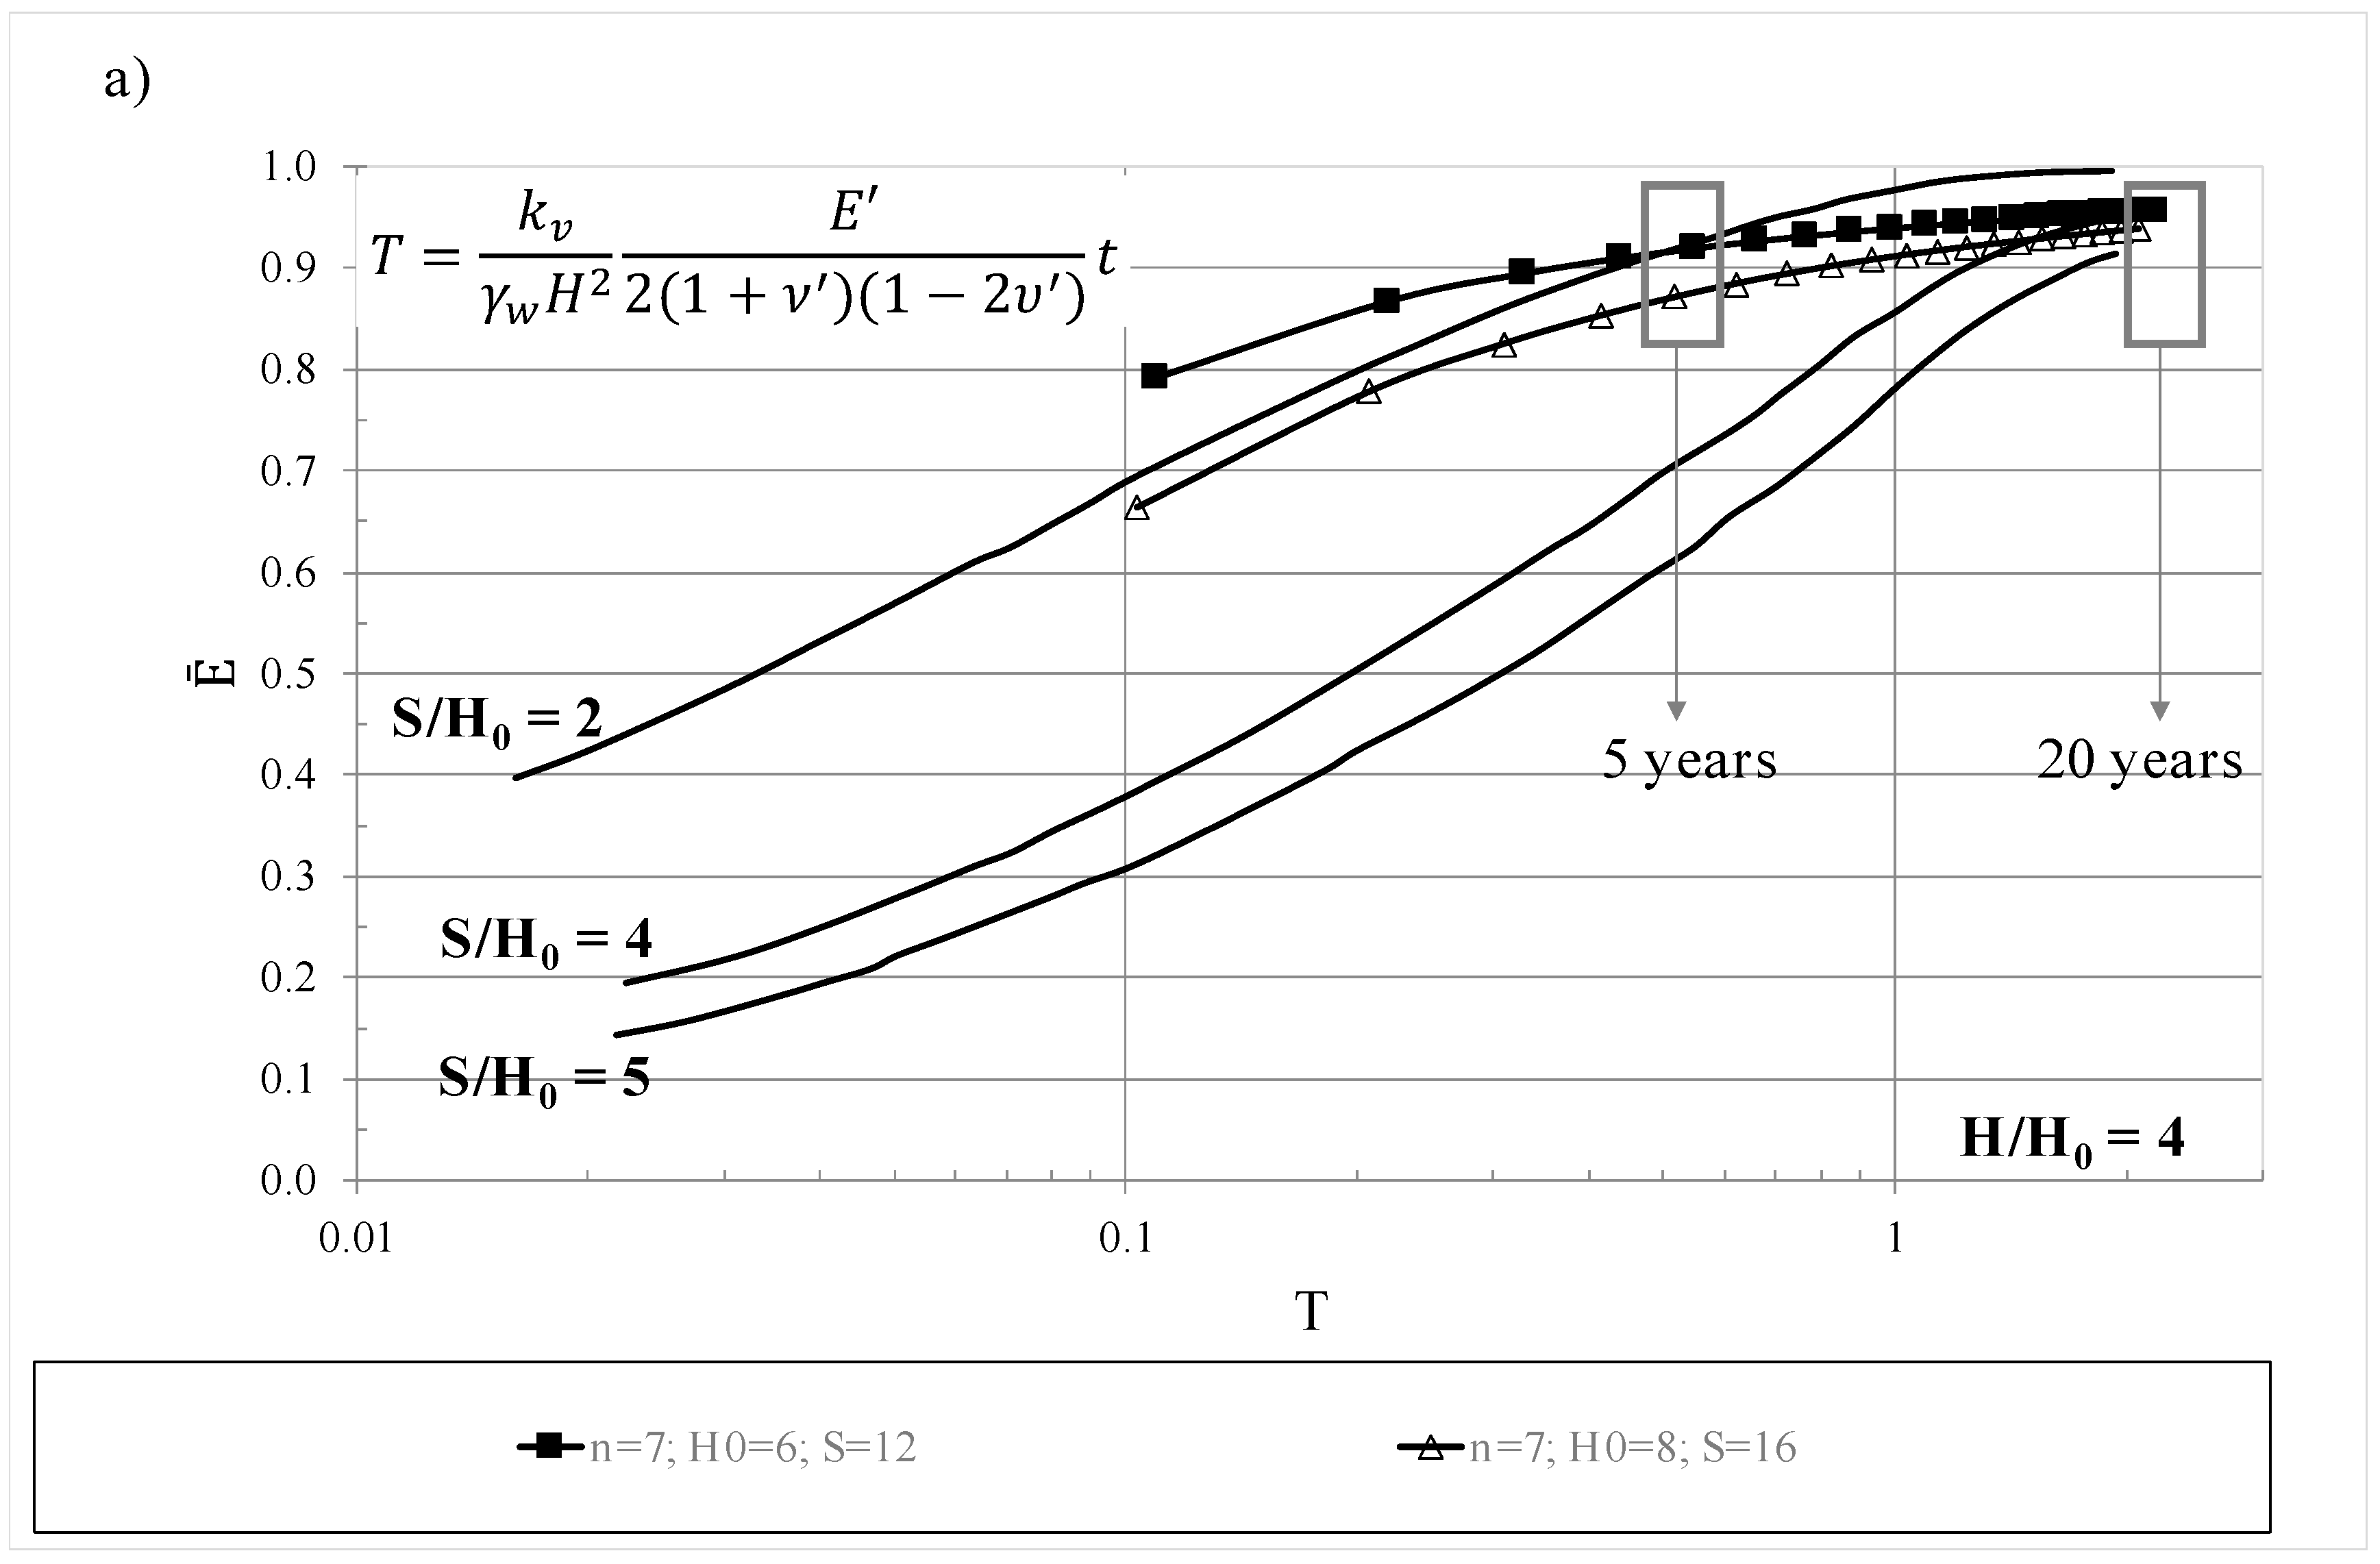
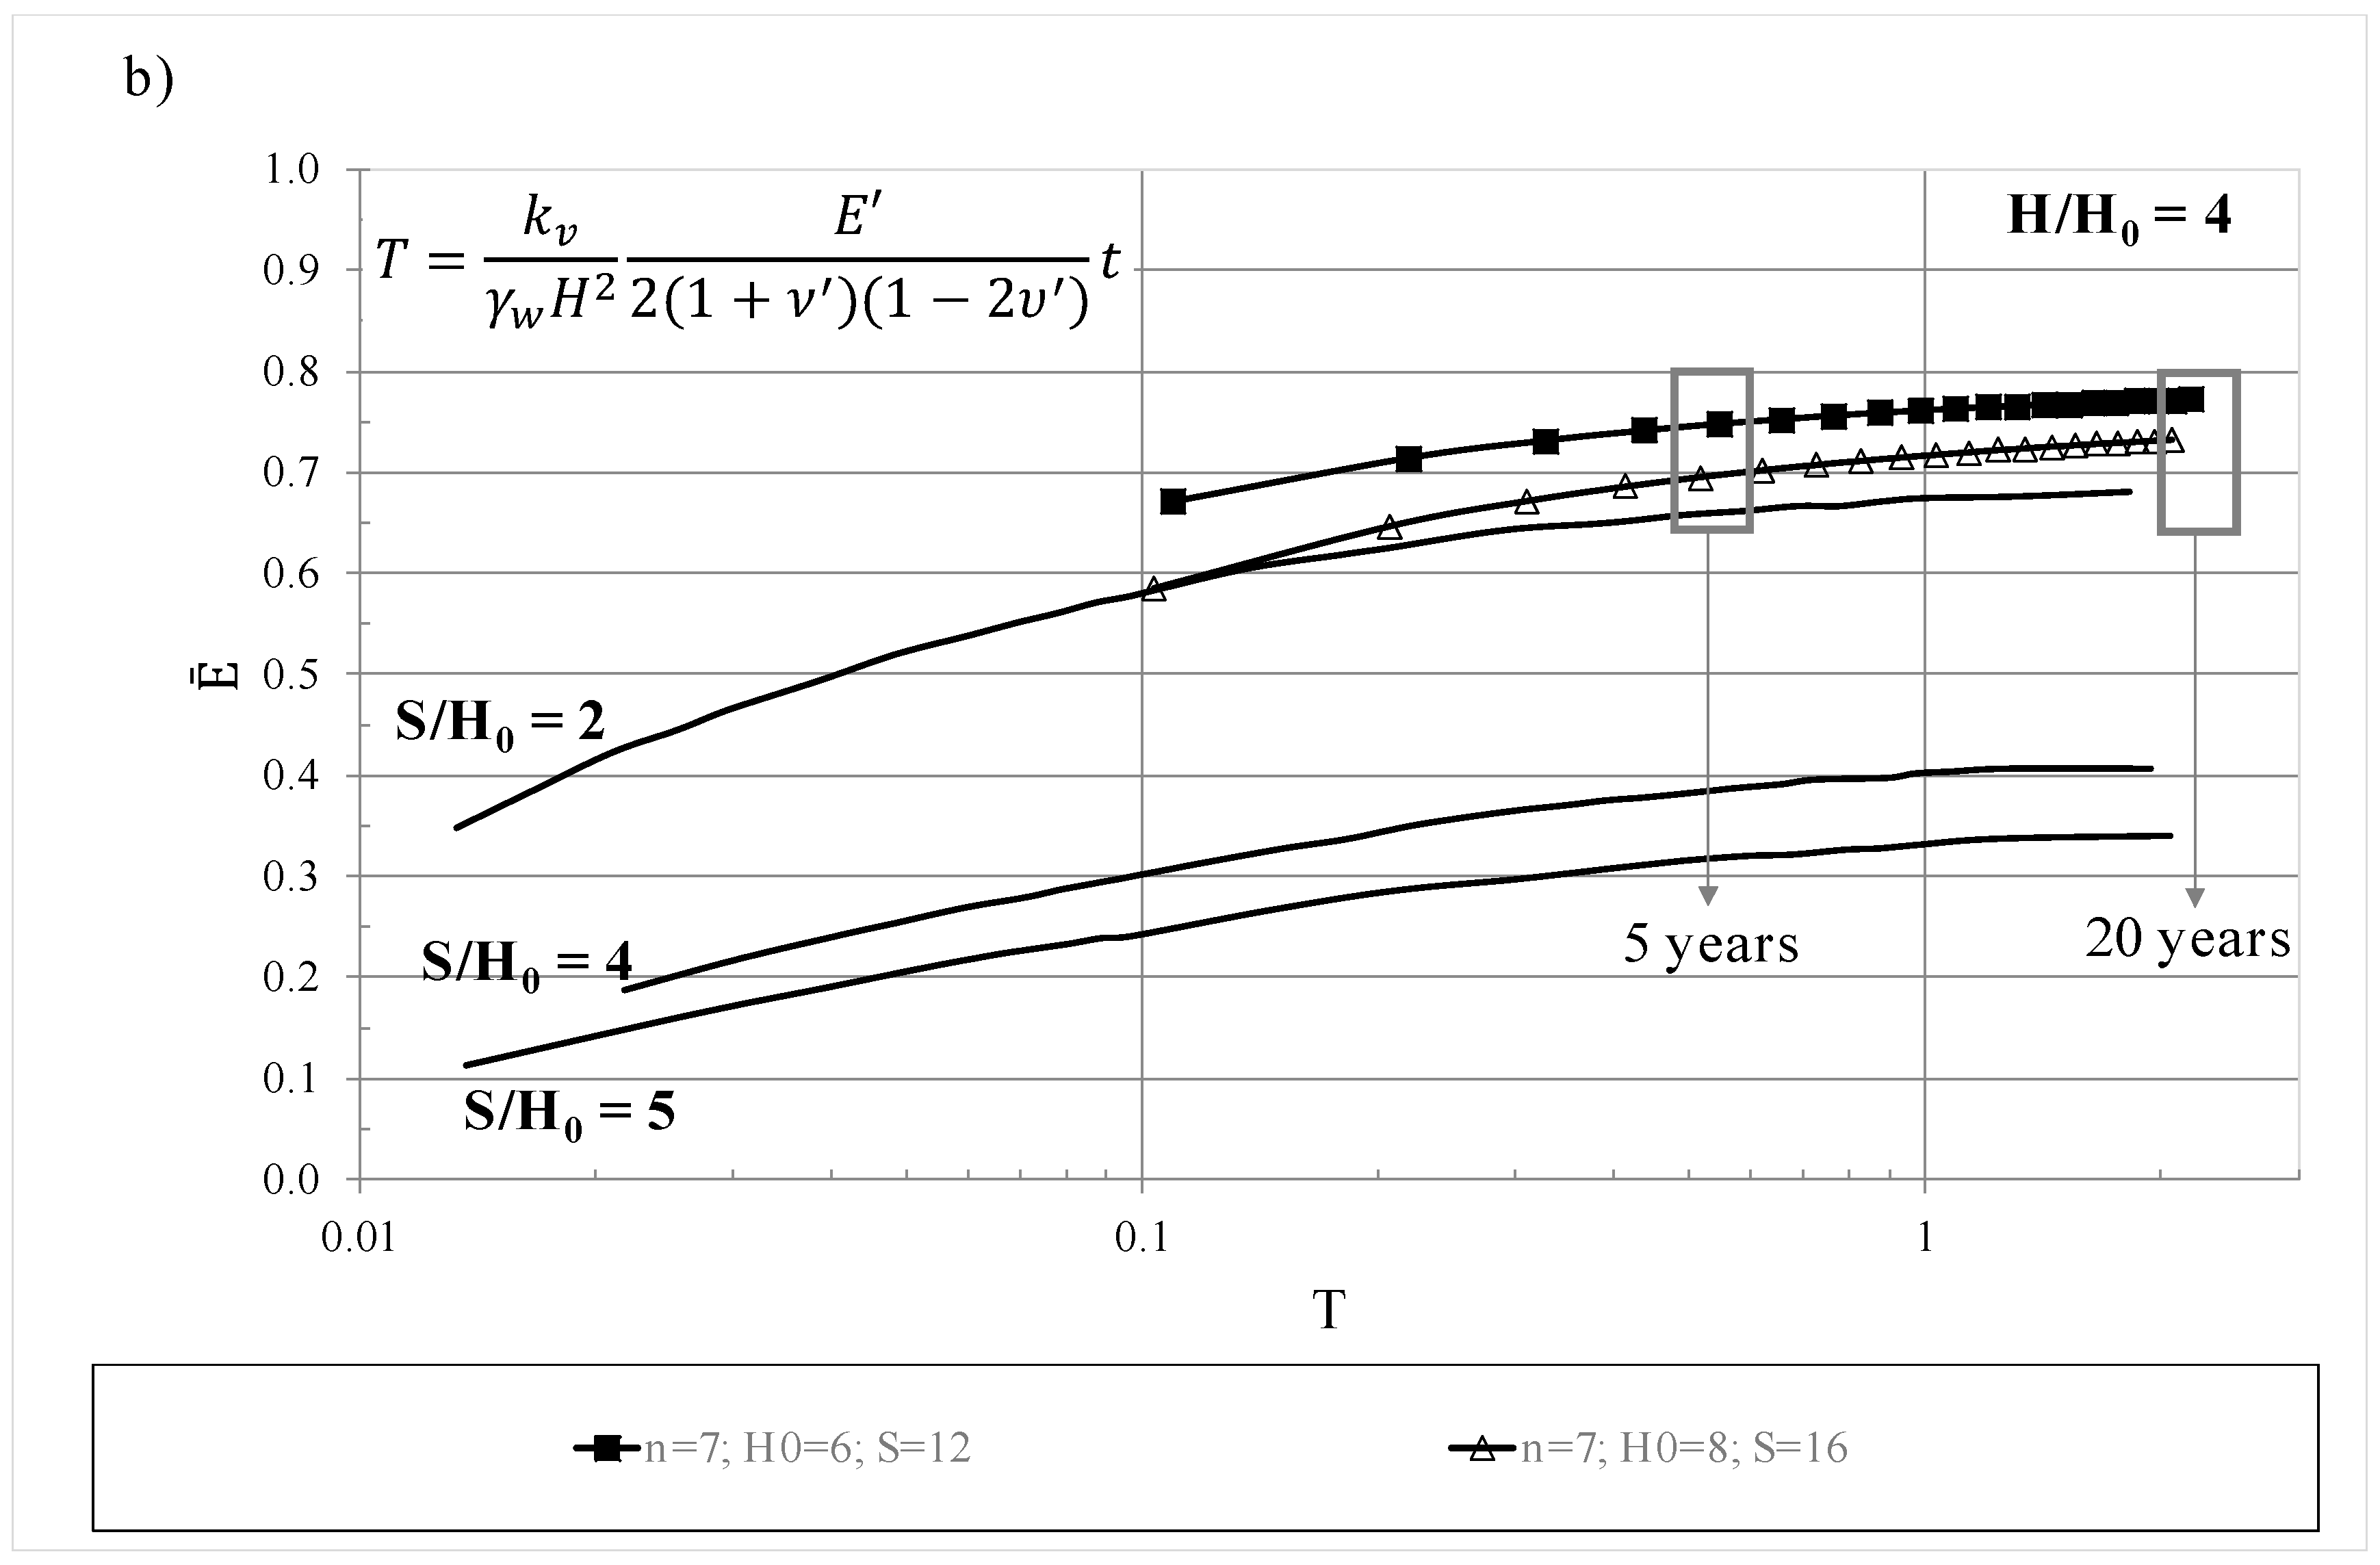
Figure 8b) are examined. As first, in the following, the calculation strategy of both E(t) and of the stability factor F, is presented.
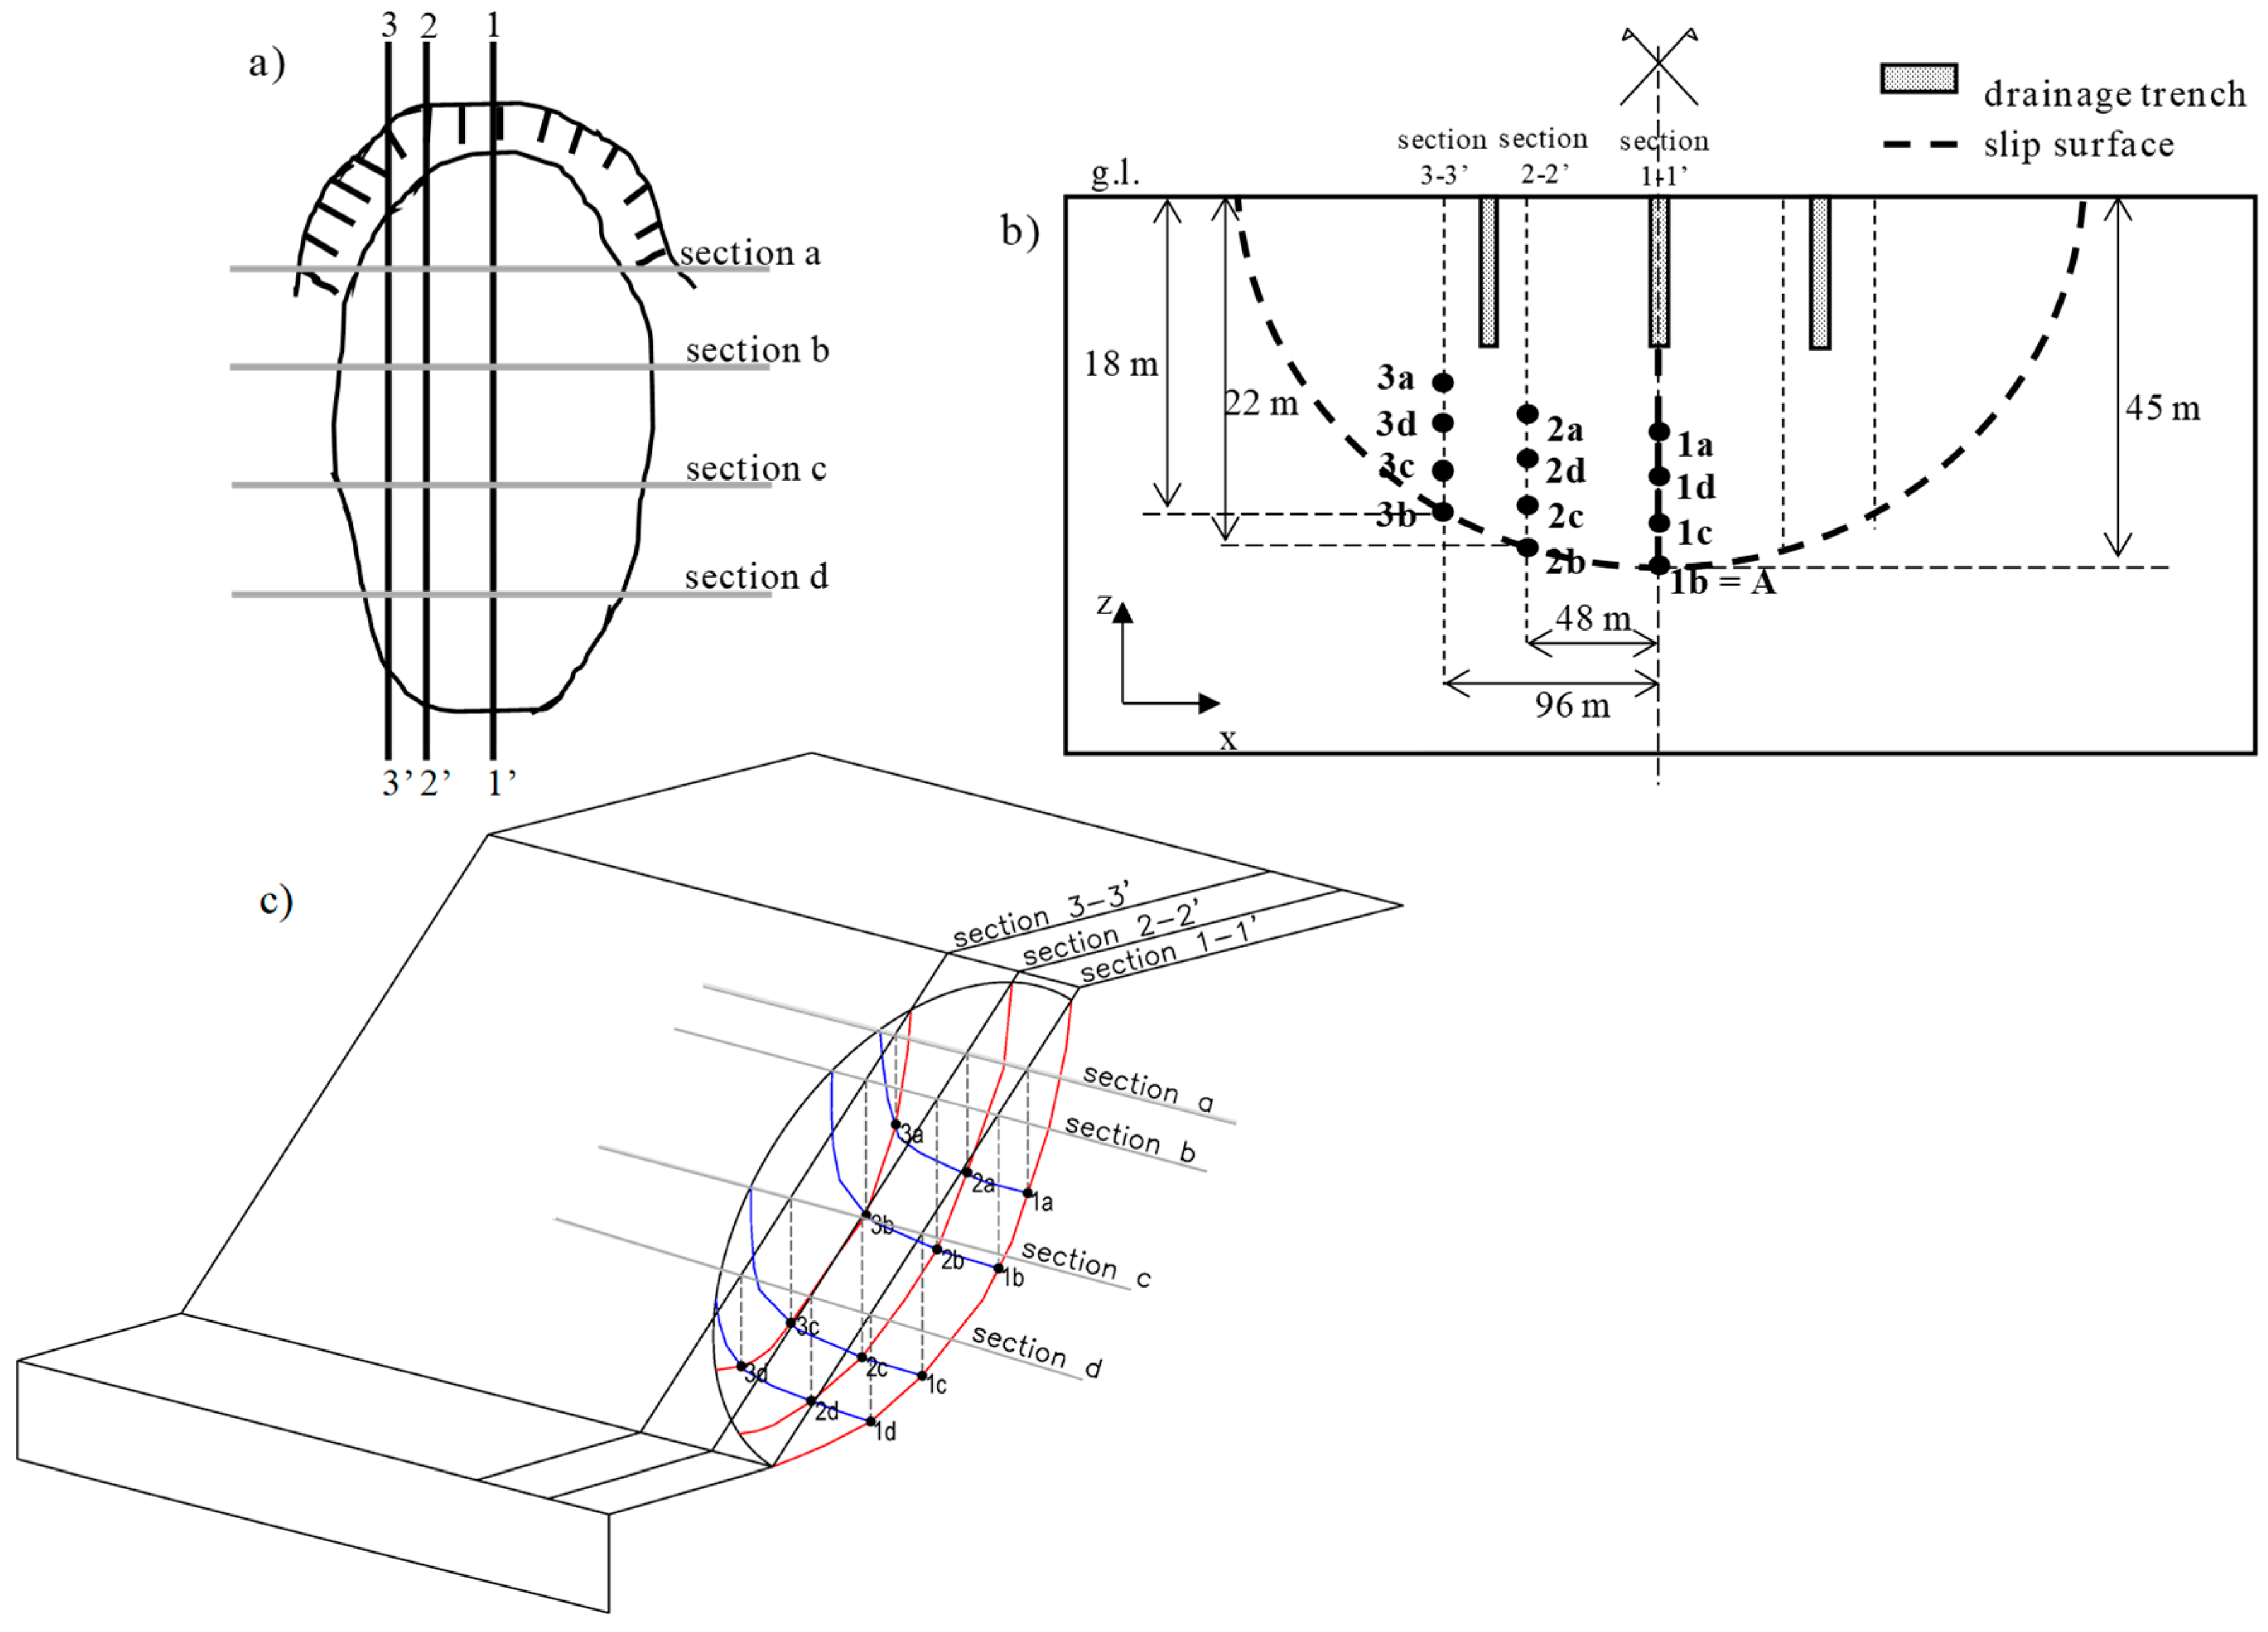
3. Calculation Strategy
The effect on the landslide body stability factor, F, of the installation of a drainage trench system has been derived through numerical calculations, following the procedure discussed hereafter, referring to the calculation model sketched in
Figure 9. As first, transient seepage analyses have been carried out, in two dimensions (2D), within the transversal section of the slope model, including the drainage trench system, shown in
Figure 9b. In the slope model in
Figure 9, the plane seepage in the transversal section is assumed to be the same in all the transversal sections: a, b, c, and d. Therefore, the piezometric heads, both before and after the installation of the trenches, have been calculated with reference to a single transversal section (
Figure 9b). The seepage analysis in such section has been carried out following the same procedure presented by Cotecchia et al. [
11]. According to such procedure, for each set of geometric parameters of the trench system (number of trenches n, depth of the trenches H
0, distance between the trenches S), the value of the piezometric head reduction after 5 years since the installation of the system has been determined across the whole section. Therefore, from such seepage analysis, the piezometric head reductions along the slip surface shown in
Figure 9c could be derived. Thereafter, the safety factor of the landslide body has been evaluated through the limit equilibrium method for three longitudinal sections: 1-1′, 2-2′, and 3-3′ in
Figure 9. In the prototype transversal section (
Figure 9b), section 2-2′ and section 3-3′ are located at 48 m and 96 m from the central axis (i.e., from section 1-1′), respectively.
To such aim, for section 1-1′, the piezometric head reduction at points 1a, 1b, 1c, and 1d in
Figure 9c were derived from the seepage analysis at the corresponding points in the transversal section shown in
Figure 9b. The piezometric heads along the longitudinal section between these four points have been assumed to vary linearly. The same procedure was used also for both sections 2-2′ and 3-3′.
In the following, the pore water pressure reductions generated by the trench system are presented in terms of the hydraulic efficiency E(t) = [1 − h
w(t)/h
w0] [
16,
31], where h
w(t) is the pressure head varying with consolidation after the trench installation at time t, h
w0 is the initial pressure head, and Ē(t) is the average value over a horizontal segment of 15 m including the numerical point. In particular, in the following the discussion will focus on the Ē(t) values calculated for point A (
Figure 9b), with reference to different trench systems. Point A (i.e., point 1b in
Figure 9c), represents the deepest point of the slip surface, at z = 45 m depth, therefore the point where the piezometric head reduction is minimum. Therefore, the E(t) in A is the minimum possible on the slip surface (
Figure 9c). The safety factors for the longitudinal sections 1-1′, 2-2′, and 3-3′, were derived using the limit equilibrium method [
32]; in particular, the morphology and the geotechnical parameters of the Fontana Monte landslide body were accounted for in such analyses (
Figure 8), as discussed later in the paper. The increase in safety factor, F, is discussed for different trench systems.
It is worth clarifying that the use of the here explained approach to the assessment of the slope stability, both before and after the intervention, is rather simple (e.g., it disregards a probabilistic analysis), because the values of the stability factor for the three sections represent just a mean for comparison of the increment of the degree of stability of the landslide body, achieved with the trench system installation.
4. Analysis of the Transversal Seepage Determined by the Drainage Trench System
Ē(t) has been calculated at any point of the transversal section, through 2D seepage analyses (
Figure 9b), for five after the activation of the drainage trenches. It is assumed to coincide with the Ē(t) in the slope, assuming that the influence on Ē(t) on the component of the flow rate normal to the transversal section can be disregarded, according to Stanic [
13] and as done previously in a similar calculation by Cotecchia et al. [
11].
The numerical FE modeling of the seepage in the transversal section (
Figure 9b) was carried out with reference to the mesh shown in
Figure 10. In the numerical model, the trenches have been simulated as rectangular clusters of 1 m width, filled with a coarse-grained soil of low retention capacity (
Figure 11).
In
Figure 10, a prototype system is shown, made of three trenches (n = 3); the mesh is coarser at the bottom of the model and finer in the upper part, discretized by means of 18000, 4-noded quadrilateral elements, with four Gauss points, and 18,281 nodes. The drainage in each trench has been guaranteed by setting zero pore water pressure at the base level of the trench and applying the water retention function and the permeability function of a coarse soil filling the trench.
The section of a slip surface with the seepage plane is also shown in
Figure 10, where point A represents the deepest point of the slip surface (see also point 1b in
Figure 9c).
In the 2D FE seepage model, the ground surface is assumed to be horizontal and the hydraulic properties of the slope soil, where the trenches are installed, are set to be uniform. The numerical modeling has been carried out by means of the finite element code Seep/w [
32] that allows for a full numerical integration of the Richards’ equation:
Assuming partially saturated conditions for the soil above the water table. h
w is the pore water pressure head, and θ = S n is the volumetric water content, where S is the degree of saturation and n is the porosity. The modeling has implemented the soil water retention curve (WRC), θ(s) (where s is the soil suction, equal to (h
w γ
w) < 0), and the soil hydraulic conductivity function, K(s), which has been assumed to be related to θ(s) according to Mualem [
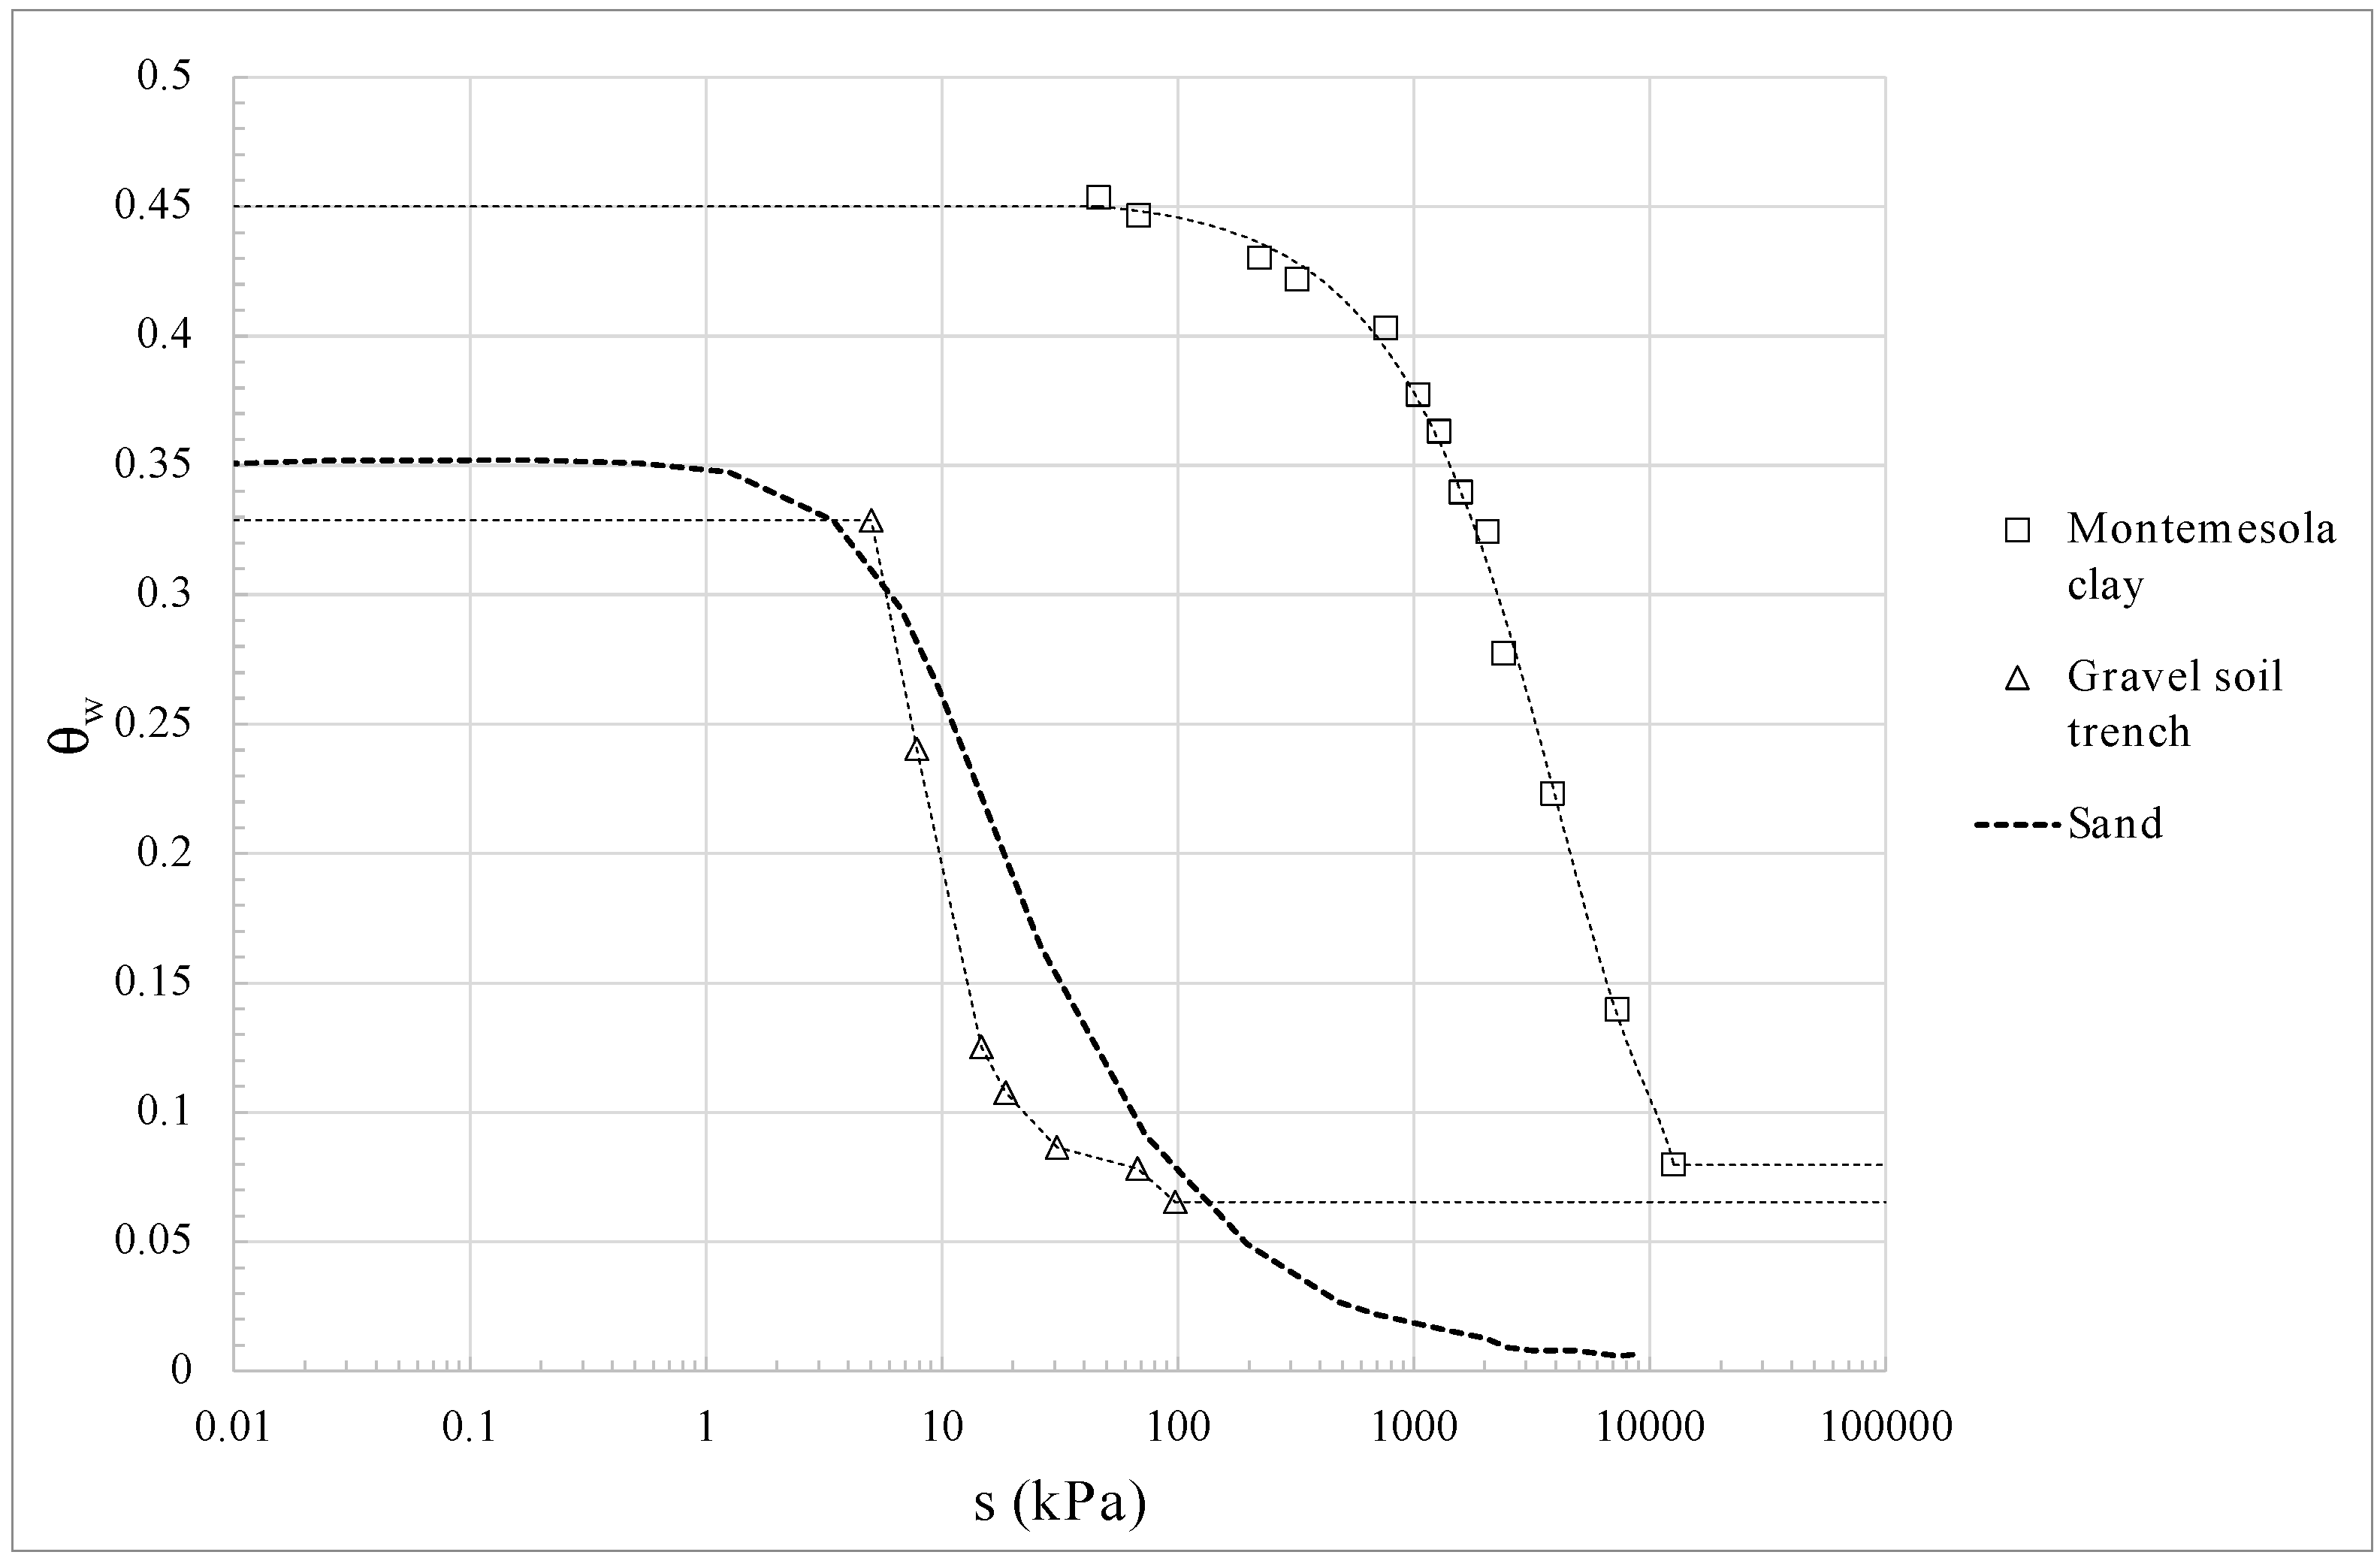
33]. For θ(s), the adopted WRCs refer to interpolation of laboratory test results, as shown in
Figure 11, whereas for K(s), the expression from Mualem-Van Genuchten [
34] has been adopted. In particular, the WRC used for the clay was derived from experimental laboratory tests, carried out by Cafaro & Cotecchia, 2001 [
35], on an unfissured high retention overconsolidated clay, whereas the WRC of the soil in the trenches has been taken as that typical for gravel [
14]. In
Figure 11, the WRC of the two soils, clay and gravel, used in the model are compared with the WRC measured for a silty sand by Bottiglieri et al. [
36]. For the permeability of the saturated clay, a value representative of the “field clay permeability”, which is about K
sat = 1 × 10
−9 m/s, has been adopted, following what already done with reference to the Fontana Monte slope by Lollino et al. [
30] and Cotecchia et al. [
11]. Both the high retention capacity and the very low permeability of the clay implemented in the model are to be considered conservative in the assessment of the efficiency of the drainage system [
10].
Initial hydrostatic conditions with water table at 3 m depth below g.l., representative of winter conditions, have been set in the analyses [
11]. At the lateral boundaries of the model, a constant hydraulic head (hydrostatic condition) has been assigned, h
w = h
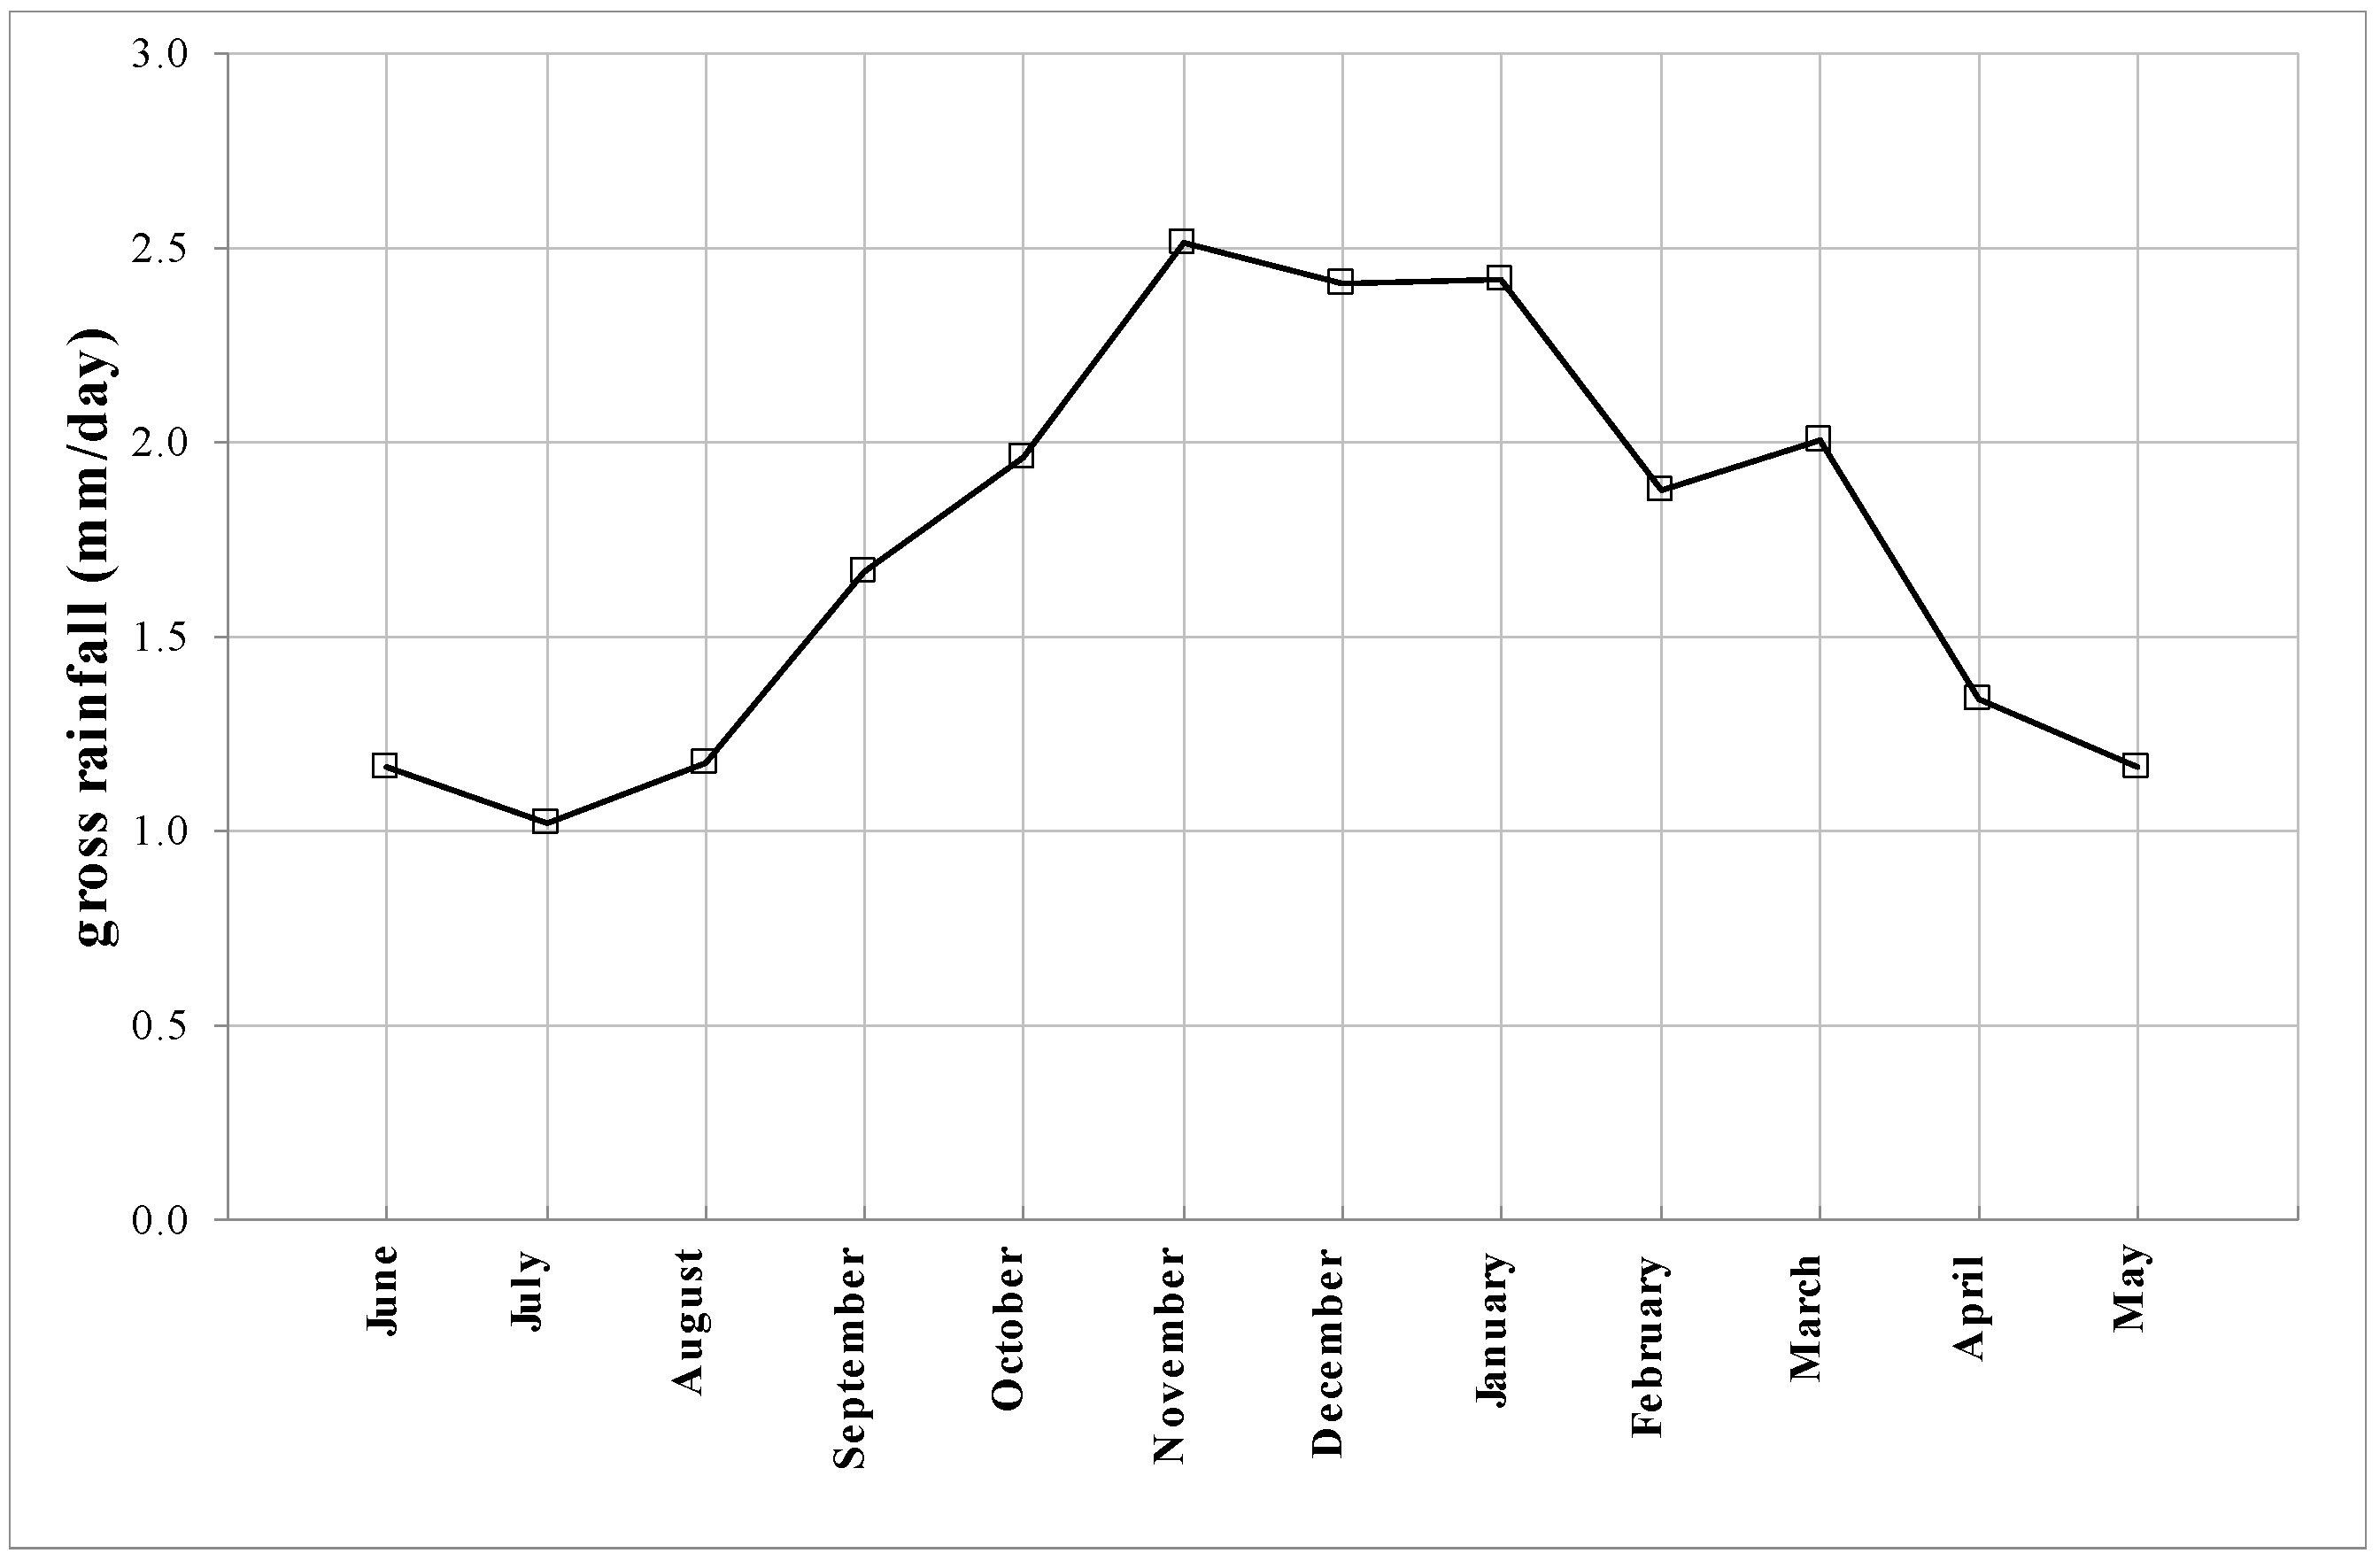
w0, which represents the most conservative boundary condition for the drainage efficiency; the lower boundary has been set as impervious. At the ground level, the boundary condition has been set as a specific flow rate q(t), variable over time according to the rainfall regime of the Fontana Monte slope. Such flow rate has been set constant over each month of the year and equal to the mean value of the monthly rainfall, which has been derived from the database of the monthly rainfalls recorded at the meteorological station of Volturino in the period 1972 to 2009 (
Figure 12). Both evapotranspiration and surface runoff have not been accounted for in the seepage analyses [
19], so that an overestimated water supply has been assumed.
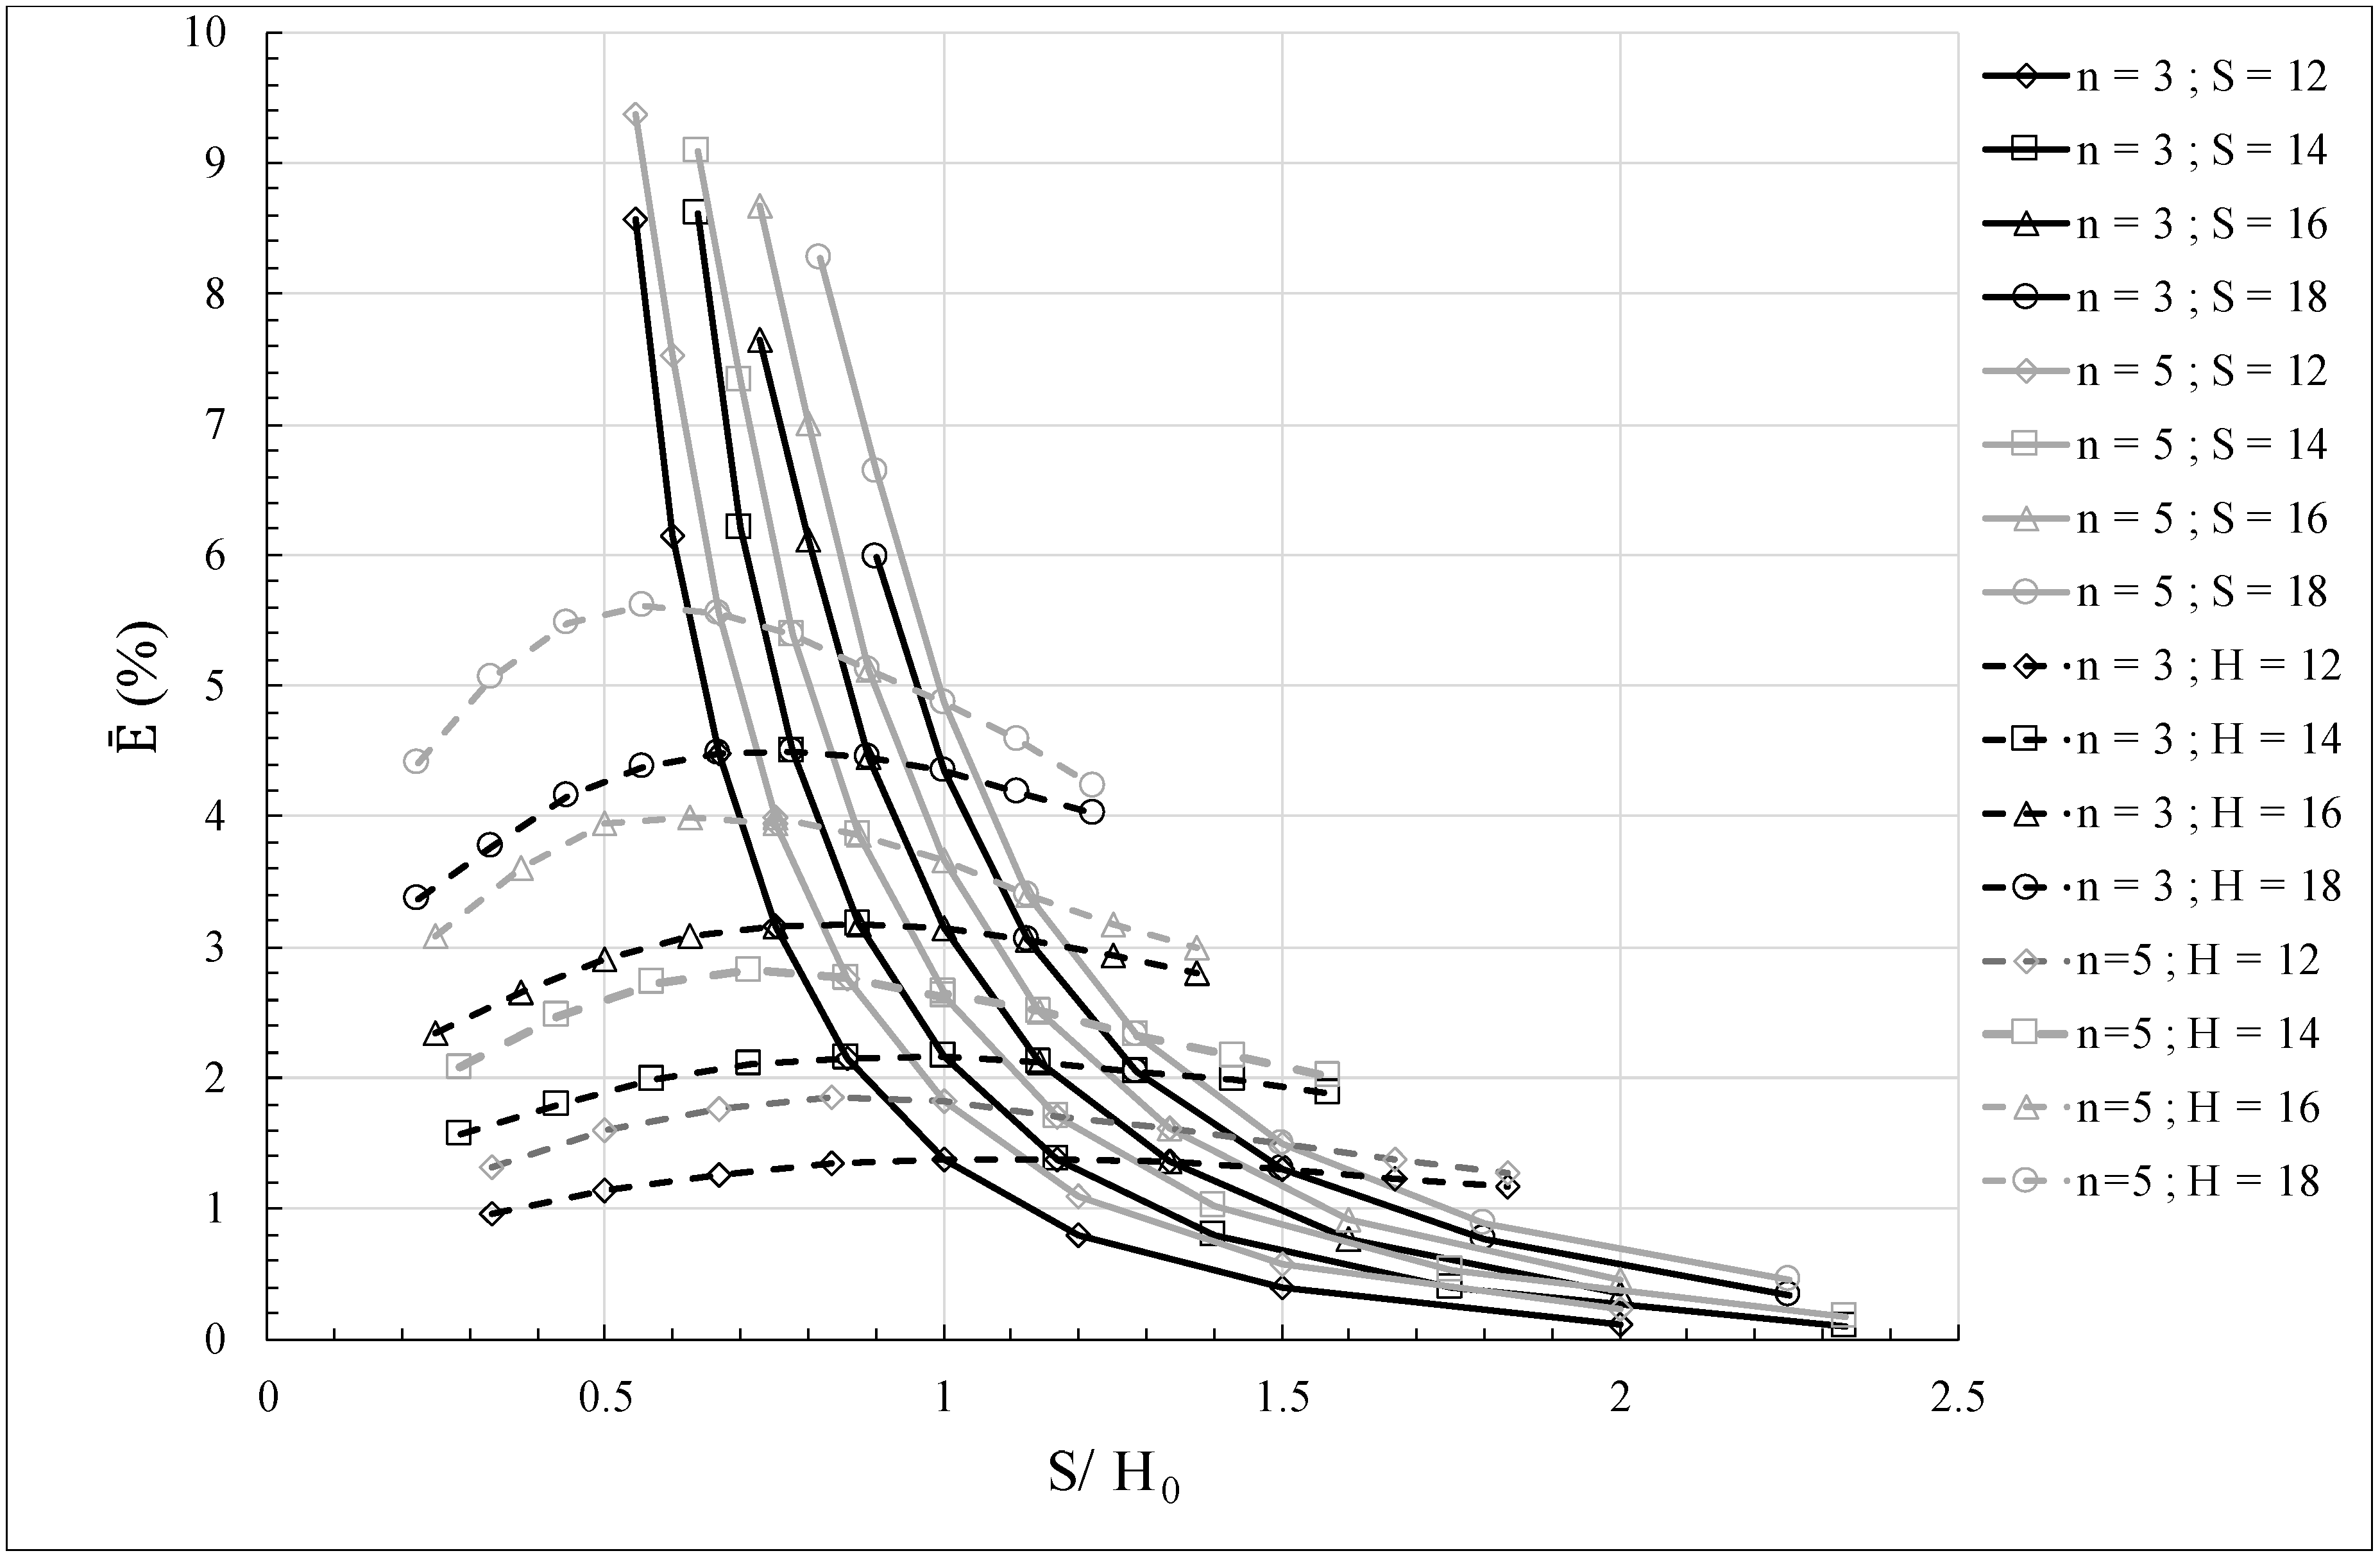
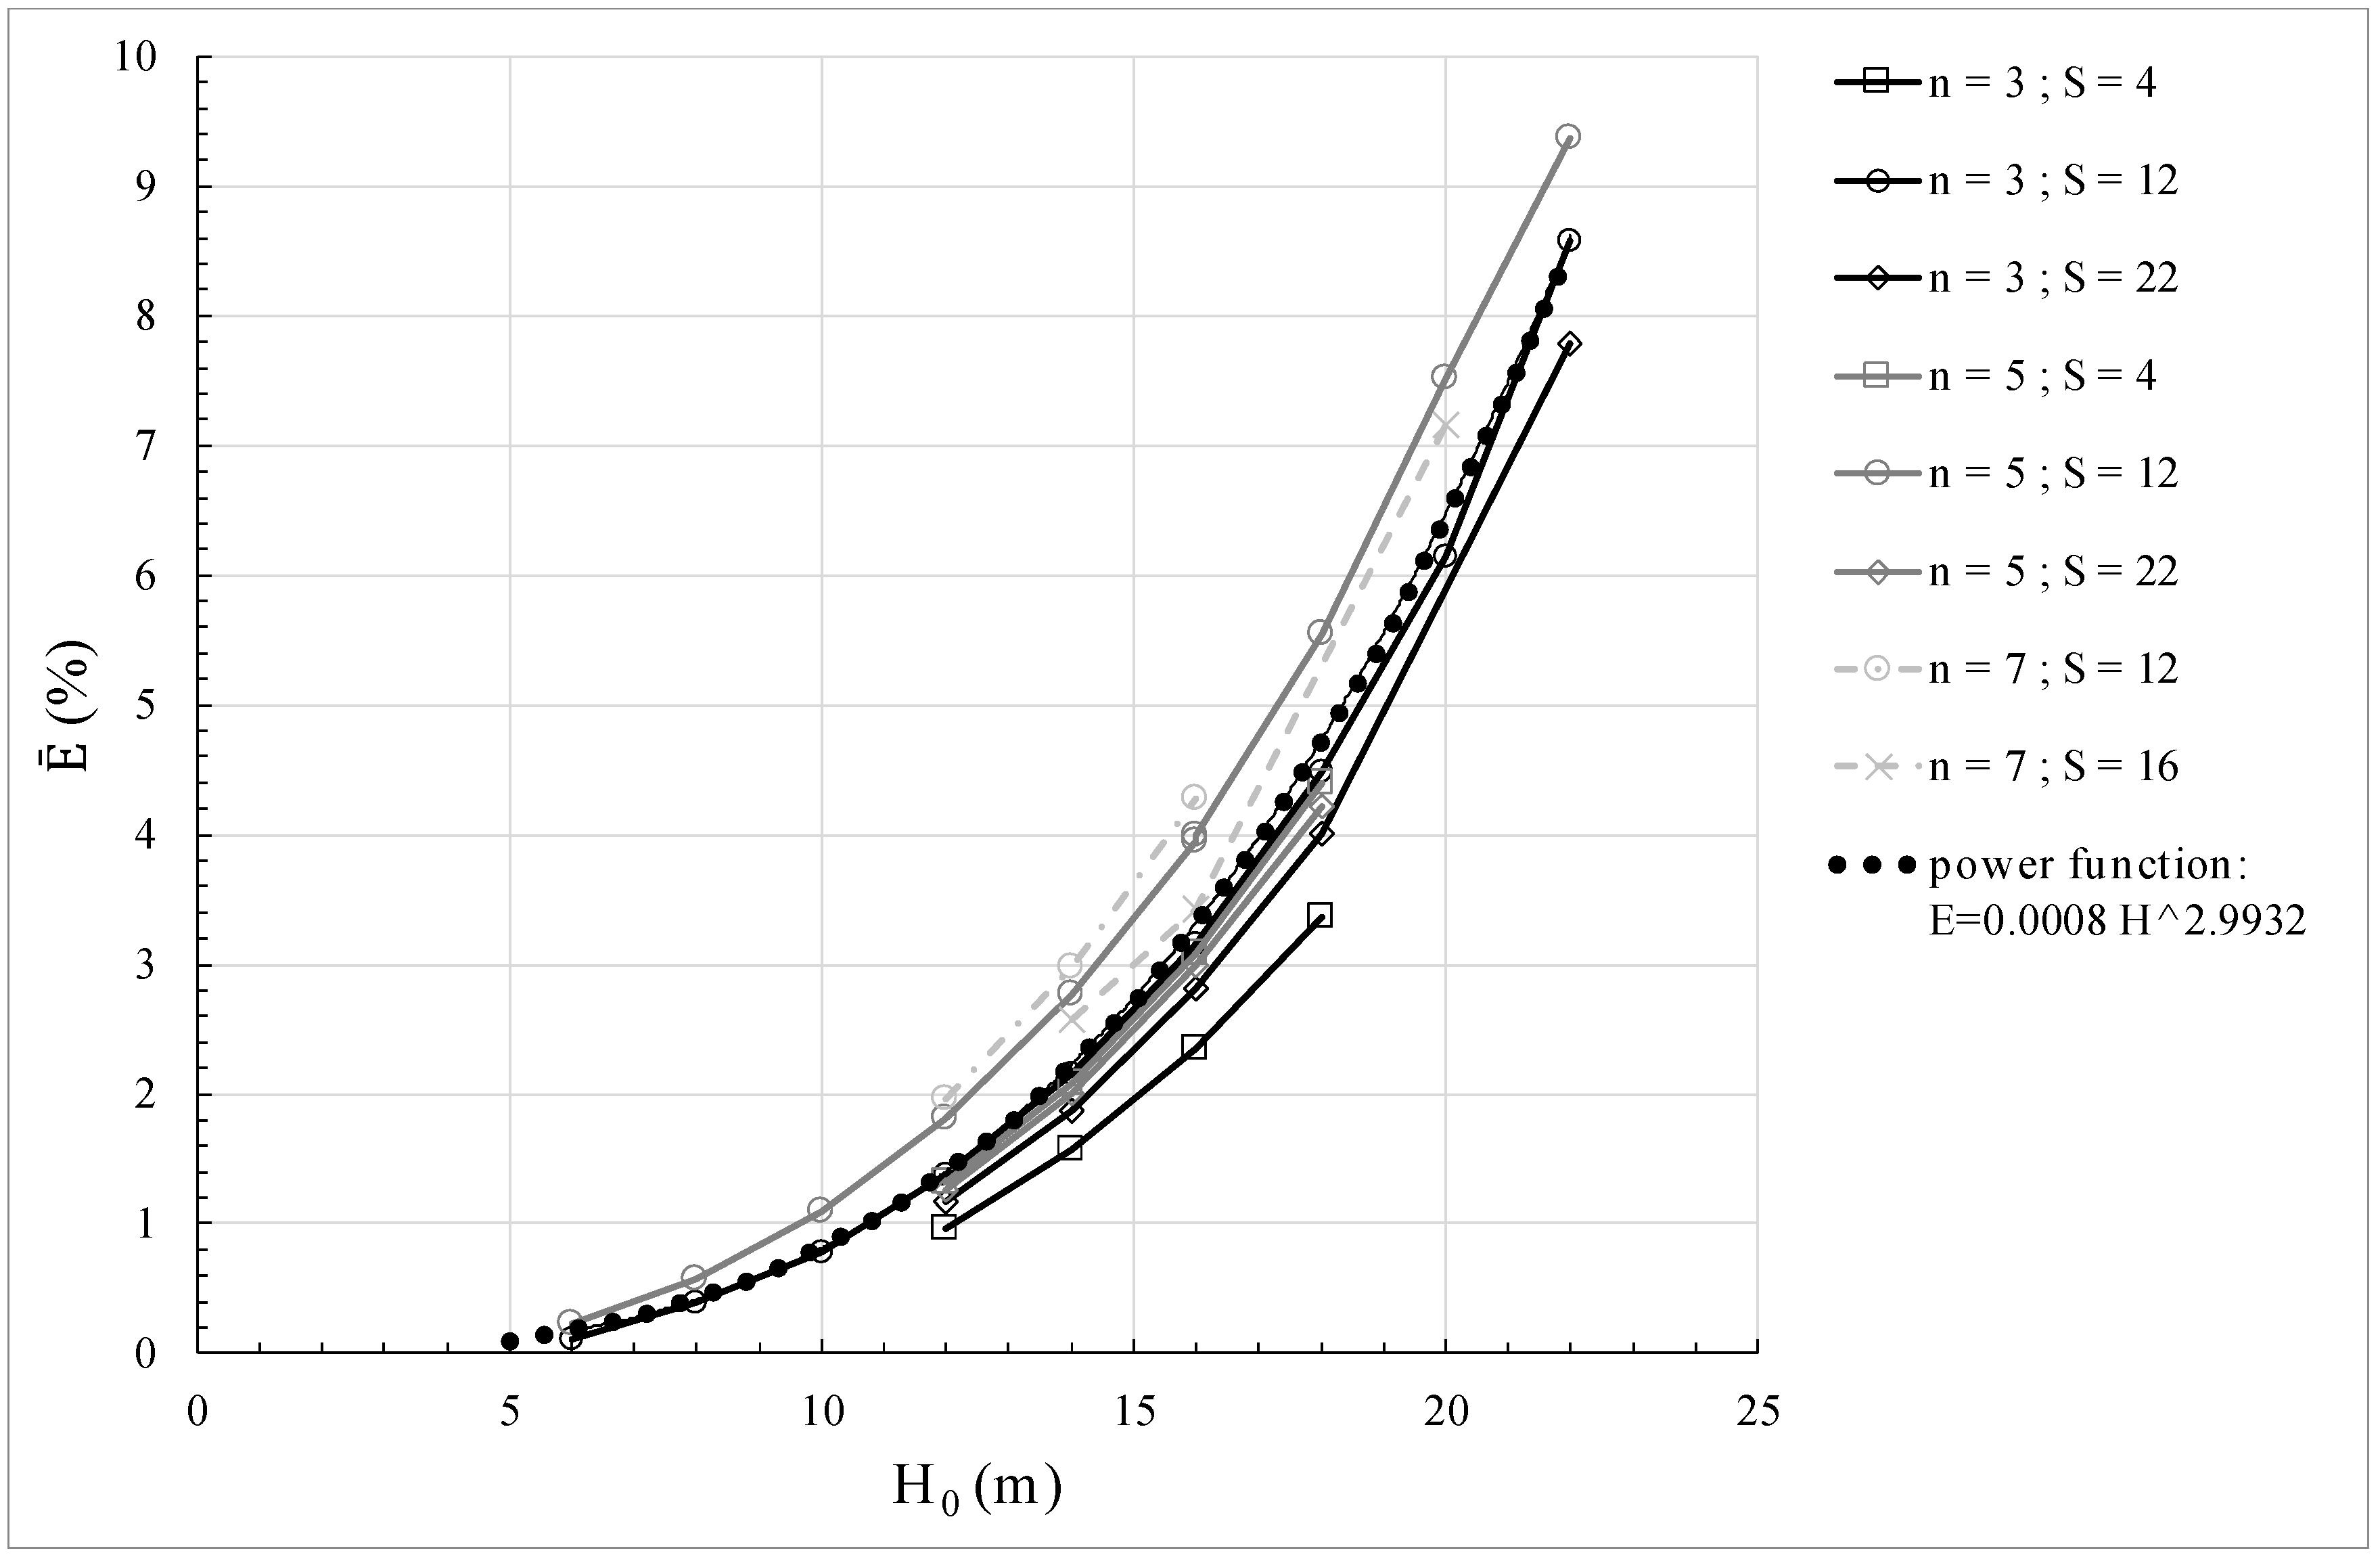
Figure 4 shows the results of the analyses carried out for trench systems of different n, of depth H
0 = 12 m and spacing S of either 13 m or 22 m. The figure reports the pressure heads, h
w, predicted after 5 years of consolidation along a horizontal plane located at 45 m depth. The different curves in the figure refer to systems of different S/H
0, but for constant H
0 = 12 m.
Figure 4 reports also the initial h
w0 at 45 m depth, assumed to be constant as for a hydrostatic initial condition in the section. The “necklace” shape of the h
w–x curves corresponds to the group effect cited in the introduction and suggests that, at depth, the drainage trench system generates a piezometric head drop that varies with x and is maximum below the center of the trench system, at x = 0 (point A of
Figure 9 and
Figure 10). Furthermore, the results show that the piezometric head at large depth is controlled not only by the S/H
0 ratio, but also by the global width ΣS of the trench system, and consequently by the number of the trenches n. The h
w drop, highest below the center of the trench system, suggests that with landslides of bowl-shaped slip surface, centering the trench system with respect to the landslide body longitudinal section optimizes the stabilizing effect of the system, as shown in
Figure 9 and
Figure 10. In this way, the deepest portion of the sliding surface benefits from the maximum h
w drop determined by the drainage system. The h
w drop along the lateral portions of the slip surface is higher than in the central portion because these are shallower.
The h
w (x, z) determined by the trench system is the input of the stability analysis, resulting in the stability factor F:
where τ
f is the shear strength available on the slip surface; τ
m is the mobilized shear strength; c′ and φ′ are, respectively, the cohesion intercept and the friction angle; σ is the total normal stress; and u = γ
w h
w is the pore water pressure.
6. Effect of the Drainage Trench System on the Landslide Stability Factor
The stabilizing effects of the different drainage trench systems are discussed in the following by implementing the results of the seepage analyses, presented above, in 2D limit equilibrium analyses (LE, [
32]) according to the procedure discussed in section 3 (
Figure 9). Such LE analyses have been performed making reference to the Fontana Monte landslide body [
30,
37] as prototype landside to be stabilized, adopting the Morgenstern & Price [
38] (code Slope/w [
32]). Both the map and one of the sections of the landslide are shown in
Figure 19. F has been assumed to be 1 before the installation of the drainage trench system and the mobilized strength parameters c′
m–φ′
m have been derived, accordingly. c′
m and φ′
m have been then used in the LE calculation for the section 1-1′, 2-2′, 3-3′ in
Figure 19, to derive F after 5 years since the trench system installation.
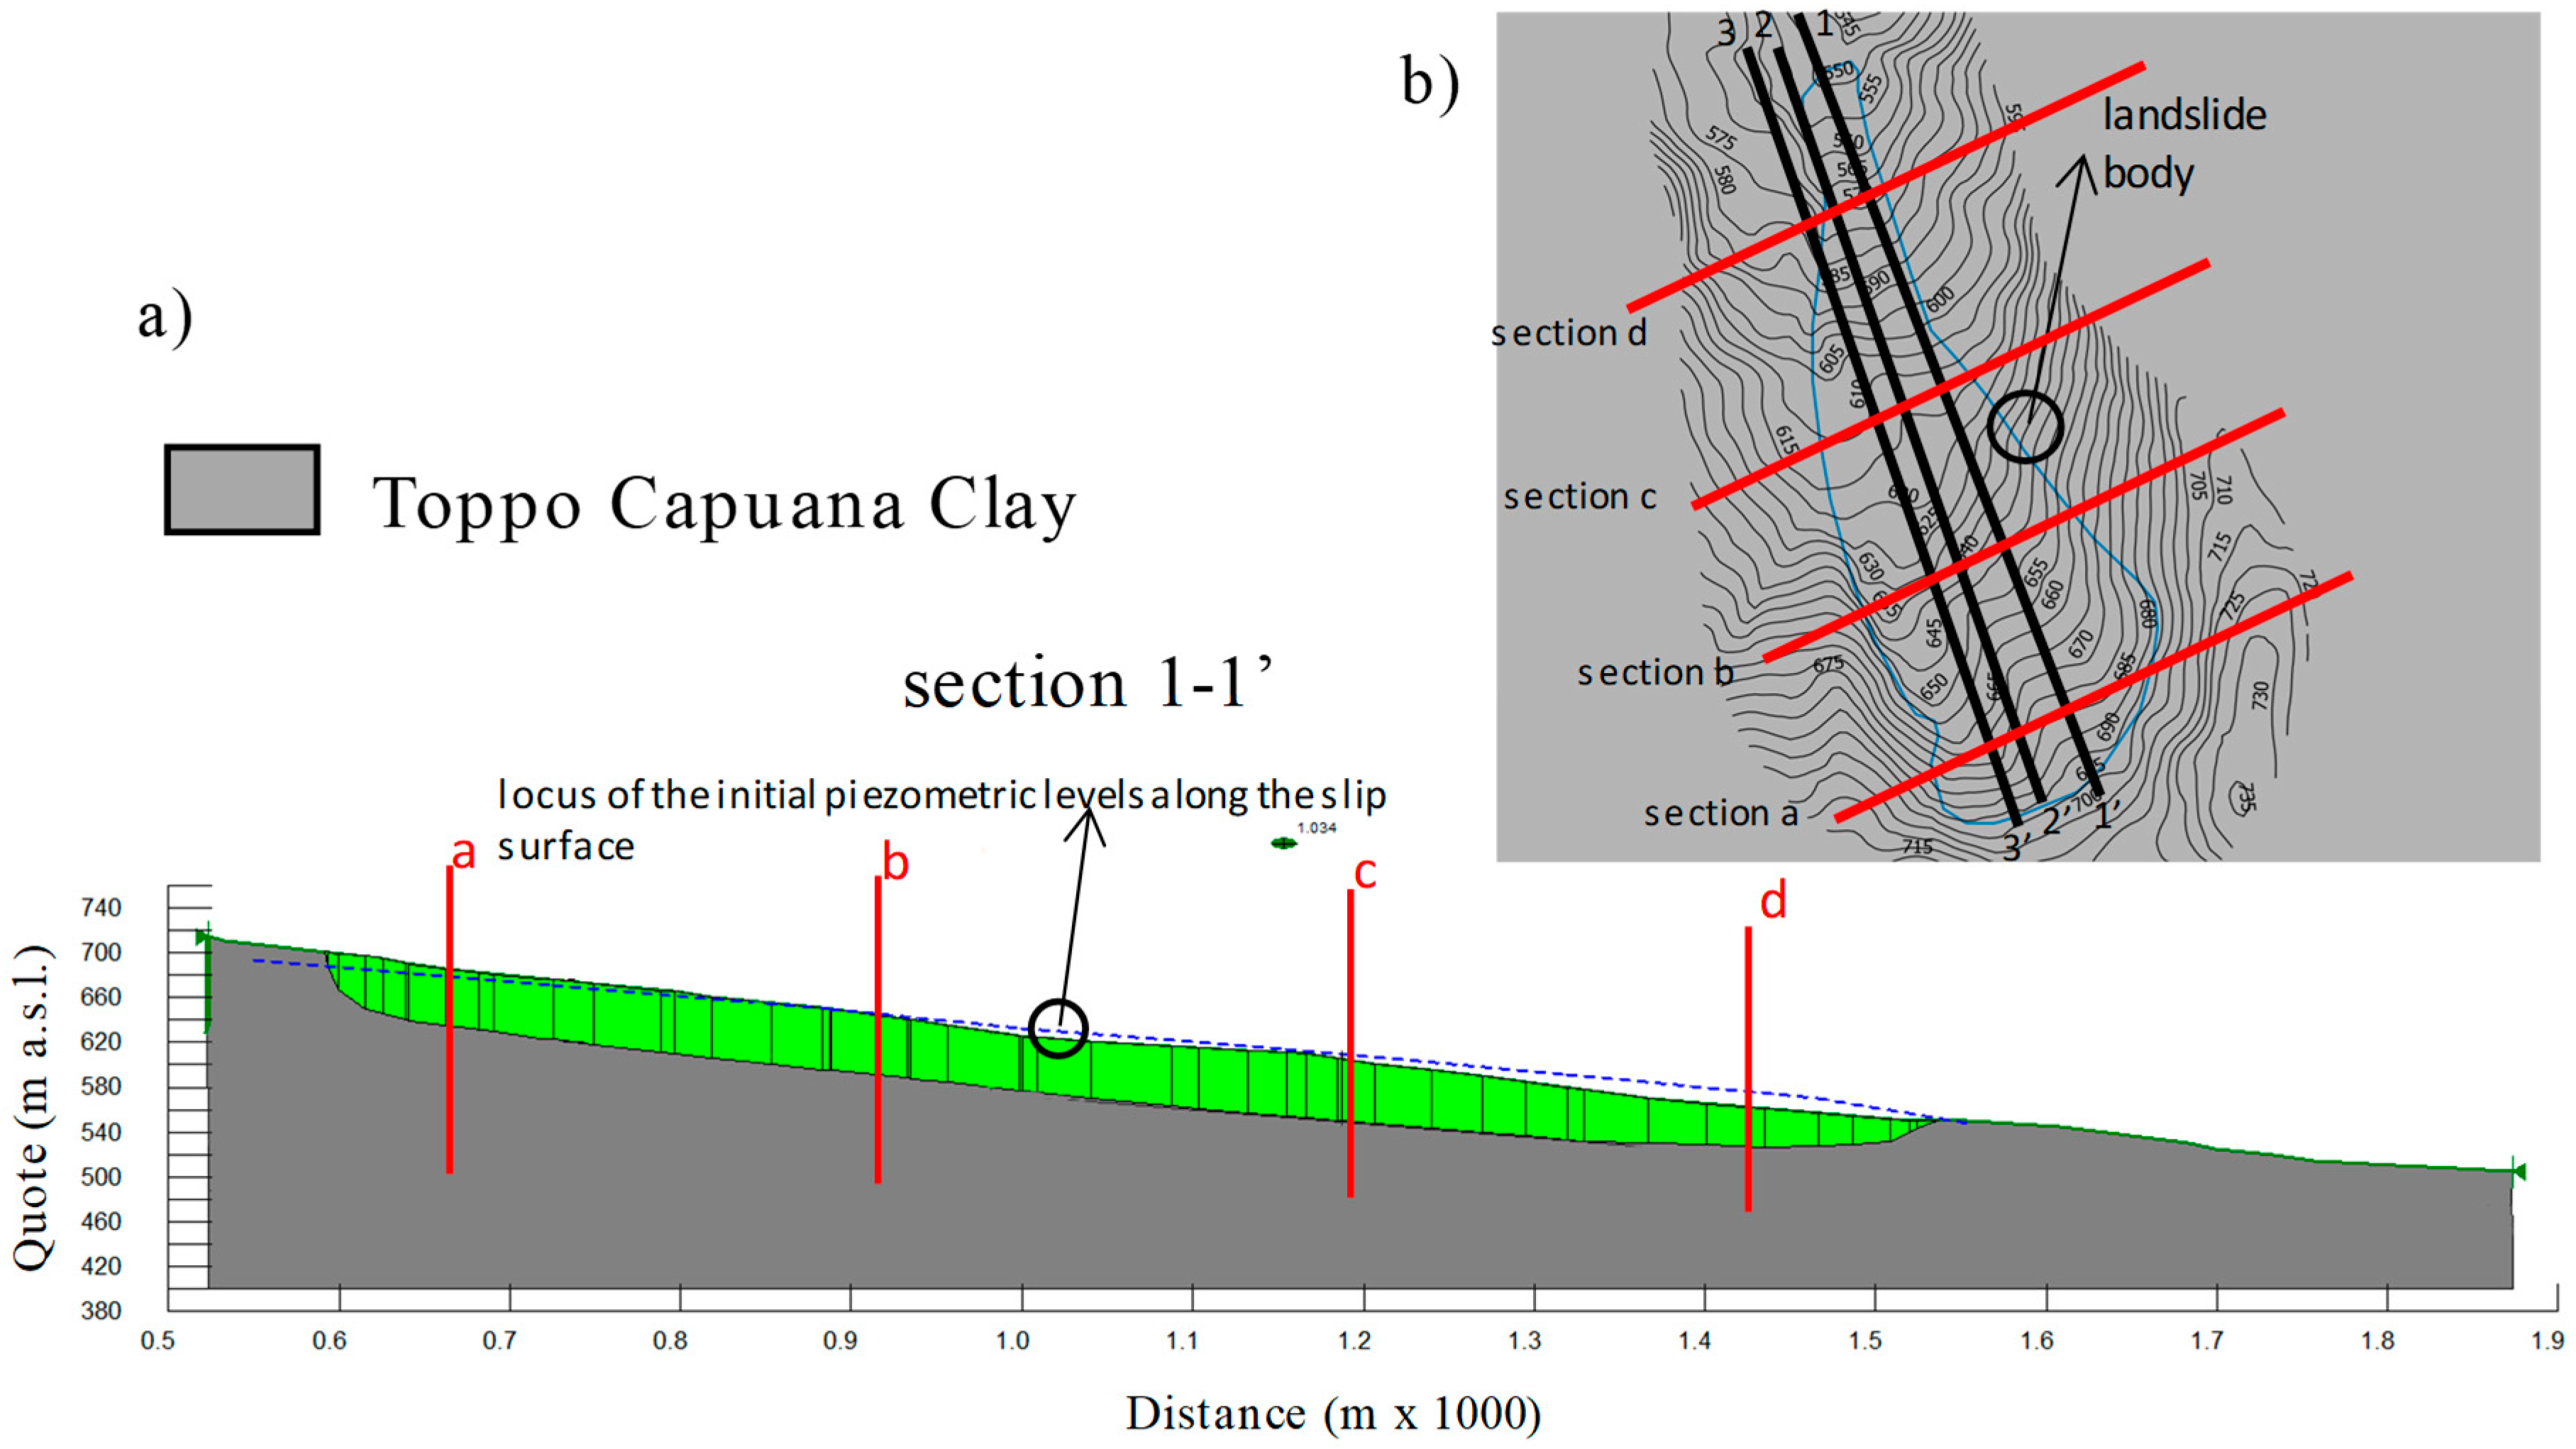
Figure 19b shows the topography for section 1-1′, along with the slip surface of the landslide body and the piezometric level along the slip surface before the installation of the drainage system. The F post-installation has been calculated for several of the trench systems in
Table 1.
As said before, the slip surface of the Fontana Monte landslide crosses the Toppo Capuana clays, which include a clay fraction ranging between 50 and 70%, are of high plasticity (30% < PI < 80%) and medium-to-high activity (0.5 < A < 1). Due to the fissuring and the high plasticity index of the clay, the values of the peak strength parameters are relatively medium to low, ranging between c′
P = 20 kPa, φ′
P = 20°. According to the LE back-analyses conducted with reference to section 1-1′, implementing the piezometric levels shown in
Figure 9b [
37], the parameter values c′
m = 9 kPa − φ′
m = 18.7°, which are about those reached post-peak in the shear tests on the clay samples, were found to provide F = 1. Therefore, these values have been used in all LE analyses port intervention.
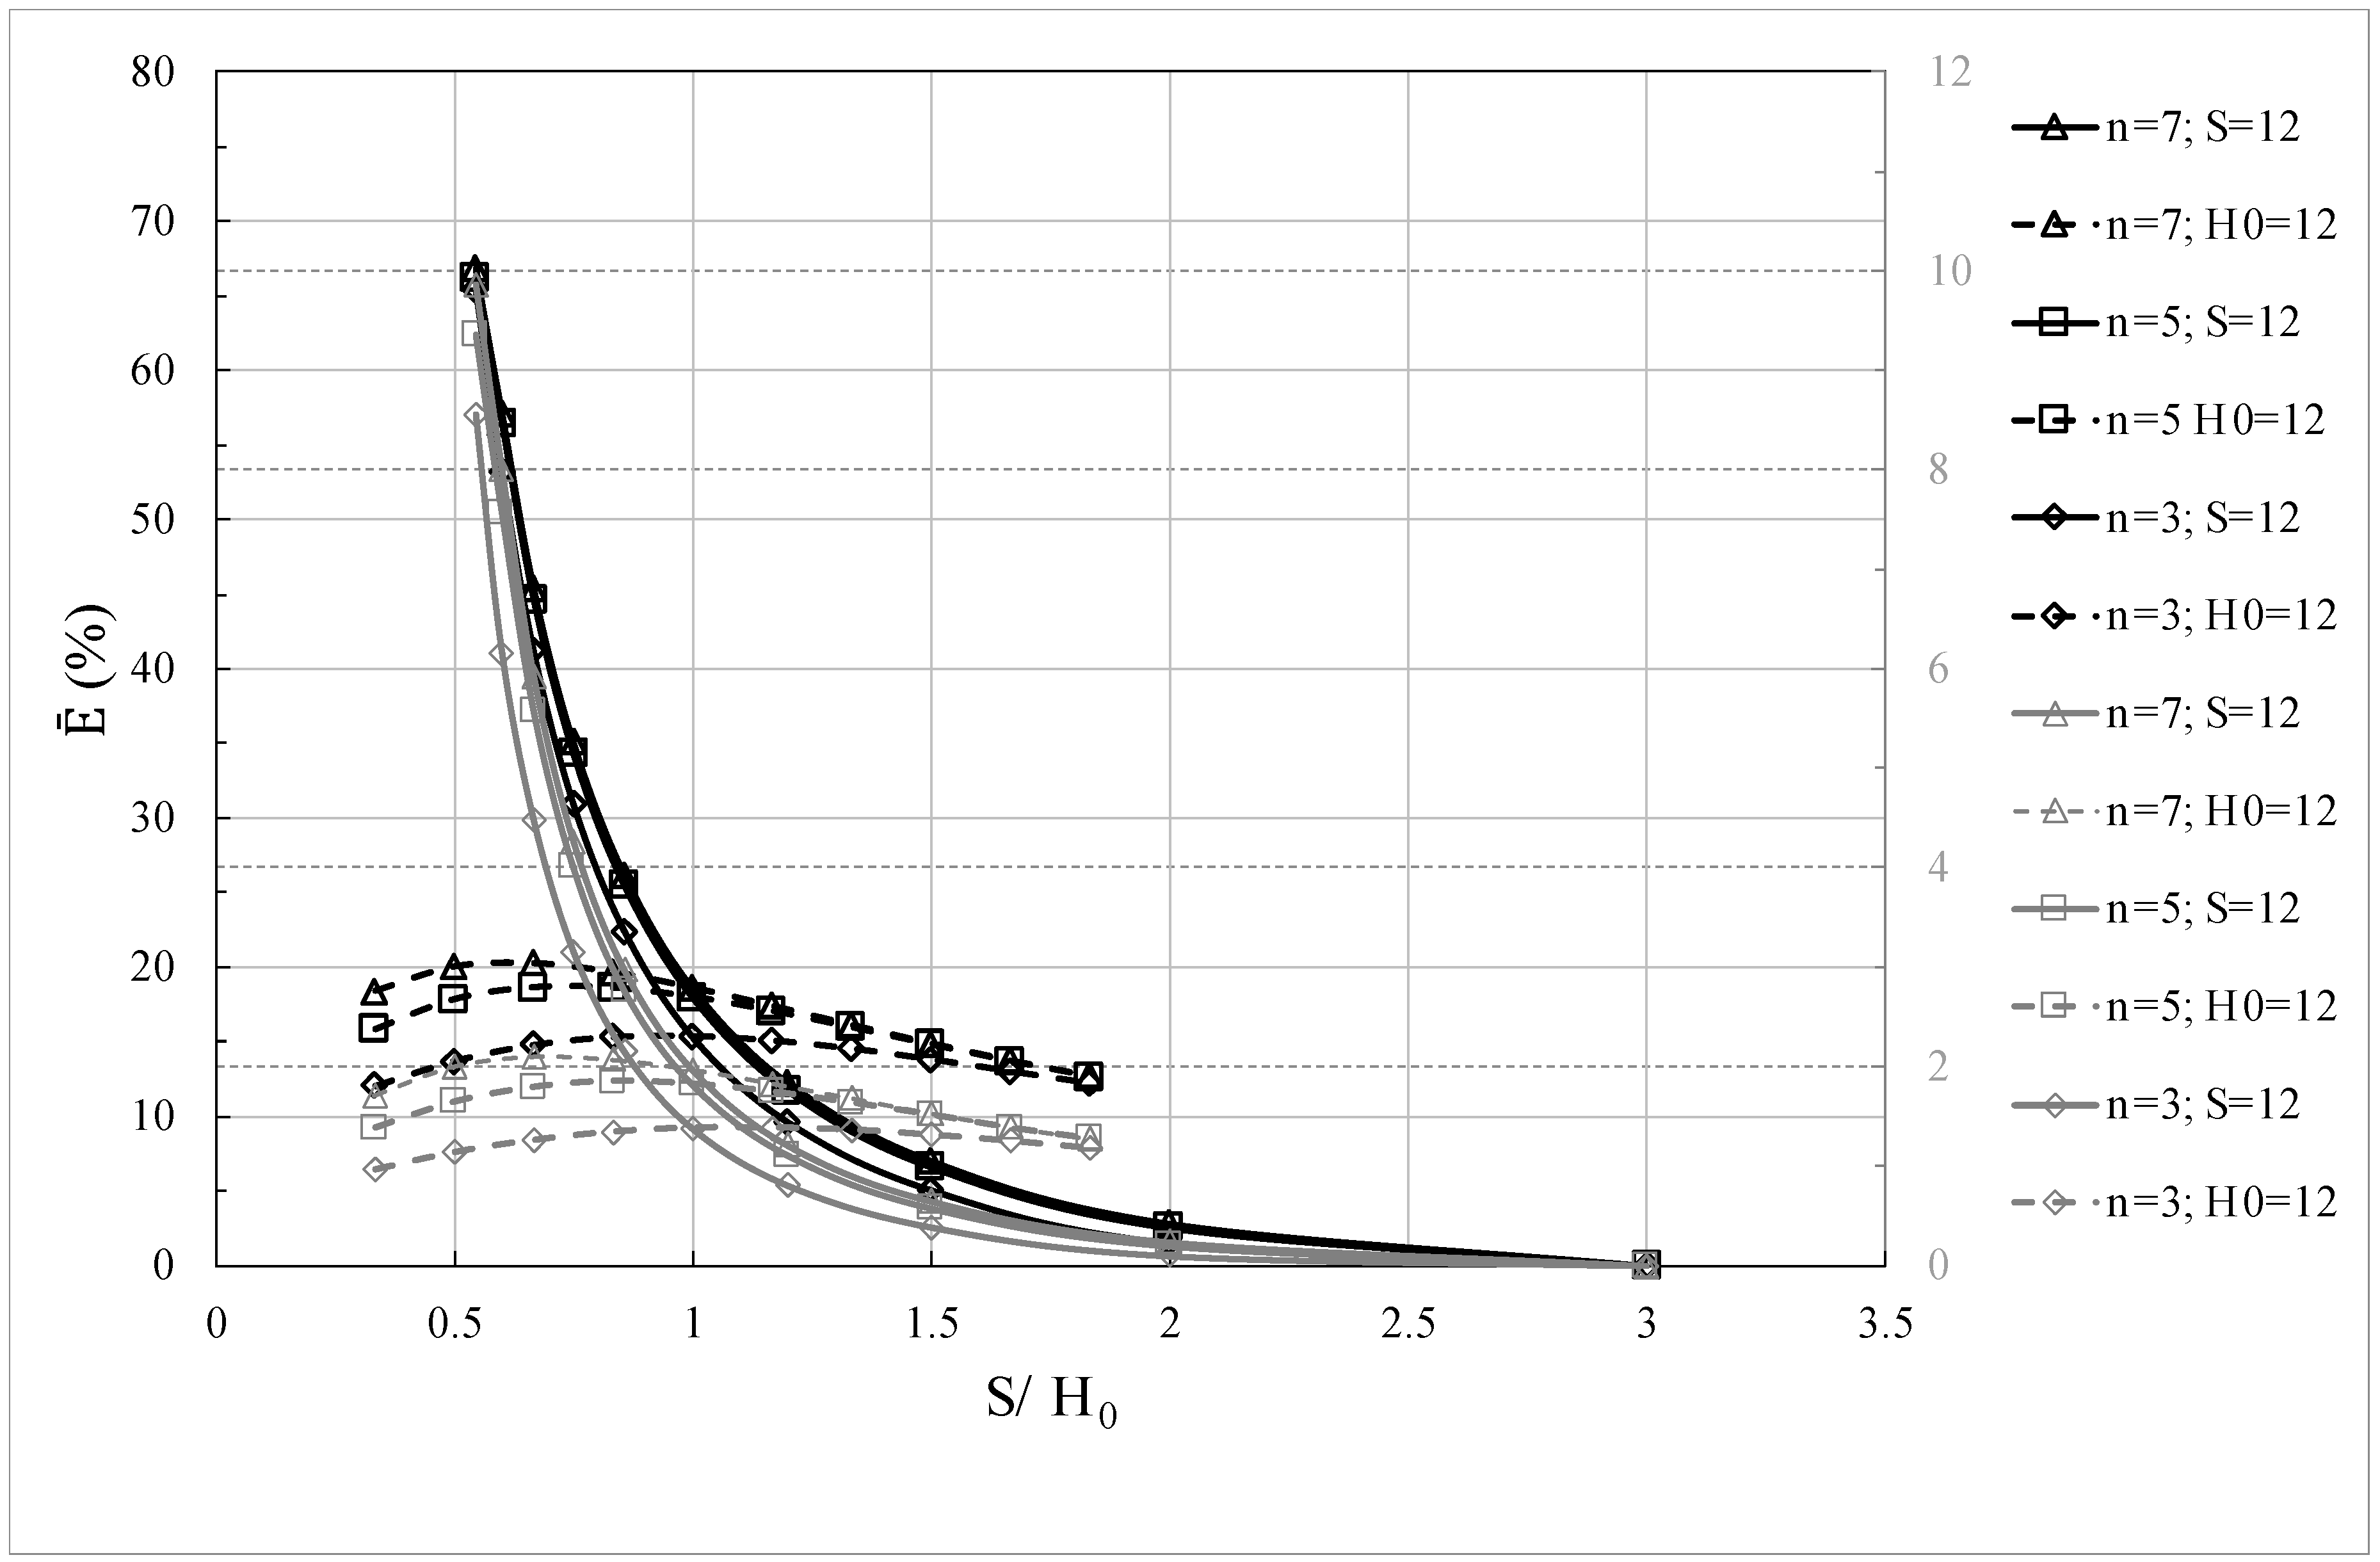
To start with, a stability factor increment, ΔF, equal to 14% is reached for section 1-1′ after installation of a drainage trench system characterized by n = 3, S = 18 m and H
0 = 22 m (S/H
0 = 0.82), whose plane of symmetry coincides with the section. Given n = 3,
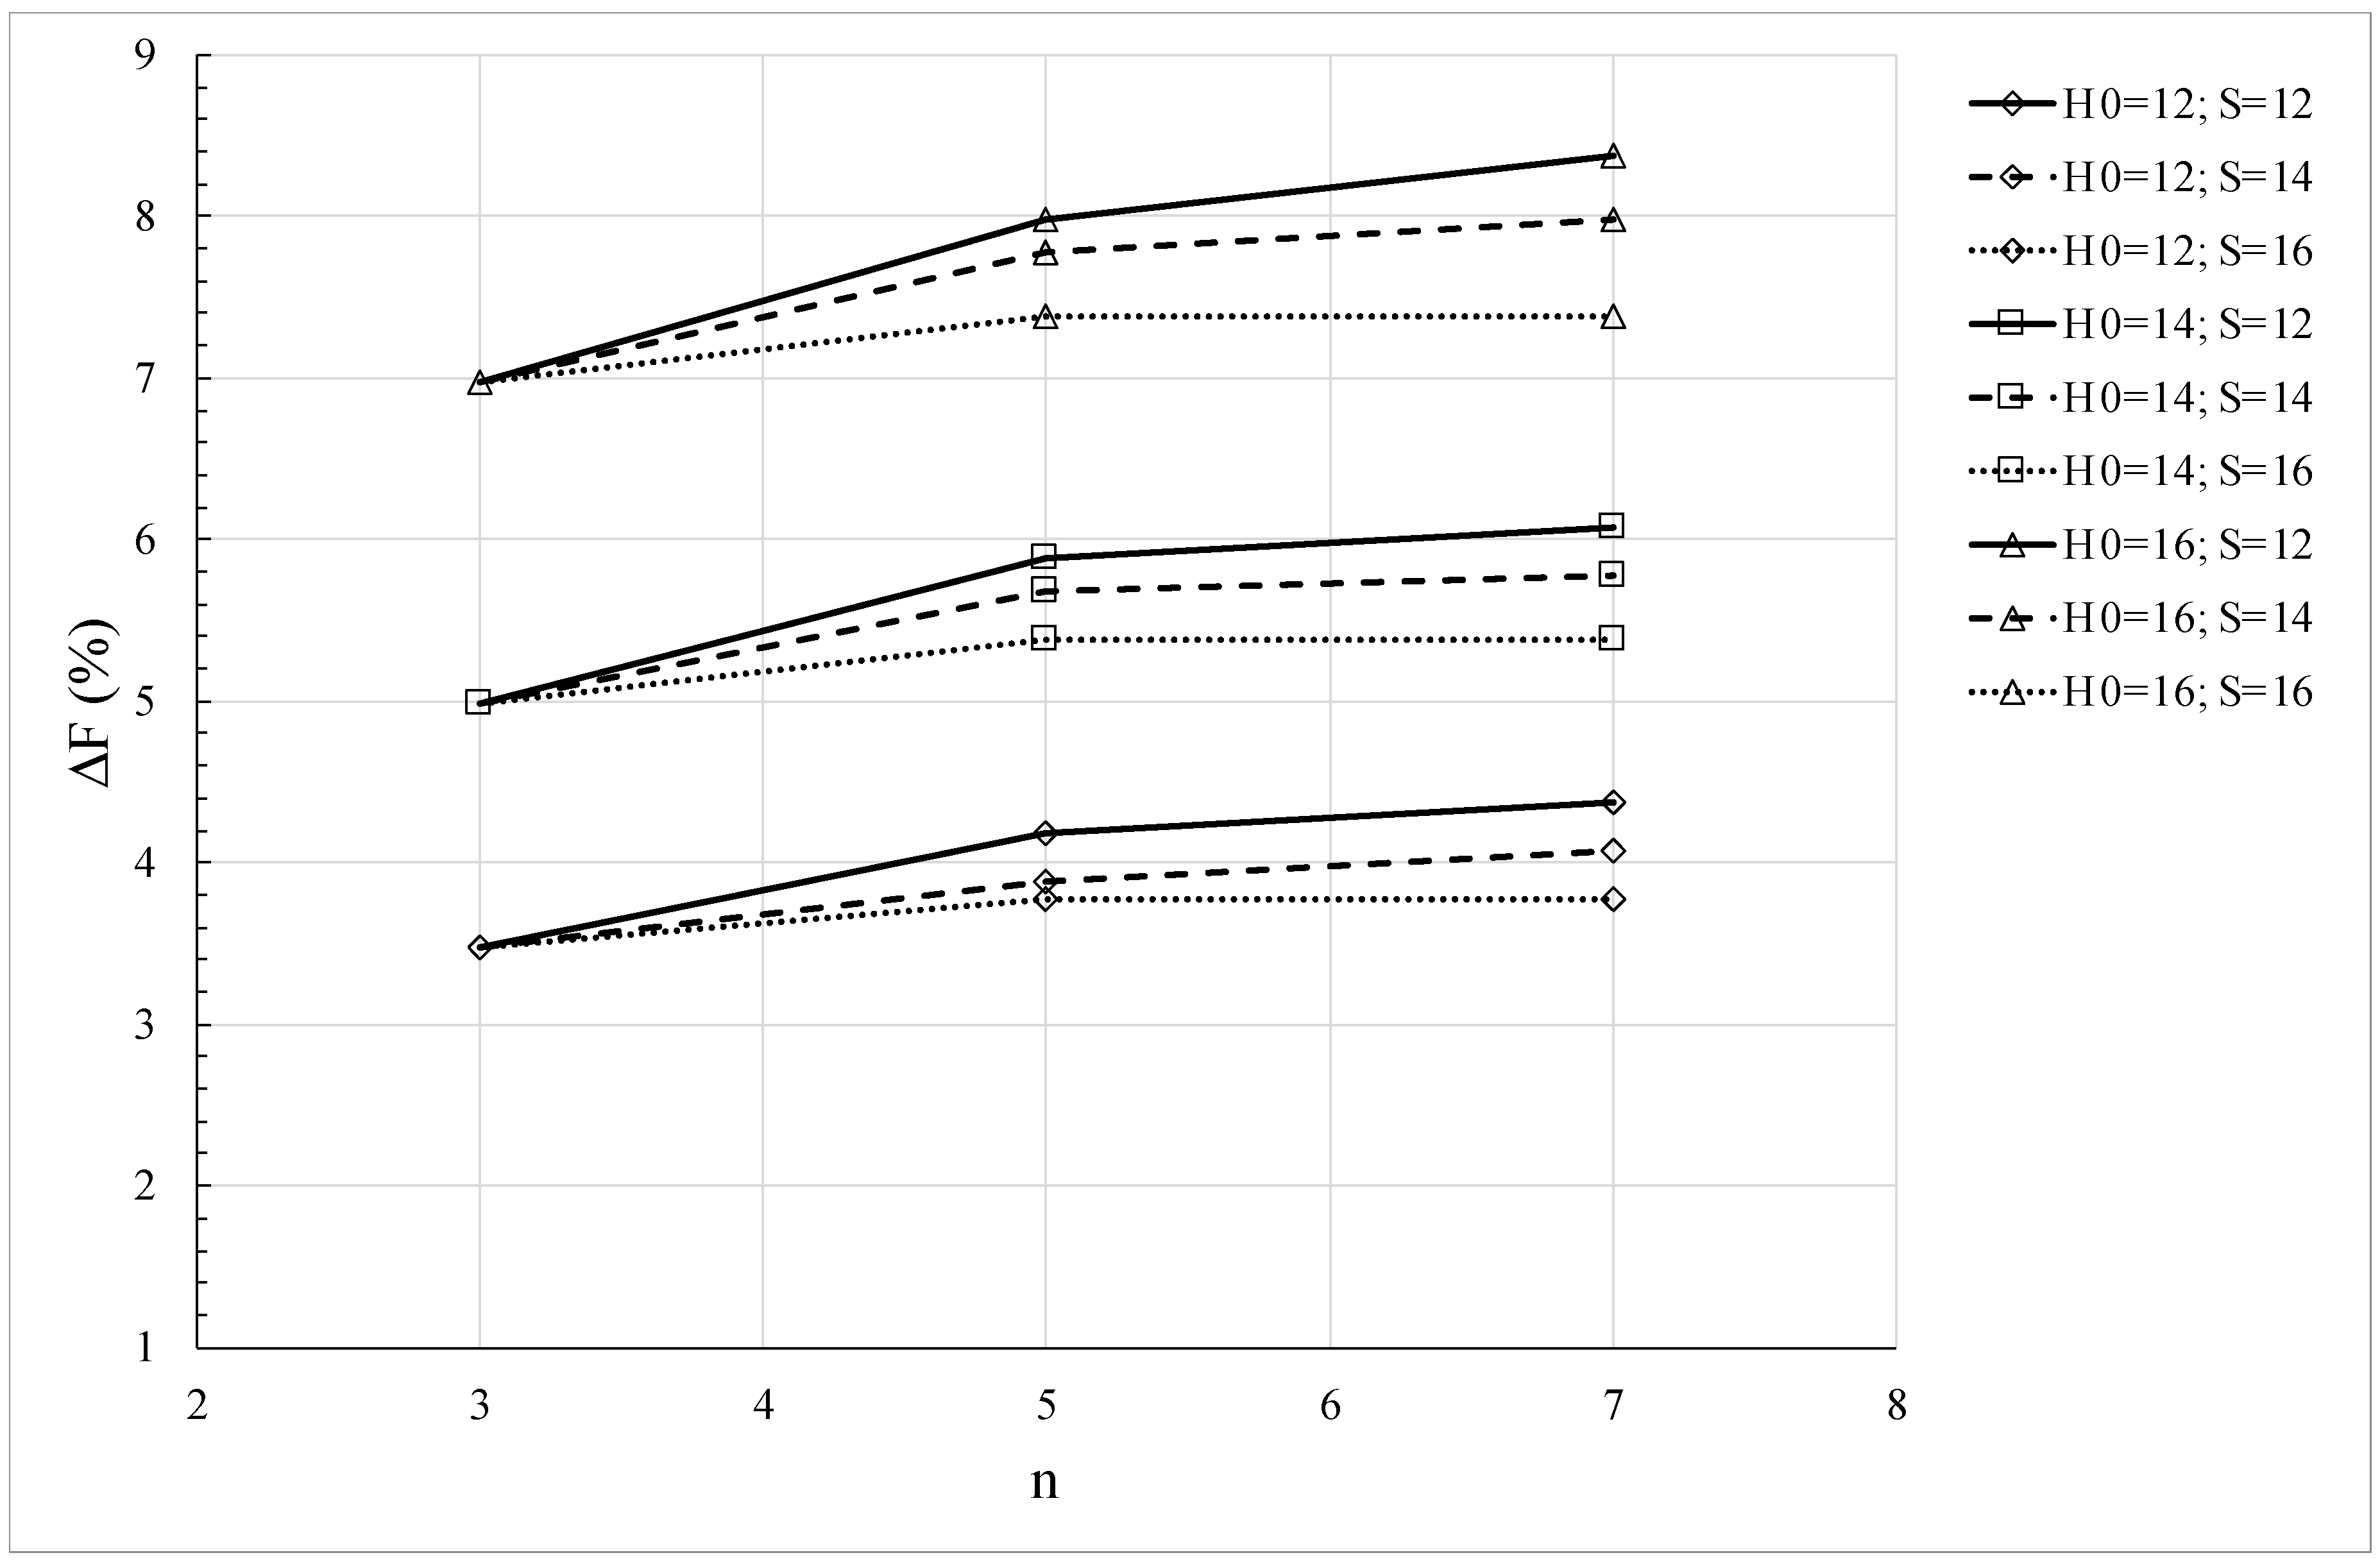
Figure 20 outlines the variability of ΔF with S/H
0 for the section 1-1′; in the plot, the contours of constant S (dashed lines) and constant H
0 (solid lines) are indicated. ΔF is found to increase mostly with increasing H
0, in accordance with the increase in Ē discussed before. Furthermore,
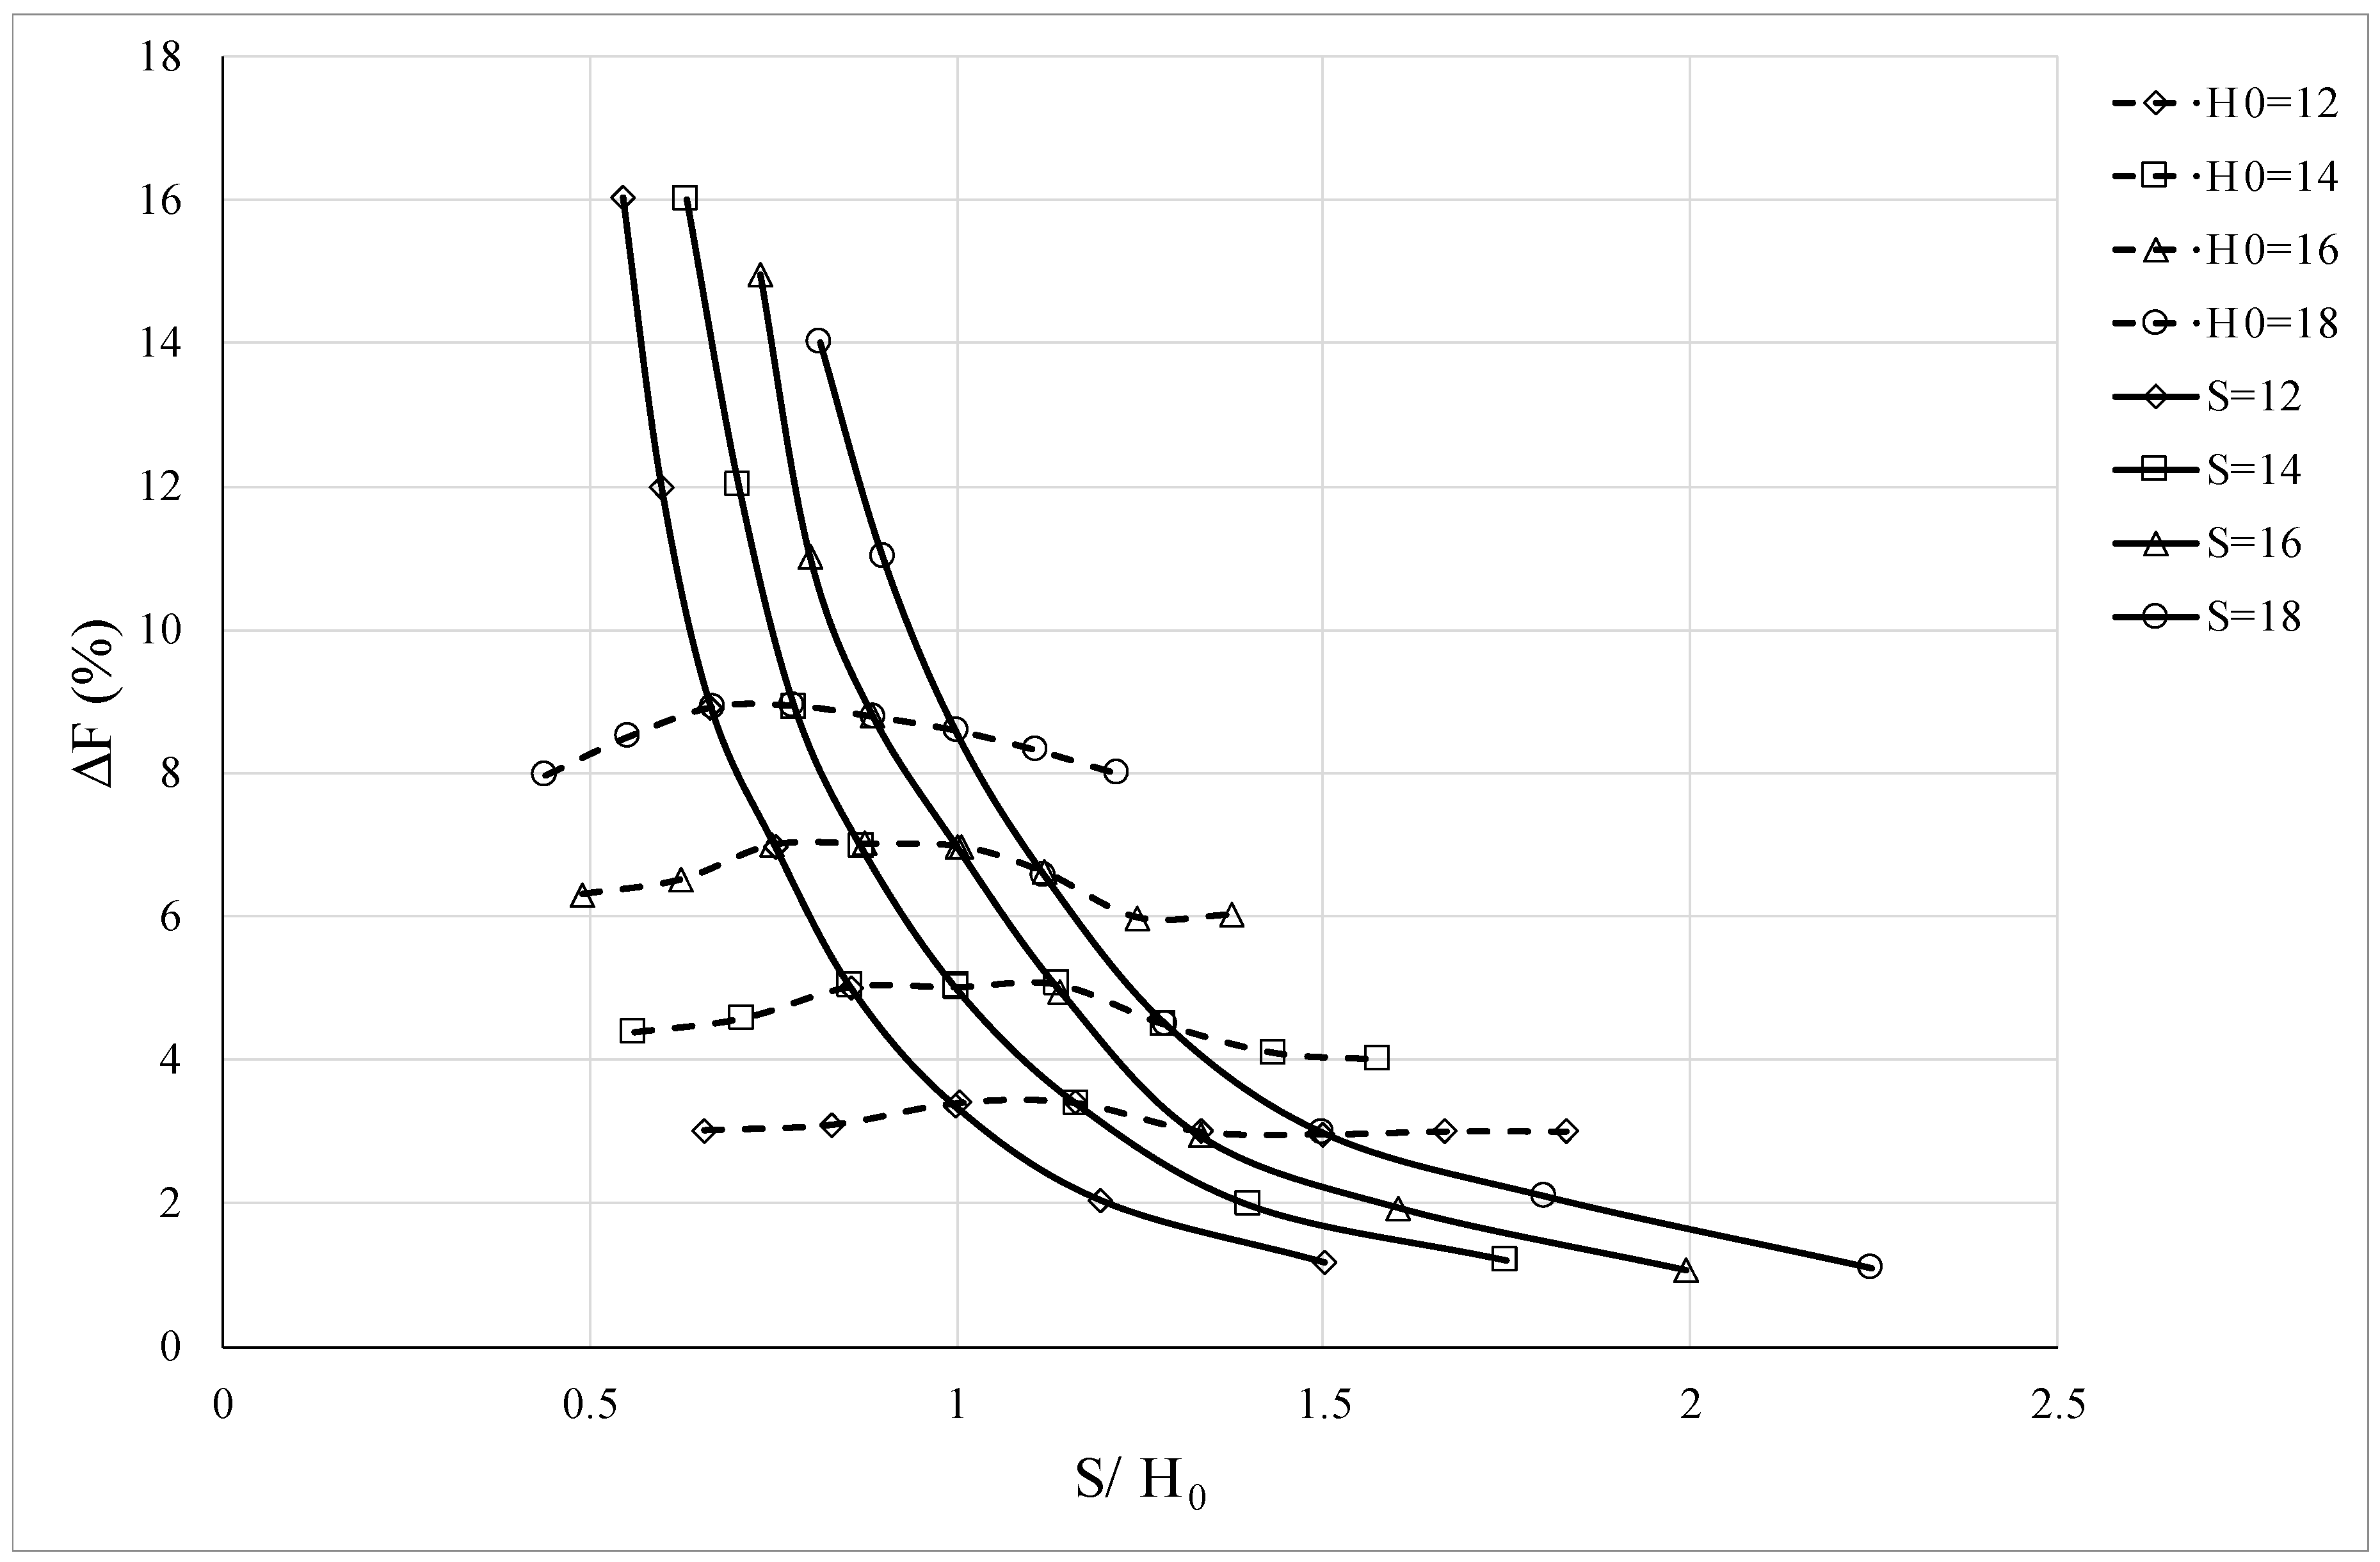
Figure 21 shows that the increment in stability factor increases with the number of trenches, due to the group effect, although the increment obtained passing from n = 5 to n = 7 is significantly lower than that calculated with the increment of n from 3 to 5.
Given the bowl shape of the Fontana Monte slip surface, the increment in stability factor ΔF in
Figure 20 and
Figure 21 for section 1-1′, are the minimum among the ΔF achieved along the other sections, since in the latter the slip surface is shallower and, therefore, the increase in shear strength achieved through drainage is higher. In order to assess the variability of ΔF among the 2D LE analyses carried out for the section 1-1′, 2-2′, and 3-3′, in
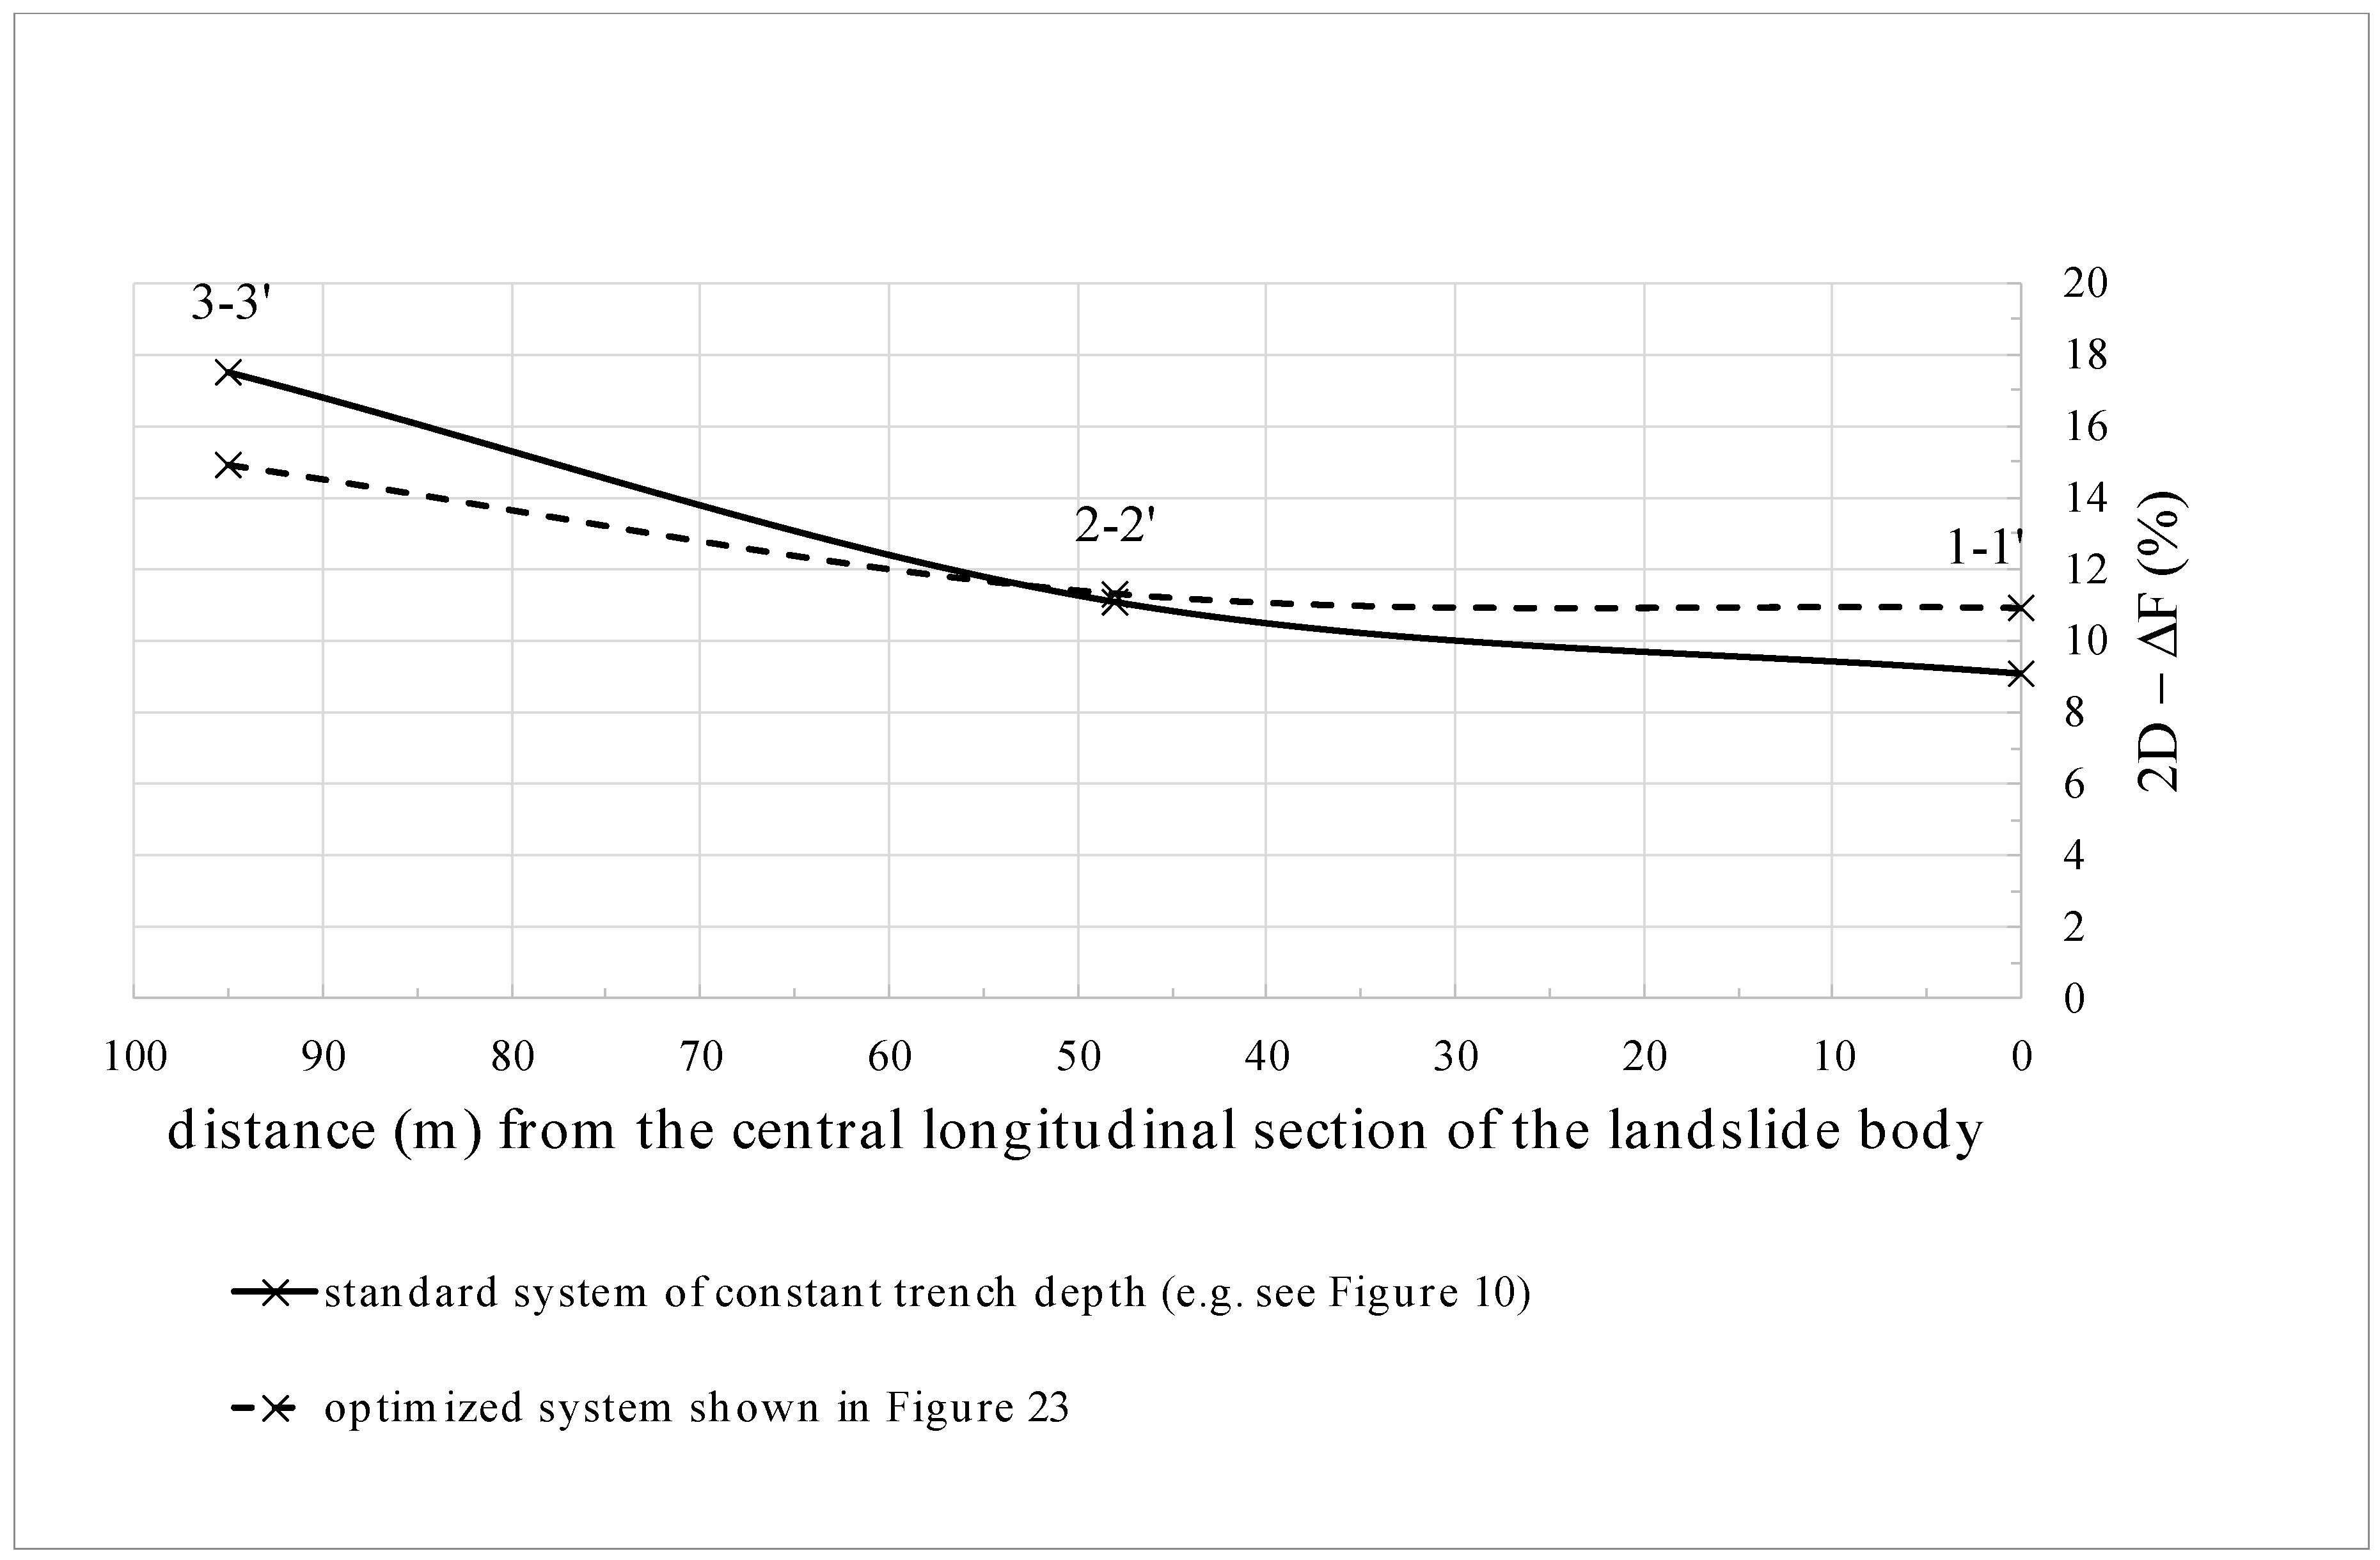
Figure 22, ΔF calculated for each 2D analysis has been renamed 2D-ΔF and has been plotted versus the distance of the longitudinal section from the central section of the landslide (which coincides with section 1-1′). The 2D-ΔF values in the figure refer to the case n = 5, H
0 = 16 m and S = 14 m (called “standard system”). In such analyses, the efficiency Ē has been calculated in the different portions of the bowl-shaped slip surface according to the calculation strategy discussed in section 3 (
Figure 9). The figure shows the increase in 2D-ΔF with the increasing distance of the calculation section from central section of the landside.
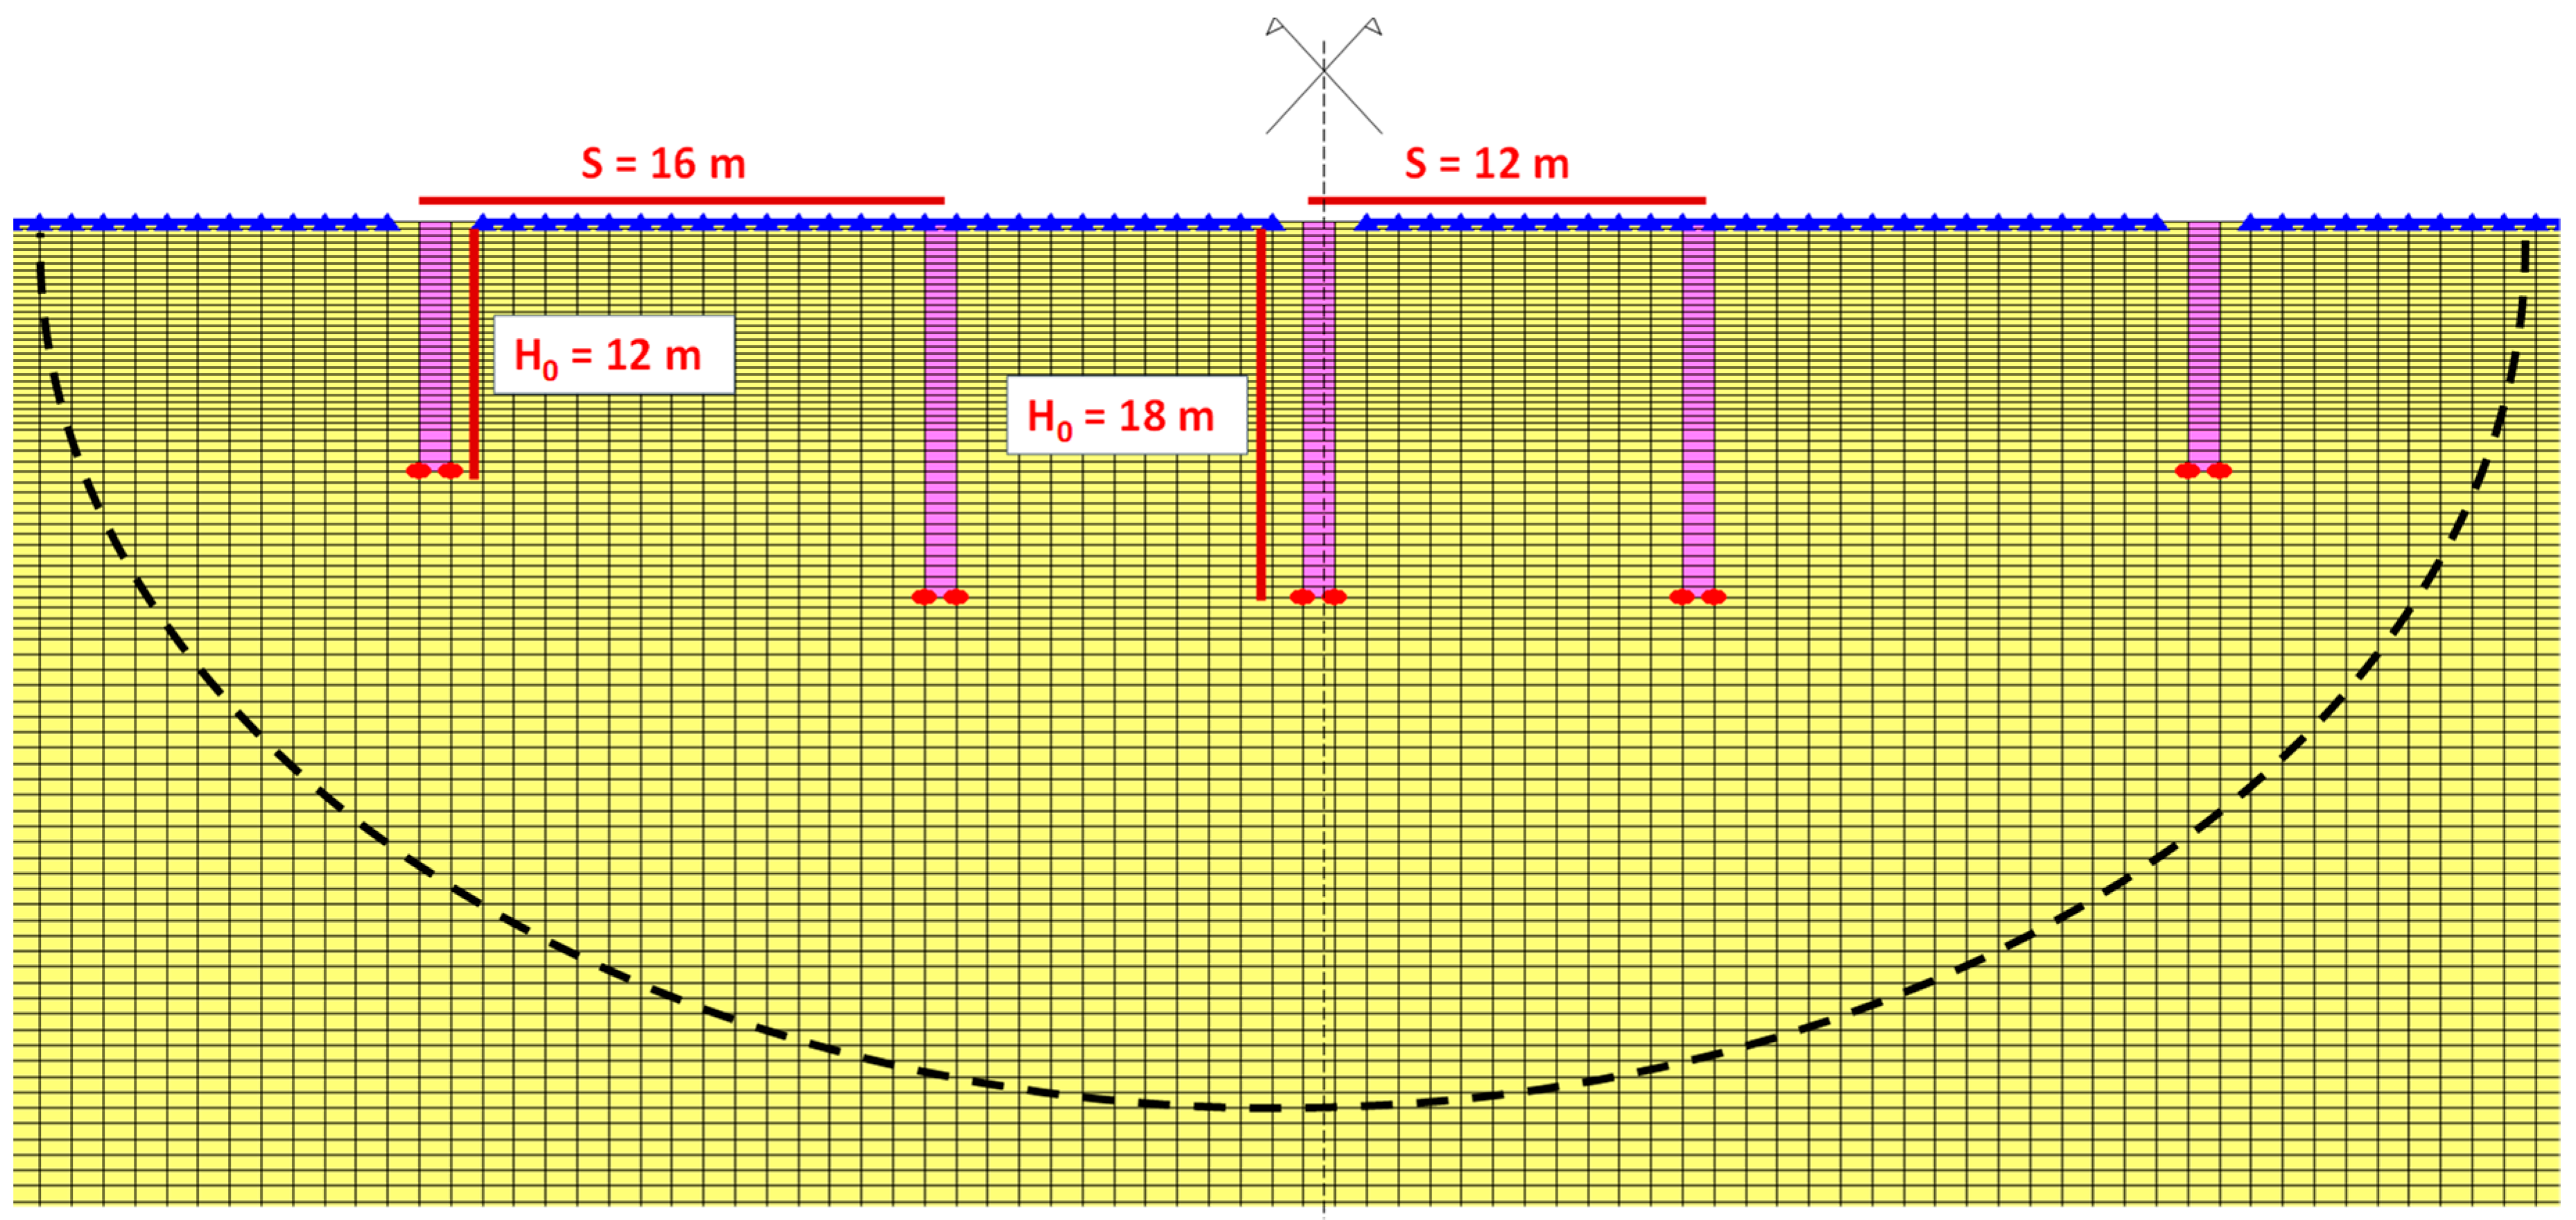
On the whole, the results suggest some criteria of optimization of the design of the drainage trench system. In particular, the installation of the system may be more sustainable and as efficient if including a smaller trench spacing, S, and a larger trench depth, H
0, in the area where the slip surface is deeper, i.e., in the middle of the landslide body. Conversely, in the lateral portions of the landslide, a larger spacing with shallower trenches can be used, as schematized in
Figure 23. For example, a drainage trench system characterized by five trenches, with a spacing S equal to 12 m and a depth H
0 of 18 m in the middle, and a spacing S equal to 16 m with a depth H
0 of 12 m at the boundaries, as shown in
Figure 23, has been implemented in an additional seepage analysis.
The corresponding 2D-ΔF are reported in
Figure 22, for comparison with the previous results. The comparison shows that the average stability factor obtained through this kind of drainage trench system, ~13%, is comparable to that reached with a standard system, of constant S and H
0, but the system in
Figure 23 is more sustainable, both in terms of costs and construction effort.
7. Concluding Remarks
The results of the study show the extent to which a properly designed drainage trench system may provide reasonable mitigation of the activity of deep landslide bodies, even in slopes formed of clays. Based on the analysis results, criteria for the optimization of the drainage trench system design have been proposed, for the stabilization of deep landslide bodies.
The new design procedure implements a more realistic account of the field seepage conditions. The comparison of the new analysis results with the Ē predictions reported in previous studies shows that also at depth larger than the trench depth (e.g., up to double H0), results from models accounting for partially saturated conditions, unsteady boundary conditions at the ground level and finite number of trenches, differ from model results assuming full saturation and an infinite number of trenches. Furthermore, the new results give evidence to the uncoupled influence of H0, n and S on the Ē values. Therefore, the present paper represents a step forward in the assessment of the influence of the geometric parameters of drainage trench systems and of the field hydraulic conditions (partially saturated conditions, initial water table location) on the increase in safety factor provided by the mitigation measure.
At large depths, the assessment of the efficacy of the intervention must account for the “group effect”, which influences the pore pressure regime. The case study used for the validation of the design strategy has been the Fontana Monte landslide, whose geomorphology (bowl-shaped slip surface) and geotechnical parameters had been assessed in previous studies. The analysis results show that the geometric parameter H0 has a greater influence, than n and S, on the pore water pressure reduction at the maximum depth of the slip surface. Moreover, the account for the variation in Ē along the transversal sections of the bowl-shaped slip surface, allows for the recognition of the significant 3D-ΔF that the trench system provides, which is far higher than the 2D-ΔF calculated for the deepest longitudinal section of the slip surface. Based on the results, an optimization of the drainage system geometry has been proposed.


