Article

“Pre-Earthquake” Micro-Structural Effects Induced by Shear Stress on α-Quartz in Laboratory Experiments

by
Giovanni Martinelli
1,2,3,*,
Paolo Plescia
4 and
Emanuela Tempesta
4
1
INGV National Institute of Geophysics and Volcanology, Via Ugo La Malfa 153, 90146 Palermo, Italy
2
Institute of Eco-Environment and Resources, Chinese Academy of Sciences, Lanzhou 730000, China
3
Key Laboratory of Petroleum Resources, Lanzhou 730000, China
4
CNR-IGAG, Institute of Environmental Geology and Geoengineering, Research area of Rome, 00015 Monterotondo, Italy
*
Author to whom correspondence should be addressed.
Geosciences 2020, 10(5), 155; https://doi.org/10.3390/geosciences10050155
Submission received: 5 March 2020 / Revised: 20 April 2020 / Accepted: 22 April 2020 / Published: 27 April 2020
(This article belongs to the Special Issue Electromagnetic and Radon Pre-earthquake Precursors)

Abstract

:
This paper presents the results of measurements performed on α-quartz subjected to shear stress in dry conditions, to understand the relationship between the shear intensity and the resulting physical and chemical effects. If a shear stress of intensity higher than 100 MPa is applied continuously to alpha quartz crystals, they will tend to lose their crystallinity, progressively reduce their friction coefficient (Cof) and change into a low-order material, apparently amorphous under X-ray diffraction, but with a structure different from silica glass. Raman and Pair Distribution Function analyses suggested a structure like cristobalite, a silica polymorph well-known for its auxetic behavior, i.e., having a negative Poisson ratio. This elastic parameter pre-eminently controls the friction coefficient of the material and, if it is negative, the Cof lowering. As a result, the increase in low crystallinity cristobalite is sufficientto explain the lowering of the quartz friction coefficient up to values able to contribute, in principle, to the triggering processes of active faults. This allows hypothesizing a slip induction mechanism that does not include the need to have the interposition of layers of hydrated silica, as invoked by many authors, to justify the low friction coefficients that are achieved in shear stress tests on rocks abundant in quartz.

1. Introduction

Quartz (α-SiO2) is one of the most important industrial minerals and one of the most common minerals in the earth’s crust [1]. Among quartz’s best-known properties are its resistance to mechanical and chemical stress, but despite its resistance, if quartz is subjected to anisotropic mechanical stress, its structure tends to become distorted and tends towards amorphous materials [2,3]. These variations are of particularinterest in materials science and geophysics. Various authors believe that the decrease in quartz’s crystallinity, resulting from mechanical stress, leads to the formation of hydrated silica, as “silica gel”, a sort of lubricant that supposedly has catastrophic consequences in the form of slippage of active faults located in rocks rich in silica and water [4,5,6,7]. However, other currents of thought exist concerning the role of silica in the mechanisms of weakening and sliding of faults, which cite anhydrous situations of sliding [8,9,10]. The authors cited speak of “fine-grained powder” and “nanospherules” to describe the phenomenon that occurs when the opposing faces of the fault generate nanoparticles, which reduce the friction coefficient and trigger slippage. To contribute to clarifying the origin of the structural weakening of quartz-rich rocks subjected to shear stresses and to the role they may have in triggering seismic events along active faults, some experiments have been carried out using a grinding device.

2. Materials and Methods
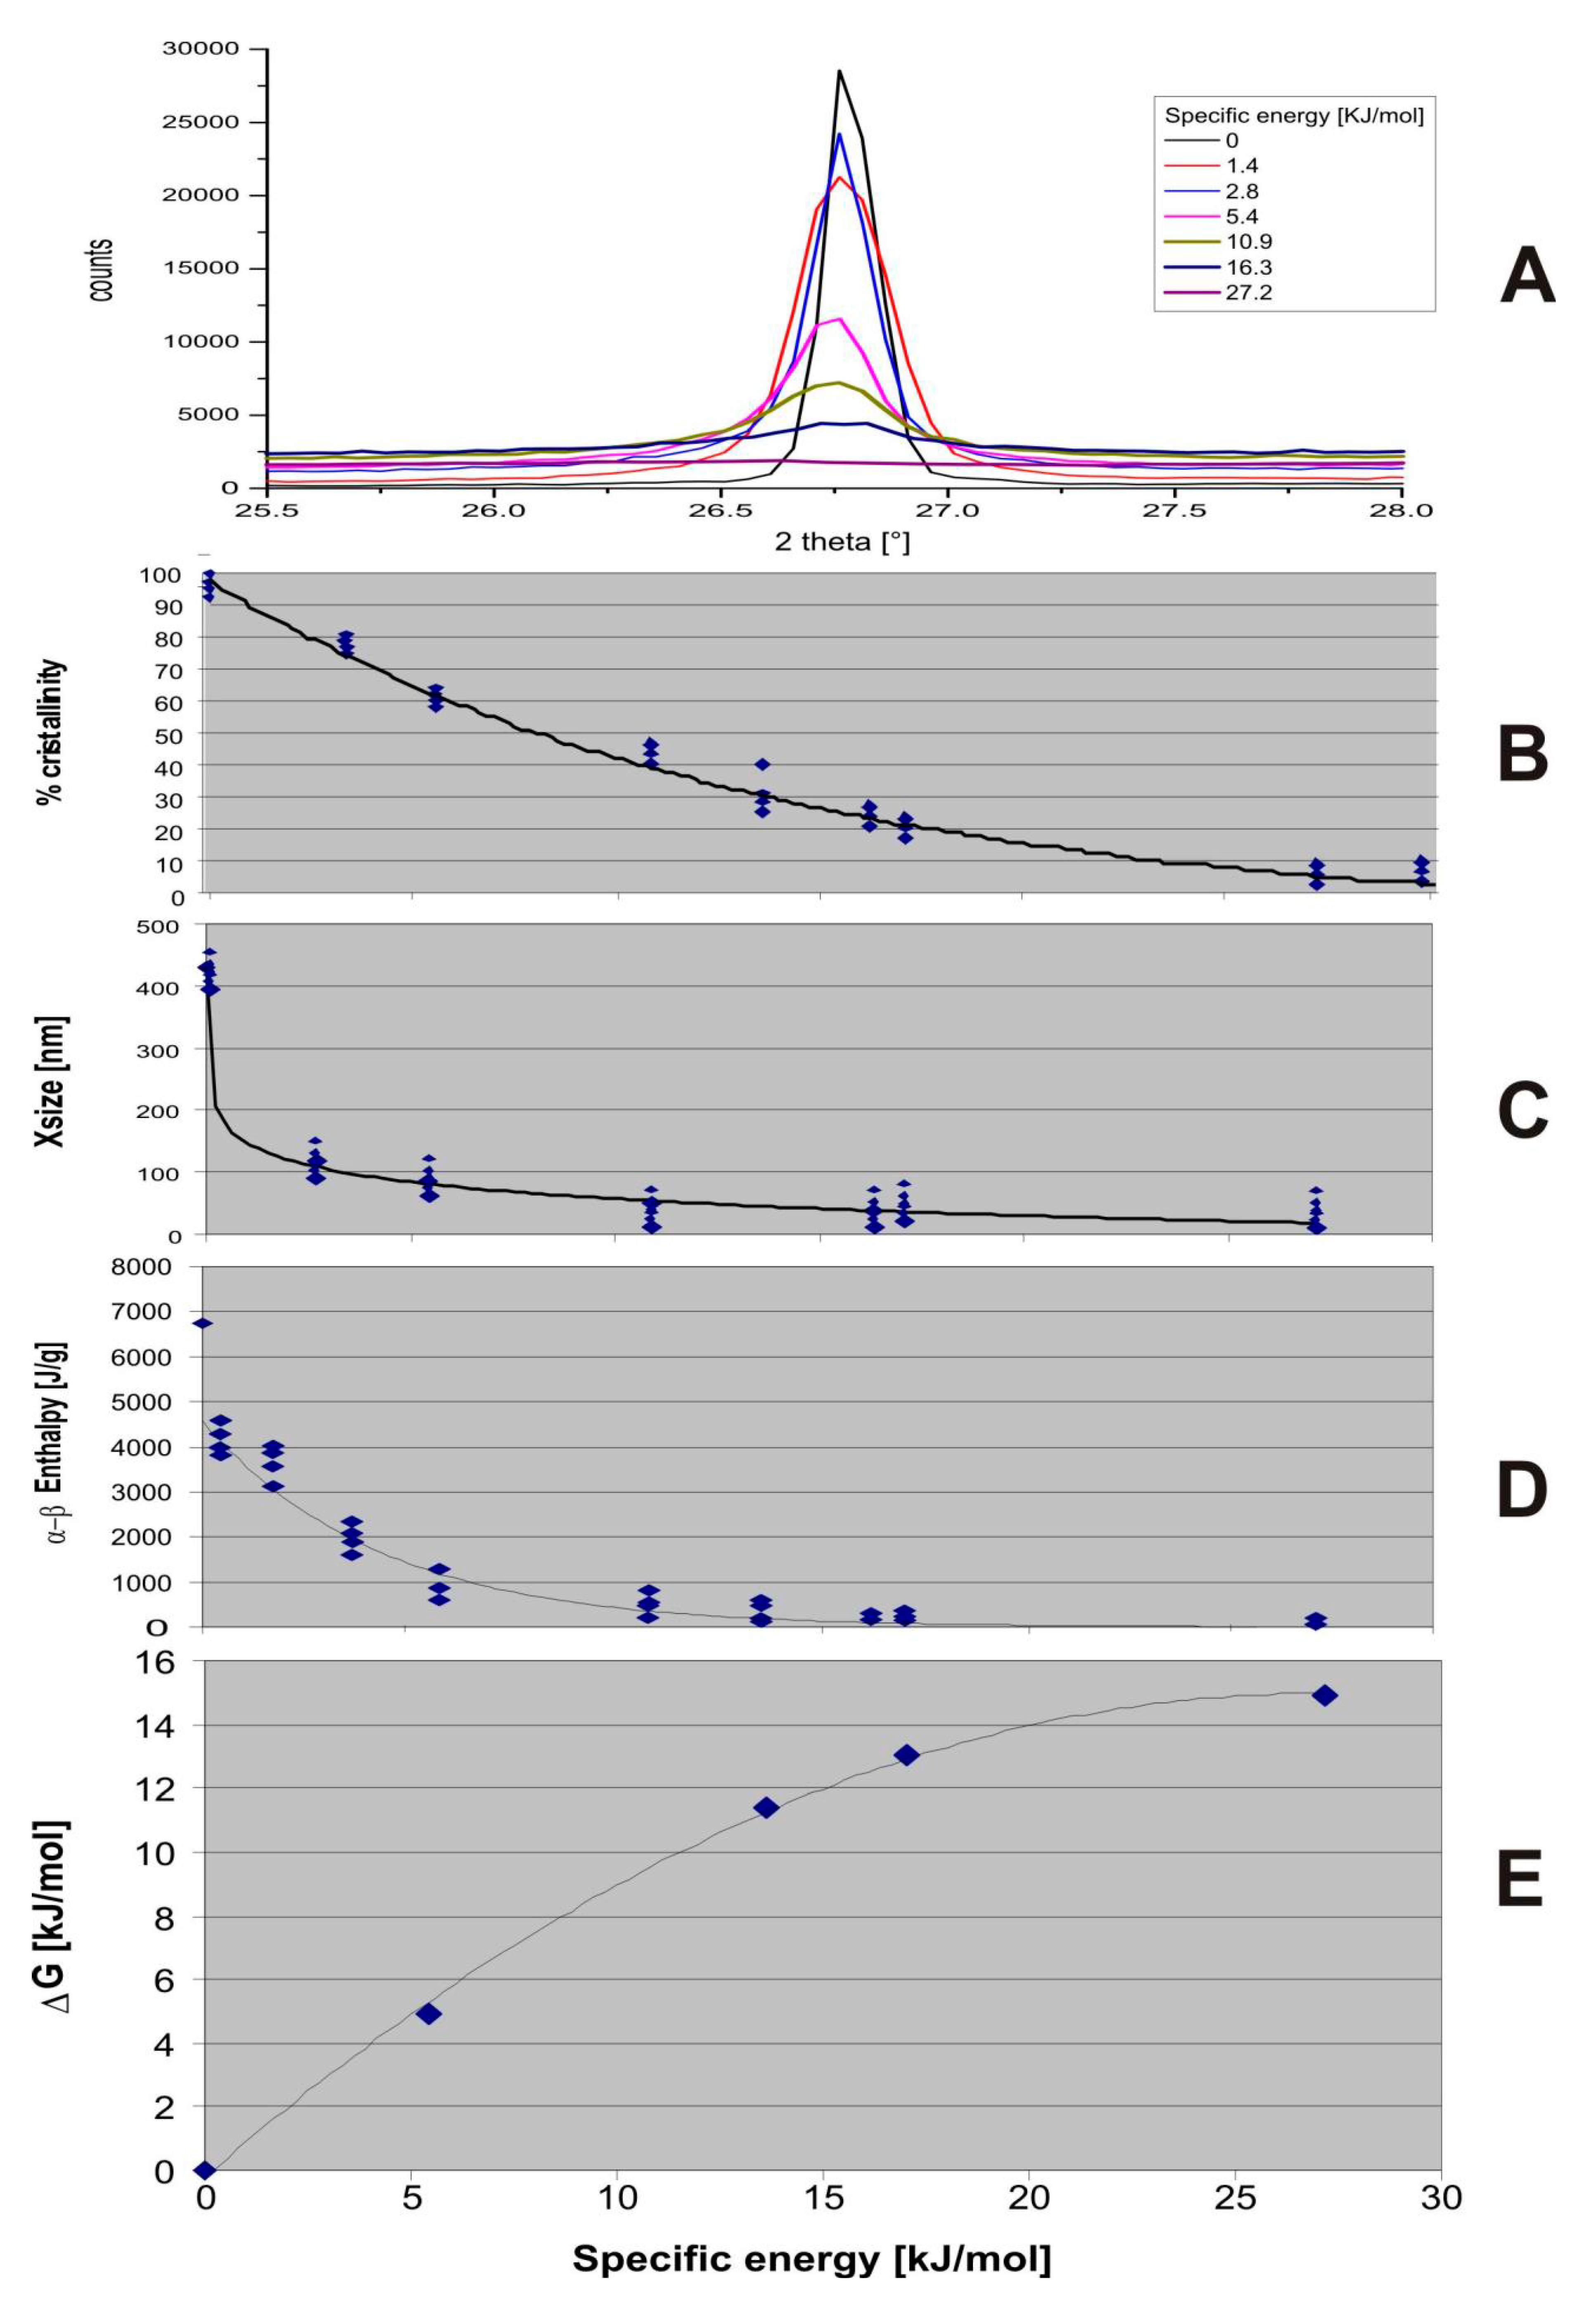
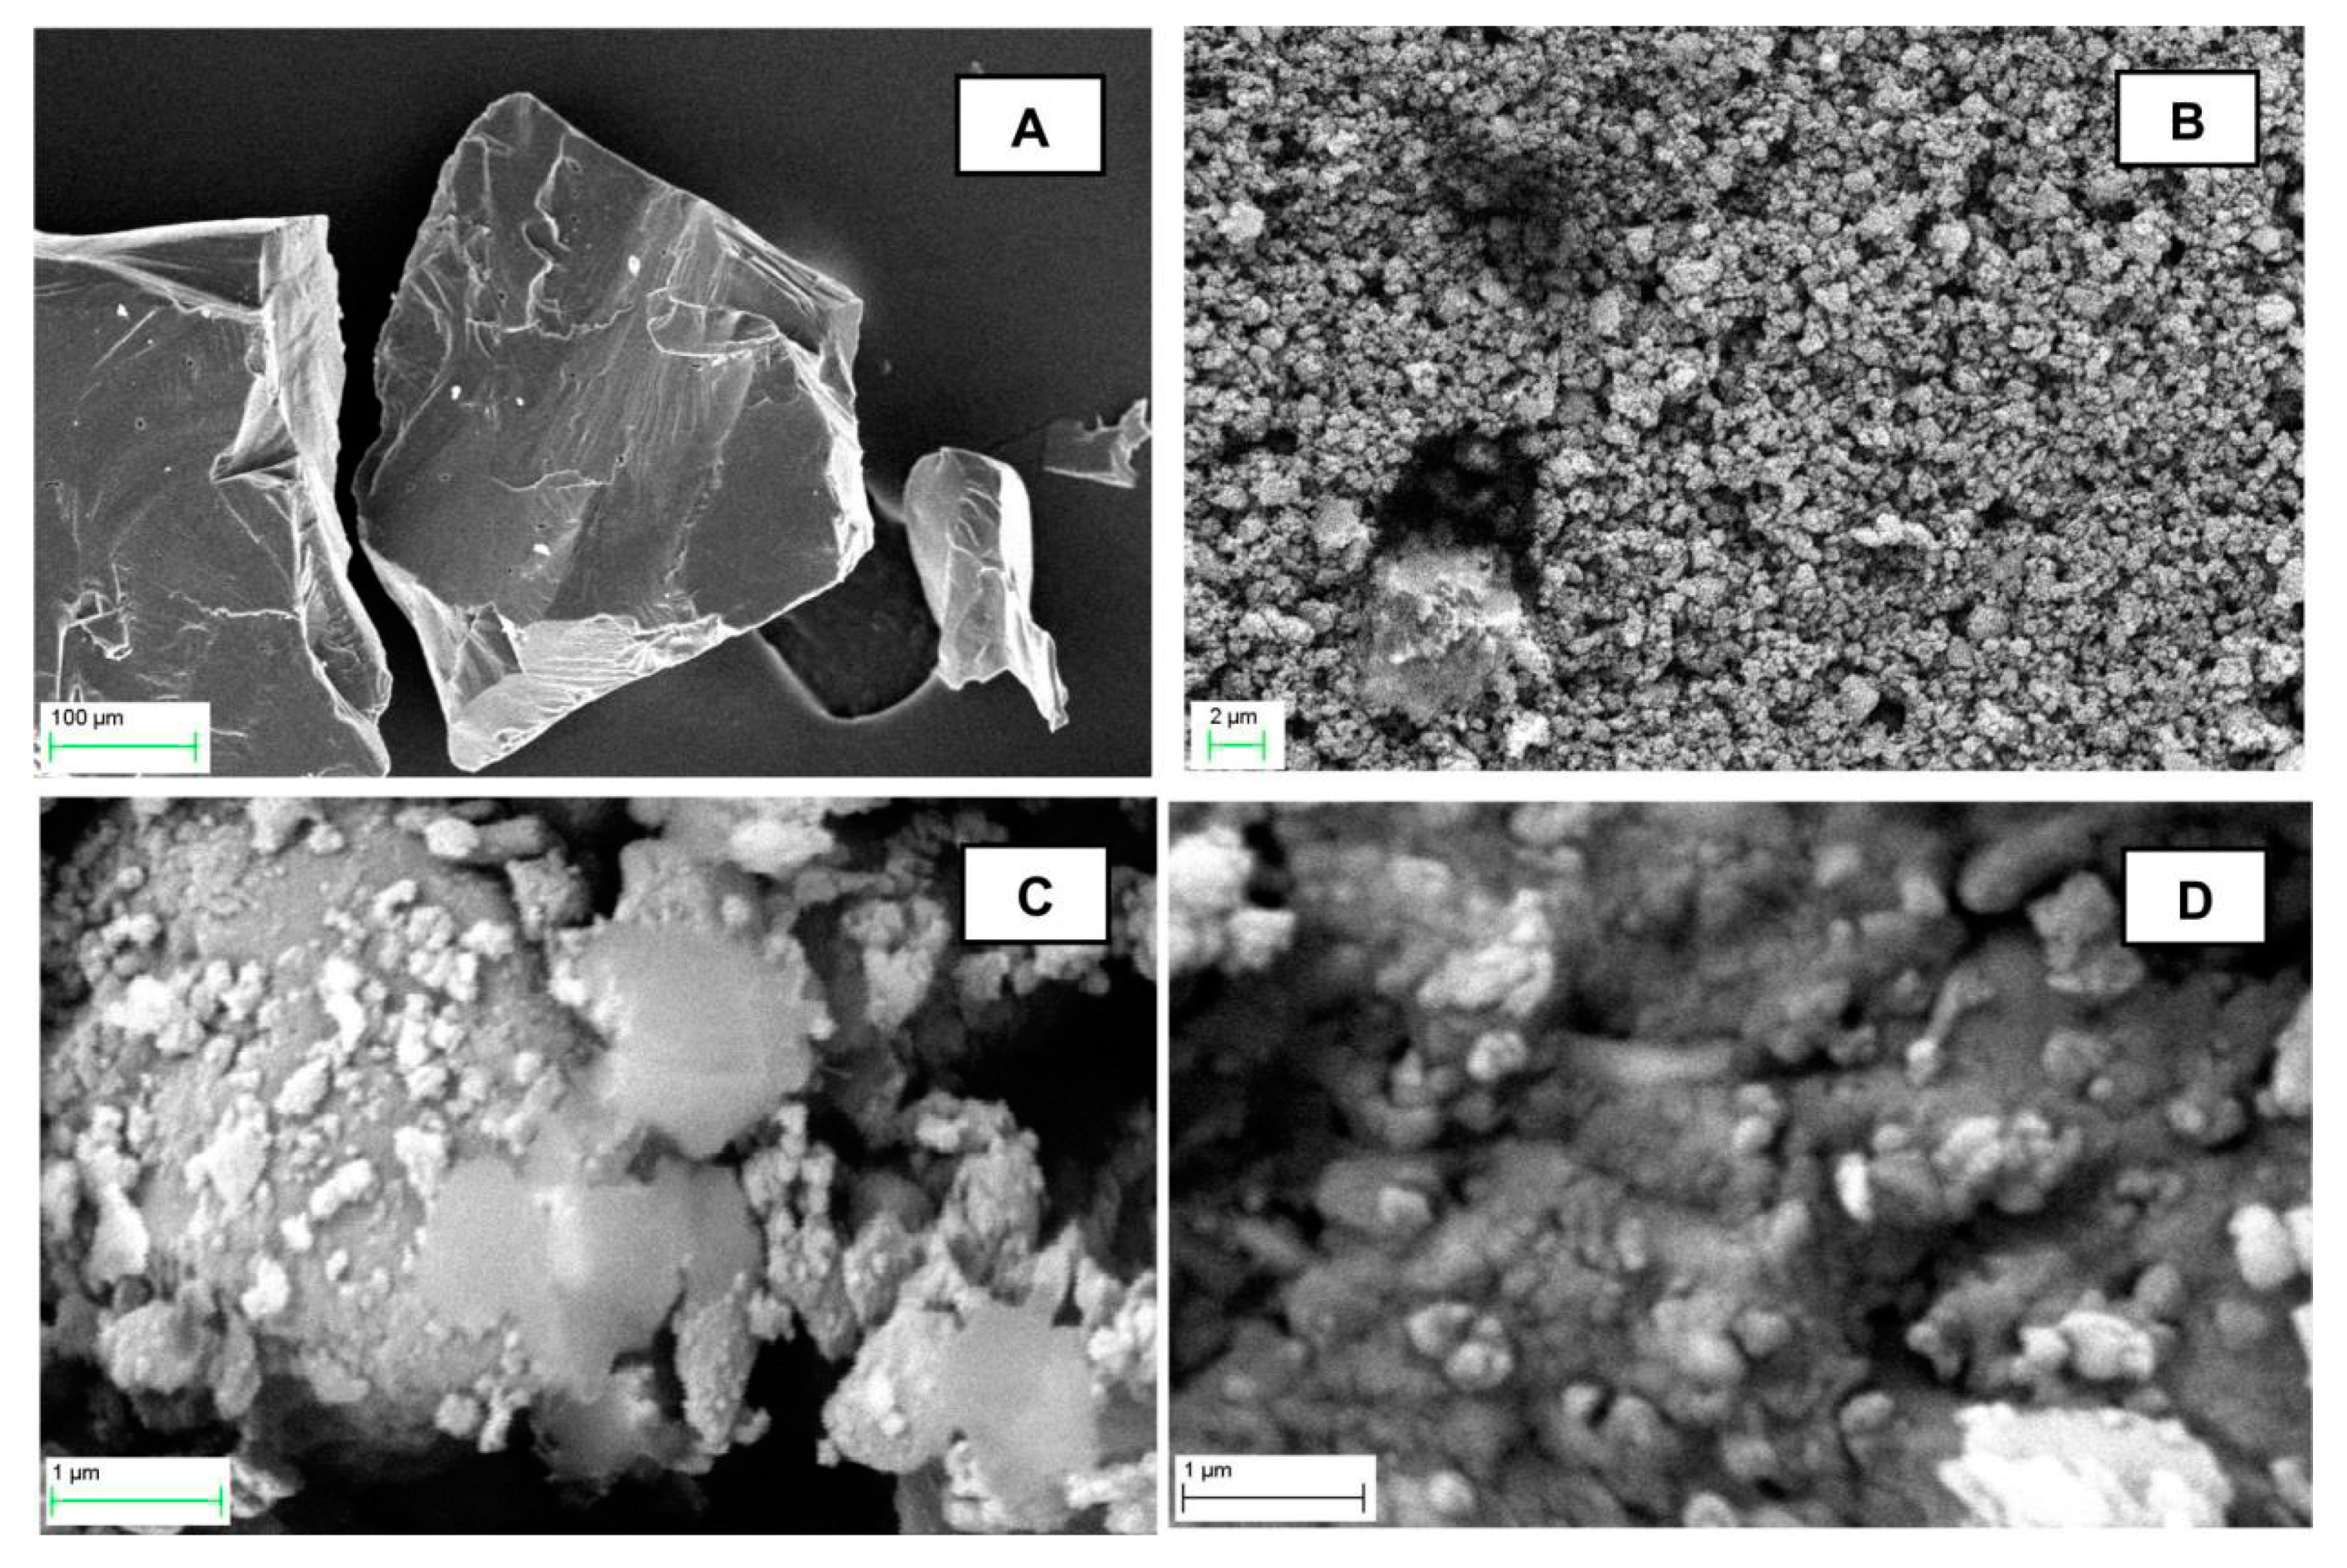
To perform shear experiments on quartz powders and to measure the friction coefficient generated by the quartz, we used a measuring system based on a ring mill, which is a grinding device based on shear forces and used in laboratories worldwide. The functional model of the ring mill, in order to be used as a dynamic tribometer, was recently published [11]. We believe that the ring mill can be used in shear stress tests on minerals, like other test equipment [3,12], to evaluate the transformations of minerals and their dynamic friction coefficient in real time. The ring mill was chosen after having studied its operation and modeled its movements as a tool for the evaluation of friction coefficients [11]. A ring mill consists of a cylindrical jar containing the grinding masses as coaxial cylinders and rings, made from high-strength materials, and moved by an oscillating movement caused by eccentric masses arranged on the mill motor axis. Inside the jar, the masses rotated by the jar’s eccentric oscillation rotate freely, at a speed that depends on the energy of the motor, masses, and the friction between the grinding bodies and the jar’s inner surfaces. With the model developed by the authors, it is possible to measure the grinding energy consumed instant-by-instant; the energy lost through the heat and average pressure generated by the thrust of the grinding masses; and, lastly, the friction coefficient between the mass and the material interposed. A broader explanation is provided in Appendix A. We used a FRITSCH P9 ring mill (FRITSCH Gmbh, Germany), equipped with a steel grinding vessel and grinding media (one ring and one cylinder). The jar was equipped with two thermocouples and two gas purges. Every grinding experiment was performed with about 6 kg of steel grinding media, at a variable grinding time from 60 to 2800 s on a fixed amount of quartz of 4 g. In the discussion of the experimental results, we will use the specific energy supplied by the grinding system, expressed in kJ for each mole of ground quartz, instead of its grinding time. In this way, our data can be compared with those obtained from other types of machines that generate friction stress. Data of slip distances, speed, and stress are reported in Table 1. It is worth noting that the quartz samples were tested in a controlled atmosphere and anhydrous conditions under a nitrogen flow of 100 mL/min. The quartz used in the experiments is a synthetic α-quartz made by Merck (Merck 107536); 90% of its grains have a diameter of about 800 microns. Quartz samples were analyzed by XRD, DSC-TGA, RAMAN spectrometry, and SEM electron microscopy. For the crystallographic and structural analyzes, two separate XRD devices were used. The first is a conventional diffractometer (Bruker D8—Bruker Gmbh, Germany, with a θ−2θ configuration, fitted with a copper anode tube, monochromatized Cu kα radiation, tension of 40 kV, current of 40 mA, scanning step of 0.001° of 2θ, and scan time of 4 s per step; Lynx Eye solid-state detector), used to analyze the cell parameters, percentage of crystallinity, and crystallite sizes, for each grinding time (and specific energies). All microstructural parameters were evaluated with Rietveld analysis software (TOPAS 5.0, Bruker Gmbh, Germany). The quartz specimens were measured in XRD after mixing with an internal standard (Silicon powder, GF07750403Aldrich ) in a ratio of 1:1, to define the errors introduced in the diffraction spectrum from the instrumentation.The second diffractometer is a Siemens D-500 (Siemens Gmbh, Germany), θ−2θ configuration, fitted with amolybdenum anode tube, Mo kα, λ = 0.0709 nm radiation, with a singlybent pyrolytic graphite monochromator, tension of 50 kV, current of 40 mA, scanning step of 0.1° of 2θ, and scan time of 300 s per step, from 5 to 120° 2θ. It was used for the measurements of the PDF (Pair Distribution Function). The PDF method comprises X-ray scattering spectroscopy that has been developed before 1950 to determine the structure of solid or liquid compounds that do not have a crystalline order. More details on the technique and on the application methods of the PDF analysis are reported in [13] and in Appendix B of this paper. RAMAN analyses were performed using a Malvern Morphology GS3Id (Malvern Panalytical, Malvern, UK), an optical microscope fitted with a 500 mW Raman spectrometer (Kaiser Optics at 785 nm, Kaiser Optical Systems, Inc. Ann Arbor, MI, USA) with a 2-micron spot. The specimens were prepared in the form of 13 mm diameter tablets, with no binders. The analysis was performed with acquisition times of 240 s, from 100 to 1500 cm−1, and with a resolution of 4 cm−1. DSC-TGA measurements have been performed with a simultaneous DSC–TGA TA 600 (TA Instruments, New Castle, DE, USA), with a rate of 1°/min (nitrogen atmosphere).The XRD and RAMAN analyses were also used for the phase determinations on the ground quartz samples fired at 1000 °C to evaluate the re-crystallization products.The annealing of the quartz samples was carried out in order to verify whether the dislocations induced in the quartz structure by stress could be reduced or eliminated with heat. Annealing of quartz should tend to reduce its number and bring the structure back to a pre-stress condition, similarly to what happens in crystalline materials of other types. If the post-stress material were composed only of quartz, after annealing we would have to obtain a quartz returned to its original or almost crystalline state. We then attempted to anneal the quartz at 1000 °C for two hours. The morphological analysis of the particles was performed using observations with a SEM scanning electron microscope (Zeiss EVO MA 10, Zeiss Gmbh, Germany) with LaB6 emitter gun, with Oxford LN2 energy dispersive microanalysis (Oxford Instruments, Abingdon, Oxon, UK).

3. Results

From the crystallographic analysis of the quartz samples, we found strong correlations between the variations of the cell parameters, the amorphous fraction contents, the value of the average crystallite sizes, and the values of the total energy for shear stress (specific energy, kJ/mol).
It should first of all be noted in Figure 1A that the quartz becomes completely amorphous over 24–27 kJ/mol of specific energy. The crystallinity of the quartz, assessed on the basis of the area of the diffraction peaks with respect to the total area (peaks plus background), is shown in Figure 1B and shows a trend inversely proportional to the increase in the specific energy. At the same time, the crystallite sizes tend to diminish with increasing grinding time, following an almost logarithmic path (Figure 1C). All three reports agree that the increase in specific energy leads to a decrease in the structural order of the quartz.
DSC TGA analysis shows other various essential features. Figure 1D shows the evolution of the enthalpy energy of the α−β quartz transition at 573 °C. As is known, α-quartz undergoes a structural transformation at 573 °C, namely its transformation into β-quartz [1,14,15,16]. It can be observed that DSC signals decays gradually with increasing the specific energy and becomes undetectable after 16 kJ/mol. Figure 1E shows the evaluation of the Gibbs free energy vs. the specific energies. It shows that during the first few minutes of the mill’s operation, nearly all the specific energy it generates becomes free energy stored by the material, and as the grinding proceeds, the remaining share of the specific energy increases. In Table 2, the friction coefficient of the grinding masses is compared, for the same treatment time, in two conditions: without quartz and with interposed quartz. As can be seen from the table, the friction between the steel masses without any interposed minerals causes a progressive increase in the COF, from the initial value of 0.08 to the value of 0.52. The same experiment, carried out by inserting 4 g of quartz in granules, determines a reduction in COF from 0.48 to 0.18 (Table 2). As we will see, the explanation is given by the transformation that the quartz undergoes during the grinding. Figure 2A compares the RAMAN spectra of α-quartz, β-quartz, α-cristobalite, β-cristobalite, and silica glass with the spectra of quartz samples. As can be seen in Figure 2A, the 464 cm−1 peaks are associated with α-quartz, and it is noted that its intensity tends to decline as the specific energy increases, while no hint of β-quartz bands can be observed. At the same time, we can observe the presence of a wideband between 297 and 301 cm−1, which corresponds to the 297 cm−1 bands of β-cristobalite, invisible to XRD analyses. In Figure 2B are presented the RAMAN spectra of the quartz samples heated to 1000 ° C: The bands related to the β-cristobalite are reinforced, and hematite (α-Fe2O3) is also present as a pollutant from the milling. The presence of these phases is also confirmed in X-ray diffraction (Figure 2C). In Figure 3 the PDF spectra of the silica samples can be seen, compared with silica glass, from which the diameters of the crystallitescan be measured, which are reduced with the increasing stress, reaching dimensions around 1.2–1.6 nm. A transformation in the structure of silica for energies that exceed 2.7 kJ/mol is shown by the disappearance of the two characteristic peaks of the Si-O2 and O-O2 bonds between 0.4 and 0.6 nm and the differences between silica glass and “amorphous” quartz for 20 kJ/mol. In the SEM images (Figure 4), some aggregates of the submicron particles at 13 kJ/mol (B) can be seen; at 16 kJ/mol, the aggregates tend to form spheroidal particles (C), whereas at 32 kJ/mol the particles tend to aggregate and merge as a “gel” (D).

4. Discussion of Results and Conclusions

The results unequivocally show that quartz subjected to shear stress undergoes a distortion of its crystalline lattice that is proportional to the amount of energy that caused the stress; this distortion is manifested as the variations of a percentage of crystalline fractions, diminishing crystallite sizes and the progressive loss of enthalpies of the α−β quartz transition (Figure 1A–E). At the same time, prolonged stress reduces the quartz’s friction coefficient (Table 2), and this allows us to suggest that the phenomena described are in some way related to one another. After a shear work up to 27 kJ/mol, the quartz appears to be in an “amorphous” phase under X-ray diffraction, characterized by the granules that do not exceed some tens of nm in size (as in Figure 4). By X-ray diffraction, it has been demonstrated that the prolonged stress determines the impossibility of retrograde transformation to α-quartz, and this is caused by an increase in the number of the quartz’s structural defects, as was predicted and calculated by [17], to the point that it will inevitably tend to form a cristobalite phase.The phenomenon of polymorphism induced on silica by stress was rigorously explained from a thermodynamic point-of-view by [17]. In particular, the authors emphasized the accumulation of reticular defects, measured as the dislocation density ρd(n/m2), which increase the value of the Gibbs “free energy” and determine a series of phase transitions in quartz. For example, transformation from α to β-quartz occurs at ρd = 6.3E15 m−2, with a ΔGd = 0.47 kJ/mol; the transformation from α-quartz to β-cristobalite occurs at ρd = 2.3 E16 m−2 (ΔGd = 1.44 KJ/mol), followed by the transformation of α-quartz to an amorphous phase at ρd = 2.5 E17 m−2 (ΔGd = 10.05 kJ/mol) [17,18]. These ΔG values are in the same order of the values measured in our experiments for the specific energies of 0.6, 1.5, and 15 kJ/mol, respectively. The progressive loss of the α to β quartz transition enthalpy (as we observed by DSC) corresponds to the progressive increase in the β-cristobalite phase (as we observed via Raman), which is a well-known auxetic mineral, with a Poisson coefficient lower than zero (on average −0.04 against the +0.084 of quartz) [19,20,21]. Beta cristobalite is unstable and easily transforms into alpha cristobalite, with a Poisson’s ratio of −0.169 [20,21].
A parallelepiped of this material would have a reduction of 16.9 cm for every 100 cm of thickness. These gaps could create voids and increase the porosity of the interposed material, decreasing its sliding resistance. The observed phenomenon would explain why the friction coefficient is low in our tests on quartz subjected to shear stress. The phenomenon of the progressive increase of stress, in the form of dislocations in the quartz structure, thus generates a progressive accumulation of cristobalite nanoparticles and a slipping condition that becomes increasingly favorable. Crystallite size was measured using the classical Debye–Scherer equation [22,23,24,25]:
Dave = Kλ/βcosθ, [nm]
where Dave is the average crystallite size of the particles, K is Debye–Scherer’s constant, λ is the wavelength of the incident radiation, β is the full width half maximum (FWHM) of the peak, and θ is Bragg’s angle samples. The estimation of the dislocation density for the nanoparticles, δnp, is assumed as [23,24,25].
δnp = 1/Dave2, [1/nm2]
Recently, PDF analysis has become common in determining the average size of crystallites and to derive the density of the dislocations of the nanoparticles [24,25]. Figure 3 shows that the quartz samples that have undergone moderate frictional stress show an atomic density function g(r) with a ripple that ends well above 5 nm, while, with increasing stress, the g(r) tends to be close to the mean density in an increasingly shorter ripple (“period”), up to 0.9–1 nm for samples that have undergone up to 20 kJ/mol. When the diameter of the nanoparticles (2 X period) reaches 1.8–2 nm, and then applying Equation (2), the dislocation density corresponds to 0.25/nm2 or 2.5 E17/m2, which is very close to the dislocation density calculated by [17] for quartz particles stressed at 20 kJ/mol. Therefore, while the α-quartz can change thermally in β-quartz and, as the temperature decreases, recede to the alpha form, the same mechanicallytreated quartz that undergoes stress higher than 15 kJ/mol will have a number of defects that will no longer allow the reverse passage, and will start to form a polymorphic phase. In the RAMAN spectra obtained on quartz samples subjected to shear stress (Figure 2A), the presence of bands that indicate the presence of cristobalite with an intensity proportional to the stress increase, undoubtedly indicate that a part of the α-quartz undergoes a transformation phase; since this observation is carried out at room temperature and pressure, it is evident that it is non-reversible. The generated cristobalite particles have nanometric dimensions and a short-period order that does not allow the generation of discrete diffraction spectra. However, the cristobalite has auxetic properties even in the form of nanoparticles, as has been shown by [19,20,21]. If there is a substantial and lasting increase of auxetic nanoparticles in the material, initially composed of only α-quartz, it is evident that the mechanical behavior of the whole system will change radically. The data obtained by Raman spectroscopy show the peak at 297 cm−1, typical of the cubic cristobalite of “high” temperature, with an area proportional to the specific energy spent. This phase is “frozen” in silica dust, as a sort of precursor of the crystalline phase α-cristobalite. This hypothesis is also supported by another observation: X-ray diffraction spectra of the ground samples, heated at 1000 °C and then cooled, showed the simultaneous presence of β-cristobalite and quartz. This observation is consistent with what happens in silica-based materials submitted to anisotropic pressures and fired at temperatures above 1000 °C, where the polymorphic phases coexist as high-temperature relicts with quartz [26]. The authors detected phases of the cristobalite–tridymite type in the post-compression quartz, in veins aligned along the sliding axis [26]. Summarizing, mechanical deformation leads quartz to form an amorphous metaphase, which behaves mechanically akin to crystalline cristobalite. The structure of cristobalite is auxetic, i.e., it has a negative Poisson ratio [19,20]. As pressure increases, both α− and β-cristobalite contract along the dimension perpendicular to the direction of stress: when subjected to pressure, it becomes hard, stiff, and smooth. It can do this thanks to its microstructure, which consists of rings composed of six tetrahedra connected by joints. When subjected to stress, the joints between the rings tend to close, and the structure rearranges itself to form a tough and slippery armor. This phase accumulates with the prolongation of stress and is not reversible, i.e., it does not tend to recrystallize into quartz, at least not in the short term. Consequently, the accumulation of cristobalite determines a substantial reduction of the slip resistance. We believe that cristobalite, mixed with amorphous silica, is the main ingredient of the particles generated by friction stress, which have diameters in the order of a few nanometers, aggregated to form structures in the order of a few hundred nanometers, as can be seen from the Figure 4C,D. These particles have spheroidal shapes and their aggregates form a sort of dry “gel”. In conclusion, we believe that the explanation of the lowering of the friction coefficient is to be found in the progressive accumulation of nanocrystalline cristobalite in granules with spherical morphologies and nanometric dimensions, such as to generate interposed layers of extremely slippery materials.

Author Contributions

Conceptualization and methodology by G.M. and P.P., analysis and investigation by P.P. and E.T., writing by P.P. and G.M. All authors have read and agreed to the published version of the manuscript.

Funding

This research received no external funding.

Acknowledgments

Thanks are due to Samuel Haines and to an unknown Reviewer who contributed, with their suggestions, to improve the quality of the present paper. The Chinese Academy of Sciences Visiting Professorship partially supported Giovanni Martinelli for Senior International Scientists (2018VMA0007).

Conflicts of Interest

The authors declare no conflict of interest.

Appendix A

Analysis of Friction Coefficients in a Vibrating Cup Mill (Ring Mill)

This appendix describes how a ring mill is used as a friction coefficient analysis system for granular materials during grinding. A ring mill (Figure A1) is a grinding system well known to laboratories analyzing inorganic materials, attributable to the friction mills category [11].
To understand the kinematics of the ring mill, the rotating jar and moving grinding bodies were filmed using an HD digital camera and grinding body movements were analyzed using commercial video editing software. Tests performed, first with single grinding bodies and then with the two bodies together, both dry and with oil, unambiguously prove that the movement is that of a mechanical system of “clutch coupled wheels”, where the larger wheels turn the smaller ones, faster and with less torque (Figure A1). Put simply, the acceleration caused on the jar oscillating gives a ring grinding body a revolution around the jar center, in the same rotation direction as the jar but faster and rotation around its center in the opposite direction. The same happens to the ring-cylinder system. The rotation-revolution system doubles if we consider the jar rotation center, eccentric compared to its center, even if just slightly. The combination of these rotations and their harmonics gives rise to a highly complex revolution, rotation, sliding, and translation system. The movement filmed enabled us to create a mechanical model based on the “coupled wheels” system principle. In this coupling system, couples and powers are transmitted using the action of tangential forces to the contact surfaces (sliding friction forces). In an analogy with the ring mill, equipped with a jar, a ring and a cylinder, each one coaxial to the other, we have three circular wheels (that is cylindrical considering the third dimension, with rj, rre, rri, and rc, the radii of jar, external-ring, internal ring and cylinder) in contact and are pressed against each other by equal and opposite forces applied to the respective centers. In the point of contact between the jar and ring (Figure A2), you have a Njr force (directed radially rather than to the circumference) that can produce an Rjr friction force (tangent to the circumference). In the contact point between the ring and cylinder, we will have an Nrc force directed radially, and an Rrc directed tangentially. In ideal functioning, with no friction, the drive torque is equal to the load torque:
Mj × ω1 = Mr × ω2 and Mr × ω2 = Mc × ω3
where Mj, Mr, and Mc are, respectively, the motor moment (jar), the ring resistance moment, and the cylinder resistance moment. In real operations the drive torque will lose power because of the friction:
Mj × ω1 xηjr = Mr × ω2 and Mr × ω2 xηrc = Mc × ω3
where ηjr and ηrc are the transmission efficiencies. During motion, so that there is no slipping, the peripheral speeds of the coupled wheels, the jar with external ring, and the internal ring with cylinder must be equal and the friction force R must be greater or equal to the transmitted force F:
f × N > F
where f is the coefficient of friction and
Fj = Mj/rj and Fr = Mr/rre
So, if the non-slipping condition is achieved, the peripheral speeds of the contact point are equal to each other:
ω1 × rj = ω2 × rre and ω2 × rri = ω3 × rc
that is, the transmission ratio is
τjr = ω2/ωl = rj/rre and τrc = ω3/ω2
where rj and rre = the radii of the jar and the ring (external), rri = the ray of the internal ring, rc = the radius of the cylinder, and ω1, ω2, and ω3 = the angular speed of the jar, ring, and cylinder, respectively.
As we can see in Figure A1, the analogy between the coupling of friction wheels and the jar-ring pair and ring-cylinder is considerable. However, in the case of the ring mill, to the coupling and resulting “wheel-on-wheel” friction we need to add friction from slipping, between the upper and lower surfaces of the ring and the cylinder, the bottom, and top of the jar. As a whole, the grinding bodies are subject to two kinds of friction:
(1)
friction from slipping (grinding bodies that slip on the jar’s flat surfaces);
(2)
rolling friction (grinding bodies which, if coupled, roll into each other).
In the calculation model of the rotation frequencies of the ring mill’s grinding masses, we need to consider that the rotation of the ring and cylinder comes from an eccentric rotation of the jar around a center, which is moved compared to the jar center and which increases its rotation radius. This also affects the radius of coupling between jar and ring and between ring and cylinder. For the jar-ring and the ring-cylinder couples, coupling ratios can be expressed as
τ jr = rj/rre
where rj is the jar radius and rre is the external radius of the ring;
τ jre = rje/rre
where rje is the eccentric radius of the jar, greater than the radius of the simple jar;
τrc = rri/rc
where rri is the internal radius of the ring, and rc is the cylinder radius.
Relations from Equations (A7)–(A9) indicate that the transmission ratio can be expressed using just the geometrical parameters of the friction wheels. For the ring mill, the first coupling takes place between the jar, with angular speed ωl and the ring, which reaches an angular speed ω2, higher than ωl, and equal to
ω2 = ωl × τjr = ωl × rj/rre
The ring itself, considering the eccentric radius, is 15% greater than the jar radius, and generates an even greater frequency pulsation:
ω2ε = ωl × τjre= ωl × rje/rre
where rje = rj + re. This rotation frequency is visible as the reference system of the reading device is outside the jar and stationary. The cylinder will be characterized by a frequency ω3 in the ring rotation direction, due to the coupling of the cylinder and the ring which rotates at speed ω2:
ω3 = ω2 × rri/rc
and from a rotation at frequency ω4, due to the coupling of the cylinder and the ring that rotates at speed ω2ε,
ω4 = ω2ε × rri/rc
This rotation frequency is visible, too, as the reference system of the reading device is outside the jar and stationary. Each of these pulsations generates harmonics, which can extend up to a few kHz of frequency. From the rotation speeds calculated, you obtain a maximum value of the centrifugal force exercised by the grinding masses which, compared to the jar reference systems, take on the expression:
Nc = mc × ω32xrc
where mc is the cylinder mass
Nr = mr × ω22 × rre
where mr is the ring mass.
The normal force value is variable: from a minimum equal to N = Nr-Nc, when ring and cylinder push in two opposite directions, at the time of maximum thrust, when the thrusts of ring and cylinder are directed in the same direction, when you have:
N = Nr + Nc
The “Total friction coefficient” of the cylinder-ring-jar complex will then be calculable as
ε = F/N
where F is the tangential force, already expressed in (4) and N is the normal force at the sliding wall, obtainable for Ratios (14) and (15). The tangential force can also be expressed as friction force; that is, the force that the grinding bodies implement on the sliding walls and which in turn can be obtained from the resistance performed by the grinding masses, the cylinder on the ring wall, and the ring on the jar wall.
The measure of spent energies in friction is obtained from the total power absorbed by the motor of the mill, with a device (for example, directly from the inverter that controls the electric motor):
N = π4/54,000 × (do2−d12) × ρ × a × hr × d × ε × n3, [J/s]
where N = the power consumed by the motor at instant t, hr = the height of ring, do is the outer diameter and di is the inner diameter of the ring, ρ is the density of steel, a is the distance between the center of the mill and the center of the ring, N is the rotational speed (RPM); and ε the total friction coefficient. The value of the speed n refers to the grinding mass analyzed; the speeds of each mass with respect to its “container” must therefore be sought: the ring with respect to the vessel and the cylinder with respect to the ring. To ensure that the tribometry can be implemented through the ring mill, it is necessary to create a non-invasive measurement system of the grinding mass rotation speeds. We used a method that exploits the electric signal induced by the metallic grinding masses in the jar on a coil coaxial to the jar itself. The movement detection system is formed by an enameled copper inductance of 50 spires, 0.4 mm thick, with three intermediate contacts to obtain electrical resistances of 1.9, 3.1, and 6.9 Ω, and an overall 72 mH of inductance. Similarly to an electric machine, the grinding masses in the jar form a mobile part (rotor), while the coil and the jar itself form the stator. The coil signals are electromagnetic impulses lasting from 0.1 to 1E−4 s, a for a range of frequencies between 10 Hz and 10 kHz. They are sent to the sound card on the measurement PC and recorded on the harddisk. The signal analysis software was Sigview 2.6.1. The audio signal wasrecorded with a sampling frequency of 11,025 Hz, with a refresh frequency of 2.69 readings/second and a data block length of 4096 samples. The digitalized signal wasthen analyzed by FFT, using a data block length of 16,384 samples, which leads to a reading resolution of 0.24 Hz. The FFT enabled us to observe the following signals (Figure A2):
(1)
the main rotation signal (jar, ωl);
(2)
signals due to the internal grinding masses (ring, ω2, and ω2ε, and cylinder, ω3, and ω4)—the signal harmonics up to a few kHz of frequency.
In this way, it waspossible to calculate the “total friction coefficient” during the milling process, with the measure of ring speed and total power absorbed by the motor.
Figure A1. Diagrams of the movements of the grinding masses in a ring mill. Simplified model of the gearing; Nc = Normal Force between cylinder and ring, Rjr = Resistance force between jar and ring, Rrc = Resistance force between ring and cylinder, rc = cylinder radius, rri = ring internal radius, rre = ring external radius, rj = jar radius, Cc = cylinder geometrical center, Cr = ring geom. Center, Ce = eccentric center, CJ = jar geom. Center, ω1, ω2, ω2ε, ω3 = rotation frequencies of jar, ring, ring eccentric and cylinder.
Geosciences 10 00155 g0a1
Figure A2. Frequency analysis of ring mill angular speed: 25 Hz (1500 RPM) = jar; 29 Hz (1740 RPM) = ring; 37 Hz (2220 RPM) = ring eccentric; 40 Hz (2400 RPM) = cylinder inside ring.
Geosciences 10 00155 g0a2

Appendix B

Appendix B.1. The PDF Analysis of Amorphous Materials

The PDF method provides a direct measure of the probability of finding an atom surrounding a central atom at a radial distance away from the Fourier transform of the “structure–function”, defined as Q = (4π sin θ)/λ), and in turn derived from the X-ray diffraction of the sample performed by means of a short wavelength radiation λ; in samples with some degree of structural disorder, the signal amplitude in the PDF function falls off, and this becomes a useful measure of the structural coherence of the sample and to measure the diameter of the nanoparticles. The reduced atomic pair distribution functions G(r) = 4πr[ρ(r)−ρo], pair distribution function g(r) = ρ(r)/ρo, and radial distribution function RDF = 4πr2ρ(r) are calculated by Fourier series, transforming the experimental reduced structure factor. The G(r) function is defined by
G ( r ) = 4 π r [ ρ ( r ) ρ 0 ] = 2 / π 0 Q [ S ( Q ) 1 ] sin ( Q r ) d Q
where ρ(r) is the atomic density at a distance “r” from a reference point, ρ0 is the mean atomic density, and Q is the structure factor, defined as Q = (4π sin θ)/λ). Structure functions of the quartz samples were calculated on an interval from 0.771 to 15.32 Å−1 of reciprocal space. The samples were weighed before being analyzed, in order to calculate the real density and the absorption coefficient at the wavelength of the radiation used. To obtain the RDF analyses, the quartz samples’ diffractions were analyzed by V. Petkov’s RAD software [27].

Appendix B.2. The Measurements of Enthalpies of −β Quartz Transitions and Gibbs Free Energy

An essential measure in this work is the determination of the enthalpies of the polymorphic transformations of quartz, such as in particular the α−β quartz transition enthalpy at 573 °C and the amount of molar Enthalpy ΔHd, and from this, the “Gibbs free energy, ΔGd, i.e., the energy stored as plastic deformation by the remaining quartz after grinding. The Gibbs free energy and molar Enthalpy ΔHd are linked by the relation
ΔGd = ΔHd − T ΔSd,
where T is the temperature in °K, ΔHd is molar enthalpy, and ΔSd molar entropy. Dislocations are mostly one-dimensional imperfections, and the calculations suggest that ΔSd entropy is small enough to be negligible [18] compared to enthalpy, so:
ΔGd ≈ ΔHd
For this reason, the evaluation of enthalpy provides the Gibbs free energy. These measures serve to know how much of the quartz, after stress, is still available to transition from alpha quartz to beta quartz (this can be seen from the transformation enthalpy alfa–beta and what is the free-energy level of the quartz samples, which is linked to the number of dislocations generated by stress [17,18]. The Reader must remember that these dislocations are responsible for the possibility of causing or not polymorphic transformations to occur. The amount of molar enthalpy was calculated using the “high-temperature oxide melt solution calorimetry” method [28,29] and is based on measuring the melting heat of the material when it is mixed with a low-melting substance. During melting, the material releases its stored dislocation energy via an exothermic reaction that reduces the area of the endothermic melting peak. The ΔHd is then obtained as the difference between the melting energy measured in the endothermic reaction of the material in its unaltered state on being ground:
ΔHd = ΔHo−ΔHt
where ΔHo is the melting enthalpy of the material in its unaltered state, and ΔHt is the melting enthalpy of the material once ground.

References

  1. Heaney, P.J.; Prewitt, C.T.; Gibbs, G.V. Silica: Physical Behavior, Geochemistry, and Materials Applications. Rev. Miner. 1994, 29, 606. [Google Scholar]
  2. Richet, P.; Gillet, P. Pressure-induced amorphization of minerals: A review. Eur. J. Miner. 1997, 9, 907–934. [Google Scholar] [CrossRef] [Green Version]
  3. Nakamura, Y.; Muto, J.; Nagahama, H.; Shimizu, I.; Miura, T.; Arakawa, I. Amorphization of quartz by friction: Implication to silica-gel lubrication of fault surfaces. Geophys. Res. Lett. 2012, 39. [Google Scholar] [CrossRef]
  4. Goldsby, D.L.; Tullis, T.E. Low frictional strength of quartz rocks at subseismic slip rates. Geophys. Res. Lett. 2002, 29, 1844. [Google Scholar] [CrossRef]
  5. Di Toro, G.; Goldsby, D.L.; Tullis, T.E. Friction falls towards zero in quartz rock as slip velocity approaches seismic rates. Nature 2004, 427, 436–439. [Google Scholar] [CrossRef]
  6. Di Toro, G.; Hirose, T.; Nielsen, S.; Pennacchioni, G.; Shimamoto, T. Natural and Experimental Evidence of Melt Lubrication of Faults During Earthquakes. Science 2006, 311, 647–649. [Google Scholar] [CrossRef] [Green Version]
  7. Hayashi, N.; Tsutsumi, A. Deformation textures and mechanical behavior of a hydrated amorphous silica formed along an experimentally produced fault in chert. Geophys. Res. Lett. 2010, 37, L12305. [Google Scholar] [CrossRef]
  8. Hirose, T.; Shimamoto, T. Growth of molten zone as a mechanism of slip weakening of simulated faults in gabbro during frictional melting. J. Geophys. Res. Space Phys. 2005, 110, B05202. [Google Scholar] [CrossRef]
  9. Hirose, T.; Bystricky, M. Extreme dynamic weakening of faults during dehydration by coseismic shear heating. Geophys. Res. Lett. 2007, 34. [Google Scholar] [CrossRef]
  10. Tanaka, H.; Song, Y.F.; Chen, W.M.; Chen, Y.M.; Ma, K.F.; Liang, K.S. Dynamic Mechanochemistry of Seismic Slip from Chelungpu Fault, 01B1 SWLS-X-ray Microscopy; Int. Congress: Taiwan, China, 2012. [Google Scholar]
  11. Plescia, P.; Tempesta, E. Analysis of friction coefficients in a vibrating cup mill (ring mill) during grinding. Tribol. Int. 2017, 114, 458–468. [Google Scholar] [CrossRef]
  12. Di Toro, G. SHIVA, a Slow to High Velocity Apparatus Designed to Investigate Friction and Wear in Rocks and Materials; Texas A&M: College Station, TX, USA, 2012. [Google Scholar]
  13. Egami, T.; Billinge, S.J.L. Underneath the Bragg Peaks: Structural Analysis of Complex Materials; Pergamon Press, Elsevier: Oxford, UK, 2003. [Google Scholar]
  14. Dolino, G. The α-β transitions of quartz: A century of research on displacive phase transitions. Phase Transit. 1990, 21, 59–72. [Google Scholar] [CrossRef]
  15. Hemingway, B.S. Quartz: Heat capacity from 340 to 1000 °K and revised values for the thermodynamic properties. Am. Miner. 1987, 72, 273–279. [Google Scholar]
  16. Peng, Z.; Redfern, S.A.T. Mechanical properties of quartz at the α–β phase transition: Implications for tectonic and seismic anomalies. Geochem. Geophys. Geosyst. 2013, 14, 18–28. [Google Scholar] [CrossRef] [Green Version]
  17. Tromans, D.; Meech, J. Enhanced dissolution of minerals: Stored energy, amorphism and mechanical activation. Miner. Eng. 2001, 14, 1359–1377. [Google Scholar] [CrossRef]
  18. Cottrell, A.H. Dislocations and Plastic Flow in Crystals; Oxford University Press: London, UK, 1958. [Google Scholar]
  19. Yeganeh-Haeri, A.; Weidner, D.J.; Parise, J.B. Elasticity of α-Cristobalite: A Silicon Dioxide with a Negative Poisson’s Ratio. Science 1992, 257, 650–652. [Google Scholar] [CrossRef]
  20. Alderson, A.; Evans, K.E. Deformation mechanisms leading to auxetic behaviour in the α-cristobalite and α-quartz structures of both silica and germania. J. Phys. Condens. Matter 2008, 21, 025401. [Google Scholar] [CrossRef] [Green Version]
  21. Alderson, A.; Alderson, K.; Evans, K.E.; Grima, J.; Williams, M. Modelling of Negative Poisson’s Ratio Nanomaterials: Deformation Mechanisms, Structure-Property Relationships and Applications. J. Metastab. Nanocryst. Mater. 2005, 23, 55–58. [Google Scholar] [CrossRef]
  22. Ungár, T.; Borbély, A. The effect of dislocation contrast on x-ray line broadening: A new approach to line profile analysis. Appl. Phys. Lett. 1996, 69, 3173–3175. [Google Scholar] [CrossRef]
  23. Ungár, T.; Dragomir, I.; Révész, Á.; Borbély, A. The contrast factors of dislocations in cubic crystals: The dislocation model of strain anisotropy in practice. J. Appl. Crystallogr. 1999, 32, 992–1002. [Google Scholar] [CrossRef] [Green Version]
  24. Gubicza, J.; Szépvölgyi, J.; Mohai, I.; Zsoldos, L.; Ungár, T. Particle size distribution and dislocation density determined by high resolution X-ray diffraction in nanocrystalline silicon nitride powders. Mater. Sci. Eng. A 2000, 280, 263–269. [Google Scholar] [CrossRef]
  25. Sutapa, I.W.; Wahab, W.; Taba, P.; Nafie, N.L. Dislocation, crystallite size distribution and lattice strain of magnesium oxide nanoparticles. J. Phys. Conf. Ser. 2018, 979, 012021. [Google Scholar] [CrossRef]
  26. Brodie, K.H.; Rutter, E.H. Rapid stress release caused by polymorphic transformation during the experimental deformation of quartz. Geophys. Res. Lett. 2000, 27, 3089–3092. [Google Scholar] [CrossRef]
  27. Petkov, V. RAD, a program for analysis of X-ray diffraction data from amorphous materials for personal computers. J. Appl. Crystallogr. 1989, 22, 387–389. [Google Scholar] [CrossRef] [Green Version]
  28. Kleppa, O.; Hong, K. New applications of high-temperature solution calorimetry 1. Enthalpy of the diamond-to-graphite transformation and enthalpy of formation of Mn5C2 at 1320 K. J. Chem. Thermodyn. 1978, 10, 243–248. [Google Scholar] [CrossRef]
  29. Cheng, J.; Navrotsky, A. Enthalpies of formation of LaBO3 perovskites (B = Al, Ga, Sc, and In). J. Mater. Res. 2003, 18, 2501–2508. [Google Scholar] [CrossRef]
Figure 1. Correlations between the microstructural and chemical parameters of quartz vs. specific energy. (A) The X-ray diffraction peak (101) of α-quartz; (B) crystallinity vs. specific energy; (C) crystallite sizevs. specific energy; (D) DSC analysis of the energy of the transition α−βof quartz vs. specific energy; (E) correlation between Gibbs free energy vs. specific energy.
Geosciences 10 00155 g001
Figure 2. (A,B) Raman spectra of the quartz samples vs. spectra of α-quartz, β-quartz, α-cristobalite, β-cristobalite, and vitreous silica. (A) Raman Spectra of quartz after milling; (B) Raman Spectra of quartz samples after milling and heating at 1000 °C. (C) X-ray diffraction spectra of quartz samples, after stress at 1.4 kJ / mol and after annealing; black = α-quartz, blue = β-cristobalite and red = hematite.
Geosciences 10 00155 g002
Figure 3. Pair Distribution Function analysis of the quartz samples at different specific energy of shear stress.
Geosciences 10 00155 g003
Figure 4. SEM images of the quartz samples: (A) undisturbed; (B) quartz groundat 13.6 kJ/mol; (C) quartz ground at 16.3 kJ/mol; (D) quartz ground at 32 kJ/mol.
Geosciences 10 00155 g004
Table 1. Slip velocity, slip distances, normal stress, and shear stress during milling in a vibrating cup mill from [11].
Rotation Speed [RPM]Grinding Mass Speed [m/s]Slip Distances [m]Slip Speed (1) [m]Normal Stress [Mpa]Shear Stress [Mpa]
10006.54.72.212976
12008.66.02.9195101
150010.67.23.5279110
Table 2. Friction coefficient values for quartz at different grinding times, with a fixed ratio between the grinding mass and material mass.
Time (Sec)Specific Energy from Grinding (kJ/g)Mean Friction Coefficient (Steel/Steel)Mean Friction Coefficient (Steel/Quartz)
5406.10.080.48
120013.60.100.38
140015.80.170.37
150017.00.220.29
282031.90.520.18

