Article

The Altotiberina Low-Angle Normal Fault (Italy) Can Fail in Moderate-Magnitude Earthquakes as a Result of Stress Transfer from Stable Creeping Fault Area

MOX, Department of Mathematics, Politecnico di Milano, 20133 Milan, Italy
Geosciences 2020, 10(4), 144; https://doi.org/10.3390/geosciences10040144
Submission received: 20 February 2020 / Revised: 11 April 2020 / Accepted: 13 April 2020 / Published: 16 April 2020
(This article belongs to the Special Issue 2020: A 10 Years Journey-Advances in Geosciences)

Abstract

:
Geological and geophysical evidence suggests that the Altotiberina low-angle (dip angle of 15–20 ° ) normal fault is active in the Umbria–Marche sector of the Northern Apennine thrust belt (Italy). The fault plane is 70 km long and 40 km wide, larger and hence potentially more destructive than the faults that generated the last major earthquakes in Italy. However, the seismic potential associated with the Altotiberina fault is strongly debated. In fact, the mechanical behavior of this fault is complex, characterized by locked fault patches with a potentially seismic behavior surrounded by aseismic creeping areas. No historical moderate (5 ≤ Mw ≤ 5.9) nor strong (6 ≤ Mw ≤ 6.9)-magnitude earthquakes are unambiguously associated with the Altotiberina fault; however, microseismicity is scattered below 5 km within the fault zone. Here we provide mechanical evidence for the potential activation of the Altotiberina fault in moderate-magnitude earthquakes due to stress transfer from creeping fault areas to locked fault patches. The tectonic extension in the Umbria–Marche crustal sector of the Northern Apennines is simulated by a geomechanical numerical model that includes slip events along the Altotiberina and its main seismic antithetic fault, the Gubbio fault. The seismic cycles on the fault planes are simulated by assuming rate-and-state friction. The spatial variation of the frictional parameters is obtained by combining the interseismic coupling degree of the Altotiberina fault with friction laboratory measurements on samples from the Zuccale low- angle normal fault located in the Elba island (Italy), considered an older exhumed analogue of Altotiberina fault. This work contributes a better estimate of the seismic potential associated with the Altotiberina fault and, more generally, to low-angle normal faults with mixed-mode slip behavior.

1. Introduction

The Altotiberina fault (ATF) is located at the Tuscany–Umbria–Marche regional boundary within the Northern Apennines (Figure 1), a NE- verging thrust-fold belt undergoing NE-trending extension at a rate of about 3 mm/yr [1]. ATF was identified by the interpretation of seismic reflection profiles that highlighted a regional low-angle normal fault dipping 15–20 ° toward the Adriatic Sea [2,3]. On the ATF hanging wall a set of minor syn- and antithetic splay faults sole into the detachment at 4–6 km depth. These structures, characterized by higher dip angles compared to the ATF, have generated small–moderate-magnitude earthquakes; the largest one of M w = 5.1 occurred in 1984 on the Gubbio fault plane [4]. According to the works of [5,6] only microseismic events (<2.3 M L ) have been located along the 500–1000 m thick fault zone cross-cutting the upper crust from 4–5 km down to 14–16 km depth and coinciding with the geometry and location of the ATF (Figure 1). The seismicity nucleating along the ATF is characterized by a nearly constant rate of earthquake production r = 7.30 × 10 4 earthquakes day 1 km 2 , corresponding to about three events per day with M L < 2.3 . The microseismicity nucleating on the ATF is not able to explain the amount of deformation associated with the short- and long-term slip rate inferred by geological [7] and geodetic studies [8,9], suggesting a prevalent aseismic deformation. In support of this hypothesis, talc minerals, characterized by a very low friction coefficient ( 0.05 < μ S < 0.23 ; [10]) with a velocity-strengthening slip behavior (e.g., creeping), have been observed to form interconnected foliated networks within the Zuccale fault core, a low-angle normal fault located in the Elba island (Italy) and considered the (older) exhumed analogue of the ATF [11,12,13]. Only recently these hypotheses have been confirmed [6,14]. Indeed, to investigate spatial variations of the frictional behavior along the ATF surface, Anderlini et al. [14] mapped the coefficient of interseismic coupling (the ratio of the long-term seismic slip rate to the tectonic slip rate) by inverting GPS data. They found that about half of the ATF surface below 5 km of depth is characterized by creep, producing a long-term slip rate of 1.7 ± 0.3 mm/yr, while the remaining portion of the same fault is locked and it may be capable of generating M6.5+ earthquakes. In addition, thanks to a 5-year-long (2010–2014) high-resolution earthquake catalogue of about 40,000 events [6,15] observed a striking positive correlation between the creeping regions and the microseismic activity (<2.3 M L ), characterized by clusters of repeating earthquakes, whereas locked portions (asperities) are noticeably less productive or almost silent. The seismic moment released by the ATF seismicity accounts for 30% of the geodetic one [6], implying aseismic deformation. Finally, Independent Component Analysis of GPS time series revealed a large aseismic contribution for swarm-like activity that occurred in the hanging wall of the ATF in 2013–2014 [16]. The ATF deformation pattern is thus consistent with a mixed-mode (aseismic and seismic) slip behavior [6,14,16,17].
These studies have clarified how ATF accommodates the extension in the Umbria–Marche crustal sector of the Northern Apennine, but one question about the seismic potential of this fault remains unsolved: whether the locked patches of ATF can generate moderate (5 ≤ Mw ≤ 5.9) magnitude earthquakes. In facts, different historical moderate magnitude earthquakes are associated with the region where the ATF is located ([18]; Figure 1), but is not possible to discriminate if these earthquakes occurred directly along the ATF plane or/and along the synthetic and antithetic faults of the ATF. In addition the locked ATF fault patches could be characterized by high frictional strength as the lens of competent material found in the Zuccale fault core [13]. If this were the case, then high sliding friction coefficient ( μ 0.6 [19]) would inhibit the sliding along these patches since they are located in a low-angle plane that is misoriented with the extensional stress field characterized by vertical σ 1 [20]. In this way, the rupture should occur only on other well-oriented faults like the Gubbio fault (GF) dipping 40 ° SW and intersecting the ATF at ∼5 km of depth. This behavior is predicted by the frictional fault reactivation theory [21,22] and is consistent with the absence of instrumental moderate-to-strong earthquakes on normal faults dipping less than 30 ° [20]. However, this theory does not account for the stress transfer induced by creeping fault segments located on the same fault plane of the locked patches like in the case of ATF. In addition, the heterogeneous distribution of frictional parameters can allow the fault to be prone to start a rupture [23]. To address this question we perform a numerical simulation of the long-term deformation along ATF and GF by a geomechanical model that takes in account the spatial variation of fault friction.

2. Model Set-Up

2.1. Model Geometry and Material Properties

The geometry and mesh of the model are built using the software Cubit (https://cubit.sandia.gov/) and imported into Abaqus [24] for finite element modeling. The geometry is characterized by a crustal volume of 150 × 150 × 40 km 3 where the ATF and GF are located. The surface topography is resampled at 1 km from Shuttle Radar Topographic Mission (SRTM, http://www2.jpl.nasa.gov/srtm/; Figure 1). ATF and GF are represented by two planar surfaces dipping 18 ° NE and 40 ° SW respectively [2,3,25]. The surfaces are imprinted in the crustal block through Boolean operators. The volume is meshed by 3,673,141 tetrahedral elements. The nodes along the fault surfaces are split in two following the split-node technique described in [26] to allow fault slip. The crust is characterized entirely by a frictional-elastic rheology. For the elastic part we consider a shear modulus (G) of 28 GPa, a poisson ratio ( ν ) equal to 0.25 and a density of 2500 kg/m 3 .

2.2. Rate- and State-Dependent Friction Law

The deformation along ATF and GF is governed by the rate-and-state dependent friction law [27,28,29,30]:
μ ( V , θ ) = μ 0 + A log V V 0 + B log θ V L , d θ d t = f ( θ , V ) ,
where L is a critical slip distance, μ 0 is the reference friction coefficient at the reference slip rate V 0 and A B are the rate-and-state parameters, which can be used to model both stable, velocity-strengthening fault segments ( A B > 0 ) and potentially seismic, velocity-weakening fault segments ( A B < 0 ). Two details need to be specified about the rate-and-state friction law. The first one is the definition of the function f that describes the evolution of the state variable. In this work we use the aging-law:
f ( θ , V ) = 1 θ V L .
The second one is its indefinite behavior when the slip rate is zero. To avoid this case, we use the approximation of the rate-and-state depending friction proposed by [31,32], reading
μ ( V , θ ) = μ 0 + A log V linear V 0 + B log V 0 θ L A 1 V V linear ,
for V smaller than V linear , where V linear has the dimension of a velocity, and is a cutoff for a linear slip rate dependence. This approximation of the rate-and-state friction law has been implemented in the FRIC-subroutine of the Abaqus software [24].

2.3. Modeling the Mixed-Mode Fault Slip Behavior

The rate-and-state parameters are constrained by frictional laboratory experiments conducted on fault rocks of the Zuccale fault (the exhumed analogous of the ATF [13]) and shown in Table 1. The mixed-mode fault slip behavior of the ATF is simulated by varying the A parameter of the rate-and-state depending friction law with the interseismic coupling degree proposed by Anderlini et al. [14] and shown in Figure 1. This technique has been successfully used by Kaneko et al. [33] to simulate the coseismic interaction between fault area with velocity-weakening and velocity- strengthening behavior. To compute A on each element of the computational grid on the ATF plane we proceed as follows: first we fix the B parameter to 0.01. Then we define the maximum value (most positive difference) A B = 0.0059 for the velocity-strengthening and the minimum value (most negative difference) A B = 0.0048 for the velocity-weakening behavior, in accordance with the values obtained from laboratory experiments [13]. Finally, we associate these values to the end-members values (1 and 0) of the interseismic coupling (Figure 1 and Table 1). The interseismic coupling is interpolated on the computational mesh nodes by a weighted mean function. On GF plane instead we impose a homogeneous velocity-weakening behavior with initial frictional properties as shown in Table 2.

2.4. Initial Stress Field Conditions

The simulation is performed in two subsequent steps. In the first one, we apply a gravitational loading and an initial stress field on the entire domain (geostatic step). We define an extensional stress regime where the maximum stress axis is vertical ( σ 1 ) and the middle ( σ 2 ) and the minimum ( σ 3 ) principal stress are horizontals and oriented in the NW-SE and NE-SW directions respectively, in agreement with the regional-scale tectonic regime of the study area [34]. The stress field resulting from the first stage is defined as uniaxial strain reference frame [35]. This state of stress is characterized by a vertical stress
S v = ρ g z ,
where ρ is the density, g is the gravity acceleration and z is the depth. The horizontal stress can be calculated as follows:
S H = ν 1 ν S v ,
where ν is Poisson’s ratio. In this way, for ν = 0.25 , the vertical stress is three times larger than the horizontal stress. We consider the Terzaghi effective stress principle to compute the effective vertical stress
S v = S v P p ,
where P p is the pore pressure, fixed at the hydrostatic value
P p = ρ f g z ,
where ρ f is the density of the fluid into the pores. In this first step, the boundary conditions applied to the model are the following: the upper boundary (topographic surface) is free to move in all directions, while the lateral boundaries of the domain and the bottom are kept fixed in the normal direction. After this first step, the system is at equilibrium and the solution is used as the initial condition for the second step. In the second step we stretch the model (crustal extension is simulated) for 50,000 years, applying a constant horizontal velocity of 3 mm yr 1 on the NE lateral boundary (Figure 1), according to the present-day strain rate and kinematics of the region [1].

2.5. Fault Slip Condition

The seismic cycle along ATF and GF is modeled in the second step. Fault reactivation follows the Amonton law:
τ = μ σ n ,
where σ n = σ n P p is the effective normal stress, σ n = σ · n is the normal stress, n is the normal vector to the fault surface ( σ n is positive in compression); τ = σ n σ n n is the shear stress and μ is the sliding friction that evolves following Equation (1). From the Amonton law, we calculate the slip tendency ( S T ) factor as the ratio of shear stress to normal stress acting on the plane of weakness:
S T = τ / σ n .
The slip tendency indicates if one fault is in a stable or unstable state of stress: if S T < μ the state of stress is stable, and no slip occurs along the fault plane. Otherwise, if S T μ the strength of the fault is overcome, and slip starts to propagate along the fault plane. Figure 2 shows the initial stress conditions obtained on the domain and on the ATF and GF at beginning of the extension step (initial time t = 0). At this time, the state of stress on the velocity-weakening ATF area and GF is not critical (Figure 2) and hence they are locked. At t = 0 , only the ATF areas with velocity-strengthening regime are critical (Figure 2) because they have a slip tendency value higher than the friction coefficient, so they can slip into the next time increment.

3. Model Results

3.1. Reactivation of Misoriented and Potentially Seismic Fault Patches

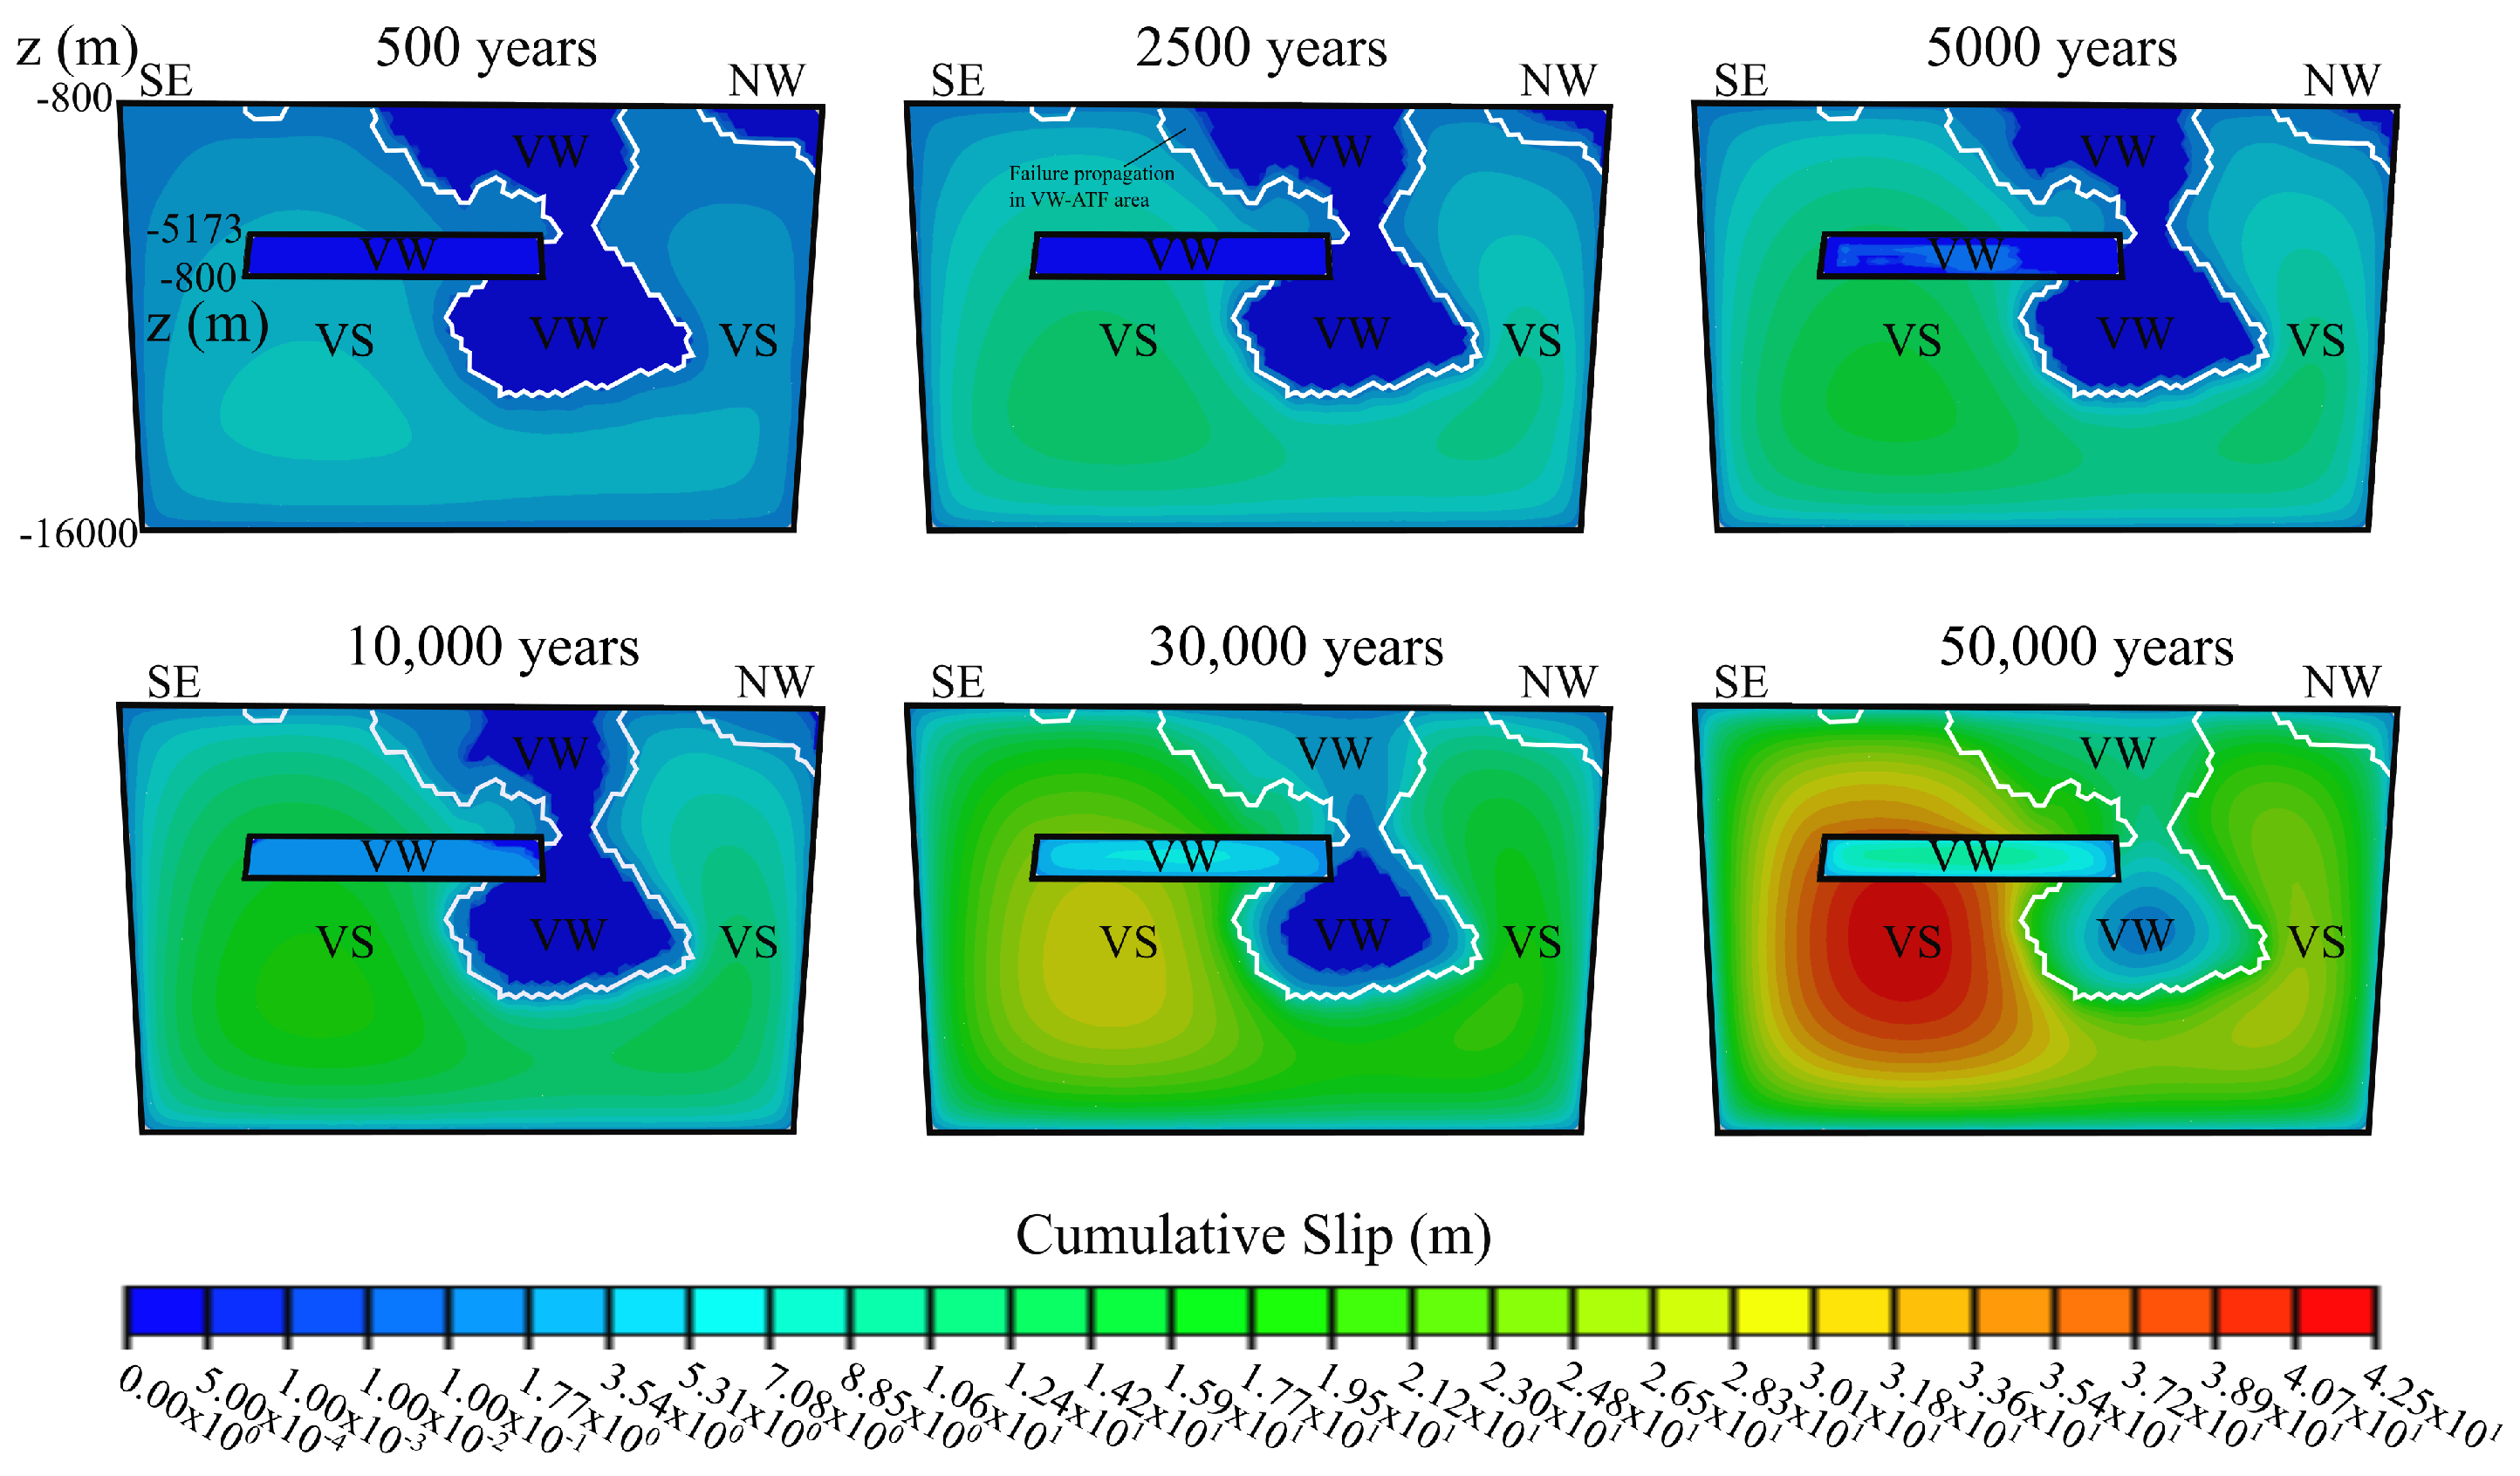
Different characteristic snapshots of the time evolution of the slip on the ATF and GF are shown in Figure 3. At 500 years the slip on ATF is limited only to the velocity strengthening patches. In fact, in the initial stress field condition imposed on the model, the critical shear stress is already overcome in the first time step, but only in the velocity-strengthening patches. At 2500 and 5000 years slip starts to propagate also in the velocity weakening patches in the shallower part of ATF, but localized at the interface with the velocity-strengthening fault area. In this period GF also starts to slip with a stick-slip deformation style. The GF failure occurs in the central part of the fault and propagates in SE-direction. At 10,000 years slip along the ATF plane begins to propagate in the central part, while the entire GF plane has reached failure. It should be noted that GF slips completely only after 10,000 years, even though, with an average dip angle of 40 ° , GF is classified as a well-oriented normal fault [20,22]. This long time is mainly due to the initial stress condition imposed on the GF plane, which is far from the critical value for its reactivation (Figure 2). At 30,000 years the ATF slip is localized from 800 m to almost 5000 m of depth. At the end of the simulation (50,000 years) the entire ATF locked area also fails. We computed an averaged long-term slip rate equals to 0.44 mm/year and 0.1 mm/year along the ATF and GF, respectively.
Different characteristic snapshots of the time evolution of the cumulative shear stress on ATF and GF are shown in Figure 4. At 500 years the shear stress computed on the faults depends exclusively on the initial stress as an initial condition. Indeed, the shear stress gradient depends mainly on the depth in accordance with the lithostatic load. At 500 and 2500 years the initial shear stress on ATF is perturbed by the continuous slip of the velocity-strengthening patches. The main shear stress increment is localized at the interface between velocity-strengthening-velocity-weakening patches. The shear stress on GF increases according to the tectonic extension simulated in the model. At 5000 years the shear stress on GF is also perturbed due to the initiation of slip along this fault. At 10,000 and 30,000 years higher shear stress is located on the deeper velocity weakening patches of ATF (almost 10 km of depth). This larger concentration of shear stress, due to the stress transfer from creeping segments, allows the activation also of the entire ATF area with velocity weakening behavior (Figure 3).

3.2. Stick-Slip Versus Creeping Deformation

The time evolution of the slip, shear stress, effective normal stress and sliding friction for different characteristic points whose locations are marked in Figure 1b are shown in Figure 5. For a better visualization, we subtracted the corresponding value computed at the initial time from each physical quantity. In Figure 5a, the characteristic stick-slip deformation style is visible for the nodes with velocity-weakening behavior located on ATF and GF planes. For the time span considered (1700 years), the ATF-VW point fails in two events whereas the GF-VW point fails three times. In comparison, the slip on the node located on the ATF area with velocity-strengthening behavior increases continuously for the entire time interval considered. Concerning the shear stress evolution (Figure 5b), the ATF-VS point located on the ATF velocity-strengthening patch remains stable around the value 18.45 MPa as consequence of the continuous release of stress due to the creeping deformation. On the contrary the shear stress on the ATF-VW and GF-VW points varies by almost 0.5 and 1 MPa, respectively, during the interseismic phase. The variation of the normal stress is more noticeable in the GF-VW point located on GF. In fact, for the same time interval of 1700 years (Figure 5c) the effective normal stress decreases 1.1 MPa with respect to the ATF-VW point located on the ATF velocity-weakening patch, which decreases of 0.1 MPa. An important aspect is that the variation of shear stress and normal stress on the ATF area with velocity-weakening behavior are recovered almost completely during the coseismic phase unlike GF due to continuous loading by the ATF creeping segments. The sliding friction for the node located on the velocity-strengthening patch (ATF-VS point, Figure 5d) remains almost unvaried around the value of 0.13. Otherwise the ATF-VW and GF-VW points located on the ATF velocity-weakening patch and on GF respectively increase to a maximum value of 0.71 in the interseismic phase. Peak values of 0.75 are reached during the coseismic phase due to the direct effect of the rate-and-state friction law.

4. Discussion and Conclusions

The results of the numerical simulations conducted in this work demonstrate that the seismic activation of the entire locked area of the Altotiberina fault is indeed possible (Figure 3). The averaged long-term slip rate computed along the Altotiberina fault plane (0.44 mm/year) is in accordance with the long-term slip rate estimated from studies based on geodynamic constrains (0.1–1.0 mm/year [36]) and geological data (1 mm/years [7,25]). According to Anderlini et al. [14], if we assume that the entire locked area fails in a single event, then the Altotiberina fault could host a M 6 earthquake. However, we cannot exclude the possibility that earthquakes with larger magnitude occur along the Altotiberina fault. Indeed, as demonstrated by [37], stable creeping fault segments can become unstable due to rapid shear heating of pore fluids. In this way, the seismic rupture could propagate into creeping segments of the faults, increasing the magnitude of the earthquake. This model of rupture propagation has been used only for the Tohoku-Oki earthquake [37], located in a geodynamic context where tectonic forces are large compared to those active in the Northern Apennine. For this reason, new studies should verify the applicability of this model to other tectonic settings.
The activation of the locked fault area occurs through continuous stress transfer from adjacent creeping segments located on the same fault plane. In this contest, creeping fault segments assume another role in the redistribution of the tectonic stress. Creeping faults segments have been considered to be inhibitors to the propagation of the rupture front during the coseismic phase [33], but we now recognize that they also assume a role promoting rupture [38]. Stress transfer from creeping fault areas could hence be the main mechanism to induce moderate-magnitude earthquakes along low-angle normal faults. To understand whether mixed-mode slip behavior is a peculiar characteristic of low-angle normal faults LANFs is hence a new challenge to reevaluate the seismic potential of these structures.

Funding

This research received no external funding.

Acknowledgments

The author thanks Letizia Anderlini and Luisa Valoroso for sharing the interseismic coupling and microseismicity data, respectively. Matteo Aletti and Benoit Fabrèges for the help in the rate-and-state friction law implementation in the Abaqus software. I am grateful to Anna Scotti, Luca Formaggia and Stefano Micheletti for their fruitful discussions about the modeling of fault reactivation. Finally, I thank Luca Paglieri for the maintenance of the MOX-HPC facilities.

Conflicts of Interest

The author declares no conflict of interest.

References

  1. Serpelloni, E.; Anzidei, M.; Baldi, P.; Casula, G.; Galvani, A. Crustal velocity and strain-rate fields in Italy and surrounding regions: New results from the analysis of permanent and non-permanent GPS networks. Geophys. J. Int. 2005, 161, 861–880. [Google Scholar] [CrossRef] [Green Version]
  2. Barchi, M.; Minelli, R.; Pialli, G. The crop 03 profile: A synthesis of results on deep structures of the northern Apennines. Mem. Della Soc. Geol. Ital. 1998, 52, 383–400. [Google Scholar]
  3. Boncio, P.; Brozzetti, F.; Lavecchia, G. Architecture and seismotectonics of a regional low-angle normal fault zone in central Italy. Tectonics 2000, 19, 1038–1055. [Google Scholar] [CrossRef]
  4. Collettini, C.; Barchi, M.; Chiaraluce, L.; Mirabella, F.; Pucci, S. The Gubbio fault: Can different methods give pictures of the same object? J. Geodyn. 2003, 36, 51–66. [Google Scholar] [CrossRef]
  5. Chiaraluce, L.; Chiarabba, C.; Collettini, C.; Piccinini, D.; Cocco, M. Architecture and mechanics of an active low-angle normal fault: Alto Tiberina Fault, northern Apennines, Italy. J. Geophys. Res. Solid Earth 2007, 112. [Google Scholar] [CrossRef]
  6. Valoroso, L.; Chiaraluce, L.; Di Stefano, R.; Monachesi, G. Mixed-Mode Slip Behavior of the Altotiberina Low-Angle Normal Fault System (Northern Apennines, Italy) through High-Resolution Earthquake Locations and Repeating Events. J. Geophys. Res. Solid Earth 2017, 122, 10220–10240. [Google Scholar] [CrossRef] [Green Version]
  7. Collettini, C.; Holdsworth, R. Fault zone weakening and character of slip along low-angle normal faults: Insights from the Zuccale fault, Elba, Italy. J. Geol. Soc. 2004, 161, 1039–1051. [Google Scholar] [CrossRef]
  8. D’Agostino, N.; Mantenuto, S.; D’Anastasio, E.; Avallone, A.; Barchi, M.; Collettini, C.; Radicioni, F.; Stoppini, A.; Fastellini, G. Contemporary crustal extension in the Umbria–Marche Apennines from regional CGPS networks and comparison between geodetic and seismic deformation. Tectonophysics 2009, 476, 3–12. [Google Scholar] [CrossRef]
  9. Hreinsdóttir, S.; Bennett, R.A. Active aseismic creep on the Alto Tiberina low-angle normal fault, Italy. Geology 2009, 37, 683–686. [Google Scholar] [CrossRef]
  10. Lockner, D.A.; Morrow, C.; Moore, D.; Hickman, S. Low strength of deep San Andreas fault gouge from SAFOD core. Nature 2011, 472, 82–85. [Google Scholar] [CrossRef]
  11. Collettini, C.; Viti, C.; Holdsworth, R.E.; Smith, S.A.F. Development of interconnected talc networks and weakening of continental low-angle normal faults. Geology 2009, 37, 567–570. [Google Scholar] [CrossRef]
  12. Smith, S.A.F.; Faulkner, D.R. Laboratory measurements of the frictional properties of the Zuccale low-angle normal fault, Elba Island, Italy. J. Geophys. Res. Solid Earth 2010, 115. [Google Scholar] [CrossRef]
  13. Collettini, C.; Niemeijer, A.; Viti, C.; Smith, S.A.; Marone, C. Fault structure, frictional properties and mixed-mode fault slip behavior. Earth Planet. Sci. Lett. 2011, 311, 316–327. [Google Scholar] [CrossRef]
  14. Anderlini, L.; Serpelloni, E.; Belardinelli, M.E. Creep and locking of a low-angle normal fault: Insights from the Altotiberina fault in the Northern Apennines (Italy). Geophys. Res. Lett. 2016, 43, 4321–4329. [Google Scholar] [CrossRef] [Green Version]
  15. Chiaraluce, L.; Amato, A.; Carannante, S.; Castelli, V.; Cattaneo, M.; Cocco, M.; Collettini, C.; D’Alema, E.; Stefano, R.D.; Latorre, D.; et al. The Alto Tiberina Near Fault Observatory (northern Apennines, Italy). Ann. Geophys. 2014, 57. [Google Scholar] [CrossRef]
  16. Gualandi, A.; Nichele, C.; Serpelloni, E.; Chiaraluce, L.; Anderlini, L.; Latorre, D.; Belardinelli, M.E.; Avouac, J.P. Aseismic deformation associated with an earthquake swarm in the northern Apennines (Italy). Geophys. Res. Lett. 2017, 44, 7706–7714. [Google Scholar] [CrossRef] [Green Version]
  17. Vadacca, L.; Casarotti, E.; Chiaraluce, L.; Cocco, M. On the mechanical behaviour of a low-angle normal fault: The Alto Tiberina fault (Northern Apennines, Italy) system case study. Solid Earth 2016, 7, 1537–1549. [Google Scholar] [CrossRef] [Green Version]
  18. Rovida, A.; Camassi, R.; Gasperini, P.; Stucchi, M.E. CPTI11, the 2011 version of the Parametric Catalogue of Italian Earthquakes. Milano Bologna 2011. [Google Scholar] [CrossRef]
  19. Byerlee, J. Friction of rocks. Pure Appl. Geophys. 1978, 116, 615–626. [Google Scholar] [CrossRef]
  20. Collettini, C. The mechanical paradox of low-angle normal faults: Current understanding and open questions. Tectonophysics 2011, 510, 253–268. [Google Scholar] [CrossRef]
  21. Anderson, E. The dynamics of faulting. Trans. Edinb. Geol. Soc. 1905, 8, 387–402. [Google Scholar] [CrossRef]
  22. Sibson, R.H. A note on fault reactivation. J. Struct. Geol. 1985, 7, 751–754. [Google Scholar] [CrossRef]
  23. Collettini, C.; Tesei, T.; Scuderi, M.; Carpenter, B.; Viti, C. Beyond Byerlee friction, weak faults and implications for slip behavior. Earth Planet. Sci. Lett. 2019, 519, 245–263. [Google Scholar] [CrossRef]
  24. ABAQUS. Theory Manual; Version 6.13; ABAQUS: Providence, RI, USA, 2013. [Google Scholar]
  25. Mirabella, F.; Brozzetti, F.; Lupattelli, A.; Barchi, M.R. Tectonic evolution of a low-angle extensional fault system from restored cross-sections in the Northern Apennines (Italy). Tectonics 2011, 30. [Google Scholar] [CrossRef]
  26. Vadacca, L.; Colciago, C.M.; Micheletti, S.; Scotti, A. Effects of the Anisotropy of the Fault Zone Permeability on the Timing of Triggered Earthquakes: Insights from 3D-Coupled Fluid Flow and Geomechanical Deformation Modeling. Pure Appl. Geophys. 2018, 175, 4131–4144. [Google Scholar] [CrossRef]
  27. Dieterich, J.H. Modeling of rock friction: 1. Experimental results and constitutive equations. J. Geophys. Res. Solid Earth 1979, 84, 2161–2168. [Google Scholar] [CrossRef]
  28. Ruina, A. Slip instability and state variable friction laws. J. Geophys. Res. Solid Earth 1983, 88, 10359–10370. [Google Scholar] [CrossRef]
  29. Scholz, C.H. Mechanics of Faulting. Annu. Rev. Earth Planet. Sci. 1989, 17, 309–334. [Google Scholar] [CrossRef]
  30. Marone, C. Laboratory-derived friction laws and their application to seismic faulting. Annu. Rev. Earth Planet. Sci. 1998, 26, 643–696. [Google Scholar] [CrossRef] [Green Version]
  31. Aagaard, B.T.; Knepley, M.G.; Williams, C.A. A domain decomposition approach to implementing fault slip in finite-element models of quasi-static and dynamic crustal deformation. J. Geophys. Res. Solid Earth 2013, 118, 3059–3079. [Google Scholar] [CrossRef] [Green Version]
  32. Aagaard, B.; Knepley, M.; Williams, C. PyLith User Manual; Version 2.2.0; Computational Infrastructure for Geodynamics: Davis, CA, USA, 2017. [Google Scholar]
  33. Kaneko, Y.; Avouac, J.P.; Lapusta, N. Towards inferring earthquake patterns from geodetic observations of interseismic coupling. Nat. Geosci. 2010, 3, 363–369. [Google Scholar] [CrossRef]
  34. Mariucci, M.T.; Montone, P. The new release of the Italian contemporary stress map. Geophys. J. Int. 2016, 205, 1525–1531. [Google Scholar] [CrossRef]
  35. Engelder, T. Stress Regimes in the Lithosphere; Princeton University Press: Princeton, NJ, USA, 1993. [Google Scholar]
  36. DISS-Working-Group. Database of Individual Seismogenic Sources (DISS), Version 3.2.1: A compilation of potential sources for earthquakes larger than M 5.5 in Italy and surrounding areas. Istituto Nazionale di Geofisica e Vulcanologia 2018. [Google Scholar] [CrossRef]
  37. Noda, H.; Lapusta, N. Stable creeping fault segments can become destructive as a result of dynamic weakening. Nature 2013, 493, 518–521. [Google Scholar] [CrossRef] [Green Version]
  38. Tse, S.T.; Dmowska, R.; Rice, J.R. Stressing of locked patches along a creeping fault. Bull. Seismol. Soc. Am. 1985, 75, 709–736. [Google Scholar]
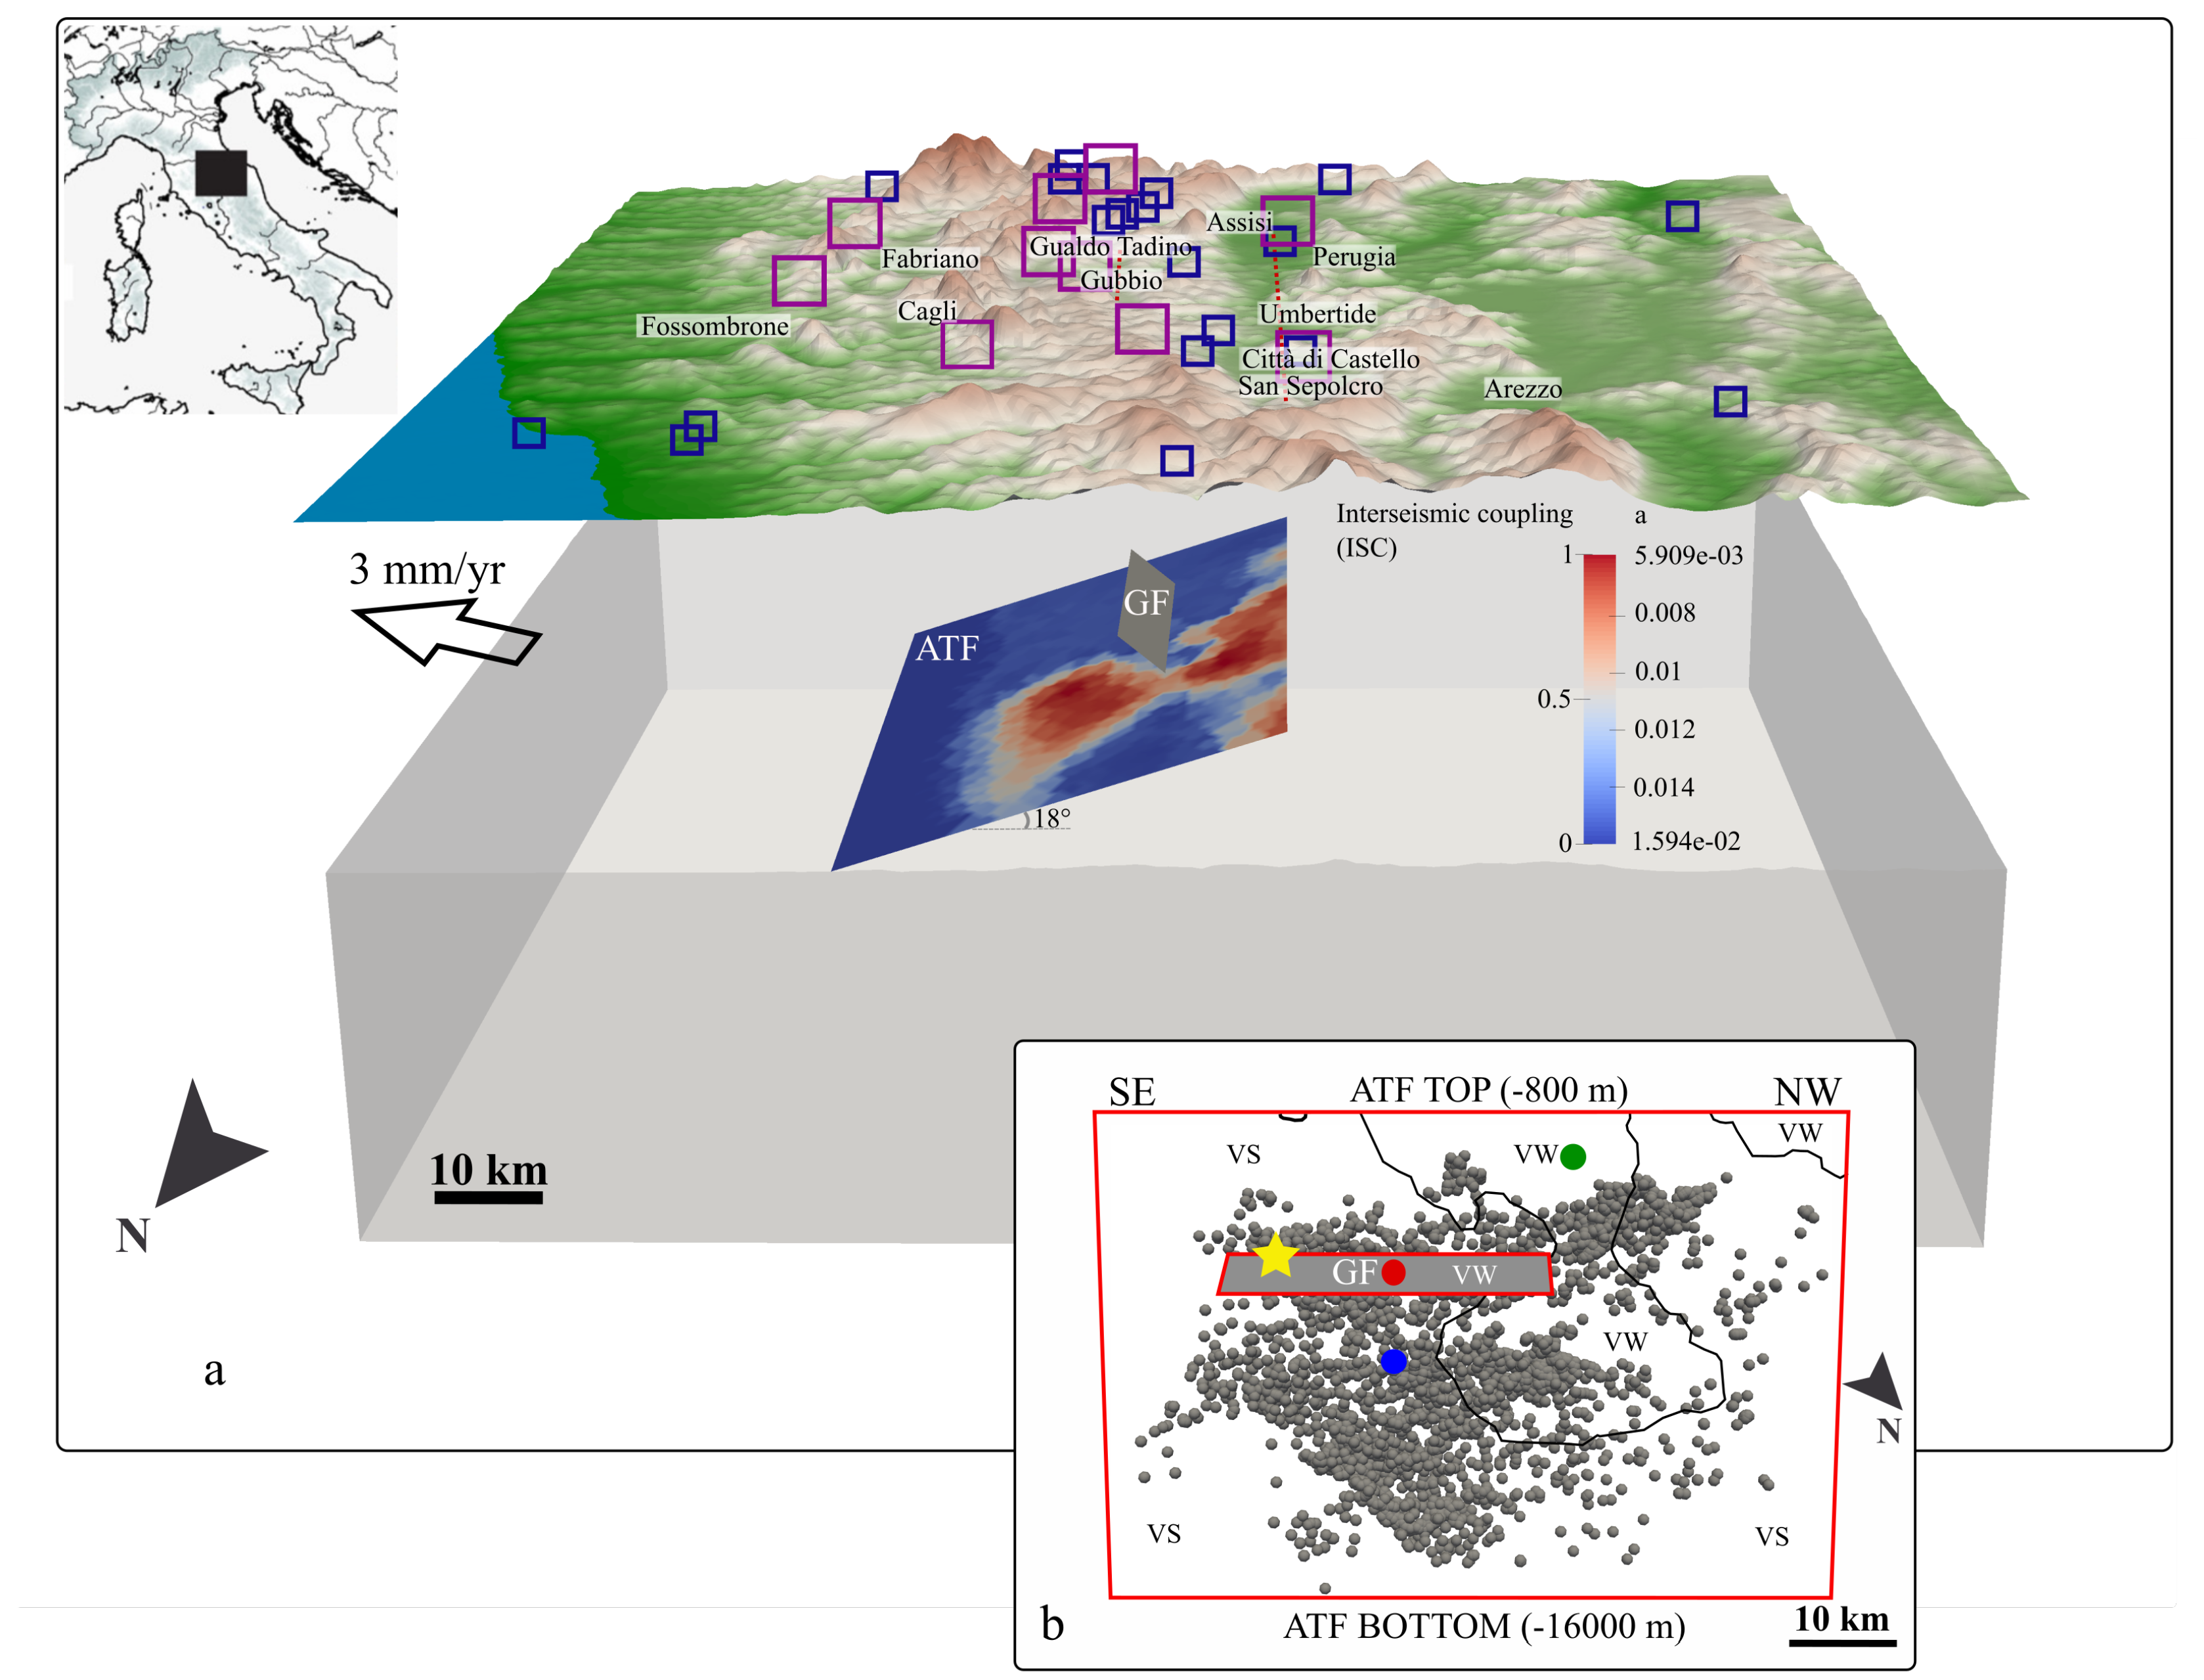
Figure 1. (a) Crustal volume considered in the numerical simulations. The topography is exaggerated (×5) on the z-axis for visualization purposes. The blue squares indicate 5.5 < M w < 6.0 historical earthquakes. The magenta squares indicate M w ≥ 6.0 historical earthquakes [18]. A velocity of 3 mm/yr is applied on the NE boundary according to [1]. The Altotiberina fault (ATF) plane is colored to illustrate the spatial variation of the A parameter of the rate-and-state friction law (Equation (1)) based on the interseismic coupling obtained by [14]. (b) Detail of the different slip-modes imposed on the two fault planes (VW = velocity-weakening; VS = velocity-strengthening). The gray dots represent the M L < 3.9 earthquakes located on the ATF plane over 4.5 years (2010–2014 [6]). The yellow star represents the location of the last largest instrumental M w 5.1 earthquake that occurred in 1984 on the Gubbio fault. The blue, green and red circles represent the location of the ATF-VS, ATF-VW and GF-VW points respectively where different physical quantities are represented in detail in Figure 5.
Geosciences 10 00144 g001
Figure 2. Initial conditions of shear stress, normal stress and slip tendency ( S T = τ / σ n ) on the fault surfaces. Please note that at t = 0 , only the ATF areas with velocity-strengthening regime are critical because the initial value of slip tendency (ST = 0.2) is larger than the initial value of fault friction ( μ 0 ( A T F V S ) = 0.1 ).
Geosciences 10 00144 g002
Figure 3. Time evolution of the cumulative slip on ATF and GF.
Geosciences 10 00144 g003
Figure 4. Time evolution of the cumulative shear stress on ATF and GF.
Geosciences 10 00144 g004
Figure 5. Time evolution of the sliding friction, shear stress, normal stress and slip for different characteristic points located on the ATF and GF planes (see Figure 1b for the location). For a better visualization, we subtracted their corresponding value computed at the initial time from each physical quantity.
Geosciences 10 00144 g005
Table 1. ATF friction parameters.
ATF Friction ParametersSymbolValueReference
Reference friction coefficient in VW μ 0 v w 0.61[11]
Reference friction coefficient in VS μ 0 v s 0.1[12]
Reference slip velocity in VW V 0 v w 100 × 10 6 m/s[11]
Reference slip velocity in VS V 0 v s 30 × 10 6 m/s[11]
Rate-and-state parameter A in VW A v w variable (Figure 1b)calculated value
Rate-and-state parameter A in VS A v s variable (Figure 1b)calculated value
Rate-and-state parameter B in VW B v w 0.01fixed value
Rate-and-state parameter B in VS B v s 0.01fixed value
Characteristic slip distance in VW L v w 302.15 × 10 6 m[11]
Characteristic slip distance in VS L v s 33.61 × 10 6 m[11]
Initial state variable θ 0 L/ V 0 calculated value
Linear slip velocity V l i n e a r 1.0 × 10 12 m/scalculated value
Table 2. GF friction parameters.
GF Friction ParametersSymbolValueReference
Reference friction coefficient μ 0 0.61[11]
Reference slip velocity V 0 100 × 10 6 m/s[11]
Rate-and-state parameter AA0.008646[11]
Rate-and-state parameter BB0.01[11]
Characteristic slip distanceL302.15 × 10 6 m[11]
Initial state variable θ 0 L/ V 0 calculated value
Linear slip velocity V l i n e a r 1.0 × 10 12 m/scalculated value