Article

Spatial Landslide Risk Assessment at Phuentsholing, Bhutan

1
Centre for Advanced Modelling and Geospatial Information Systems (CAMGIS), University of Technology Sydney, Sydney, NSW 2007, Australia
2
Center for Disaster Risk Reduction and Community Development Studies, Royal University of Bhutan, Phuentsholing 21101, Bhutan
3
Department of Civil Engineering, Delhi Technological University, Bawana Road, Delhi 110042, India
4
Department of Energy and Mineral Resources Engineering, Sejong University, Choongmu-gwan, 209 Neungdong-ro, Gwangjin-gu, Seoul 05006, Korea
5
Department of Geology & Geophysics, College of Science, King Saud University, P.O. Box 2455, Riyadh 11451, Saudi Arabia
*
Author to whom correspondence should be addressed.
Geosciences 2020, 10(4), 131; https://doi.org/10.3390/geosciences10040131
Submission received: 13 February 2020 / Revised: 4 April 2020 / Accepted: 6 April 2020 / Published: 7 April 2020

Abstract

:
Landslides are one of the most destructive and most recurring natural calamities in the Himalayan region. Their occurrence leads to immense damage to infrastructure and loss of land, human lives, and livestock. One of the most affected regions is the Bhutan Himalayas, where the majority of the landslides are rainfall-induced. The present study aims to determine the hazard and risk associated with rainfall-induced landslides for the Phuentsholing region located in the southwestern part of the Bhutan Himalayas. The work involves developing a landslide risk map using hazard and vulnerability maps utilizing landslide records from 2004 to 2014. The landslide hazard map was generated by determining spatial and temporal probabilities for the study region. The spatial probability was computed by analyzing the landslide contributing factors like geology, slope, elevation, rainfall, and vegetation based on comprehensive field study and expertise about the area. The contributing factors were divided into various classes and the percentage of landslide occurrence under each class was calculated to understand its contributing significance. Thereafter, a weighted linear combination approach was used in a GIS environment to develop the spatial probability map which was multiplied with temporal probabilities based on regional rainfall thresholds already determined for the region. Consequently, vulnerability assessment was conducted using key elements at risk (population, land use/land cover, proximity to road, proximity to stream) and the weights were provided based on expert judgment and comprehensive field study. Finally, risk was determined and the various regions in the study area were categorized as high, medium, and low risk. Such a study is necessary for low-economic countries like Bhutan which suffers from unavailability of extensive data and research. The study is conducted for a specific region but can be extended to other areas around the investigated area. The tool can serve as an indicator for the civil authorities to analyze the risk posed by landslides due to the rapid infrastructure development in the region.

1. Introduction

Landslides are considered one of the most prominent and devastative natural disasters leading to immense loss of human lives and infrastructure [1]. The triggering factor for the majority of the landslides is either rainfall or earthquake of which rainfall-triggered landslides can be categorized as very high and intense. The Himalayan region experiences very high rainfall and contributes over 70% of global fatal landslides [2]. Landslides in the Himalayas occur mainly due to monsoonal precipitation leading to huge financial loss and often disrupting the only livelihood of people [3,4]. The global fatal landslide database developed by [2] shows a total of 64 deaths in Bhutan due to nonseismic landslide events from 2004 to 2017, but the actual number of deaths is expected to be very high. The menace is expected to escalate because of the cutting of hills and deforestation emphasizing infrastructure development linked to a rise in population.
The studies on rainfall-induced landslides are quite varied and focus on several aspects like threshold modeling [5,6], monitoring systems [4,7], and computational techniques [8], along with GIS approach. Apart from landslide forecasting, landslide mitigation is important to understand the landslide hazard and the associated risk. Several works have been carried out to develop risk maps using the topography of the area susceptible to landslides [9,10,11]. Others have used ground conditions like the combined effect of rainfall and topography of the region to develop risk maps (South Italy [12], San Francisco Bay area [13]). Ho et al. [14] and Wong [15] used population density along with the natural contributing landslide factors to develop risk maps. Hadmoko et al. [16] utilized a vector-based GIS method to analyze several factors affecting landslides to develop hazard maps of the Central Java region. Pradhan and Abdulwahid [17] developed landslide risk maps using logistic regression and multihazard cases developed by considering precipitation data. Althuwaynee and Pradhan [11] developed a semi-quantitative landslide risk assessment using GIS-based analysis for Malaysia and were able to successfully show the predictive capability of the model. Liu and Miao [18] determined the landslide hazard, vulnerability, and risk in China by using certainty factor and a logistic regression model. Goorchi et al. [19] developed a new technique to analyze the risk linked to a rock slope, including the probability of failure and vulnerability rates. Saldivar-Sali and Einstein [20] proposed a regional landslide risk rating system in the Philippines. Aljeano et al. [21] developed a similar approach to analyze rock fall risk in quarries and the results depicted close correlation to the experimental work conducted for unstable slopes typically used for road construction. The effect of soil properties on slope instability has also been studied by several researchers using reliability-based optimization techniques, wherein the spatial variability related to shear parameters of soil is analyzed [22,23]. Cardarilli et al. [24] conducted an investigation to understand the territorial resilience towards landslide in the Southern Italy region by analyzing the correlations among the causative factors with an aim to reduce loss of lives and economic damage.
All these aforementioned studies have one thing in common, that is, the availability of sufficient data and prior research work. The present study has been performed for the Bhutan Himalayas, which lacks in both aspects. The research conducted in the past is so minimal that a Scopus search using the keywords “landslide*” and “Bhutan” resulted in only 36 documents. The publication of the latest landslide global disaster database has led several researchers to focus on this area and in the recent years, various research works have been conducted to better understand the landslides in the region. The majority of the landslide incidences are triggered due to rainfall, therefore we have focused solely on rainfall-induced landslides. The previous research in Bhutan has been towards forecasting, which led to the development of several thresholds using various statistical [3,25,26] and probabilistic [27] approaches. However, landslide mitigation and understanding the elements at risk are yet to be conducted for any part of Bhutan. Therefore, the present study is a preliminary step towards landslide risk assessment with an aim to perform a complete and comprehensive risk assessment in the future. The study was focused only on the Phuentsholing region, primarily due to two main reasons, the first being its significance as a major trade route and the second being the availability of sufficient data to conduct risk analysis. The work presented reflects a very simple but effective approach to determine landslide risk by computing hazard and vulnerability. Hazard comprises three different components (spatial, temporal, and magnitude) and these are multiplied directly, as an independent relationship is assumed between the components [28,29]. However, the unavailability of a detailed landslide inventory map results in the exclusion of the magnitude component. In the present study, the spatial component was calculated using a weighted sum analysis based on landslide contributing factors which was multiplied with the temporal probabilities determined based on regional rainfall thresholds [26] to develop the landslide hazard map. The predisposing factors for spatial aspect were identified based on a comprehensive field study conducted by the authors and examining the historical landslide locations in the study area. Landslide vulnerability was computed using weighted overlay analysis on key elements at risk by providing weights based on expert opinion. Finally, a landslide risk map was developed by combining both the hazard and vulnerability maps. Such an approach is useful for a country like Bhutan which lacks a proper landslide mitigation taskforce along with an operational early warning landslide system [30]. The present study would give an opportunity to develop risk assessment tools to analyze the slide activity and provide recommendations for mitigation purposes.

2. Study Area

The study area is Phuentsholing, situated in southwestern Bhutan, and is located from 26°50′ N to 26°59′ N latitude and 89°15′ E to 89°28′ E longitude covering an area of around 131.7 km2. The area is further divided into six subdivisions (known as chiwog), which are Lingdaen, Pachhu, Dzongkhag Tromde, Dophugchen Wangduegatshel, Deling Marpji, andChong Geykha Dophulakha (Figure 1).
Landslides in the study region are mainly due to intense monsoon rainfall, weak geology, and anthropogenic activities. The landslide typology in the study area can be characterized as rock fall, rockslide, debris flow, debris slide, and earth slide [24,25]. Gansser [31] described the regional geological setting of the Bhutan Himalayas and characterized the majority of the country as part of the Himalayan Crystalline Complex. The areas that are most prone to landslides are heavily fractured and weathered rocks of phyllite, slate, and schist that contain high amounts of clay [26,27]. The study region has been identified as geologically weak with the presence of several shear zones, including weathered and folded phyllite rocks turning to clay [25].
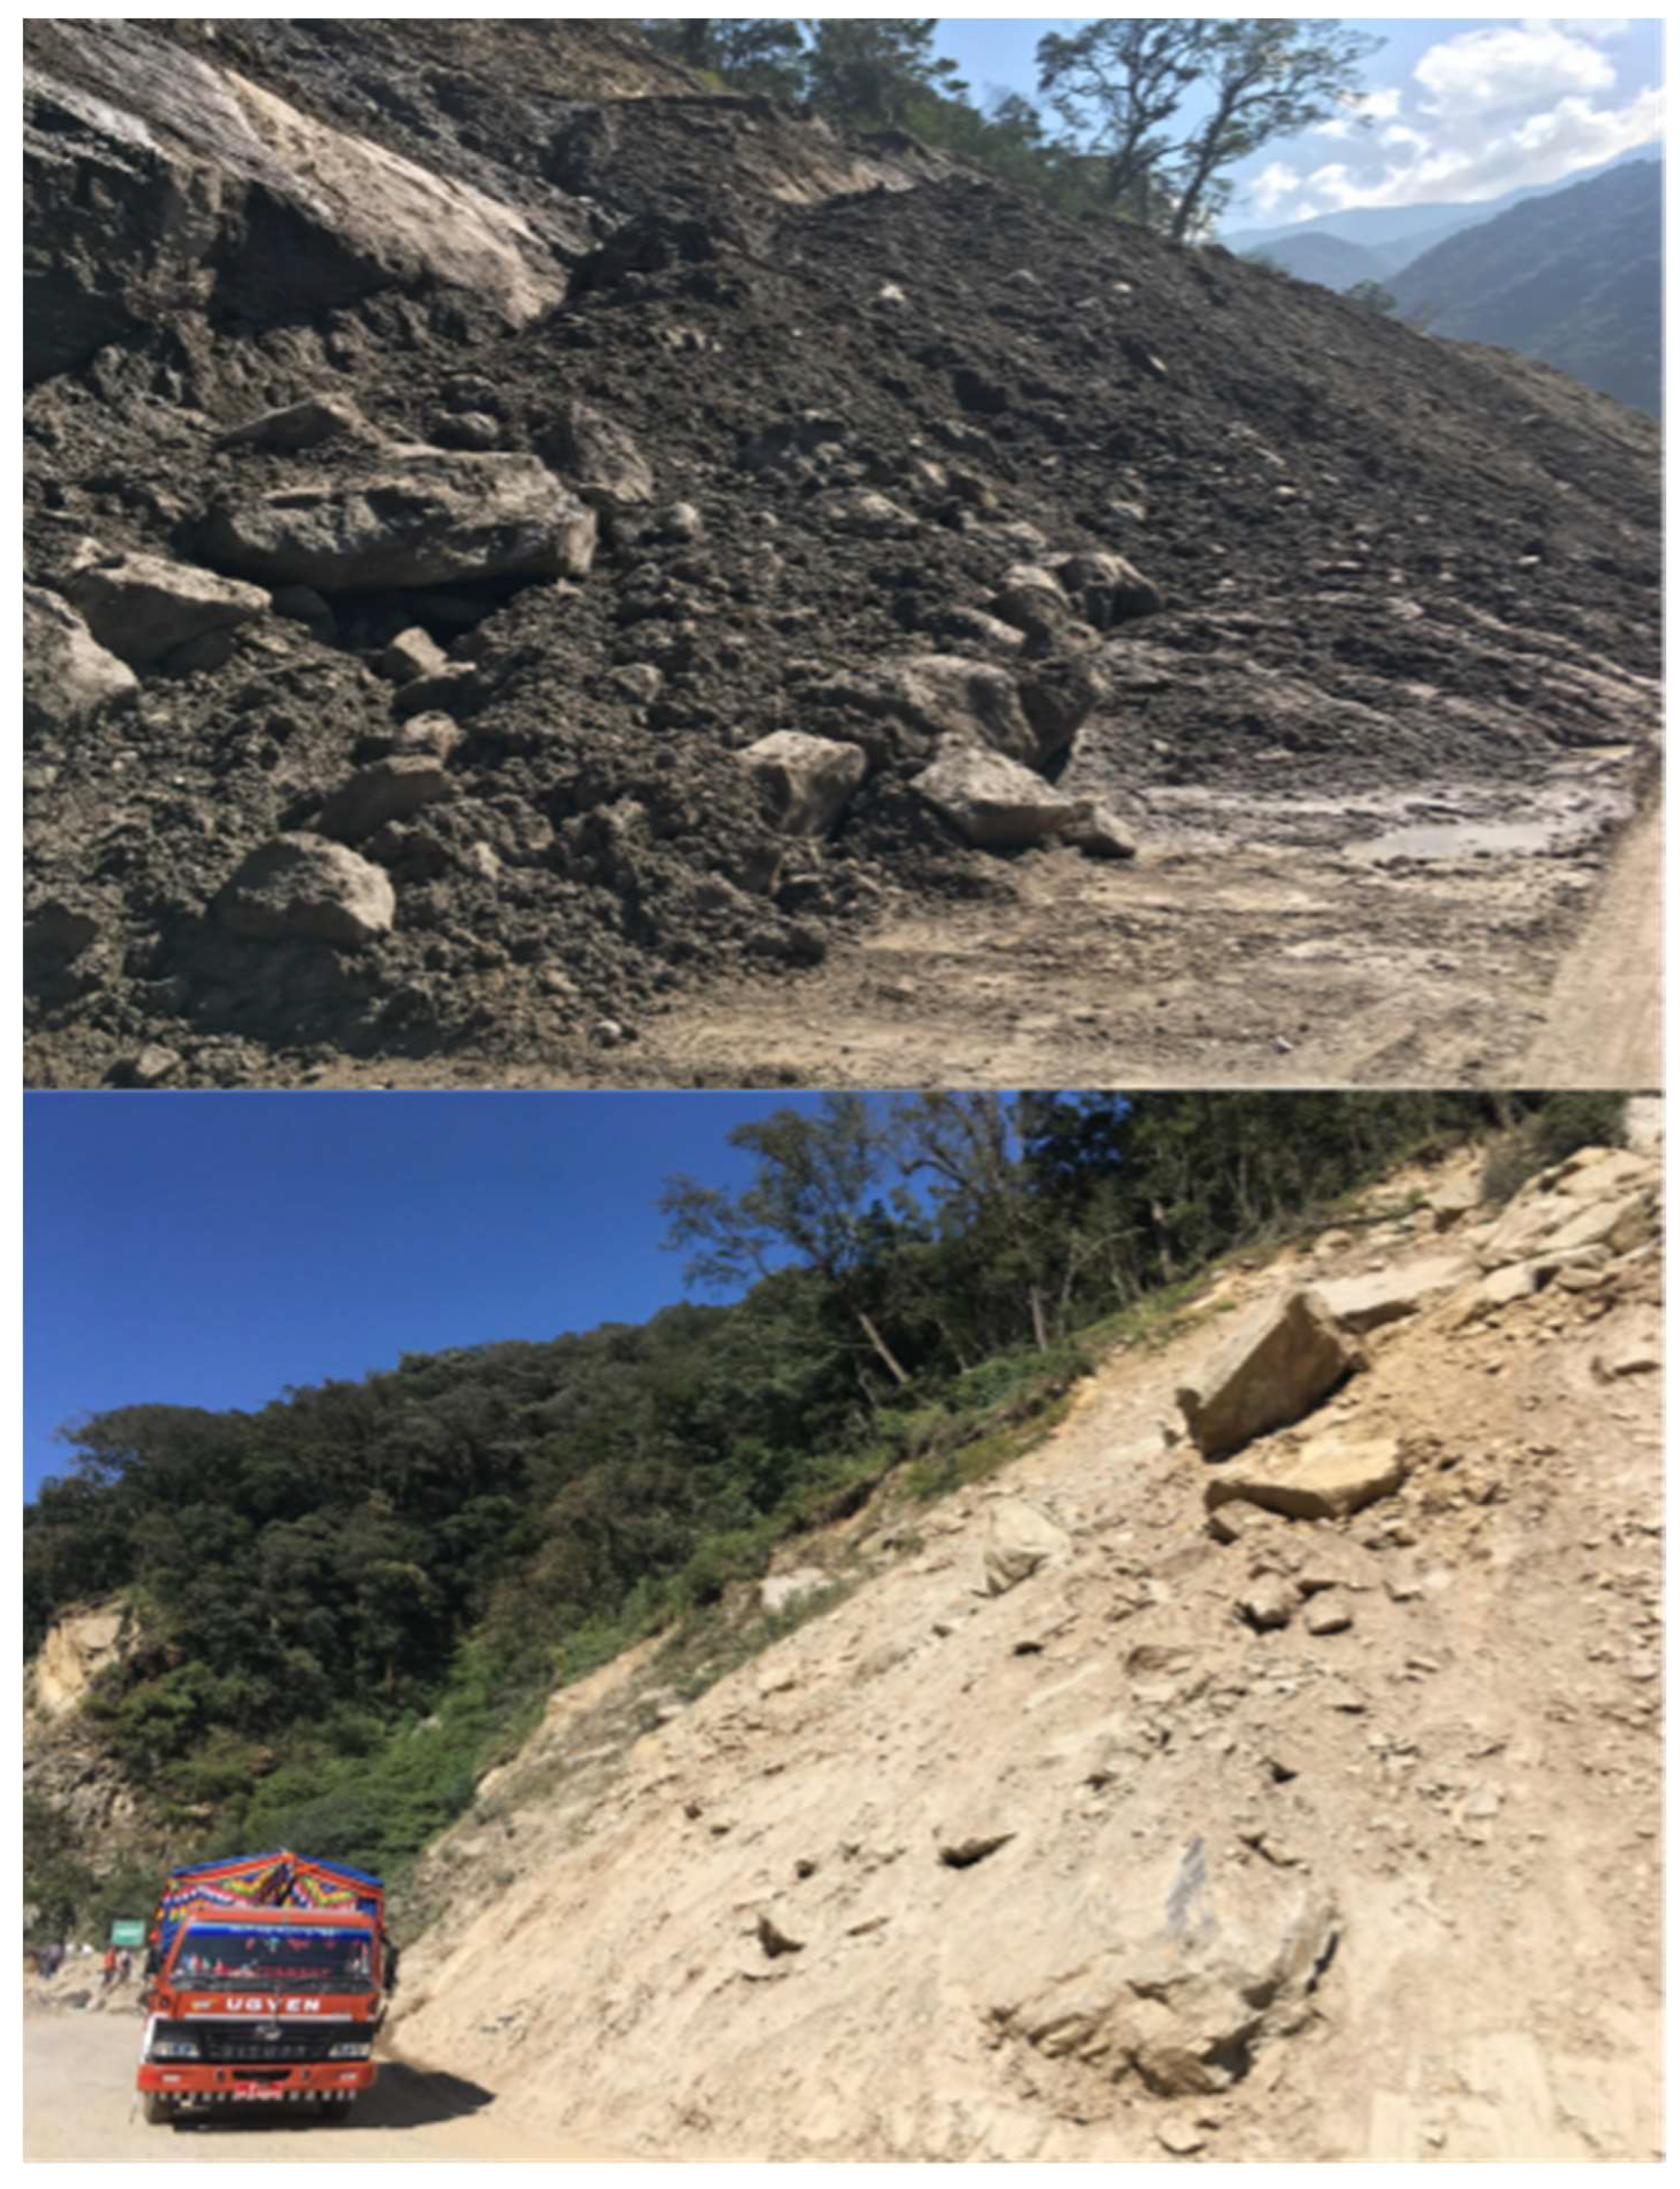
The Phuentsholing-Thimphu highway, which is a part of the study region, is a vital lifeline as the majority of the import and export goods of the country are carried out through this route. The landslides lead to blockage of roads at several sections leading to a considerable amount of economic losses in repair and maintenance every year. The highway was the first motorable road of the country, constructed in 1961, and it crosses through areas susceptible to landslide, subsidence, erosion, and rockfalls. The instability in certain sections of the road has been as long as 20–50 years old. A 2005 report on the landslide investigations along the highway showed that a landslide at a 360 m section of the highway between the 17 km and 18 km point, known as Sorchen landslide, was so severe that the road alignment, which had four bends, eventually was left with only one bend over time. Figure 2 depicts two damage pictures taken during landslide events in Chukha Dzongkhag along the Phuentsholing-Thimphu Highway after the 2017 monsoon.

3. Data Used

The understanding of various causative factors and preparation of thematic layers are necessary to develop hazard and vulnerability maps. In the present study, a risk map was developed by analyzing the hazard contributory factors (geology, slope, elevation, vegetation, rainfall) with vulnerability factors (land use, population, proximity to road and stream). Hazard has been defined as a probability of a specific danger likely to occur in a given time period whereas risk refers to hazard multiplied by the potential loss of life [20].
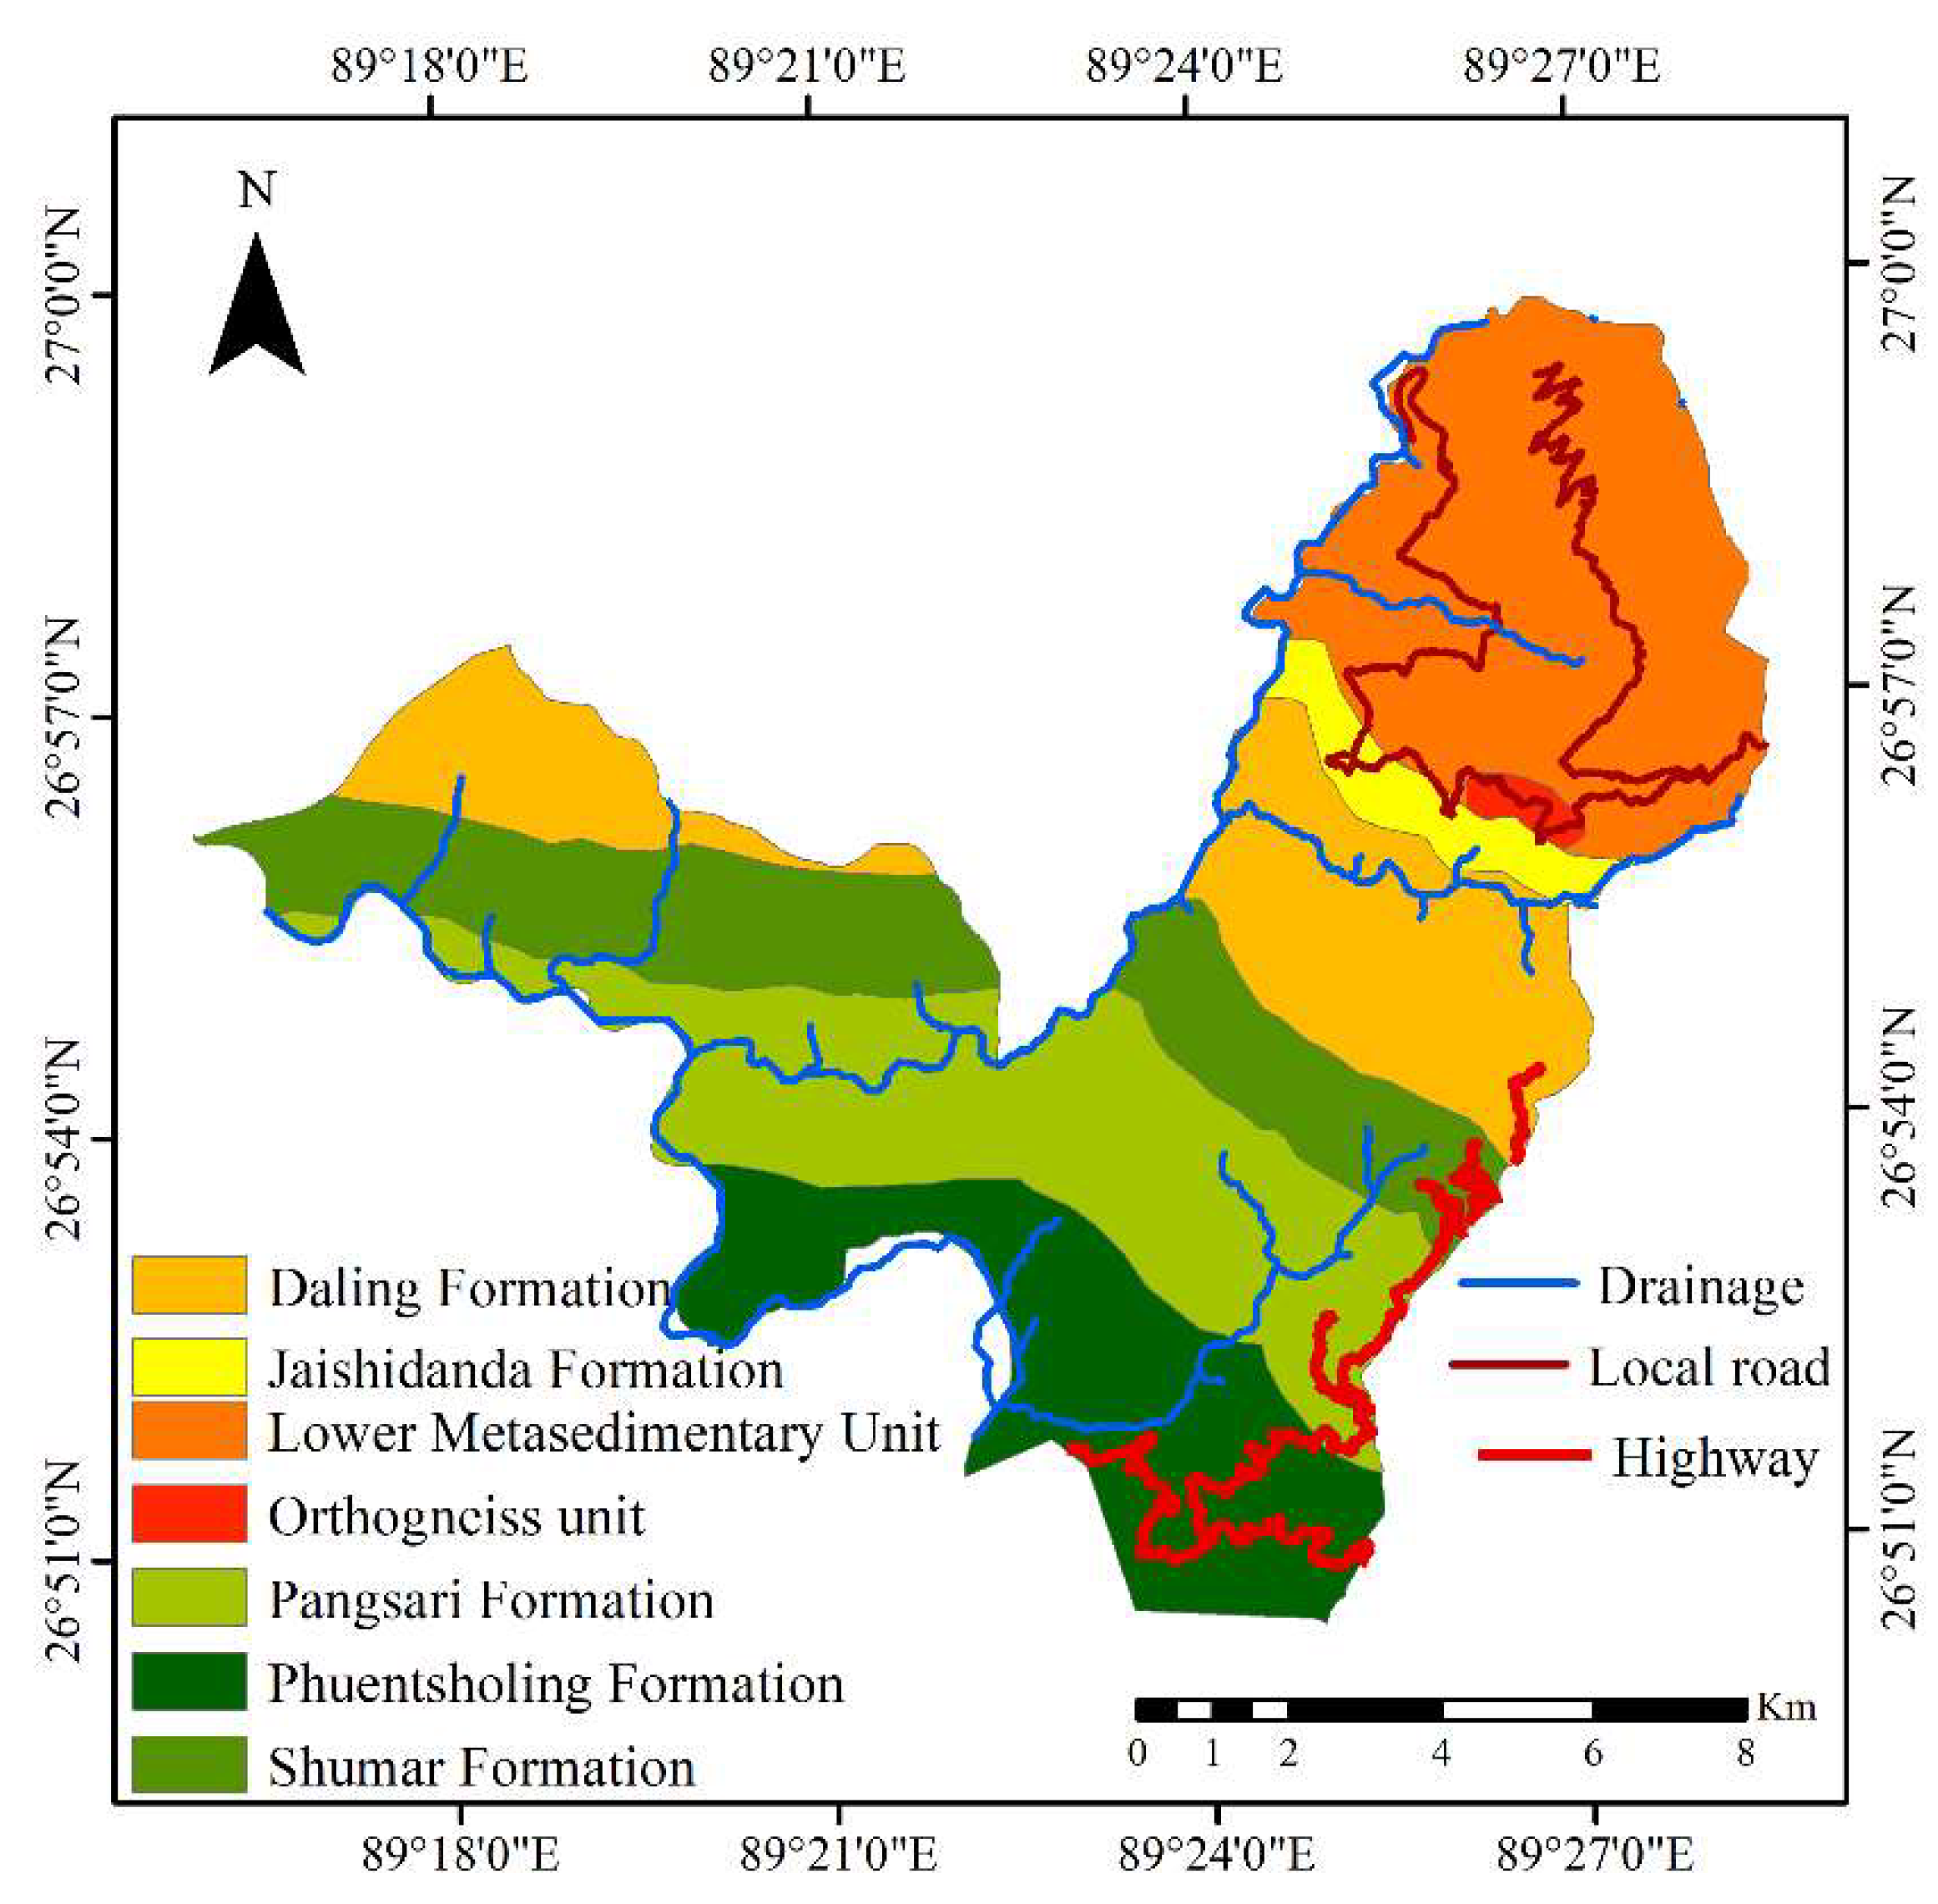
Geology is one of the most significant contributory factors to landslide initiation [32]. The region has four significant geological groups, which can be subcategorized into a total of seven types, which are: (i) Baxa Group (Phuentsholing Formation, Pangsari Formation), (ii) Daling–Shumar Group (Daling Formation, Orthogneiss unit, Shumar Formation), (iii) Lesser Himalayan Zone (Jaishidanda Formation), and iv) structurally lower Greater Himalayan section (lower metasedimentary unit) (Figure 3). The Baxa Group can be characterized as heavily fractured and weathered phyllites, slates, and schists [25]. The Daling–Shumar Group comprises tan weathering, cliff-forming quartzite and muscovite-biotite schist and phyllite [33]. The majority of the settlement area is dominated by the Baxa formation group wherein the thrust fault, strike, and dip of bedding and foliation are more concentrated. Similarly, such features were also delineated in the structurally lower Greater Himalayan Zone.
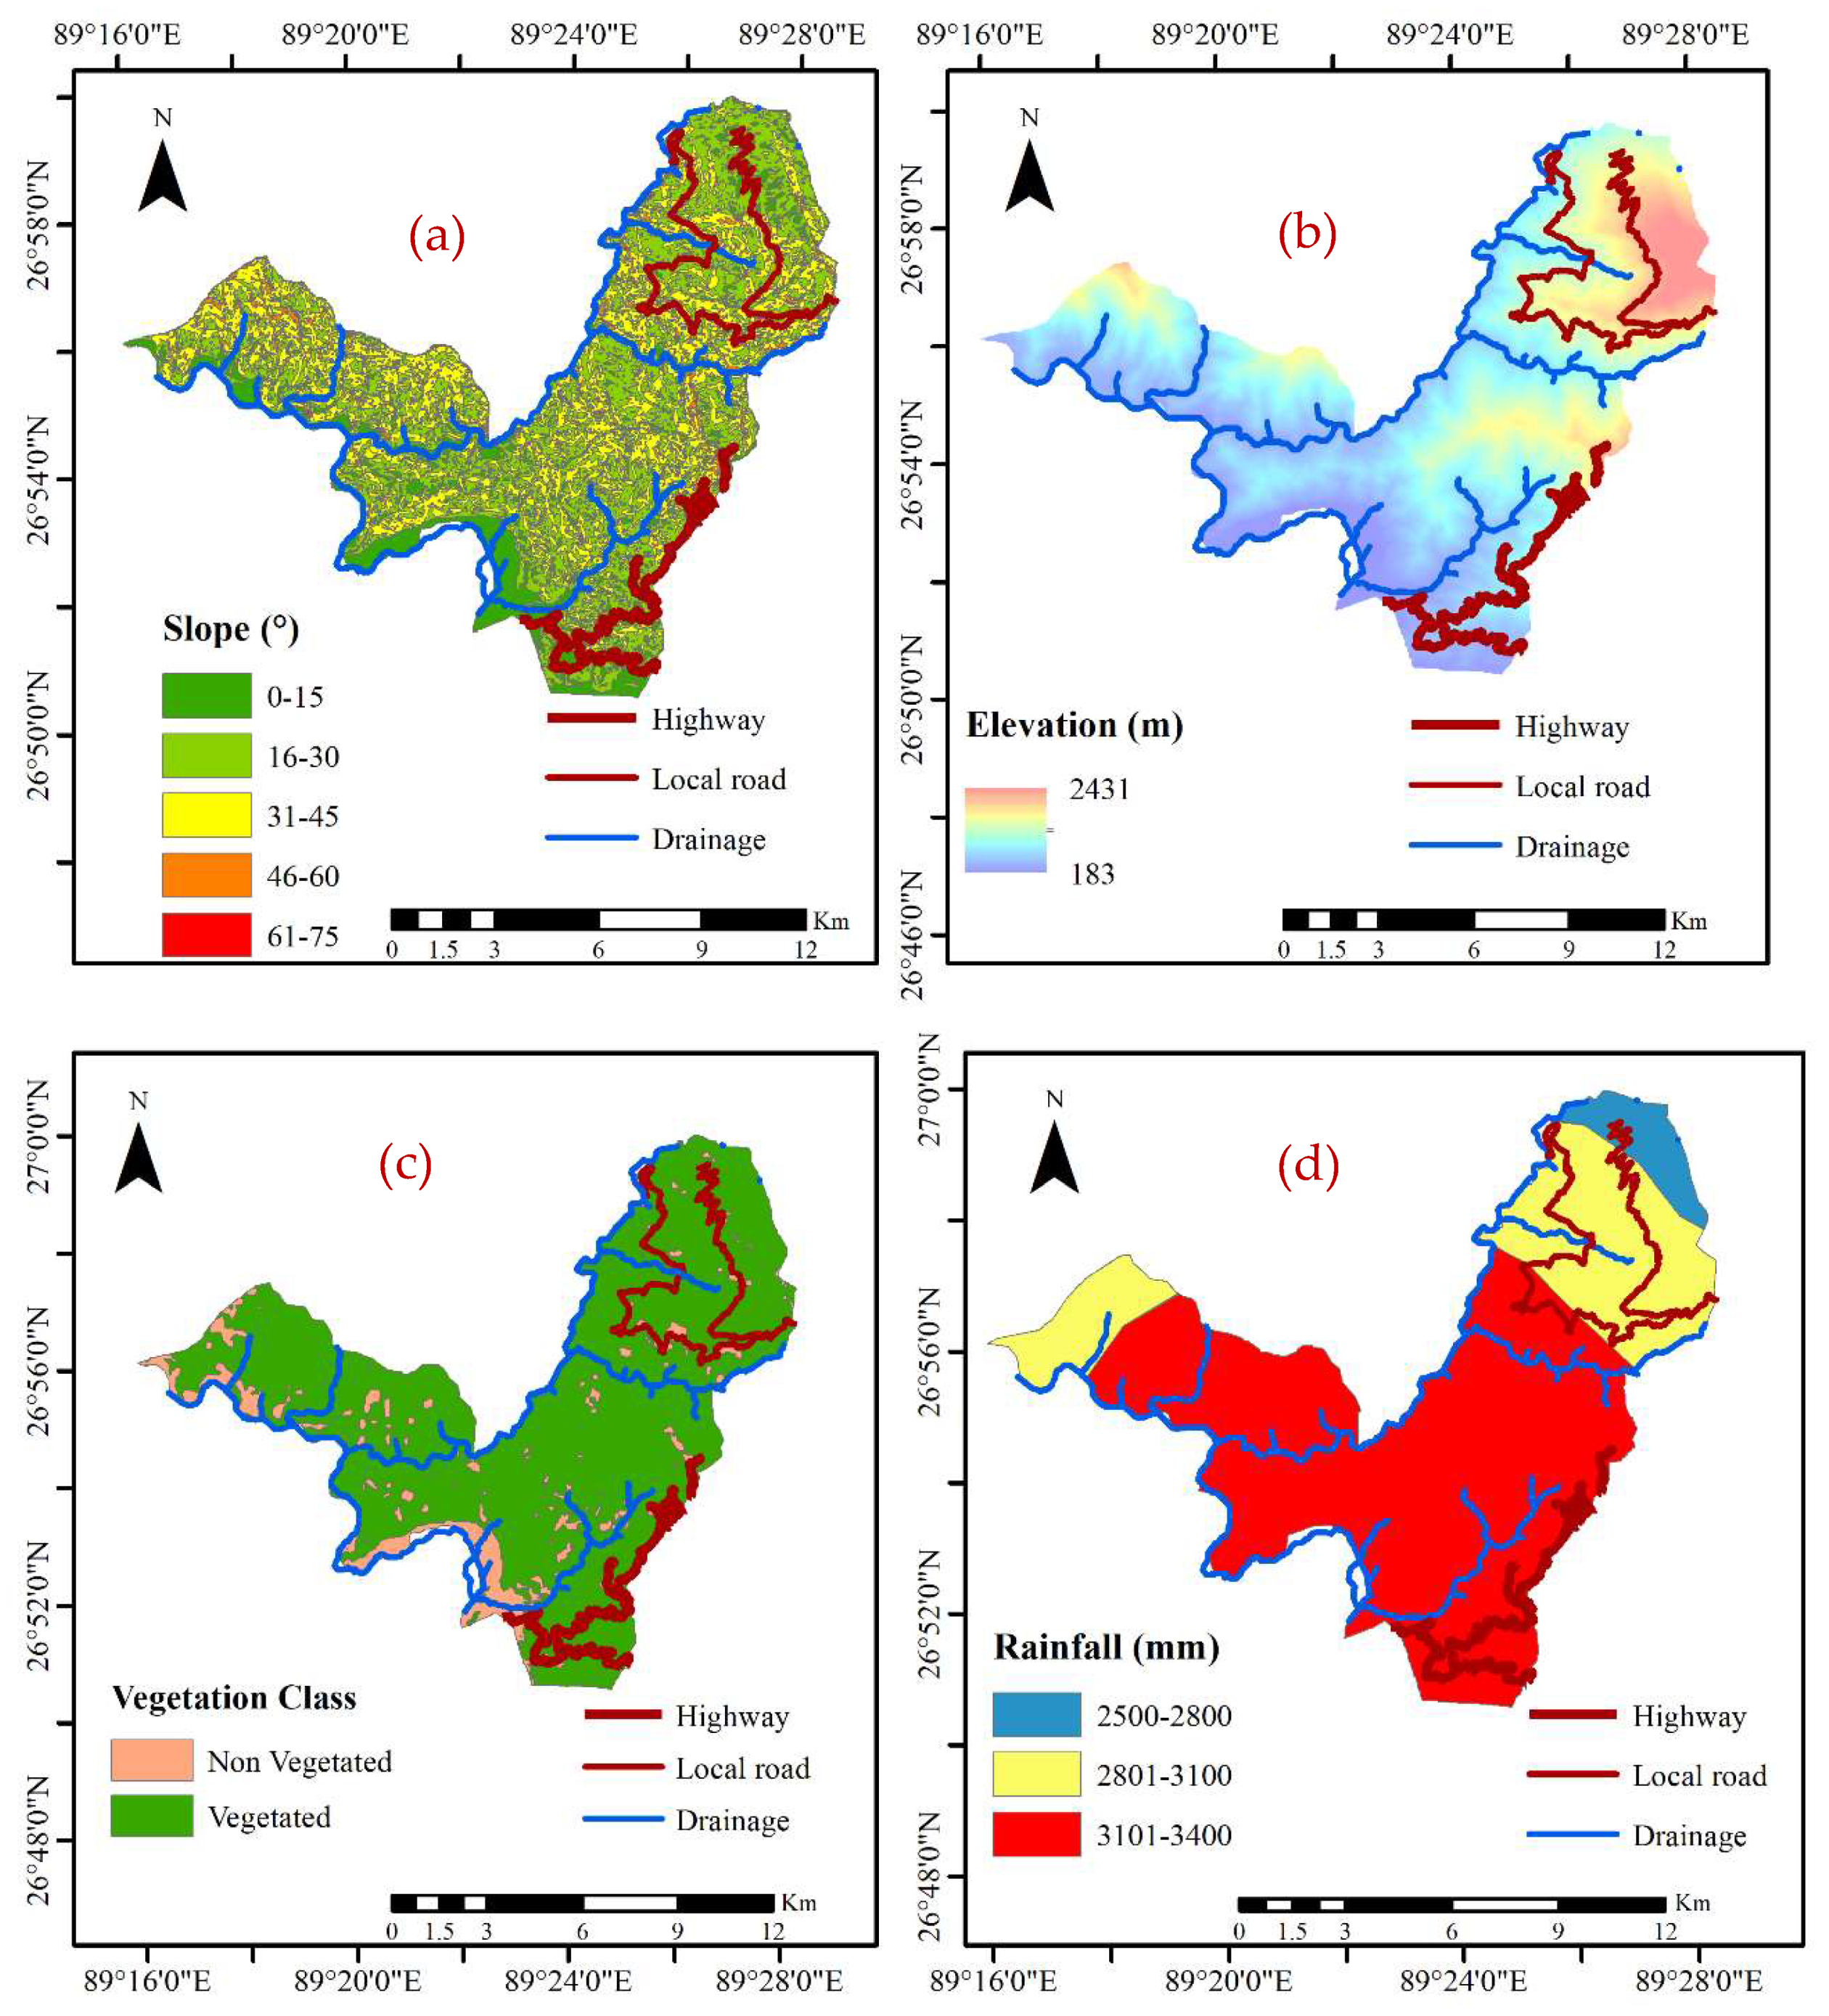
The other important factors are slope and elevation, which vary from 0°–75° and 183–2500 m, respectively. The majority of the study region (>80%) falls under 45° suggesting that the area is situated on a relatively flat plateau. More than half of the region has an elevation of less than 600 m and only 5% of the region is under high elevation zone (1500–2500 m).
The vegetation map was derived using the Normalized Difference Vegetation Index (NDVI) from the Landsat image (2017) and was classified into vegetated (86.76%) and nonvegetated areas (13.24%) (Figure 4c). NDVI always generates a value between −1 and +1 with high positive NDVI values (green) meaning high vegetation, while water usually has negative NDVI values (yellow and red), with urban features usually having values near zero. The maps were developed using the image analysis toolbar in ArcGIS 10.4.
The study area is located in the subtropical and temperate climatic zone, which receives very high annual rainfall up to 6000 mm. As per the Köppen climate classification [34], the climate is subtropical monsoonal receiving 10 times more rainfall during the wettest summer month as compared to dry winter months. The contribution of monsoonal rainfall (June–September) is 80% of the annual rainfall. However, pre- and post-monsoonal months can also suffer from heavy rainfall due to local convection and tropical cyclone activity over the Bay of Bengal [35], with January and February being relatively drier [25]. Figure 4d shows the rainfall map based on the annual rainfall measurements from 2004 to 2014 collected from the National Center for Hydrology and Meteorology of the Royal Government of Bhutan.
A total of 64 landslides occurred from 2004 to 2014, which was collected from Project Dantak, the Border Roads Organization, Government of India. The data included the coordinates of the landslide events which were collected from the scarp along with the dates of occurrences. The number of landslide events was counted as a single landslide event if multiple events occurred on the same day and coordinates were selected where maximum damage or loss of land prevailed. Table 1 shows the number of landslides in each class of landslide contributing factors.

4. Method

The method revolves around the determination of some important landslide risk factors (i.e., hazard, vulnerability, elements at risk, and potential damage). Landslide risk is defined as the maximum potential loss due to a landslide event for a definite area and during a certain period [18]. Hence, landslide risk can be calculated as:
Risk = Hazard × Vulnerability × Elements at risk
A complete quantitative risk analysis includes explicitly the economical exposure of elements at risk like buildings, infrastructures, and assets. However, due to the unavailability of such factors, population is used as a proxy to obtain a relative estimation of exposure and the final output is a map of qualitative risk classes.
The first factor is “hazard” which has been often erroneously used synonymously with “susceptibility” [36], but there are major differences between them. Landslide hazard is the probability of a landslide event of a certain magnitude within spatial and temporal limits [11], whereas landslide susceptibility is the likelihood of landslide occurrence depending on local conditions [37].
The present study determines the landslide hazard by considering spatial (Ps) and temporal (PT) components [33,34]. The spatial aspect was extracted by analyzing all the landslide contributing factors and applying a weighted linear combination (WLC) method. WLC is quite often used by landslide researchers, but an accurate method of determining weights is not defined and is based on expert opinion [38]. It is based on determining weighted averages of landslide causative parameters pertinent to the study area and available data. The parameters are classified and multiplied with the provided weight in a GIS overlay environment, and the final output is determined by adding weighted averages. The temporal probability was calculated using the rainfall threshold determined by Dikshit et al. [26] using the Poisson probability model. Readers are referred to [3,39,40] for the detailed explanation on determining the temporal landslide probability.
Hazard (H) = Ps × PT,
Landslide vulnerability is the degree of loss of a particular element at risk due to the occurrence of a certain magnitude of the event [41,42]. Glade and Crozier [43] highlighted that there is no fixed technique for quantitative vulnerability assessment of elements at risk with respect to different landslide magnitudes and types. Therefore, vulnerability is usually determined by either assigning a fixed value to elements at risk (0 for no damage and 1 for complete damage), or assigning values based on expert opinion and knowledge about the area [44]. Thereafter, the potential damage is calculated by combining the vulnerability and elements at risk. In the present study, the potential damage map was developed using the WLC method by providing the exposure of the weights to causative factors expressing both elements of vulnerability and exposure. The factors considered for vulnerability were land use/land cover (LULC), proximity to road, and proximity to stream, and for exposure was population.
The classification of derived thematic layers can be conducted using several techniques like equal intervals, natural breaks, and quantile and statistical techniques which are default GIS processes [45]. In the present study, the natural breaks method was used to classify values as it is quite popular among the researchers [45,46,47].

5. Results and Discussions

5.1. Landslide Hazard Assesment

As described in the methodology, the spatial component (susceptibility) was based on the WLC method and the temporal probability was determined based on the thresholds obtained using an empirical-based approach. The susceptibility map was based on landslide causative factors and the weights were provided as per Equation (3).
LS = Rainfall × 0.3 + Geology × 0.3 + Elevation × 0.2 + Slope × 0.1 + Vegetation × 0.1
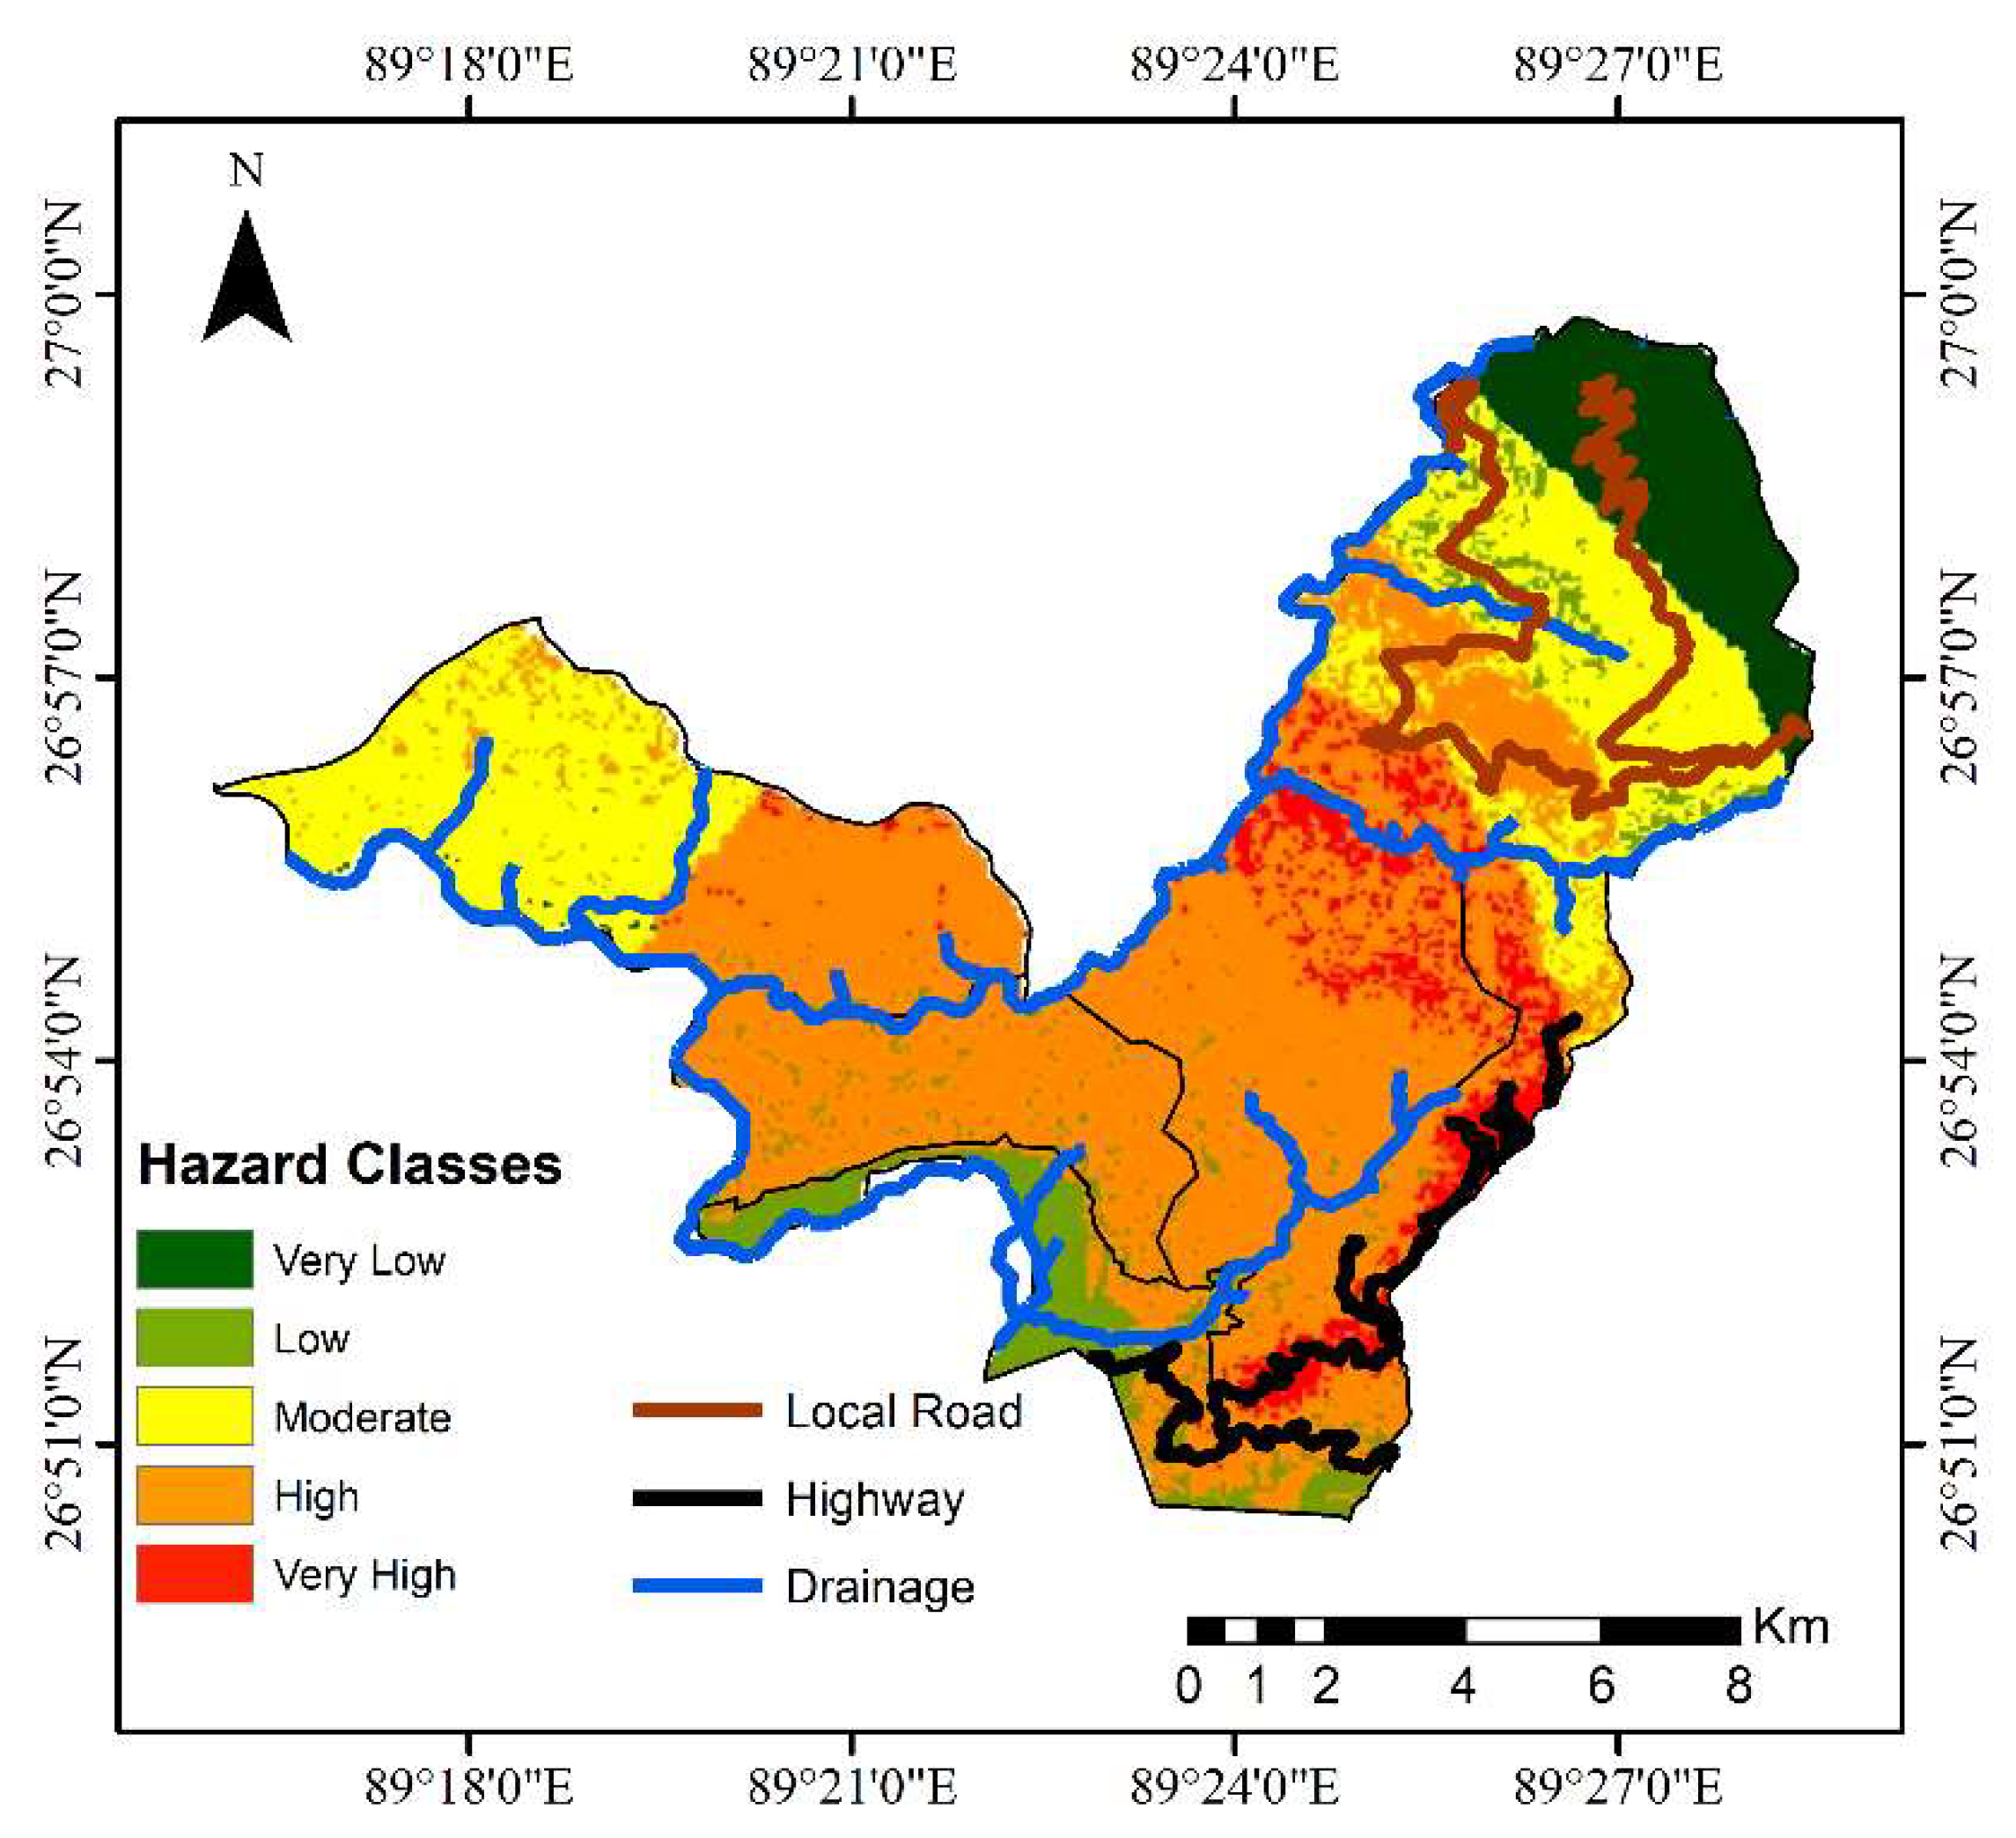
where LS is landslide susceptibility. The weights are assigned using GIS overlay capability, based on its influence on landslide in comparison to other factors and performing a weighted sum to combine the factors [38]. The fault data were not added as the majority of the landslides are rainfall-triggered and can be attributed as a low-seismic region [48]. The temporal probability is calculated by multiplying annual exceedance probability and the probability of landslide occurrence. The annual exceedance probability is the probability of threshold being exceeded in a specific year, which is determined using the Poisson probability model. The maps derived using both the components resulted in the hazard map. Figure 5 represents the landslide hazard map, which has been divided into five classes: very low (0–0.33), low (0.34–0.44), moderate (0.45–0.58), high (0.59–0.72), and very high (0.73–1).
The results show that the central-eastern parts of the area are more highly hazardous than the 4 km radius of central Phuentsholing, which comes under high hazard zone. The eastern and western parts of the region fall under very low to medium hazard zone. This could prove to be very helpful in landslide prevention mapping and could be used for land use planning and in inhibitory works by governmental agencies.

5.2. Landslide Vulnerability Assessment

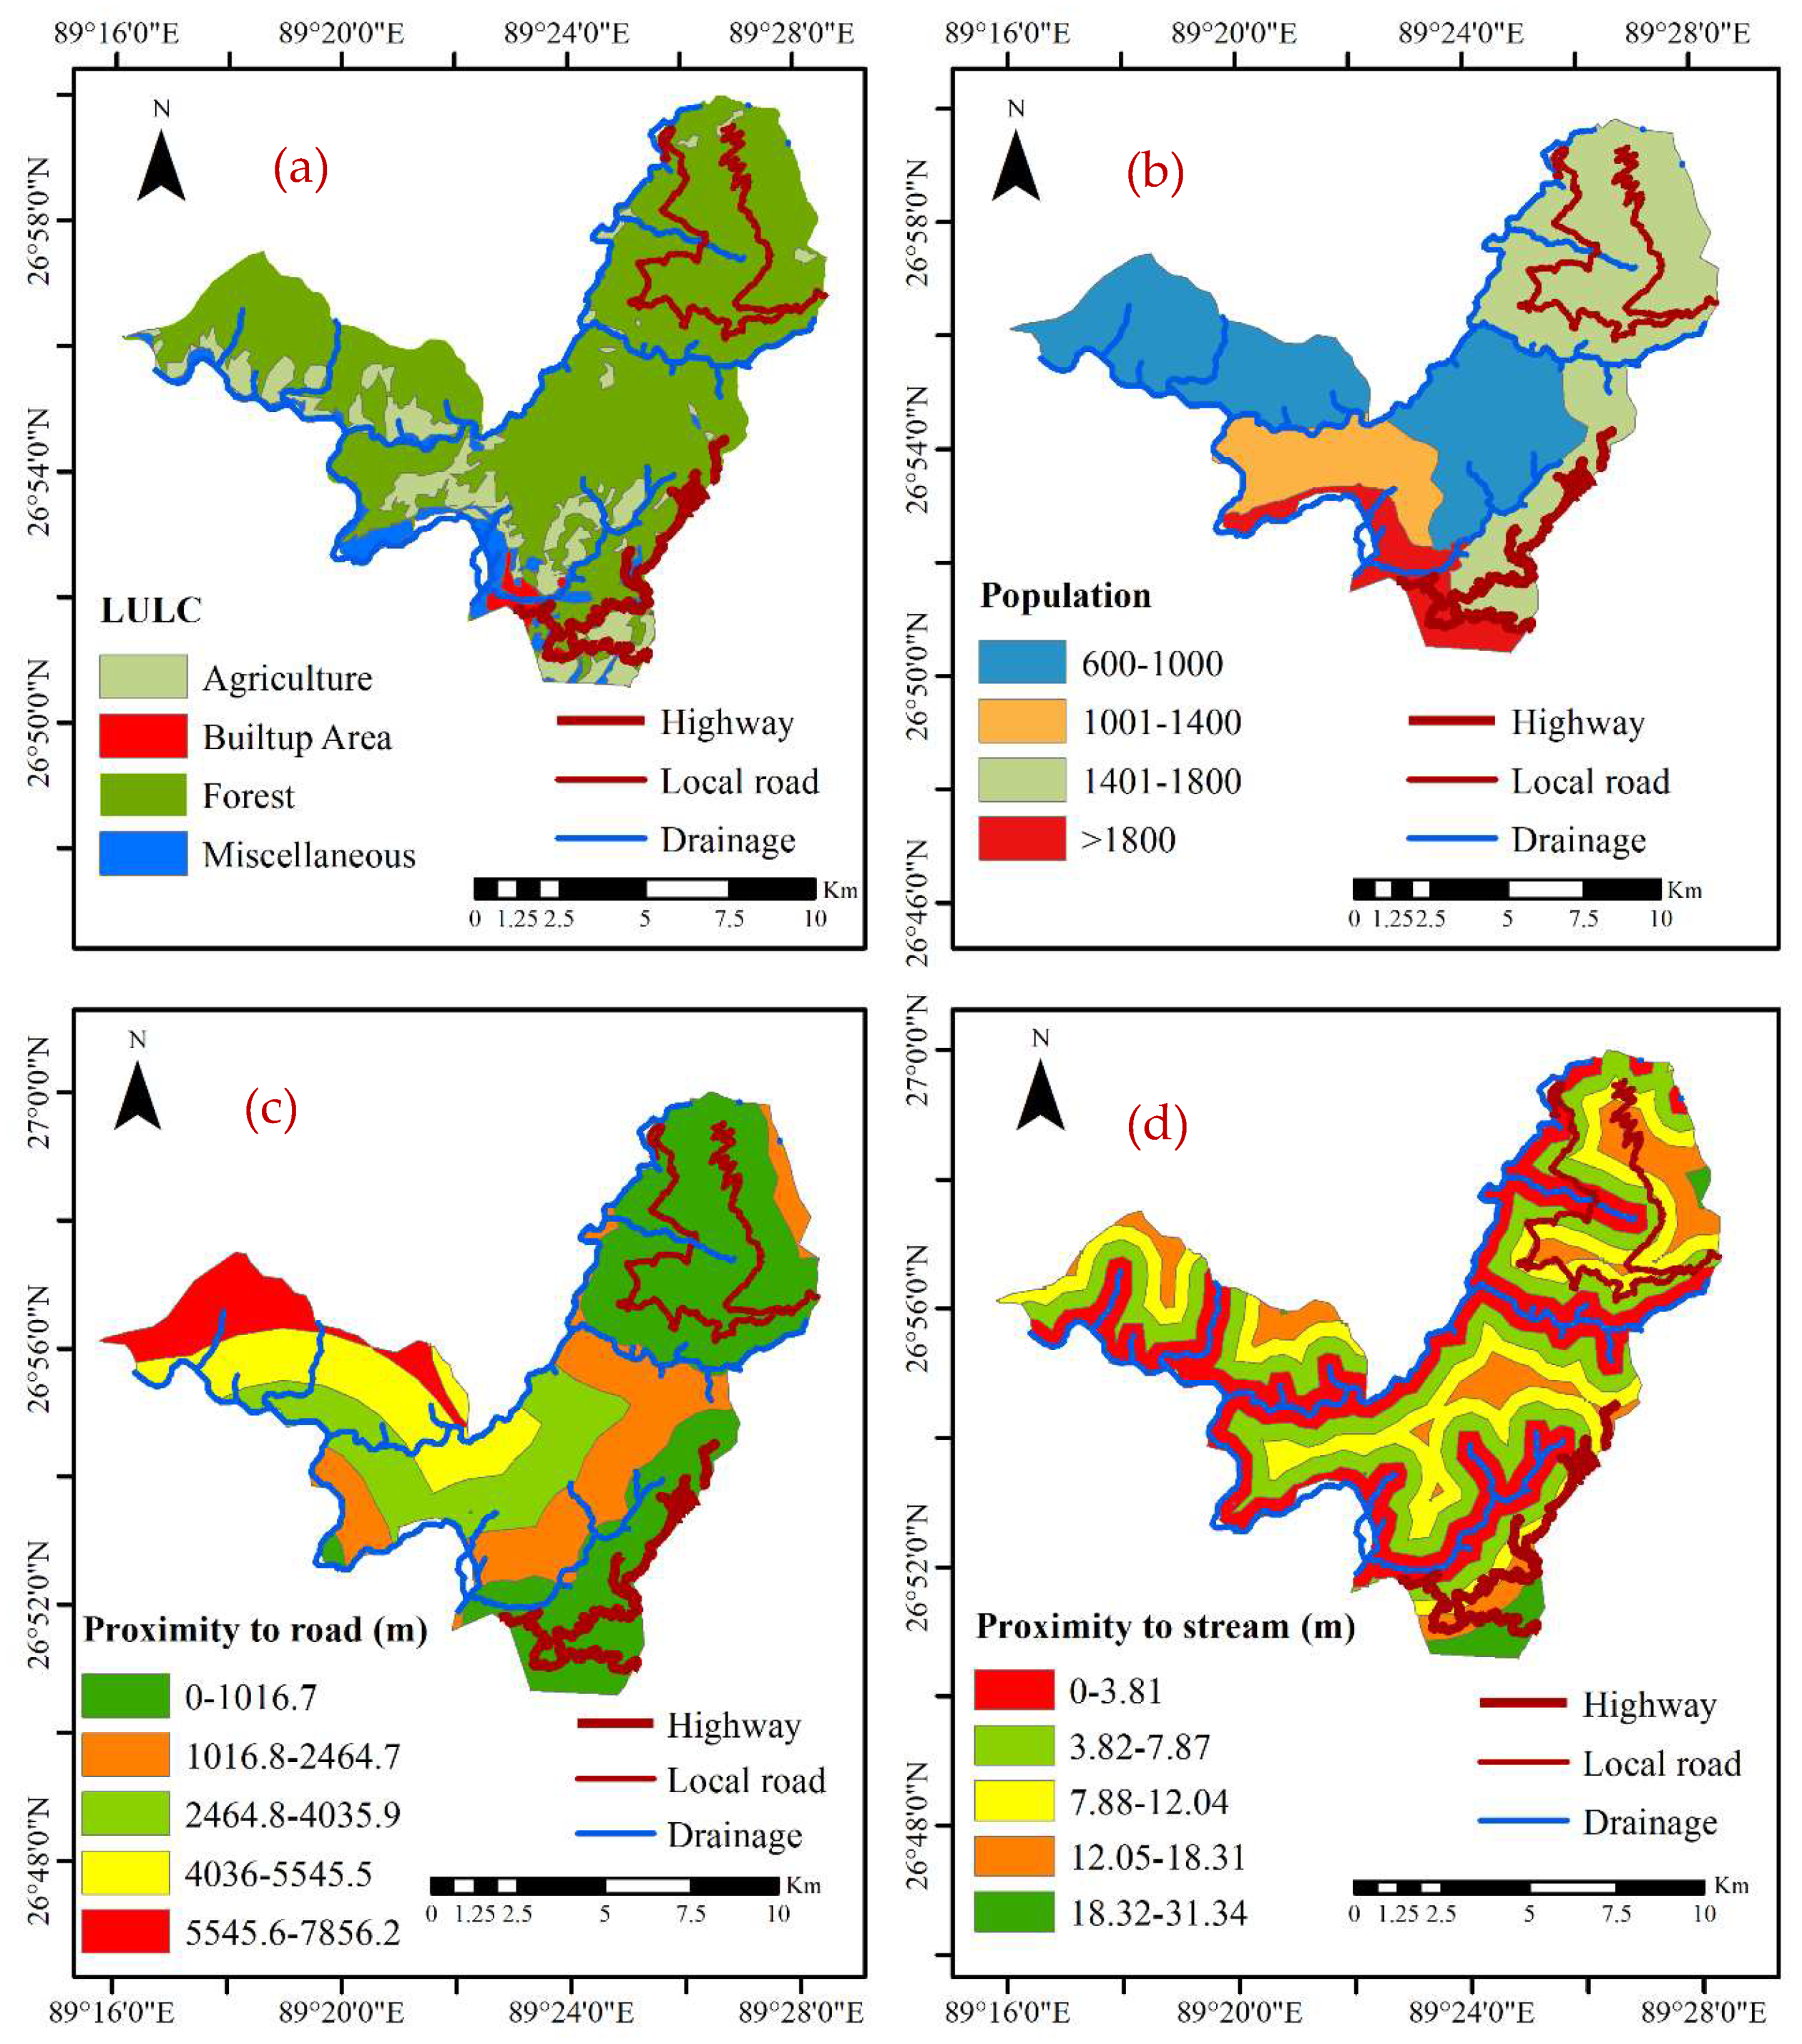
The vulnerability assessment is defined as the expected degree of loss for elements at risk due to a certain event, with values ranging between 0 (no damage) and 1 (complete damage). Its assessment is based on estimation of vulnerability of life and property. A detailed risk assessment would involve considering several elements at risk, like population density, residential and commercial buildings, and their relationship with the type of landslides. However, due to the unavailability of such detailed data, the component of elements at risk could not be considered. The potential damage map was developed using four layers of elements related to exposure and vulnerability, which were LULC, population, proximity to road, and proximity to stream Figure 6a–d and a similar approach to susceptibility mapping was used. Apart from expert opinion, the weights (Equation (4)) provided indicate a logical progression. For example, the built-up area would have more loss due to a higher population, thereby providing them with a higher multiplier. Such regions are specifically used for either commercial or residential purposes or both. These areas can be dangerous on the hills as most of the houses are built on slopes and the roads are constructed by hill cutting. Agriculture covers a significant portion of the study area as it is a means of livelihood for the people staying there. Miscellaneous region includes water bodies and mining sites, and any effect on such sites due to landslides can lead to economic and ecological impact. Similarly, the road network is a lifeline to the people and to the economy of the country, therefore a higher multiplier was provided. This makes the proximity to road factor critical as road cuts are quite common in this region and the risk decreases as distance increases away from the road network. The relevance to the proximity to stream factor is due to the presence of stream channels which could suffer from erosion and hill cutting especially during heavy monsoons. The cutting of hills increases slope instability, making the area more vulnerable to landslides, and it usually increases in regions of higher drainage density and higher elevation. The total population in the study area is 33,444 with 18,043 males and 15,401 females as per census in Bhutan, 2017 [49].
The weights to the layers were provided based on Equation (4).
LV = Population × 0.3 + LULC × 0.2 + Proximity to road × 0.3 + Proximity to stream × 0.2
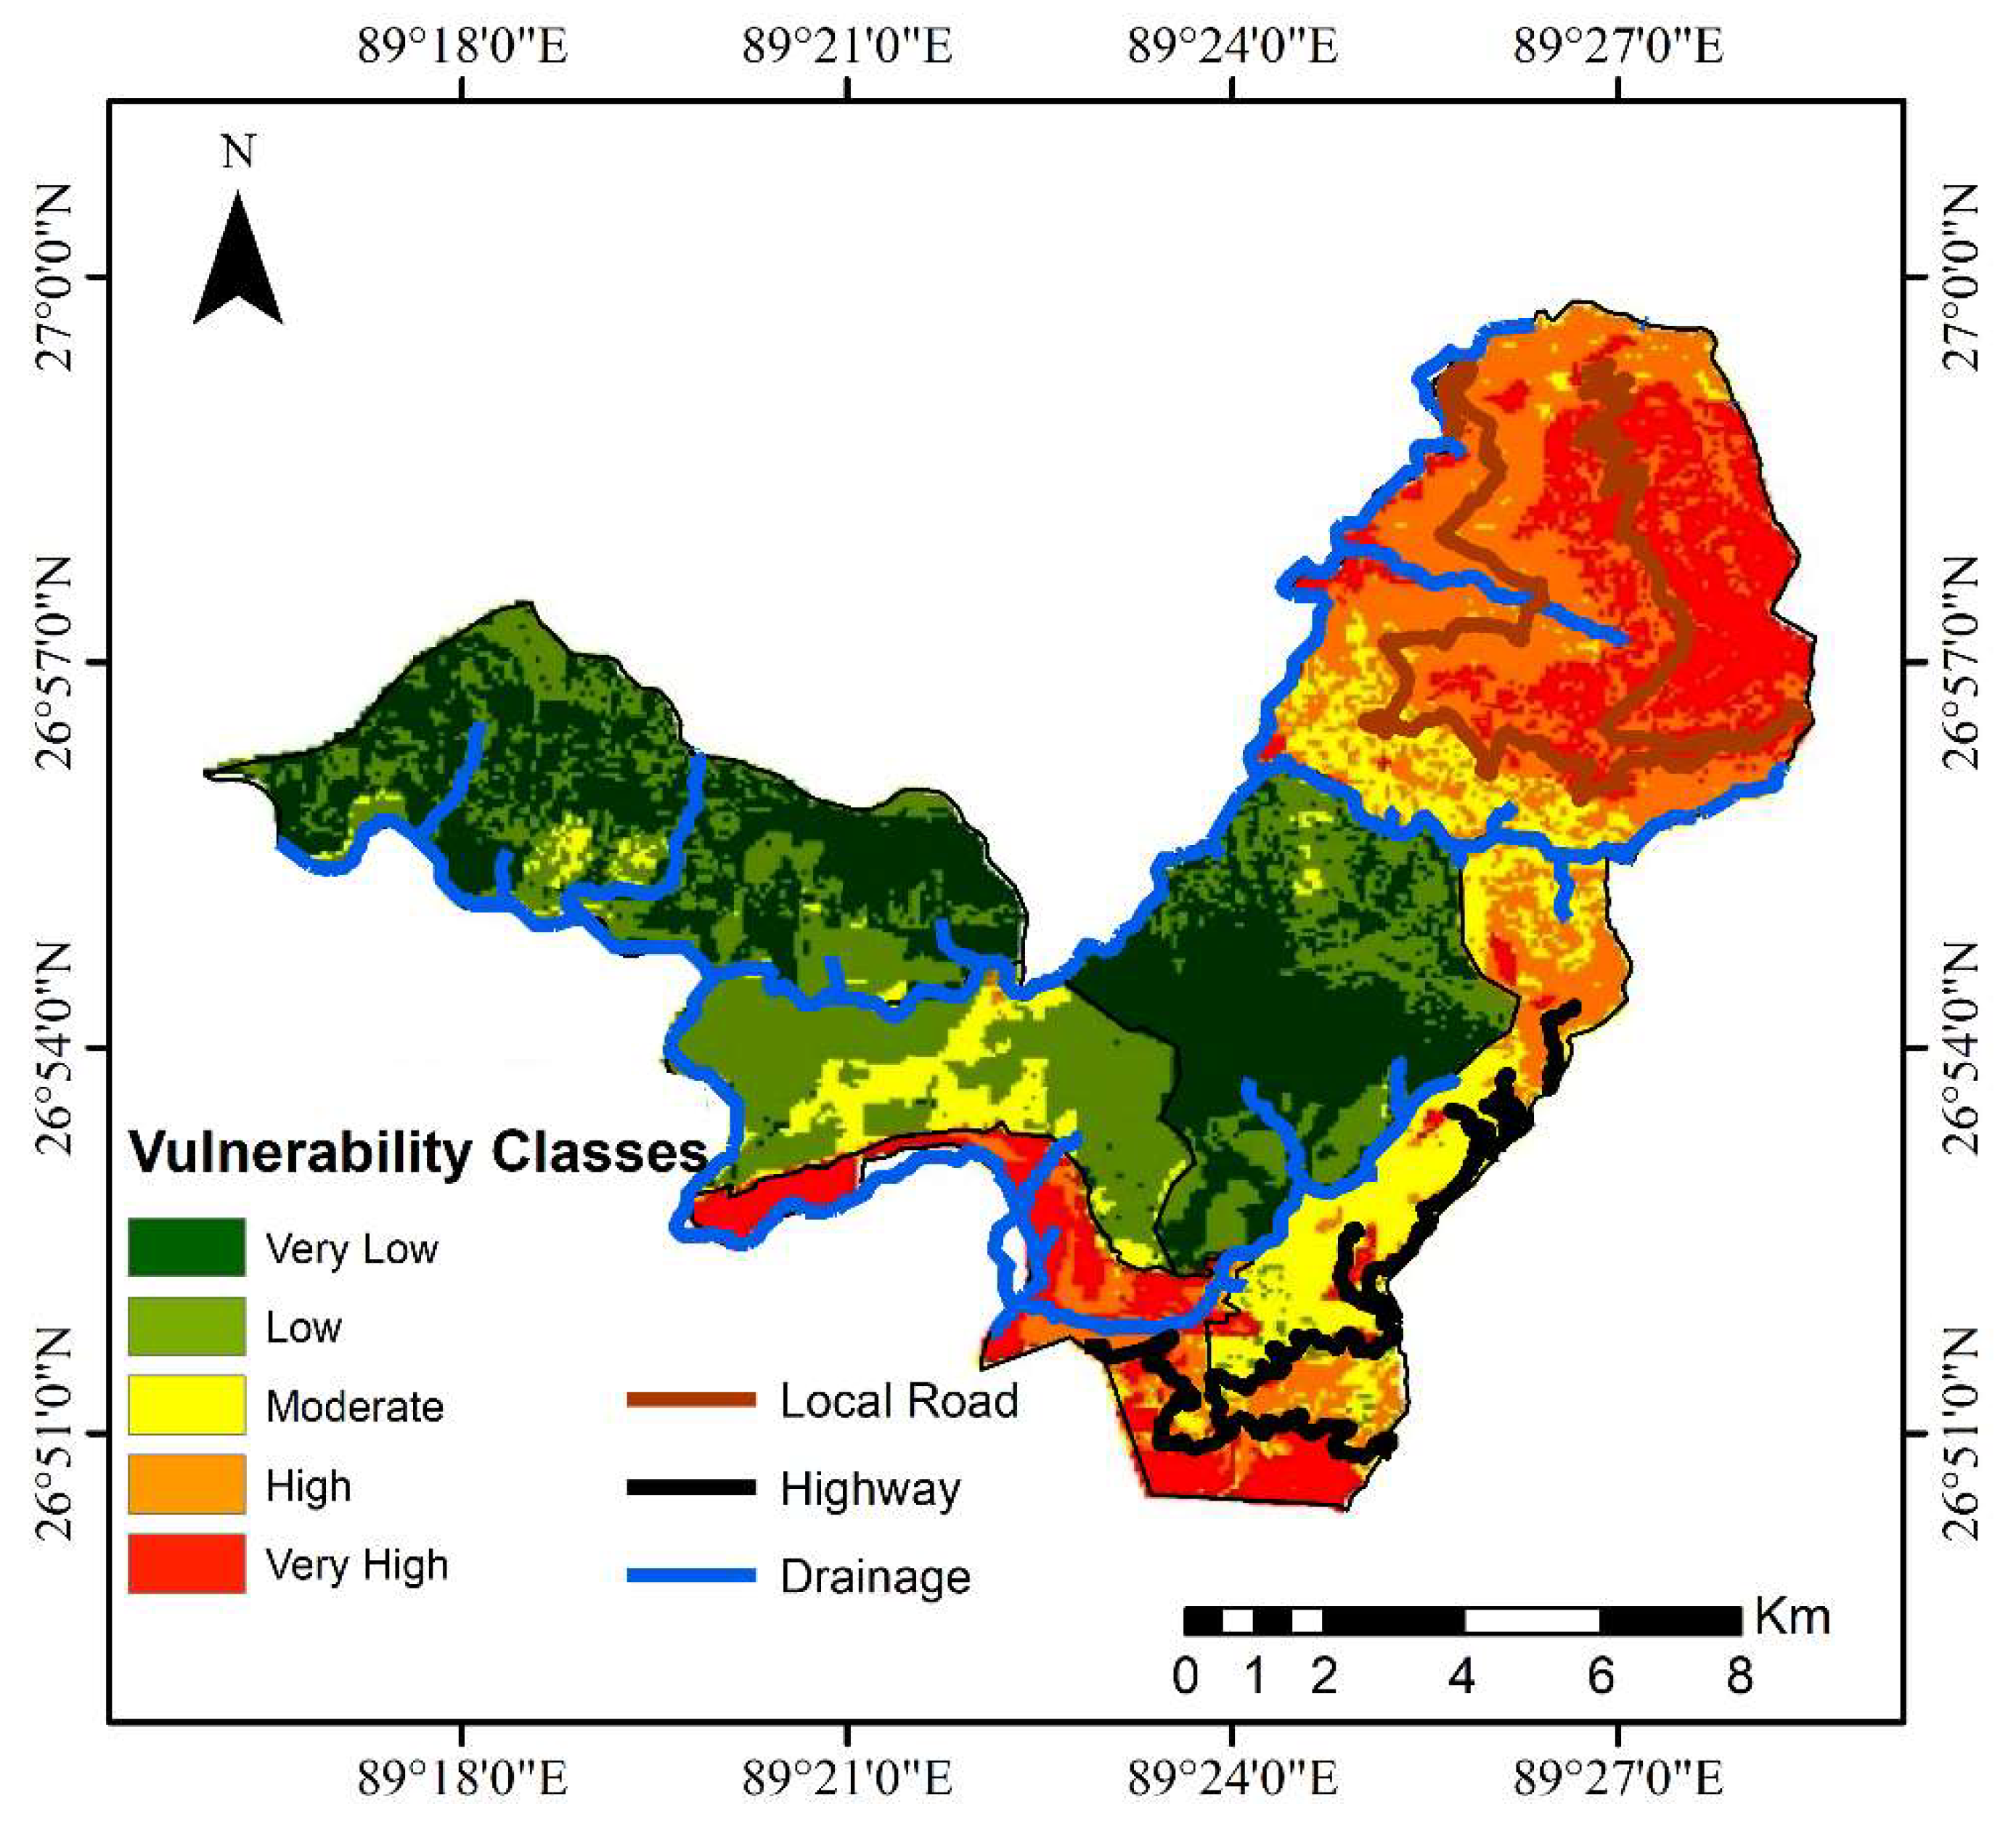
where LV is landslide vulnerability map. The vulnerability map was developed and classified into five classes based on the natural breaks classification technique. Figure 7 represents the landslide vulnerability map and has been divided into five categories, namely, very low (0–0.36), low (0.37–0.48), moderate (0.49–0.64), high (0.65–0.76), and very high (0.77–1). The map depicts that very high and high vulnerable regions can be found in the NE and SW part of the location covering the populated areas. The developed vulnerability map can serve as a guideline for local disaster management agencies for development activities.

5.3. Landslide Risk Assessment

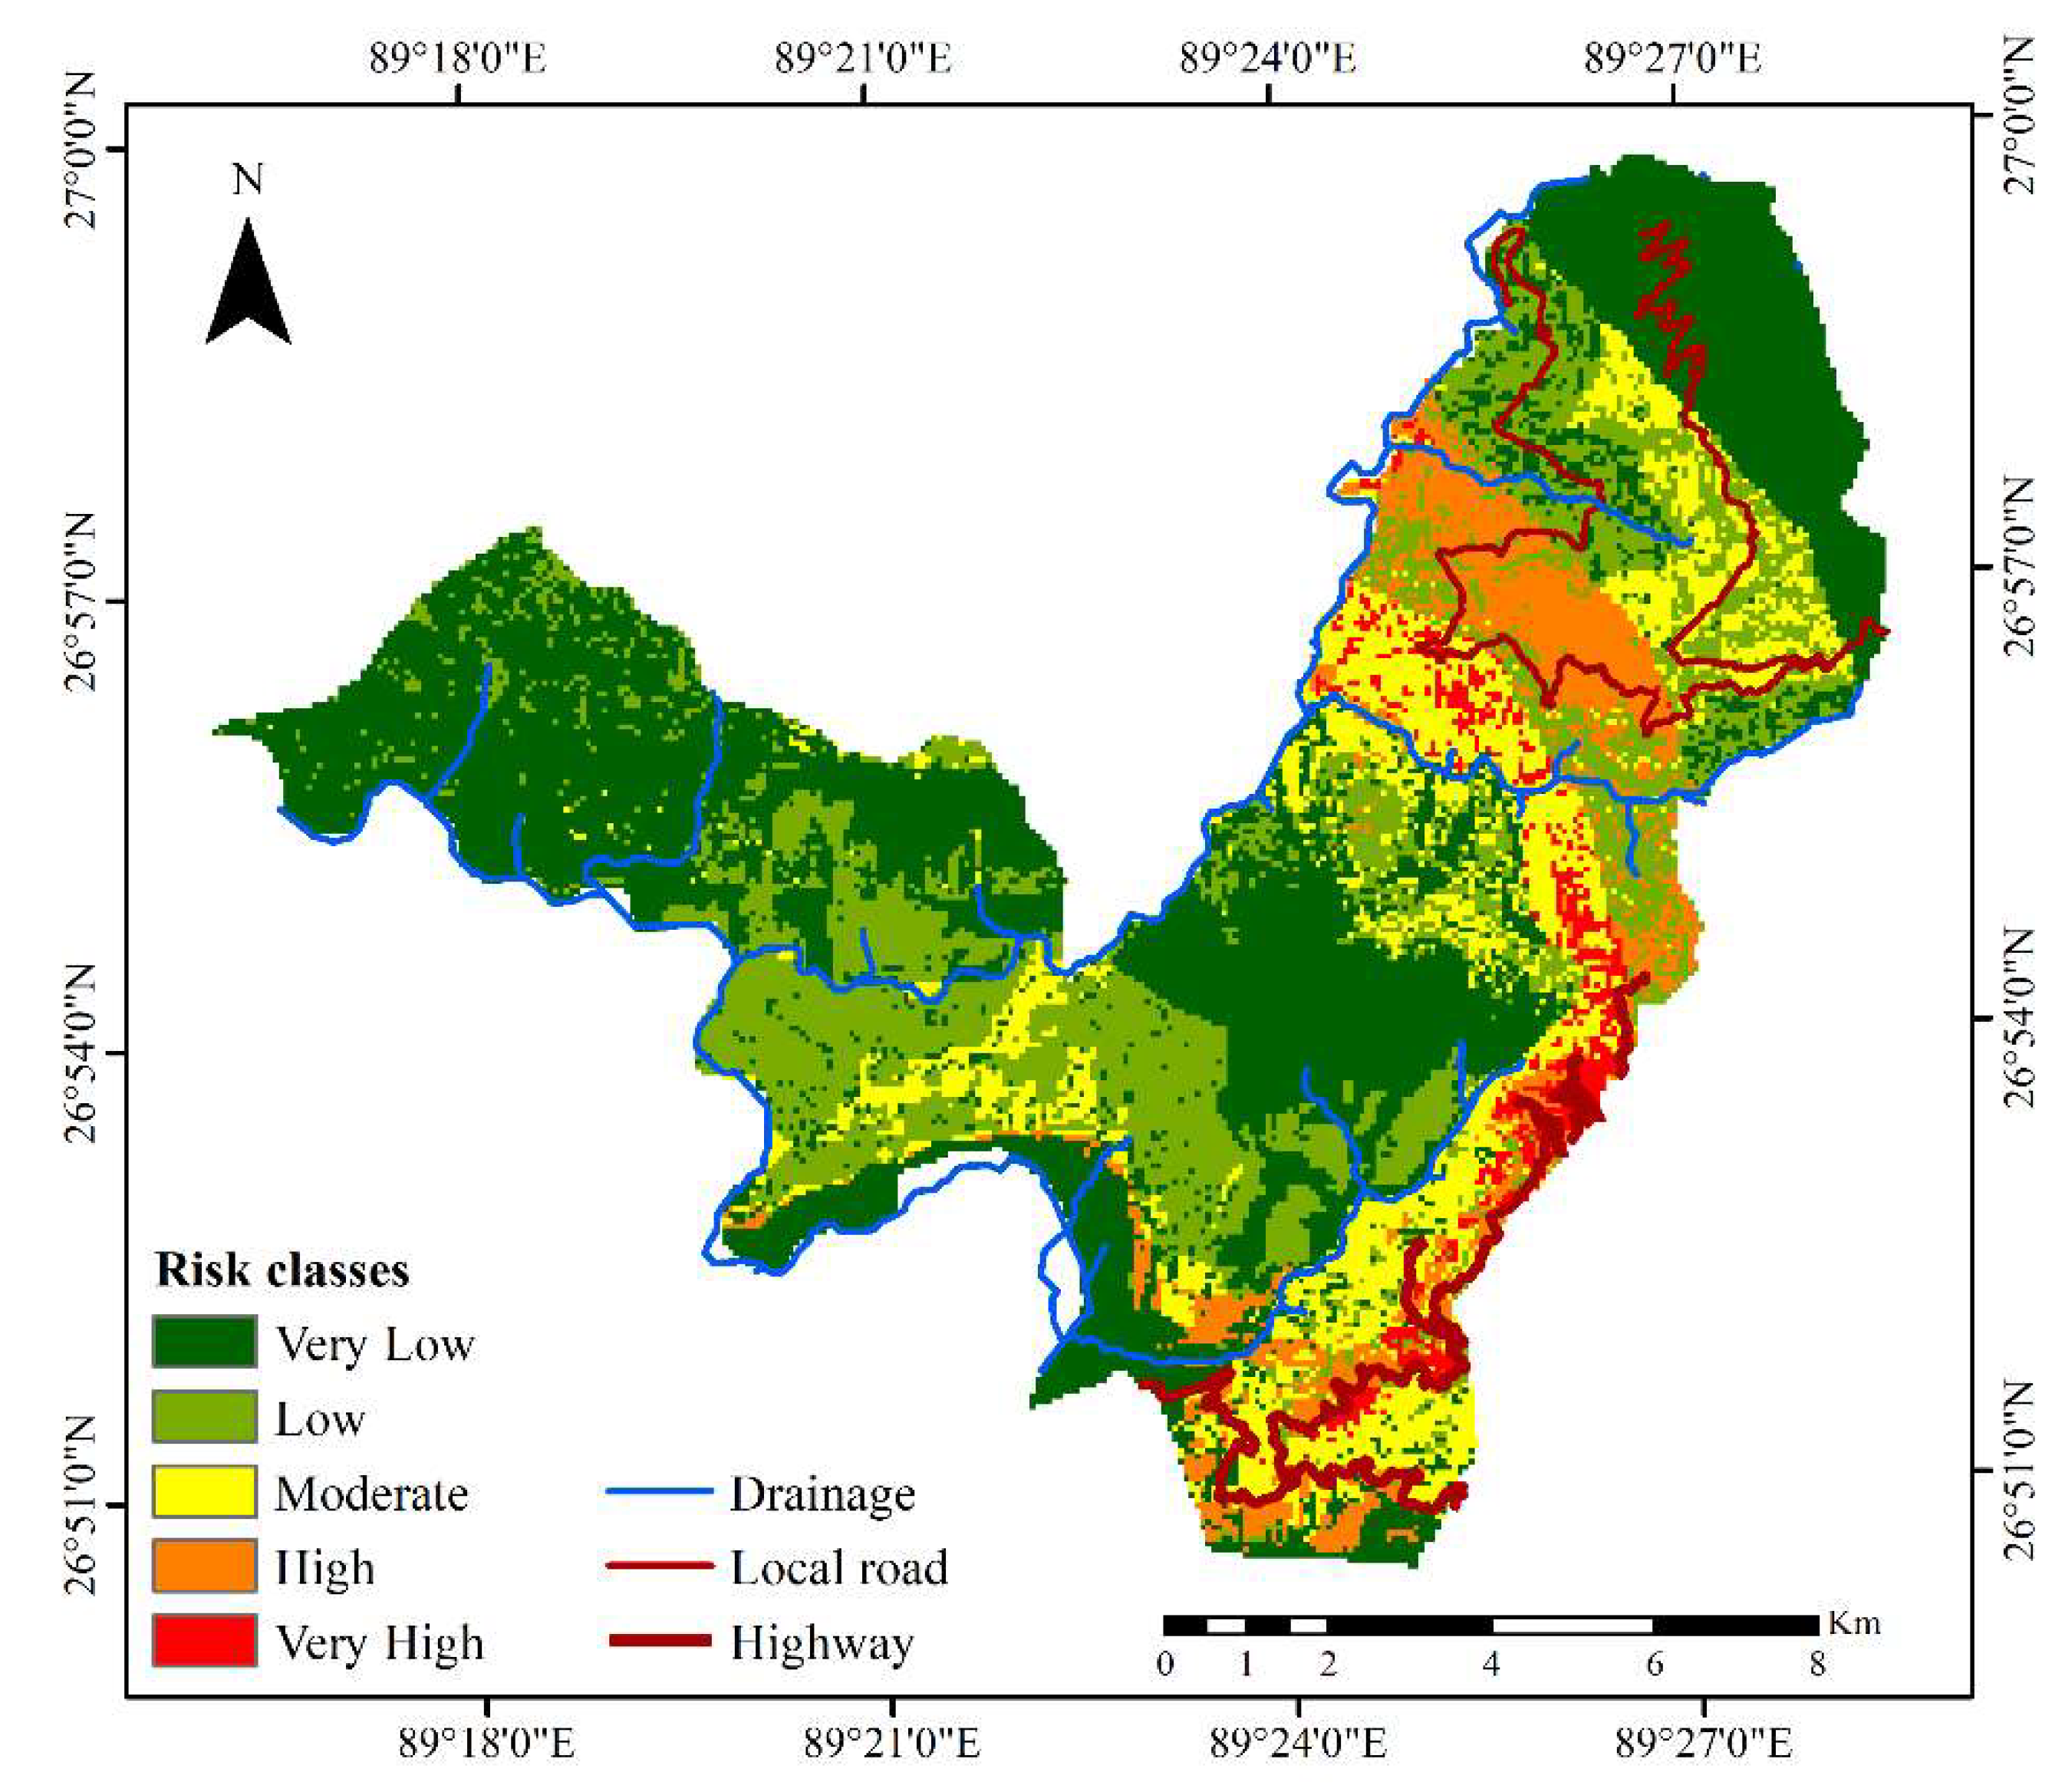
The type of damage linked to landslide risk in the present study has been confined to loss of life and/or property along with a road network. The risk map was developed by multiplying the landslide hazard and vulnerability map. Such a study would also help in estimating the vulnerable area and the impact from any landslide event in the foreseeable future. In order to understand the vulnerability to human lives, the risk to population was estimated and the high-risk zones were identified (Figure 8). The obtained map was classified into five classes (very low (0–0.12), low (0.13–0.21), moderate (0.22–0.37), high (0.38–0.55), and very high (0.56–1)) based on the natural break classification technique [47]. Table 2 depicts the area and affected population under various risk zones whereas Table 3 determines the various landslide risk zones for all six subdivisions (chiwogs). It can be inferred that 20.2% of the population with an area of 15.13 km2 lives in high to high-risk landslide zones.

6. Conclusions

The occurrence of landslides and their growing incidence is a major threat to population and developments to the mountainous region, especially in developing countries. This has led to a need for comprehensive study on various aspects of landslides in such regions. However, such studies in the Bhutan Himalayas is very scarce and studies need to be conducted to understand the landslide effects in the region. Therefore, a landslide risk map has been developed for the Phuentsholing region of southwestern Bhutan. The study area has been selected since the major trade route, Phuentsholing-Thimphu Highway, which connects Bhutan with neighboring countries, passes through it and a landslide in this area can hamper people’s lives and lead to economic losses. The method involved assessing the risk by multiplying the hazard and vulnerability maps. The landslide hazard map was developed by determining the spatial and temporal probabilities of landslides. The spatial probability was determined by performing a weighted sum analysis in an overlay environment for landslide causative factors (geology, slope, rainfall, vegetation, elevation), whereas temporal probability was determined using Poisson’s probability model based on the already calculated regional thresholds. Similarly, landslide vulnerability was determined by providing weights based on expert knowledge gathered after carrying out extensive field study to various elements at risk involved. Finally, the landslide risk map was developed by combining the landslide hazard and vulnerability maps and was divided into five categories depending on various levels of risk associated. The analysis showed that 11.7% of the area comes under the high to very high category of risk, whereas 15.85% falls under moderate risk. One of the major problems for determining landslide risk in such a region is the unavailability of longer and precise rainfall and landslide records, with often under-reporting of the landslide damages. However, the present study can be considered as a preliminary step towards achieving a deep understanding of landslide risk at a local scale. The maps can be further modified and improved with the availability of more detailed data like the distribution of population in terms of gender, and the landslide type. The areas along the highway are expected to be at considerable risk in the near future as more hills are cut for residential and economic development purposes. Such an analysis may be used as a tool to develop a building code based on landslide risk, which Bhutan is presently lacking. This analysis would help the concerned authorities to understand the potential risk in certain sections and could be used for landslide mitigation purposes as there is a rise of infrastructure development in the region.

Author Contributions

Conceptualization, A.D. and R.S.; methodology, A.D. and S.A.; data curation, S.A.; writing—original draft preparation, A.D. and R.S.; writing—review and editing, B.P. and A.M.A.; supervision, B.P. and R.S. All authors have read and agreed to the published version of the manuscript.

Funding

The research was funded from BRACE project (NERC/GCRF NE/P016219/1) granted to Raju Sarkar. This research was supported by the Centre for Advanced Modelling and Geospatial Information Systems (CAMGIS) in the University of Technology Sydney (UTS) under Grants 321740.2232335 and 321740.2232357; Grant 321740.2232424, and Grant 321740.2232452. This research is also supported by Researchers Supporting Project number RSP-2019/14, King Saud University, Riyadh, Saudi Arabia.

Acknowledgments

The authors are thankful to the National Center for Hydrology and Meteorology, Royal Government of Bhutan for providing rainfall data and the Border Roads Organization (Project DANTAK), Government of India for providing landslide data. The authors acknowledge the three anonymous reviewers and the editors for their useful comments and suggestions.

Conflicts of Interest

The authors declare no conflict of interest.

References

  1. Petley, D. Global patterns of loss of life from landslides. Geology 2012, 40, 927–930. [Google Scholar] [CrossRef]
  2. Froude, M.J.; Petley, D.N. Global fatal landslide occurrence from 2004 to 2016. Nat. Hazards Earth Syst. Sci. 2018, 18, 2161–2181. [Google Scholar] [CrossRef] [Green Version]
  3. Dikshit, A.; Sarkar, R.; Pradhan, B.; Jena, R.; Drukpa, D.; Alamri, A. Temporal Probability Assessment and Its Use in Landslide Susceptibility Mapping for Eastern Bhutan. Water 2020, 12, 267. [Google Scholar] [CrossRef] [Green Version]
  4. Dikshit, A.; Satyam, N. Probabilistic rainfall thresholds in Chibo, India: Estimation and validation using monitoring system. J. Mt. Sci. 2019, 16, 870–883. [Google Scholar] [CrossRef]
  5. Segoni, S.; Piciullo, L.; Gariano, S.L. A review of the recent literature on rainfall thresholds for landslide occurrence. Landslides 2018, 15, 1483–1501. [Google Scholar] [CrossRef]
  6. Dikshit, A.; Sarkar, R.; Satyam, N. Probabilistic approach toward Darjeeling Himalayas landslides-A case study. Cogent Eng. 2018, 5, 1–11. [Google Scholar] [CrossRef]
  7. Yin, Y.; Zheng, W.; Liu, Y.; Zhang, J.; Li, X. Integration of GPS with InSAR to monitoring of the Jiaju landslide in Sichuan, China. Landslides 2010, 7, 359–365. [Google Scholar] [CrossRef]
  8. Bui, D.T.; Shahabi, H.; Omidvar, E.; Shirzadi, A.; Geertsema, M.; Clague, J.J.; Khosravi, K.; Pradhan, B.; Pham, B.T.; Chapi, K.; et al. Shallow Landslide Prediction Using a Novel Hybrid Functional Machine Learning Algorithm. Remote. Sens. 2019, 11, 931. [Google Scholar]
  9. Vranken, L.; Vantilt, G.; Eeckhaut, M.V.D.; Vandekerckhove, L.; Poesen, J. Landslide risk assessment in a densely populated hilly area. Landslides 2014, 12, 787–798. [Google Scholar] [CrossRef]
  10. Einstein, H.H. Landslide risk–Systematic approaches to assessment and management. Landslide Risk Assess. 2018, 25–50. [Google Scholar] [CrossRef]
  11. Althuwaynee, O.F.; Pradhan, B. Semi-quantitative landslide risk assessment using GIS-based exposure analysis in Kuala Lumpur City. Geomat. Nat. Hazards Risk 2016, 8, 706–732. [Google Scholar] [CrossRef] [Green Version]
  12. Carrara, A.; Publiese-Carratelli, E.; Merenda, L. Computer-based data bank and statistical analysis of slope instability phenomena. Z. fur Geomorphol. N.F. 1977, 21, 187–222. [Google Scholar]
  13. Nilsen, T.H.; Wright, R.; Vlasic, T.; Spangle, W. Relative slope stability and land-use planning in the San Francisco Bay region, California. Prof. Pap. 1979, 944. [Google Scholar] [CrossRef]
  14. Lovell, D.P.; Thomas, G. Quantitative risk assessment. In Proceedings of the Food Chemical Risk Analysis; Springer Science and Business Media LLC: Berlin/Heidelberg, Germany, 1997; pp. 57–86. [Google Scholar]
  15. Wong, H. Landslide risk assessment for individual facilities. In Landslide Risk Management; CRC Press: Boca Raton, FL, USA, 2005; pp. 247–306. [Google Scholar]
  16. Hadmoko, D.S.; Lavigne, F.; Sartohadi, J.; Hadi, P. Winaryo Landslide hazard and risk assessment and their application in risk management and landuse planning in eastern flank of Menoreh Mountains, Yogyakarta Province, Indonesia. Nat. Hazards 2010, 54, 623–642. [Google Scholar] [CrossRef]
  17. Pradhan, B.; Abdulwahid, W.M. Landslide Risk Assessment Using Multi-hazard Scenario Produced by Logistic Regression and LiDAR-Based DEM. In Laser Scanning Applications in Landslide Assessment; Springer Science and Business Media LLC: Berlin/Heidelberg, German, 2017; Volime 9, pp. 253–275. [Google Scholar]
  18. Liu, X.; Miao, C. Large-scale assessment of landslide hazard, vulnerability and risk in China. Geomat. Nat. Hazards Risk 2018, 9, 1037–1052. [Google Scholar] [CrossRef] [Green Version]
  19. Goorchi, R.N.; Amini, M.; Memarian, H. A new rating system approach for risk analysis of rock slopes. Nat. Hazards 2017, 91, 75–102. [Google Scholar]
  20. Saldivar-Sali, A.; Einstein, H.H. A Landslide Risk Rating System for Baguio, Philippines. Eng. Geol. 2007, 91, 85–99. [Google Scholar] [CrossRef]
  21. Alejano, L.R.; Stockhausen, H.; Alonso, E.; Bastante, F.G.; Oyanguren, P.R. ROFRAQ: A statistics-based empirical method for assessing accident risk from rockfalls in quarries. Int. J. Rock Mech. Min. Sci. 2008, 45, 1252–1272. [Google Scholar] [CrossRef]
  22. Lombardi, M.; Cardarilli, M.; Raspa, G. Spatial variability analysis of soil strength to slope stability assessment. Géoméch. Eng. 2017, 12, 483–503. [Google Scholar] [CrossRef]
  23. Tofani, V.; Bicocchi, G.; Rossi, G.; Segoni, S.; D’Ambrosio, M.; Casagli, N.; Catani, F. Soil characterization for shallow landslides modeling: A case study in the Northern Apennines (Central Italy). Landslides 2017, 14, 755–770. [Google Scholar] [CrossRef] [Green Version]
  24. Cardarilli, M.; Lombardi, M.; Corazza, A. Landslide risk management through spatial analysis and stochastic prediction for territorial resilience evaluation. Int. J. Saf. Secur. Eng. 2019, 9, 109–120. [Google Scholar] [CrossRef] [Green Version]
  25. Gariano, S.L.; Sarkar, R.; Dikshit, A.; Dorji, K.; Brunetti, M.T.; Peruccacci, S.; Melillo, M. Automatic calculation of rainfall thresholds for landslide occurrence in Chukha Dzongkhag, Bhutan. Bull. Int. Assoc. Eng. Geol. 2018, 78, 4325–4332. [Google Scholar] [CrossRef]
  26. Dikshit, A.; Sarkar, R.; Pradhan, B.; Acharya, S.; Dorji, K. Estimating Rainfall Thresholds for Landslide Occurrence in the Bhutan Himalayas. Water 2019, 11, 1616. [Google Scholar] [CrossRef] [Green Version]
  27. Sarkar, R.; Dorji, K. Determination of the Probabilities of Landslide Events—A Case Study of Bhutan. Hydrology 2019, 6, 52. [Google Scholar] [CrossRef] [Green Version]
  28. Erener, A.; Duzgun, H.S.B. A regional scale quantitative risk assessment for landslides: Case of Kumluca watershed in Bartin, Turkey. Landslides 2012, 10, 55–73. [Google Scholar] [CrossRef]
  29. Luca, F.; D’Ambrosio, D.; Robustelli, G.; Rongo, R.; Spataro, W. Integrating geomorphology, statistic and numerical simulations for landslide invasion hazard scenarios mapping: An example in the Sorrento Peninsula (Italy). Comput. Geosci. 2014, 67, 163–172. [Google Scholar] [CrossRef]
  30. Piciullo, L.; Calvello, M.; Cepeda, J.M. Territorial early warning systems for rainfall-induced landslides. Earth-Sci. Rev. 2018, 179, 228–247. [Google Scholar] [CrossRef]
  31. Gansser, A. Geology of the Bhutan Himalaya. In Denkschriften der Schweizerischen Naturforschenden Geselschaft; Birkhäuser Verlag: Basel, Switzerland, 1983; p. 181. [Google Scholar]
  32. Segoni, S.; Pappafico, G.; Luti, T.; Catani, F. Landslide susceptibility assessment in complex geological settings: Sensitivity to geological information and insights on its parameterization. Landslides 2020, 1–11. [Google Scholar] [CrossRef] [Green Version]
  33. Long, S.; McQuarrie, N.; Tobgay, T.; Grujic, D. Geometry and crustal shortening of the Himalayan fold-thrust belt, eastern and central Bhutan. GSA Bull. 2011, 123, 1427–1447. [Google Scholar] [CrossRef]
  34. Lohmann, U.; Sausen, R.; Bengtsson, L.; Cubasch, U.; Perlwitz, J.; Roeckner, E. The Köppen climate classification as a diagnostic tool for general circulation models. Clim. Res. 1993, 3, 177–193. [Google Scholar] [CrossRef]
  35. Prokop, P.; Walanus, A. Impact of the Darjeeling–Bhutan Himalayan front on rainfall hazard pattern. Nat. Hazards 2017, 89, 387–404. [Google Scholar] [CrossRef] [Green Version]
  36. Hervás, J.; Bobrowsky, P. Mapping: Inventories, Susceptibility, Hazard and Risk. In Landslides–Disaster Risk Reduction; Springer Science and Business Media LLC: Berlin/Heidelberg, Germany, 2008; pp. 321–349. [Google Scholar]
  37. Reichenbach, P.; Rossi, M.; Malamud, B.; Mihir, M.; Guzzetti, F. A review of statistically-based landslide susceptibility models. Earth-Sci. Rev. 2018, 180, 60–91. [Google Scholar] [CrossRef]
  38. Michael, E.A.; Samanta, S. Landslide vulnerability mapping (LVM) using weighted linear combination (WLC) model through remote sensing and GIS techniques. Model. Earth Syst. Environ. 2016, 2, 88. [Google Scholar] [CrossRef] [Green Version]
  39. Jaiswal, P.; Van Westen, C. Estimating temporal probability for landslide initiation along transportation routes based on rainfall thresholds. Geomorphology 2009, 112, 96–105. [Google Scholar] [CrossRef]
  40. Guzzetti, F.; Reichenbach, P.; Cardinali, M.; Galli, M.; Ardizzone, F. Probabilistic landslide hazard assessment at the basin scale. Geomorphology 2005, 72, 272–299. [Google Scholar] [CrossRef]
  41. Lin, Q.; Wang, Y.; Liu, T.; Zhu, Y.; Sui, Q. The Vulnerability of People to Landslides: A Case Study on the Relationship between the Casualties and Volume of Landslides in China. Int. J. Environ. Res. Public Heal. 2017, 14, 212. [Google Scholar] [CrossRef] [Green Version]
  42. Baiocchi, V.; Dominici, D.; Guarascio, M.; Lombardi, M.; Vatore, F. Mapping seismic vulnerability in buildings by means of open source tools and open data. Geoing. Ambient. e Min. 2017, 151, 27–32. [Google Scholar]
  43. Glade, T.; Crozier, M.J. The Nature of Landslide Hazard Impact; Landslide Hazard and Risk; Wiley: Chichester, UK, 2005; pp. 43–74. [Google Scholar]
  44. Van Westen, C.; Alkema, D.; Damen, M.; Kerle, N.; Kingma, N. Multi-Hazard Risk Assessment: Distance Education Course Guide Book; United Nations University—ITC School on Disaster Geoinformation Management: Tokyo, Japan, 2009. [Google Scholar]
  45. Jena, R.; Pradhan, B.; Beydoun, G. Earthquake vulnerability assessment in Northern Sumatra province by using a multi-criteria decision-making model. Int. J. Disaster Risk Reduct. 2020, 46, 101518. [Google Scholar] [CrossRef]
  46. Pourghasemi, H.R.; Mohammady, M.; Pradhan, B. Landslide susceptibility mapping using index of entropy and conditional probability models in GIS: Safarood Basin, Iran. Catena 2012, 97, 71–84. [Google Scholar] [CrossRef]
  47. Park, S.-J.; Lee, C.-W.; Lee, S.; Lee, M.-J. Landslide Susceptibility Mapping and Comparison Using Decision Tree Models: A Case Study of Jumunjin Area, Korea. Remote. Sens. 2018, 10, 1545. [Google Scholar] [CrossRef] [Green Version]
  48. Kayal, J.R.; Arefiev, S.S.; Baruah, S.; Tatevossian, R.; Gogoi, N.; Sanoujam, M.; Gautam, J.L.; Hazarika, D.; Borah, D. The 2009 Bhutan and Assam felt earthquakes (Mw6.3 and 5.1) at the Kopili fault in the northeast Himalaya region. Geomat. Nat. Hazards Risk 2010, 1, 273–281. [Google Scholar] [CrossRef] [Green Version]
  49. Bhutan, N. Population and Housing Census of Bhutan; Royal Government of Bhutan: Thimpu, Bhutan, 2017.
Figure 1. Location of the study region showing (a) Bhutan in Southeast Asia, (b) Bhutan highlighting Chukha Dzongkhag, (c) Chukha Dzongkhag highlighting Phuentsholing region, and (d) territorial boundaries of the study region.
Geosciences 10 00131 g001
Figure 2. Landslide damage along Phuentsholing-Thimphu Highway (after 2017 monsoon).
Geosciences 10 00131 g002
Figure 3. Geological map of the study area.
Geosciences 10 00131 g003
Figure 4. (a) Slope, (b) elevation, (c) vegetation, and (d) rainfall map of the study area.
Geosciences 10 00131 g004
Figure 5. Landslide hazard map of the study region.
Geosciences 10 00131 g005
Figure 6. Landslide vulnerability factor maps (a) LULC, (b) population, (c) proximity to road, (d) proximity to stream.
Geosciences 10 00131 g006
Figure 7. Landslide vulnerability map for Phuentsholing.
Geosciences 10 00131 g007
Figure 8. Landslide risk map of the study region.
Geosciences 10 00131 g008
Table 1. Number of landslides under various factors.
Factor Area (km2)Number of Landslides
GeologyPangsari Formation28.420
Shumar Group22.720
Phuentsholing Formation21.024
Daling Formation23.9-
Jaishidanda Formation4.0-
Orthogneiss unit0.9-
Lower metasedimentary unit30.8-
Slope (in °)0–1519.814
16–3062.431
31–4544.818
46–604.61
61–750.1
Elevation (in m)187–58764.426
588–99445.538
995–149917.7-
1500–24374.1-
Rainfall (in mm)2500–28005.8-
2801–310033.0-
3101–340092.964
Land Use/Land Cover TypeForest104.737
Built up1.47
Agriculture19.414
Miscellaneous6.26
Table 2. Area and population distribution with respect to risk zones.
Risk ZoneArea (%)Area (km2)Population
Very Low44.7058.719,148
Low27.7536.72030
Moderate15.8521.25496
High8.5011.36341
Very High3.203.8429
Table 3. Area affected by various risk zones for all six chiwogs.
ChiwogsRisk ZoneArea (km2)
LingdaenVery Low21.71
Low5.60
Moderate0.20
High0.00
Very High0.00
PachhuVery Low1.30
Low11.40
Moderate2.80
High0.07
Very High0.00
Dzongkhag ThromdeVery Low7.02
Low0.09
Moderate1.70
High2.35
Very High0.03
Dophugchen WangduegatshelVery Low0.50
Low2.71
Moderate6.90
High2.82
Very High2.71
Deling MarpjiVery Low14.20
Low6.00
Moderate2.60
High0.14
Very High0.01
Chong Geykha DophulakhaVery Low13.76
Low11.10
Moderate6.96
High5.95
Very High1.07