Abstract
This paper uses hydrochemical and multi-isotope analysis to investigate geological controls on coal seam gas (CSG) saturation domains and gas well production performance in a high-rank (vitrinite reflectance (Rv) > 1.1) CSG field in the north-western Bowen Basin, Australia. New hydrochemical and stable isotope data were combined with existing geochemical datasets to refine hypotheses on the distribution and origins of CSG in two highly compartmentalized Permian coal seams. Stable isotopic results suggest that geographic variations in gas content, saturation and production reflect the extent of secondary microbial gas generation and retention as a function of hydrodynamics. δ13C and δ2H data support a gas mixing hypothesis with δ13C-CH4 increasing from secondary biogenic values to thermogenic values at depth (δ13C −62.2‰ to −46.3‰), whereas correlated methane and carbon dioxide carbon isotope compositions, Δ13C(CO2–CH4) values and δ13CDIC/alkalinity trends are largely consistent with microbial CO2 reduction. In addition, below 200 m, the majority of δ13C-CO2 values are positive (δ13C: −1.2‰ to 7.1‰) and δ13CDIC shows an erratic increase with depth for both seams that is characteristic of evolution via microbial activity. The progression of carbon isotope values along the CO2 reduction fractionation line suggests progressive depletion of the CO2 reservoir with increasing depth. Faults clearly segment coal seams into areas having significantly different production, with results of geochemical analysis suggesting that pooling of biogenic gas and waters and enhanced methanogenesis occur north of a faulted hinge zone.
1. Introduction
Understanding the origins and co-evolution of coal seam gases and waters is essential for coal seam gas (CSG) exploration and development, coal mine planning and related water management. CSG production performance is a function of well design implementation and several hydro-geological factors, such as gas reservoir size and geometry, gas content, gas saturation and coal permeability. It is widely acknowledged that hydro-geological controls on CSG generation, migration and retention can be decoded from the chemical and isotope compositions of the gases and associated fluids [1,2,3,4,5,6,7,8]. Coal bed reservoirs typically behave as fractured aquifers that produce significant volumes of water throughout the life of a field. In shallow CSG plays, areas of higher gas contents, gas saturation and gas production commonly reflect spatial variability in coal bed recharge, hydrodynamics and hydrochemistry along the basin margin, e.g., [9,10,11,12]. The basinward movement of meteoric recharge waters introduces microbes responsible for secondary microbial methane generation, modifies the water chemistry and can cause the migration and accumulation of gases on the up-dip side of structural, stratigraphic or hydrodynamic traps, e.g., structural hinge lines, faults, coal pinch outs, or permeability barriers oriented orthogonal to groundwater flow. Up-dip migration of deeper basinal fluids can also affect CSG producibility via conventional or hydrodynamic trapping and resorption of migrated gases. Employing a combination of stable isotopic and hydrochemical tracers is essential to determine the relative importance of microbial versus thermogenic gas generation, delineating methanogenic pathways and discerning fluid and gas migration directions relative to known reservoir compartmentalisation [11].
The eastern Australian CSG industry has experienced significant growth over the last 20 years, prompting several geochemical studies on gas and water origins [1,2,3,9,13,14,15,16,17,18]. These studies have demonstrated the value of hydrochemistry and stable isotopes as CSG exploration and development tools and enhanced understanding of the low temperature fluid-rock interaction, microbial and mixing processes that occur down to 1000 m in Australia’s sedimentary basins. However, variable well production performance is still not fully understood, even in mature CSG fields and particularly in structurally complex areas such as the Bowen and Sydney basins.
The current study contributes to the smaller body of literature focused on within seam variation at the field or mine-scale, where geochemical datasets can be analyzed against dense geological, production and well completion information. This paper uses hydrochemical (major ions) and multi-isotope analysis (δ13C, δ2H, δ18O) of co-produced gases and waters to investigate hydro-geological controls, CSG saturation domains and CSG well production performance in a small, high-rank (vitrinite reflectance (Rv > 1.1)) CSG field in the north-western Bowen Basin, Queensland. New data are combined with existing geochemical datasets to refine hypotheses on the distribution and origins of CSG in two highly compartmentalised Permian coal seams on opposite sides of a major hinge zone.
2. Geological and Hydrogeological Setting
The study area (~12 × 14 km) is located in the north–western Bowen Basin in central Queensland. Elevations range from 195–345 meters above sea level (mASL) and average annual rainfall is 614 mm per year, with most (>70%) of the annual precipitation occurring from October to March. The field is traversed by a highly ephemeral, SE-flowing river. Commercial CSG production commenced in 2004 with most wells targeting the upper (P) or lower (GM) Permian coal seams between 100 and 500 m below ground level (Figure 1). CSG is produced from medium radius surface to in-seam wells consisting of a vertical production well intersected by two lateral wells in a chevron configuration.
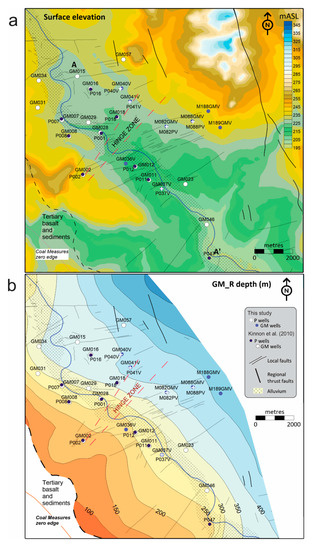
Figure 1.
(a) Surface topography of the study field. (b) Depth to top of the lower (GM) seam below ground level. See Figure 2 for study area location. mASL: metres above sea level.
Permian strata dip gently (1–5°) to the NE and are folded into an asymmetric E-plunging anticline-syncline pair (Figure 1, Figure 2 and Figure 3). Along strike, the principal target (P and GM) seams exhibit strong reservoir compartmentalisation by faulting and folding. The study area is bisected by a major NE-trending, NW-dipping bounding normal fault with 10–15 m throw on the flank of the anticline. South of the bounding fault and hinge zone, short (<5 km, 1 to >25 m throw), ENE-trending normal faults form small graben systems and the GM seam splits into two plies (Figure 3). The majority of normal faults are aligned approximately parallel to the present day maximum principal horizontal stress direction [19], suggesting that they are potentially permeable. The dominant cleat and joint sets tend to be perpendicular to the faults implying that most of the fractures are closed; however, results of underground mine mapping and image log analysis suggest that open or partially open fracture networks exist in the northern part of the study area, which would locally enhance permeability. Faults are mostly normal; however, reverse, strike-slip and thrust faults are also present, with variable displacement. The thickness of the upper P seam ranges from 1–5 m while the average thickness of the lower GM seam is ~5 m. The ash content of the GM seam increases to the south towards the split axis (Figure 3). Coal iso-rank lines generally follow structure contours [20].
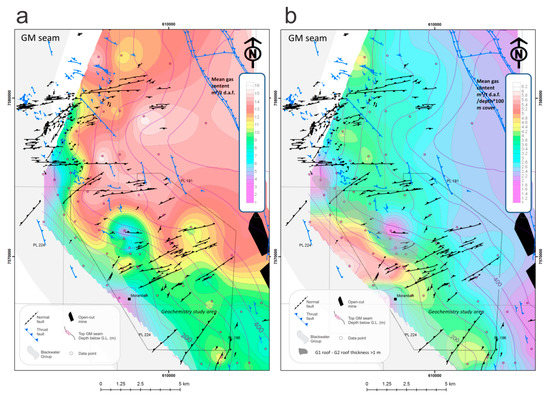
Figure 2.
Regional structural elements maps showing: (a) Mean gas content m3/t (dry ash free; d.a.f.) and (b) Mean gas gradient in m3/t (d.a.f.)/100 depth of cover, overlain by “cannel coal/carbonaceous mudstone” channel in the roof of the GM seam (G1–G2 defined by Anglo American). Mine/field-scale faults from Anglo American unpubl. in-house dataset (2016). Major N-NW-trending thrust fault layer modified from Arrow Energy unpubl. in-house dataset (2016). Gas content data from Arrow Energy unpubl. in-house dataset (2016).
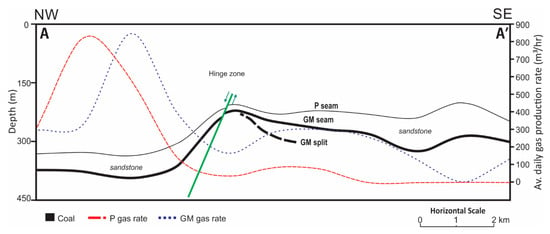
Figure 3.
Schematic cross-section across the study field, showing variable gas production north and south of the hinge zone. See Figure 1 for section location.
A 15–35 m thick Quaternary alluvial aquifer occupies a 0.5–1 km wide area within the river valley that contains relatively minor, isolated pockets of groundwater. The coal measures subcrop beneath minor Tertiary basalt and alluvial aquifers in the west of the study area. The bituminous P and GM coal seams are laterally continuous, have low to moderate permeability and function as confined aquifers within a generally impermeable, heterogeneous sequence dominated by low-porosity sandstones. Coal seam recharge occurs via localised recharge (i.e., beneath creeks), diffuse recharge and downward seepage or through-flow from shallow, unconfined aquifers in the outcrop and subcrop areas. At regional scale, groundwater flow is typically towards the east and south [21]. In the study area, local groundwater flow pathways are not fully understood, although limited water communication is thought to occur across the faulted hinge zone [3].
2.1. Gas Domains and Production Behaviour of the Study Field
Previous work on the study field identified variability in coal seam gas saturation domains and in gas well production performance [3,22]. Gas saturation domains tend to follow gentle folding patterns, but are stratigraphically variable across the coal measures. Production performance broadly follows a “hinge model” where good gas production occurs in areas of higher gas saturation and gas contents, good permeability and thick, unsplit coal on the flank of the faulted anticline, north of the hinge zone. At regional scale, areas of higher gas production appear to occur between the normal fault swarms. Reasons behind these natural and exploited gas behaviours are not fully understood and, therefore, not predictable. In the study area, good permeability arises from connected and open (unmineralised) cleat systems, either in shallow areas or where the main joints and face cleats are locally aligned parallel to horizontal stress (i.e., parts of the north). Cleat spacing and orientation can swing relative to tectonic folding, faulting and compactional draping over sandstone bodies [3].
Production Classes Assigned to Geochemical Study Samples
Gas and water production values in this paper are referred to as high, moderate and low, based on average daily production over the first 4 four years of the life of the well. For water production, high is over 40 m3/day, low is under 20 m3/day and moderate is between 20 m3/day and 40 m3/day. Wells with high (“good”) average daily gas production produce 1000 m3/hr and are all located north of the hinge zone. Low gas production is under 500 m3/hr and moderate is between 500 m3/hr and 1000 m3/hr.
2.2. Previous Geochemical Investigations
Kinnon et al., [3] presented the first published investigation of geochemistry relative to reservoir geology and production behaviour in the area. That early work suggested that coal bed waters in the study field are predominantly meteoric with a possible connate influence at depth, and that the δ13C-CH4 values of co-produced gases reflect a mixing trend between shallow microbial gas and deeper thermogenic gas. Good gas saturation was interpreted to arise from microbial gas formed from microbial communities resident in the coal formation water and stimulated by some degree of meteoric recharge over geologic time. Correlations were identified between water quality, stable isotope data, production behaviour and structure, but the dominant hydrochemical processes and δ13C isotope systematics require further clarification.
In that study, a total of N = 9 upper (P) seam wells and N = 15 lower (GM) seam wells were sampled north and south of the hinge zone, with the majority producing from <300 m. However, additional data are needed to elucidate the geochemical and microbial interactions and the interrelationships with reservoir geology in each of the 4 four domains (P and GM seam, north versus south of the hinge zone).
2.3. This Study
The main aim of our study was to increase the spatial coverage of the data, particularly south of the hinge zone and from greater depths (down to 474.5 m), to allow for more detailed spatial analysis of gas and water isotopes and to make statistical comparisons with updated reservoir and production datasets for both seams. Existing [3] and new (N = 5 P wells; N = 8 GM wells) hydrochemical and stable isotope data are analyzed against reservoir properties, structure and production data to test the overarching hypothesis that microbial gas generation is responsible for zones of higher gas saturation and production.
3. Sampling and Methods
This study draws on a geochemistry database that includes 36 analyses of co-produced water chemistry and 27 gas analyses collected over two sampling trips in 2008 and 2016 (Table 1 and Table 2). Well data from 2008 were first presented in Kinnon et al., [3] and sampling details can be found in that paper.

Table 1.
Gas-stable isotope and δ13CDIC data (N = 28).

Table 2.
Raw water quality and water-stable isotope data.
The most recent coupled water and gas samples were collected from 13 previously unstudied wells in March 2016 (Figure 1). Twelve water samples were collected for water quality and stable isotope analysis, 8 from the GM seam and 4 from the P seam. P seam well P040V was sampled for gas but produced no water after 20 min of pumping. The wells were also sampled for gas stable isotope analysis but shallow well P037V had insufficient gas for analysis. Gas samples were collected using either flow-through gas canisters or FlexFoil© bags. Water samples and onsite readings were taken only after pH and conductivity measurements had stabilised. Once pH, conductivity and temperature were measured, a suite of water samples was collected and treated onsite as appropriate for the analysis required, i.e., some samples were filtered, acidified and chilled as per standard analytical protocols. Gas- and water-stable isotopic analysis was conducted at the University of Queensland (UQ) School of Earth and Environmental Sciences Stable Isotope Geochemistry Laboratory (UQ-SIGL) while standard water analyses were performed at ALS Laboratory Group, Environmental Division Brisbane (Stafford, QLD, Australia). Analytical procedures for the 2016 UQ samples are outlined below.
3.1. Standard Water Chemistry
The anions fluoride (F−), sulfate (SO42−) and chloride (Cl−) were determined by discrete analyser with detection limits for F− being 0.1 mg/L, and SO42− and Cl− being 1 mg/L. Alkalinity was determined by PC titrator and has detection limits of 1 mg/L. Dissolved major cations were determined by inductively coupled plasma optical emission spectrometry (ICP-OES) with Na+, Ca2+, Mg2+ and K+ having detection limits of 1 mg/L. All water chemistry analyses were carried out by ALS-Chemex Laboratory Group, Environmental Division Brisbane (Stafford, QLD, Australia).
3.2. Isotopic Analyses
Hydrogen, oxygen and carbon stable isotopic analyses were conducted using gas source isotope ratio mass spectrometry in the UQ-SIGL.
3.2.1. Water Oxygen and Hydrogen Isotopes
Water samples for oxygen and hydrogen isotope ratio determinations were filtered through 0.45 µm filters into 30 ml glass McCartney bottles and immediately chilled. Samples were analysed using an Isoprime dual inlet isotope ratio mass spectrometer (DI-IRMS) coupled to a multiprep bench for online analysis. δ2H values were analysed after online equilibration at 40 °C with Hokko coils. δ18O values were analyzed as above, but after equilibration with carbon dioxide. δ2H and δ18O values (reported in per mil (‰)) were normalised to the standard mean ocean water (VSMOW-SLAP) scale, following a three point normalisation [23] based on four replicate analyses of three laboratory standards per analytical cycle. All laboratory standards were calibrated against IAEA (VSMOW, SLAP, GISP) and USGS (USGS45, USGS46) international water standards, such that the δ2H and δ18O values of SLAP are −427.5‰ and −55.5‰, respectively [24]. Accuracy and precision were better than ± 2‰ for δ2H and ± 0.1‰ for δ18O at 1σ. Both isotopic compositions were measured as deviations relative to VSMOW.
3.2.2. Gas Hydrogen and Carbon Isotopes
All gas samples were analysed using an Isoprime/Agilent gas chromatograph-combustion-isotope ratio mass spectrometer (GC-c-IRMS). For δ13C determination of CH4, all samples were analysed using a 20:1 split. The gas chromatograph (GC) (with a 50 m × 320 μm × 5 μm CP-PoraBOND Q column) was set to a flow of 1.2 ml/min with an oven temperature of 40 °C. After the sample eluted from the GC, it was passed through a quartz furnace packed with copper oxide set to 990 °C, which oxidised the CH4 to CO2 for measurement in the IRMS. Any CO2 in the sample passed through unaffected. For δ2H determination of CH4, each sample was analysed utilising the same GC conditions as for δ13C determination but after eluting from the GC, samples were then pyrolysed by passing through a ceramic furnace set at 1410 °C.
The δ13C and δ2H values (reported in per mil (‰)) were normalised to the Vienna Pee Dee Belemnite (VPDB) and VSMOW scales, respectively, following a two point normalisation for δ13C and a single point normalisation for δ2H [23]. δ13C normalisation was based on a minimum of two replicate analyses of two laboratory gas standards (SIGL1 (50% CH4:50% CO2; δ13C-CH4 −40.1‰; δ13C-CO2 −18.8‰) and SIGL2 (100% CH4; δ13C −40.4‰)) within each analytical cycle. International standard T-ISO2 (2 % methane in air; δ13C −38.3‰) was analysed as an unknown against the laboratory gas standards. δ2H normalisation was based on a minimum of two replicate analyses of SIGL1 (δ2H –167.5‰), with SIGL2 (δ2H –154.0‰) being treated as an unknown. Additionally, laboratory standards were calibrated against three international Oztech standards (3× 100 % H; δ2H −125, −228, −365‰).
Isotopic analysis of samples with known CO2 molecular compositions indicates that δ13C-CO2 data are unreliable below CO2 concentrations of 0.2 mol% for current instrument settings. In the study area, the CSG is typically >98% methane with minor CO2 (<2%) and ethane [3], precluding δ13C-CO2 analysis of one of our samples (M189GMV). In this context, laboratory gas standards SIGL1 and SIGL2 were considered a better matrix match for the study samples than T-ISO2. The δ13C and δ2H values of SIGL1 and SIGL2 had initially been determined by two independent laboratories (Geoscience Australia, Canberra, Australia; Intertek-Geotech Laboratories, Perth, Australia), by calibration against international standards NGS1, 2 and 3 and NBS-19. Thus, all laboratory gas standards were calibrated against international standards defining the VPDB and VSMOW scales [24]. Precision is quoted at ±0.3‰ for δ13C and ±3‰ for δ2H at 1σ.
3.2.3. Dissolved Inorganic Carbon (δ13CDIC)
Dissolved inorganic carbon (δ13CDIC) was determined by collecting filtered water samples in serum bottles without headspace. Samples were immediately chilled after filtration and kept chilled until analysis. δ13C was determined online using a Thermo Scientific GasBench via the standard method. δ13CDIC values were normalised to the VPDB scale using IAEA standards NBS-18 and NBS-19. Analytical uncertainty was determined as ±0.1‰ at 1σ.
4. Results
4.1. Gas Isotopes
Production gas samples were analysed for compound specific stable isotopes (Table 1). Figure 4 is a gas genetic diagram of the study samples plotted by seam and position north or south of the hinge zone. Across all 2016 samples, the carbon isotope compositions for P and GM seam methane range from δ13C −57.4‰ to −46.3‰ and average −53.3‰ (n = 12). The corresponding hydrogen isotope compositions for methane range from δ2H −220‰ to −207‰ and average −216.1‰. These ranges are typical of methane sourced from Queensland CSG fields [2,14] and overlap previously reported values for the study field that were analysed at Geoscience Australia [3]. Methane stable isotope values plot within the mixed thermogenic/microbial CO2 reduction and solely microbial genetic fields on a plot of δ13C versus δ2H, and mainly within the secondary microbial field on a plot of δ13C-CO2 versus δ13C-CH4 (Figure 4a,b). The addition of new geochemical data has revealed strong depth trends and deep compartmentalisation along strike. Figure 5a shows that the carbon isotopic compositions of produced methane from this study increase with increasing depth for both seams. This agrees with the findings of Kinnon et al., [3] and supports a mixing trend hypothesis with δ13C-CH4 increasing from more negative secondary biogenic (microbial CO2 reduction) values to less negative thermogenic values at depth. New data also confirm that the most depleted (“biogenic”) δ13C-CH4 values for both seams occur in the SW part of the study area. Contrary to expectation, δ13C-CH4 values in the P seam are generally less negative, rather than more negative for a given depth. Across all datasets, the only significant δ13C-CH4 outlier is shallow well P011 (Figure 5a).
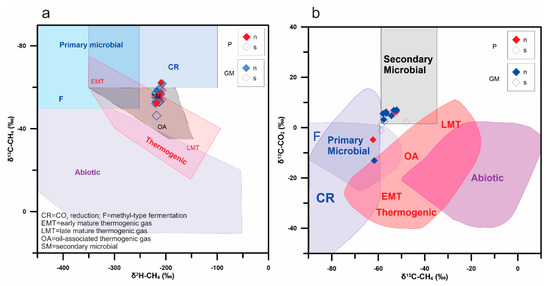
Figure 4.
(a) δ13C versus δ2H plot of CH4 stable isotope compositions for the production gas samples from the study field, plotted by seam and position north or south of the hinge zone (N = 26). (b) δ13C-CO2 versus δ13C-CH4 for the same samples. See Figure 1 for well locations. Fields on plots from Milkov and Etiope [26]. Data are from Kinnon et al., [3]; this study.
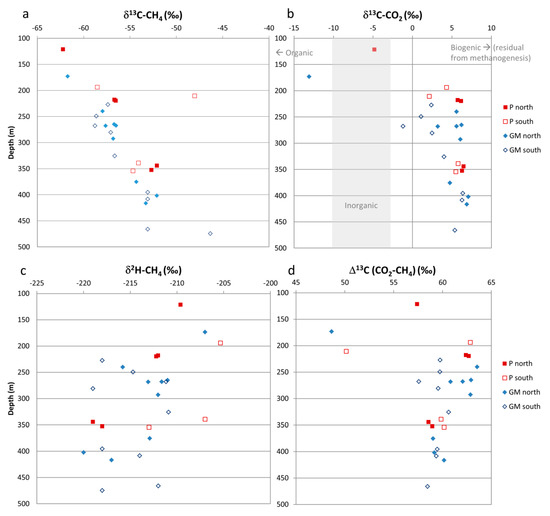
Figure 5.
(a) δ13C-CH4, (b) δ13C-CO2, (c) δ2H-CH4, and (d) Δ13C(CO2-CH4) versus depth, plotted by seam and position north or south of the hinge zone. Data from Kinnon et al., [3]; this study.
Hydrogenotrophic methanogenesis is associated with 13C-enriched residual CO2 and DIC compositions, whereas thermogenic CO2 derived from organic-rich shale or coal is characteristically depleted in 13C. δ13C-CO2 values from the 2016 study range from 2.4‰ to 7.1‰ (n = 11), and from δ13C –13.1‰ to 7.1‰ (n = 26) for the greater dataset. Figure 5b suggests that the majority of CO2 is residual from microbial CO2 reduction, with minor input from inorganic and/or organic sources. At a given depth, P and GM wells north of the hinge zone have more positive δ13C-CO2 values than wells south of the hinge zone. A similar, more tentative trend was also observed for P seam δ13C-CH4 and δ2H-CH4 values (Figure 5a,c). Overall, δ13C-CO2 tracks δ13C-CH4, but not δ2H-CH4, which instead shows a broad inverse trend with depth.
Carbon isotopic difference [Δ13C(CO2-CH4)] values range from 48.6‰ to 63.5‰ (n = 26) with considerable overlap between the P and GM seams (Figure 5d). The [Δ13C(CO2-CH4)] range in this study falls on the acetate fermentation—CO2 reduction boundary as commonly defined (i.e., carbon isotopic difference between CO2 and CH4 (α ≥ 1.06 = CO2 reduction [25])). The Δ13C(CO2–CH4) values are variable above 200 m but are restricted to a comparatively narrower range at depth. From 200–300 m, GM north wells have higher Δ13C(CO2–CH4) values than GM south wells. This distribution suggests influence from a range of surficial CO2 sources at shallow levels and potentially, dominance of hydrogenotrophic methanogenesis at mid and deeper levels. δ13C gas isotope data are plotted by gas production class in Figure 6. There is considerable overlap between the well classes in a plot of δ13C-CH4 versus depth (Figure 6a), although most good wells plot in the biogenic gas field and lie north of the hinge zone, whereas poor wells mainly plot in the mixed field and lie south of the hinge zone (Figure 6b).
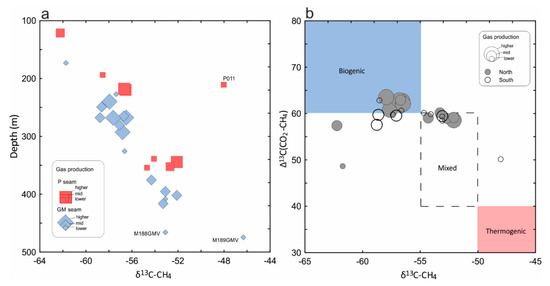
Figure 6.
(a) δ13C-CH4 versus depth plot for the upper and lower seams, coded by gas production. Marker sizes denote average gas production as lower, mid or higher. Data from Kinnon et al. [3]; this study. (b) All Δ13C(CO2-CH4) versus δ13C-CH4 data coded by gas production and position north or south of the hinge zone. Fields on plot based on Smith and Pallasser [18] and Whiticar et al. [25,30].
4.2. Water Isotopes
A total of 12 new co-produced water samples from 12 wells were analysed for δ2H-H2O and δ18O-H2O (Table 2). Despite being sampled eight years later, the 2016 values span a similar range to the Kinnon et al., [3] dataset that was also analysed at UQ SIGL (Table 2). Across all samples, δ18O values range from δ18O −8.3‰ to −5.0‰ and δ2H −49‰ to −30‰ (n = 36). The majority of wells plot on or to the left of the Global Meteoric Water Line (GMWL), which is typical of shallow meteoric-sourced waters or formation waters that have undergone low temperature water–rock–microbial reactions or mixing with connate waters, e.g., [1,2,3,27] (Figure 7). Of the 11 samples plotting to the right of the GMWL (6 P, 5 GM), 8 are shallow wells south of the hinge zone, and 3 are shallow wells north of the hinge zone. All but one of the high water producing wells plots in this less negative field (Figure 7a). Many processes can shift meteoric water compositions to the right of the GMWL but the shallow depths of the samples are more consistent with evaporation effects during recharge than high-temperature fluid-rock interaction or mixing with basinal brines, e.g., [2,28,29]. A plot of δ2H-H2O versus δ18O-H2O coded by gas production shows considerable overlap between wells with different production behaviour; however, the majority of higher gas producing wells plot well above the GMWL, suggesting that these samples have been more heavily impacted by low temperature water–rock–microbial reactions (Figure 7b).
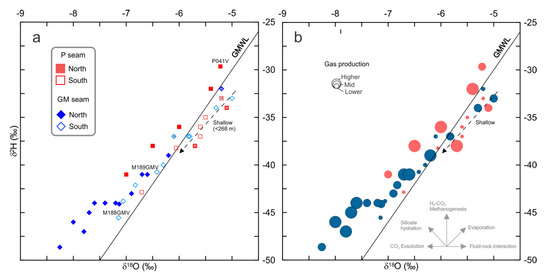
Figure 7.
Plot of δ18O versus δ2H for coal bed water samples. (a) Grouped by seam and position north or south of the hinge zone. H: High water production. (b) Grouped by seam and gas production class. Inset schematic shows likely shifts associated with different geochemical processes. Global Meteoric Water Line (GMWL) from Craig [31]. Labelled wells are referred to in the text.
Overall, the water-stable isotope compositions of P and GM seam coal bed waters show systematic depletion trends with increasing depth. This depletion trend is typical of shallow to mid-depth meteoric-sourced groundwaters in general, as older waters will have more have more negative 2H and 18O values reflecting the stable isotopic composition of precipitation during past cooler climates. The shift in 2H and 18O values between the P and GM seam datasets parallels the GMWL, which is likely more indicative of the climatic conditions during meteoric recharge as opposed to subsurface microbial or fluid-rock interaction processes and suggests that there is no or limited intermixing of the waters. On the other hand, southern GM samples are significantly offset along the GMWL but were taken from comparable depths to the northern GM samples; locally, southern GM samples M188GMV and M189GMV are also offset along the GMWL despite being from similar depths. This is further illustrated in Figure 8, where cross-plots of δ18O and δ2H versus depth are plotted by seam and location. δ18O and δ2H show negative correlations with depth for both seams. Two wells are offset from the main trends: P041V (north) and M189GMV (south), which is the deepest well sampled in this study and exhibits poor production behaviour for its depth. At a given depth, GM wells north of the hinge zone appear to have more negative water isotopes values than wells south of the hinge zone. Less negative δ2H-H2O and δ18O-H2O values are commonly, but not always, associated with higher water production and lower gas production. For example, δ2H-H2O and δ18O-H2O values for 2016 well P041V near the hinge zone are anomalously high for depth, and this well has low water production and medium gas production (Figure 7a and Figure 8a).
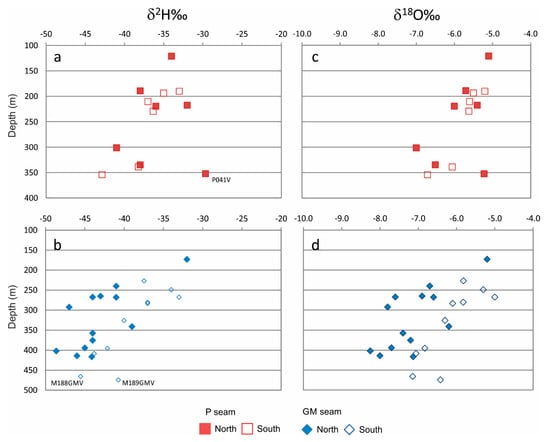
Figure 8.
δ2H (a,b) and δ18O (c,d) versus depth for the study samples plotted by seam and position north or south of the hinge zone. Data from Kinnon et al., [3]; this study.
Dissolved inorganic carbon (DIC) δ13C values in the study area vary between δ13C +4.5‰ and +15.5‰ (n = 12) (Table 1). Within seam variation is greater than the difference between the P and GM seams, and both seams show a positive correlation with depth (r = 0.7, 0.85, respectively, excluding one outlier) (Figure 9). In general, strongly negative δ13CDIC values (δ13CDIC: −30‰) in coal bed waters indicate thermogenic influences, whereas positive δ13CDIC values together with high alkalinity are typical of methanogenic waters [32,33]. In high-alkalinity waters, more negative δ13CDIC values can also reflect bacterial sulfate reduction [34]. The study samples have enriched, positive δ13CDIC values characteristic of hydrogenotrophic methanogenesis, except for GM041V (north) that has a low positive δ13CDIC value of +4.5‰ and was sampled close to the hinge zone. This well has sulfate <1 mg/L, a high alkalinity value (3719 mg/L, as HCO3-), and a positive δ13C-CO2 value (+6.9‰), suggesting neither bacterial sulfate reduction nor thermogenic influences are likely in the GM seam at that location.
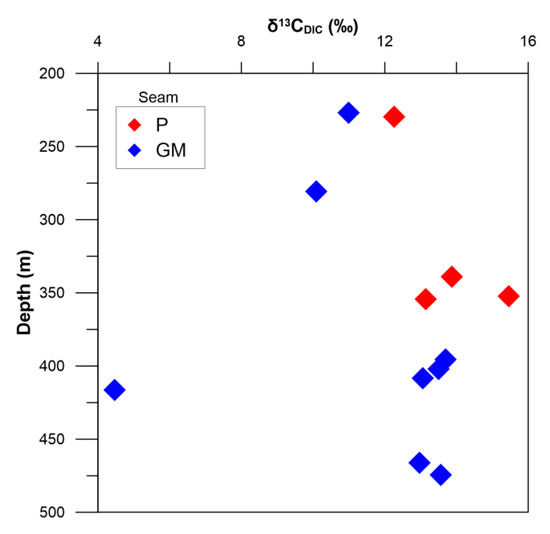
Figure 9.
δ13CDIC versus depth for the 2016 study samples, plotted by seam.
4.3. Water Chemistry
Water chemistry data for the produced waters are shown in Table 2 and Durov plots of water quality by seam, geographic position and production behaviour are shown in Figure 10. At a high level, the similarity in water types between samples from both seams suggests that similar geochemical processes are controlling their major ion chemistry. The groundwater chemistry of the study area is dominated by two major ion hydrochemical facies: a sodium–chloride (Na–Cl) facies at shallower depths and a sodium-bicarbonate (Na–HCO3) facies at depths >~350 m. All samples are low-brackish, i.e., <20,000, >1500 mg/L total dissolved solids (TDS). Wells with lower gas production define a curve from more acidic, less sodic, Na–Cl type at shallower depths to more alkaline Na–Cl type waters with depth. Wells with mid and higher gas production (the latter being northern wells) can be Na–Cl or Na–HCO3 type but tend to have high pH values and TDS concentrations for their depth.
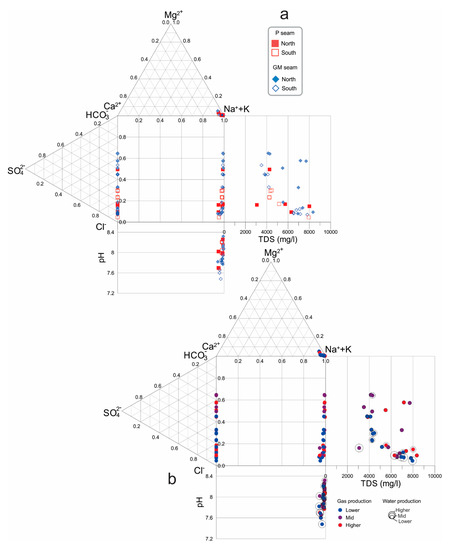
Figure 10.
Durov hydrochemistry plots. (a) Study data plotted by seam and position north or south of the hinge zone. (b) The same dataset coded by average gas production. Open circle marker sizes on the pH and total dissolved solids (TDS) plots denote average water production. Lower water production circles are the same size as the gas symbols. Data from Kinnon et al., [3]; this study.
Na concentrations range from 1070 to 3060 mg/L. For both seams, Na concentrations are very high (P median: 1490; GM median: 2200 mg/L), and are significantly higher in the north. Figure 11a is a cross-plot of depth versus sodicity (SAR = ([Na+]/(([Ca2+] + [Mg2+])/2)0.5) coded by seam and position relative to the hinge zone. Overall, sodicity increases with depth, suggesting a gradual mixing of less sodic meteoric waters proximal to recharge zones with saline connate waters (formational brines). However, this trend may also indicate downdip fluid communication and progressive evolution via low temperature fluid-rock and microbial reactions. Southern wells fall within a narrow range of 60–100, whereas northern wells span a wider range with 75% of all data values and higher gas-producing wells (189–414 m depth) plotting above 80. Four GM south wells plot off the main trend and show a slight decline in sodicity with depth, suggesting a lack of hydraulic continuity between waters from these wells and the rest of the field. Interestingly, the two deep outliers are newer, poor and medium-performing wells, and the deepest outlier has an anomalous δ2H-H2O value (high for depth) and a more enriched δ13C-CH4 value (high for depth) (see Figure 7a and Figure 8b).
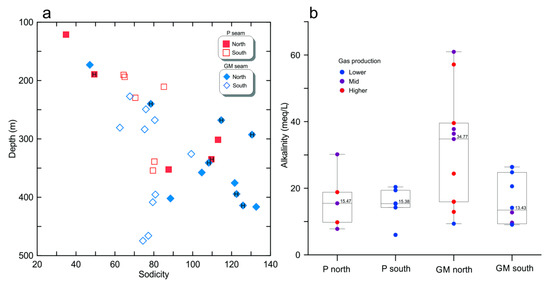
Figure 11.
(a) Sodicity versus depth. H = Higher gas production. (b) Alkalinity statistics by seam and position north or south of the hinge zone. Overlay: Alkalinity values coded by gas production. Data from Kinnon et al., [3]; this study.
The median alkalinity of southern GM wells (13.43 meq/L) is less than one-half that (34.77 meq/L) of the northern wells. In contrast, the alkalinity of the P seam is statistically similar on both sides of the hinge zone. Alkalinity does not correlate with gas production on an individual well basis (Figure 11b). GM seam calcium concentrations range from 9-92 mg/L, while P seam calcium concentrations span a similar range from 12–109 mg/L. Magnesium ranges from 2–72 mg/L and 3–48 mg/L in the GM and P seams, respectively. In the north, both seams exhibit lower mean Ca/Mg molar ratios typical of methanogenic waters (GM: 1.3, P: 1.4; cf. <1.5) [35]. Fluoride is present in all water samples, ranging from 1 to 4 mg/L. Fluoride concentrations are statistically similar on both sides of the hinge zone. The majority of sulfate concentrations are below detection limit (<1 mg/L). Four northern GM wells have low sulfate concentrations from 1 to 3 mg/L. In these wells, sulfate concentration shows no relationship with depth, gas or water production behaviour.
Chloride (GM: 702–4440 mg/L; P: 1090–4530 mg/L) shows a broad decrease with depth for both seams and is inversely correlated with fluoride and total alkalinity (as HCO3−), suggesting that fluoride is sourced from fluid-rock interactions. The majority of wells have a Na-excess, suggesting an additional Na source from silicate weathering and/or ion exchange reactions. Na/Cl molar ratios are highest (>1.6) at deeper levels, in 7 wells to the north and 3 to the south of the hinge zone, respectively (9 GM, 1 P). Northern GM waters have the lowest mean Cl concentration of any reservoir domain (2174 mg/L). Overall, the study samples reflect the same downdip major ion trends observed in other CSG basins characterised by Ca + Mg depletion and Na and HCO3− enrichment, e.g., [2,7,36].
5. Discussion
5.1. Carbon Isotope System
5.1.1. Isotopic Evidence for Thermogenic Gas Charge
At a high level, δ13C and δ2H data support a gas mixing trend hypothesis with δ13C-CH4 increasing from more negative, secondary biogenic (microbial CO2 reduction) values at shallow levels to less negative, “thermogenic” values at depth (δ13C −62.2‰ to −46.3‰), based on the earlier gas genetic classification fields of Whiticar et al., [25] and Whiticar [37], and the recently revised fields of Milkov and Etiope [26]. Coal rank (Rv > 1.1) and gas molecular composition data support the idea that the gas isotope compositions at least partly reflect cracking of coal bitumen and higher hydrocarbons and/or early thermogenic gas generation. Ethane is variably present, albeit at very low levels (<0.01%) in both seams at a range of depths north and south of the hinge zone; over the depth range investigated (100–500 m), production gas samples have dryness (C1/C1+) values approaching 1 ([2,3], Mazumder, unpubl. data, see acknowledgements). Hydrodynamics can facilitate migration of biogenic and thermogenic gas to permeability barriers that locally increases gas contents, e.g. [11]. However, the possibility that higher gas content/gas production domains in the north of the study area reflect pooling of thermogenic gases seems unlikely, based on: (1) uniform δ13C-CH4 versus depth trends and positive δ13CDIC values for both seams on both sides of the hinge zone; (2) more positive δ13C-CO2 values for both seams north of the hinge zone; and (3) the generally high alkalinity values, particularly north of the hinge zone that is somewhat uncharacteristic of thermogenic plays [35]. A more likely explanation is that geographic variations in gas content/saturation and production largely reflect the extent of secondary microbial gas generation, retention and lateral migration, and as such are largely a function of hydrodynamics. This is discussed below.
5.1.2. Isotopic Evidence for Extent of Methanogenesis
Our 2016 samples show a strong positive relationship between δ13CDIC and alkalinity that is characteristic of evolution via microbial activity [2,32,38]. Excluding one significant outlier (well GM041V near the hinge zone), deeper northern waters appear to be more microbially evolved than waters at similar depths in the south, with shallow southern samples representing the other end-member (Figure 12). Although δ13CDIC data are limited, this relationship suggests that domains of differing gas production (i.e., north versus south of the hinge zone) have different δ13CDIC/alkalinity signatures. The four GM wells in the “Deeper, S” field plot off the main sodicity trend for the study area (Figure 11a and Figure 12). In this well cluster, sodicity decreases rather than increases with depth, and coal permeability [39] and water production are low. As mentioned previously, one of these wells has an anomalous δ2H-H2O value (high for depth) and a more enriched δ13C-CH4 value. At this site, the two study seams may be in hydraulic communication via faults or fractures. The other wells in the cluster do not display anomalous isotope signatures. This suggests that relatively limited methanogenesis, as opposed to other possibilities such as more open hydrologic flow conditions and/or meteoric dilution may be responsible for the δ13CDIC/alkalinity signature of the GM seam in this deeper part of the field. The lower positive δ13CDIC outlier value near the faulted hinge zone (δ13C +4.5‰) may reflect a stronger relative influence of acetoclastic methanogenesis at that location [40], but could also reflect carbonate dissolution in a partially open system.
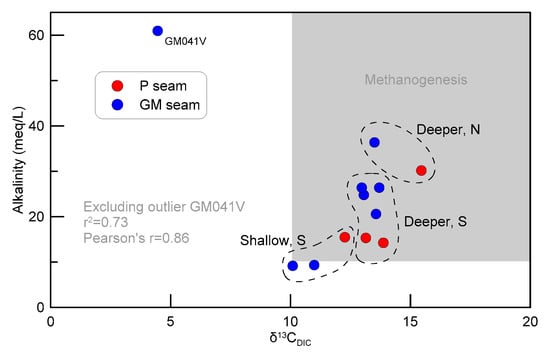
Figure 12.
Alkalinity versus δ13CDIC for the P and GM seams, north and south of the hinge zone. All higher gas producing wells in the study field are located to the north of the hinge zone.
There is consensus that relative 13C-enrichment of methane can result from: (1) microbial oxidation [41]; (2) a shift toward the acetate fermentation pathway of methanogenesis [25]; (3) CO2 system limitations [16,30]; and (4) water stagnation [35,42,43], but disagreement on the relative influence of these processes at the basin-scale in major unconventional gas plays. A key divergence is the interpretation that thermogenic-like methane δ13C values in deeper parts of the prolific Powder River Basin, USA reflect a change in methanogenic pathway and/or mixing with transitional thermogenic gas [44,45], as opposed to the extent of methanogenesis [35,42]. In a given coal seam, multiple metabolic pathways may operate concurrently [44,46,47] or successively [44]. Traditional isotope approaches [Δ13C(CO2−CH4) and Δ2H(H2O−CH4)] are useful to determine the dominant metabolic pathway but controversy surrounds their strict application, particularly when used to calculate contributions from different metabolic pathways operating at the same location [8,42,43,44].
Methane oxidation is unlikely to be responsible for the 13C versus depth trends observed in this study as this would enrich the residual methane pool in both 13C and 2H and be more likely to deplete than enrich the residual CO2 pool in 13C. A systematic shift towards acetoclastic methanogenesis with increasing depth also appears unlikely based on available data. The decrease in δ2H-CH4 with increasing depth occurs over a narrow range, and southern GM seam δ2H-CH4 values exhibit no correlation with depth and overlap the northern GM dataset, despite having similar 13C versus depth profiles. Furthermore, our lowest δ2H-CH4 values are enriched by ~60‰ compared to the upper threshold of the empirically-based acetate fermentation field of Whiticar et al., [25] (δ2H −280), and co-produced δ2H-H2O versus δ2H-CH4 values for both seams plot on or slightly below the CO2 reduction fractionation line (alpha = 1.20) (Figure 13a). The majority of results below the line (with slightly higher alpha values) are from shallow depths or close to major structures, i.e., areas with greater potential for overhead recharge via preferential pathway flow along faults and fractures, and therefore more likely indicate secondary effects such as sulfate reduction or methane oxidation.
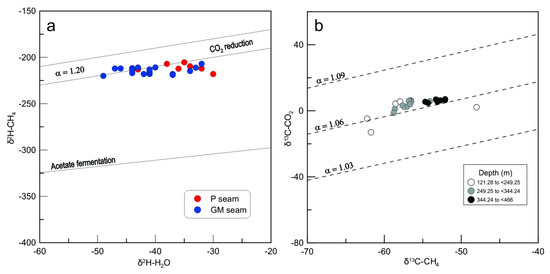
Figure 13.
(a) δ2H-H2O versus δ2H-CH4 plot of all data, coded by seam. Co-produced δ2H-H2O versus δ2H-CH4 values for both seams plot on or slightly below the CO2 reduction fractionation line (alpha = 1.20) [30,48]. (b) δ13C-CH4 versus δ13C-CO2 plot of all data ([3]; this study), coded by depth below ground level. Shallower samples display a range of fractionations on the acetate fermentation–CO2 reduction boundary whereas mid-level and deeper samples follow fractionation lines for CO2 reduction [30,43,48]. The samples with the highest δ13C-CO2 values are located in the north.
Figure 13b is a plot of δ13C-CH4 versus δ13C-CO2 plot of all data ([3]; this study), coded by depth below ground level. Shallower samples display a range of fractionations on the acetate fermentation–CO2 reduction boundary, whereas mid-level and deeper samples primarily follow fractionation lines for CO2 reduction [30,43,48]. Although acetoclastic methanogenesis does not appear to be the dominant process, two of our shallower samples have lower alpha values (<1.06) conventionally associated with acetate fermentation. Groundwater sulfate concentrations for these two wells are 3 mg/L for the lower δ13C-CH4 value and <1 mg/L for the higher value (δ13C −61.7‰ and −48.0‰, respectively). Rather than acetate fermentation, the former (GM002—shallow, hinge zone) may indicate active sulfate reduction and the latter (PO11—shallow) methane oxidation due to enhanced surface communication [2,35]. Shallower, more negative δ13C-CH4 values on the fractionation line may partially reflect water stripping of 13CH4 but the wide range of δ13C-CH4 values suggests this process is not a primary influence on methane δ13C values in the study area [3,49].
Although there is evidence of minor thermogenic input, the overall progression of carbon isotopes along the fractionation line suggests progressive depletion of the CO2 reservoir for both seams on both sides of the hinge zone. Parallelism between δ13C-CO2 and δ13C-CH4 versus depth, coupled with more enriched δ13C values north of the hinge zone are consistent with this hypothesis when interpreted in terms of 13C pool depletion effects [16,17,30]. In the study area, CO2 concentrations are low (<2%) and show a slight, erratic increase with depth [50]. This hinders the possibility that 13C pool depletion effects are associated with lower CO2 concentrations. More likely explanations for a pool depletion isotope shift include increased rates of methanogenesis, decreased flushing of CO2, or both. In a study of Pennsylvanian coals and the New Albany Shale, Illinois Basin, Schlegel et al., [35] attributed progressive depletion of the carbon reservoir to longer groundwater residence times and decreased groundwater flushing rates with increasing reservoir depth. In our study field, this mechanism potentially explains both the depth and geographic trends in carbon stable isotopes and supports the previous interpretation that the faulted hinge zone acts as a barrier to water and gas flow along strike [3,22].
5.2. Hydrogen Isotope System
The overall covariance of the δ2H-H2O versus δ2H-CH4 values in Figure 13a provides further evidence that the methane generated in situ with the formation waters. The calculated hydrogen isotopic difference values between study field waters and methane samples [Δ2H(H2O−CH4)] range from 165‰ to 188‰ (αH2O–CH4 = 1.21–1.24). Geographically, southern αH2O–CH4 values are higher for the GM seam but lower for the P seam, although the latter pattern may be a product of the number of samples. In the GM seam, these higher southern αH2O–CH4 values are largely the product of more enriched δ2H-H2O values. Southern GM seam δ2H-CH4 values show no trend with depth and overlap the northern GM dataset (Figure 5c). Systematic depth trends in the stable isotopic and elemental hydrochemistry of southern GM waters suggest that overprinting by preferential pathway flow, or cross-measures groundwater communication are unlikely to be major causes of this scatter. One possibility is that it reflects lateral reservoir heterogeneity within the GM seam itself. By contrast, northern P seam δ2H-CH4 values are significantly more enriched than the south, which may reflect a greater extent of methanogenesis and potentially, the age of groundwaters.
5.3. Hydrogeochemical Indicators of Microbial Methanogenesis
Considering all information from stable isotopes, the most likely explanation is that the majority of methane generated in situ via microbial CO2 reduction. Diagnostic hydrochemical parameters (high alkalinity, low Cl, Ca, Mg and sulfate concentrations) indicate that microbial methanogenesis is supported in both seams north and south of the hinge zone but that geochemical conditions are generally more favourable in the north, particularly in the GM seam that has very high alkalinity, suppressed Cl concentrations and the lowest Ca/Mg ratios in the study field. South of the hinge zone, weaker depth trends and significant differences in water chemistry suggest contrasting groundwater recharge conditions, flow and hydrochemical evolution. A positive correlation between δ18O-H2O and Cl for both seams and generally higher TDS and cation and anion contents in the deeper, GM seam suggest a possible connate influence at greater depths; however, multi-isotope evidence indicates that coal bed waters from the production zone (100–500 m depth) for both seams are likely to be primarily meteoric in origin and evolved via a combination of low temperature fluid-rock interaction processes and microbial activity. Interestingly, this study found that higher gas production correlates with higher TDS. In the GM seam, higher TDS correlates neither with an increase in the ash content of the coal, which is highest in the central and southern parts of the field [3,39], nor with the presence of a thick roof mudstone in the north (Figure 2b). Less is known on lateral variability in P seam coal character, but the observation that P seam production performance generally follows that of the GM seam [39] suggests that spatial variation in ash content is not a dominant control on coal-bed water chemistry. A more plausible interpretation is that wells with higher gas production have higher TDS due to increased fluid-rock interaction and microbial activity, which supports trends in the stable isotope data that postulate longer groundwater residence times and pooling in the north.
The highest alkalinity values accompany the most negative water isotopes and most positive gas isotopes in the area of highest gas contents, saturation and production, north of the hinge zone. Contrasting gas and water isotopes, sodicity and δ13CDIC/alkalinity signatures for deeper wells south of the hinge zone reflect a cutout in permeability and a lower extent of methanogenesis. High gas production occurs at shallow to intermediate levels, which is probably due to low overburden pressure while deeper, the seams display low production (and anomalous geochemical signatures) controlled by a decrease in permeability. Similar trends have also been observed in the Sydney Basin [9,51,52]. Overall, our new results support the hypothesis that the faulted hinge zone acts as a barrier to fluid communication along strike (NW to SE) [3] and suggest that comparatively restricted fluid flow from the north deprived the southern section of laterally migrated gas and meteoric ingress with necessary waters and methanogens for secondary CSG generation, reducing gas contents and saturation (Figure 14).
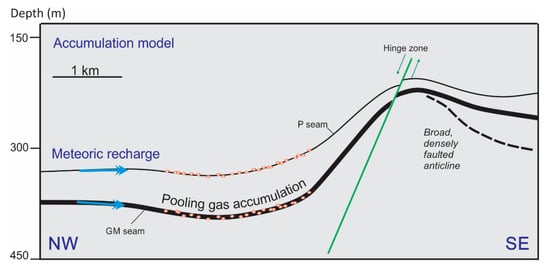
Figure 14.
Schematic diagram illustrating possible pooling gas accumulation model for the study field.
5.4. Value of Expanded Hydrochemical (Major Ions) and Stable Isotope Datasets for Understanding Gas Domains and Production Behaviour
An intrinsic focus of this study was to address the value of expanded hydrochemical (major ions) and stable isotope datasets for understanding gas domains and production behaviour in the study field. For a given depth, differing production behaviour north and south, and among closely spaced wells, can be correlated with several different geochemical and isotopic signatures (notably, CH4 and CO2 isotopes, sodicity, alkalinity, TDS, Ca/Mg ratios and O and H water isotopes). With the addition of new data, previously proposed correlations between Δ13C(CO2–CH4) and gas production, and δ2H-H2O and δ18O-H2O values and water production [3] were not observed on an individual well basis; however, all three tracers provided insights into variable gas production behaviour.
Combination of new δ13CDIC data with alkalinity data revealed a novel relationship with production, requiring further analysis. Further detailed studies on the isotopic chemistry of the coal bed waters (particularly δ13CDIC, but also 87Sr/86Sr, 36Cl, 14C, δ34S) are needed to assist hypothesis testing for one or more phases of microbial gas generation and gain a better understanding of in situ microbial processes, fluid-rock interaction processes, finite reservoir effects, and groundwater flowlines and residence times.
6. Conclusions
This study used hydrochemical (major ions) and multi-isotope analysis (δ13C, δ2H, δ18O) to investigate geological controls on coal seam gas saturation domains and gas-well production performance in a small, high-rank (Rv > 1.1) CSG field in the northwestern Bowen Basin, Australia. Previous work on the study field suggested that: (1) coal-bed waters are predominantly meteoric with a possible connate influence at depth; (2) the δ13C-CH4 values of co-produced gases reflect a mixing trend between shallow microbial gas and deeper thermogenic gas; and (3) CSG production rates are highest at intermediate depths where the CSG is a mixture of microbial and thermogenic gases. Results of this study strengthen the hypothesis that microbial gas generation is responsible for zones of higher gas saturation and production, but the addition of new analytical data has provided enhanced spatial coverage, leading to refined hypotheses on the distribution and origins of the CSG and the compositional variation of associated waters on opposite sides of a faulted hinge zone.
Comparison of our expanded analytical dataset against updated reservoir, production and structure datasets allowed improved geology-based interpretations and the identification of statistically significant geochemical differences within and between the upper (P)- and lower (GM)-producing coal seams. New hydrochemical and multi-isotope evidence indicates that coal bed waters from the production zone (100–500 m depth) are likely to be entirely meteoric in origin and evolved via a combination of low temperature fluid-rock interaction processes and microbial activity. Although new δ13C and δ2H data support a gas mixing trend hypothesis with δ13C-CH4 increasing from more negative secondary biogenic (microbial CO2 reduction) to less negative thermogenic values at depth (δ13C −62.2‰ to −46.3‰), geographic variations in gas content/saturation and production more likely reflect the extent of secondary microbial gas generation and retention as a function of hydrodynamics. Below 200 m, the majority of δ13C-CO2 values are positive (δ13C −1.2‰ to 7.1‰) and δ13CDIC shows an erratic increase with depth and increasing alkalinity for both seams that is characteristic of evolution via microbial activity. Although there is possible evidence of minor thermogenic input, Δ13C(CO2–CH4) values and the overall progression of carbon isotopes along the CO2 reduction fractionation line suggests progressive depletion of the CO2 reservoir with increasing depth for both seams on both sides of the hinge zone.
Domains of differing gas production have different δ13CDIC/alkalinity signatures. Contrasting isotope, sodicity and δ13CDIC/alkalinity ratios for deep wells south of the hinge zone are consistent with a cutout in permeability. For a given depth, differing production behaviour among closely spaced wells can be correlated with different geochemical and isotopic signatures across mapped faults. Overall, stable isotope and water-quality data suggest that waters south of the hinge zone are not as microbially evolved as waters to the north. Faults clearly segment coal seams into areas having significantly different production, with results of geochemical analysis suggesting that pooling of biogenic gas and waters and enhanced methanogenesis occur north of the hinge zone. More enriched production gas δ13C-CH4 values to the north of the hinge zone are consistent with this hypothesis when interpreted in terms of 13C pool depletion effects.
The interpretation of a strong microbial influence, despite the high rank of the coal, has implications for interpreting and predicting production behaviour. Overall, our new results support the interpretation that the faulted hinge zone acts as a barrier to fluid communication along strike (NW to SE) and underline the need for further isotopic studies on the study field.
Author Contributions
Conceptualization, S.D.G. and J.S.E.; Funding acquisition, S.D.G. and J.S.E.; Investigation, S.K.H., S.D.G., J.S.E., K.A.B and B.B.R.; Methodology, S.K.H., S.D.G., J.S.E. and K.A.B.; Resources, S.D.G. and J.S.E.; Supervision, S.D.G. and J.E.E.; Writing—original draft, S.K.H. and K.A.B.; Writing—review and editing, S.K.H., S.D.G., J.S.E. and K.A.B. All authors have read and agreed to the published version of the manuscript.
Funding
Arrow Energy provided partial funding for the field work and geochemical analyses. This research received no other external funding.
Acknowledgments
The authors wish to acknowledge logistical and in-kind support from Arrow Energy and Anglo American. We also gratefully acknowledge S. Mazumder, Arrow Energy for providing gas molecular compositional data and P. Evans (University of Queensland, UQ) for assistance with fieldwork and sampling. UQ MSc thesis work by O. Seiphemo assisted the interpretations presented in this paper.
Conflicts of Interest
The authors declare no conflict of interest. The funders had no role in the design of the study; in the collection, analyses, or interpretation of data apart from the provision of gas molecular and fault layer data sets; in the writing of the manuscript; or in the decision to publish the results.
References
- Baublys, K.; Hamilton, S.; Golding, S.D.; Vink, S.; Esterle, J. Microbial controls on the origin and evolution of coal seam gases and production waters of the Walloon Subgroup; Surat Basin, Australia. Int. J. Coal Geol. 2015, 147, 85–104. [Google Scholar] [CrossRef]
- Golding, S.D.; Boreham, C.J.; Esterle, J.S. Stable isotope geochemistry of coal bed and shale gas and related production waters: A review. Int. J. Coal Geol. 2013, 120, 24–40. [Google Scholar] [CrossRef]
- Kinnon, E.; Golding, S.D.; Boreham, C.; Baublys, K.; Esterle, J. Stable isotope and water quality analysis of coal bed methane production waters and gases from the Bowen Basin, Australia. Int. J. Coal Geol. 2010, 82, 219–231. [Google Scholar] [CrossRef]
- McIntosh, J.C.; Warwick, P.D.; Martini, A.M.; Osborn, S.G. Coupled hydrology and biogeochemistry of Paleocene–Eocene coal beds, northern Gulf of Mexico. GSA Bull. 2010, 122, 1248–1264. [Google Scholar] [CrossRef]
- Scott, A.R.; Kaiser, W.; Ayers Jr, W.B. Thermogenic and Secondary Biogenic Gases, San Juan Basin, Colorado and New Mexico--Implications for Coalbed Gas Producibility. AAPG Bull. 1994, 78, 1186–1209. [Google Scholar]
- Strąpoć, D.; Mastalerz, M.; Dawson, K.; Macalady, J.; Callaghan, A.V.; Wawrik, B.; Turich, C.; Ashby, M. Biogeochemistry of Microbial Coal-Bed Methane. Annu. Rev. Earth Planet. Sci. 2011, 39, 617–656. [Google Scholar] [CrossRef]
- Van Voast, W.A. Geochemical signature of formation waters associated with coalbed methane. AAPG Bull. 2003, 87, 667–676. [Google Scholar] [CrossRef]
- Vinson, D.S.; Blair, N.E.; Martini, A.M.; Larter, S.; Orem, W.H.; McIntosh, J.C.; Larter, S. Microbial methane from in situ biodegradation of coal and shale: A review and reevaluation of hydrogen and carbon isotope signatures. Chem. Geol. 2017, 453, 128–145. [Google Scholar] [CrossRef]
- Burra, A.; Esterle, J.S.; Golding, S.D. Coal seam gas distribution and hydrodynamics of the Sydney Basin, NSW, Australia. Aust. J. Earth Sci. 2014, 61, 427–451. [Google Scholar] [CrossRef]
- Pashin, J.C. Hydrodynamics of coalbed methane reservoirs in the Black Warrior Basin: Key to understanding reservoir performance and environmental issues. Appl. Geochem. 2007, 22, 2257–2272. [Google Scholar] [CrossRef]
- Scott, A.R. Hydrogeologic factors affecting gas content distribution in coal beds. Int. J. Coal Geol. 2002, 50, 363–387. [Google Scholar] [CrossRef]
- Thomson, S.; Hatherly, P.; Hennings, S.; Sandford, J. A model for gas distribution in coals of the Lower Hunter, Sydney Basin. In Proceedings of the Eastern Australian Basins Symposium III, Sydney, Australia, 15–17 September 2008. [Google Scholar]
- Baublys, K.A.; Hamilton, S.K.; Hofmann, H.; Golding, S.D. A strontium (87Sr/86Sr) isotopic study on the chemical evolution and migration of groundwaters in a low-rank coal seam gas reservoir (Surat Basin, Australia). Appl. Geochem. 2019, 101, 1–18. [Google Scholar] [CrossRef]
- Draper, J.J.; Boreham, C. Geological controls on exploitable coal seam gas distribution in Queensland. APPEA J. 2006, 46, 343–366. [Google Scholar] [CrossRef]
- Faiz, M.; Hendry, P. Significance of microbial activity in Australian coal bed methane reservoirs—A review. Bull. Can. Pet. Geol. 2006, 54, 261–272. [Google Scholar] [CrossRef]
- Hamilton, S.; Golding, S.D.; Baublys, K.; Esterle, J. Stable isotopic and molecular composition of desorbed coal seam gases from the Walloon Subgroup, eastern Surat Basin, Australia. Int. J. Coal Geol. 2014, 122, 21–36. [Google Scholar] [CrossRef]
- Hamilton, S.; Golding, S.D.; Baublys, K.; Esterle, J. Conceptual exploration targeting for microbially enhanced coal bed methane (MECoM) in the Walloon Subgroup, eastern Surat Basin, Australia. Int. J. Coal Geol. 2015, 138, 68–82. [Google Scholar] [CrossRef]
- Smith, J.W.; Pallasser, R.J. Microbial Origin of Australian Coalbed Methane. AAPG Bull. 1996, 80, 891–897. [Google Scholar]
- Hillis, R.R.; Reynolds, S.D. In Situ Stress Field of Australia; Geological Society of Australia Special Publication: Hornsby, Australia, 2002; pp. 43–52. [Google Scholar]
- Beeston, J. Coal rank variation in the Bowen Basin, Queensland. Int. J. Coal Geol. 1986, 6, 163–179. [Google Scholar] [CrossRef]
- Arrow Energy. Underground Water Impact Report for Petroleum Leases 191, 196, 223, 224 and Authority to Prospect 1103, 742, 831 and 1031. State of Queensland, Department of Environment and Heritage Protection, 2016. Available online: https://www.ehp.qld.gov.au/management/non-mining/documents/bowen-basin-project-uwir.pdf (accessed on 11 February 2020).
- Kinnon, E.; Esterle, J. Geological controls on gas flow pathways in coal seams. In Proceedings of the 2008 International Coal Bed Methane and Shale Gas Symposium, The University of Alabama, Tuscaloosa, Alabama, 9–23 May 2008. Paper 0803. [Google Scholar]
- Paul, D.; Skrzypek, G.; Fórizs, I. Normalization of measured stable isotopic compositions to isotope reference scales – a review. Rapid Commun. Mass Spectrom. 2007, 21, 3006–3014. [Google Scholar]
- Coplen, T.B. New guidelines for reporting stable hydrogen, carbon, and oxygen isotope-ratio data. Geochim. Cosmochim. Acta 1996, 60, 3359–3360. [Google Scholar] [CrossRef]
- Whiticar, M.; Faber, E.; Schoell, M. Biogenic methane formation in marine and freshwater environments: CO2 reduction vs. acetate fermentation—Isotope evidence. Geochim. Cosmochim. Acta 1986, 50, 693–709. [Google Scholar] [CrossRef]
- Milkov, A.V.; Etiope, G. Revised genetic diagrams for natural gases based on a global dataset of >20,000 samples. Org. Geochem. 2018, 125, 109–120. [Google Scholar] [CrossRef]
- Kloppmann, W.; Girard, J.-P.; Negrel, P. Exotic stable isotope compositions of saline waters and brines from the crystalline basement. Chem. Geol. 2002, 184, 49–70. [Google Scholar] [CrossRef]
- Clayton, R.N.; Friedman, I.; Graf, D.L.; Mayeda, T.K.; Meents, W.F.; Shimp, N.F. The origin of saline formation waters: 1. Isotopic composition. J. Geophys. Res. Space Phys. 1966, 71, 3869–3882. [Google Scholar] [CrossRef]
- Sheppard, S.M.F. Characterization and isotopic variations in natural waters. Rev. Miner. 1986, 16, 165–184. [Google Scholar]
- Whiticar, M.J. Carbon and hydrogen isotope systematics of bacterial formation and oxidation of methane. Chem. Geol. 1999, 161, 291–314. [Google Scholar] [CrossRef]
- Craig, H. Isotopic Variations in Meteoric Waters. Science 1961, 133, 1702–1703. [Google Scholar] [CrossRef]
- Martini, A.; Walter, L.; Budai, J.; Ku, T.; Kaiser, C.; Schoell, M. Genetic and temporal relations between formation waters and biogenic methane: Upper Devonian Antrim Shale, Michigan Basin, USA. Geochim. Cosmochim. Acta 1998, 62, 1699–1720. [Google Scholar] [CrossRef]
- McIntosh, J.; Garven, G.; Hanor, J. Impacts of Pleistocene glaciation on large-scale groundwater flow and salinity in the Michigan Basin. Geofluids 2011, 11, 18–33. [Google Scholar] [CrossRef]
- McIntosh, J.; Walter, L.; Martini, A. Pleistocene recharge to midcontinent basins: Effects on salinity structure and microbial gas generation. Geochim. Cosmochim. Acta 2002, 66, 1681–1700. [Google Scholar] [CrossRef]
- Schlegel, M.E.; McIntosh, J.C.; Bates, B.L.; Kirk, M.F.; Martini, A.M. Comparison of fluid geochemistry and microbiology of multiple organic-rich reservoirs in the Illinois Basin, USA: Evidence for controls on methanogenesis and microbial transport. Geochim. Cosmochim. Acta 2011, 75, 1903–1919. [Google Scholar] [CrossRef]
- Taulis, M.; Milke, M. Coal seam gas water from Maramarua, New Zealand: Characterisation and comparison to United States analogues. J. Hydrol. (N. Z.) 2007, 1–17. [Google Scholar]
- Whiticar, M.J. A geochemial perspective of natural gas and atmospheric methane. Org. Geochem. 1990, 16, 531–547. [Google Scholar] [CrossRef]
- Rice, D.D.; Claypool, G.E. Generation, Accumulation, and Resource Potential of Biogenic Gas. AAPG Bull. 1981, 65, 5–25. [Google Scholar]
- Esterle, J. Moranbah Gas Project: Geological Review of Current Production Area; CSIRO Exploration & Mining Report; P2005/119; CSIRO: Canberra, Australia, 2005. [Google Scholar]
- Aravena, R.; Wassenaar, L.; Plummer, L.N. Estimating14C Groundwater Ages in a Methanogenic Aquifer. Water Resour. Res. 1995, 31, 2307–2317. [Google Scholar] [CrossRef]
- Alperin, M.J.; Reeburgh, W.S.; Whiticar, M.J. Carbon and hydrogen isotope fractionation resulting from anaerobic methane oxidation. Glob. Biogeochem. Cycles 1988, 2, 279–288. [Google Scholar] [CrossRef]
- Bates, B.L.; McIntosh, J.C.; Lohse, K.A.; Brooks, P.D. Influence of groundwater flowpaths, residence times and nutrients on the extent of microbial methanogenesis in coal beds: Powder River Basin, USA. Chem. Geol. 2011, 284, 45–61. [Google Scholar] [CrossRef]
- Conrad, R. Quantification of methanogenic pathways using stable carbon isotopic signatures: A review and a proposal. Org. Geochem. 2005, 36, 739–752. [Google Scholar] [CrossRef]
- Flores, R.M.; Rice, C.A.; Stricker, G.D.; Warden, A.; Ellis, M.S. Methanogenic pathways of coal-bed gas in the Powder River Basin, United States: The geologic factor. Int. J. Coal Geol. 2008, 76, 52–75. [Google Scholar] [CrossRef]
- Rice, C.; Flores, R.; Stricker, G.; Ellis, M. Chemical and stable isotopic evidence for water/rock interaction and biogenic origin of coalbed methane, Fort Union Formation, Powder River Basin, Wyoming and Montana U.S.A. Int. J. Coal Geol. 2008, 76, 76–85. [Google Scholar] [CrossRef]
- McIntosh, J.; Martini, A.; Petsch, S.; Huang, R.; Nüsslein, K. Biogeochemistry of the Forest City Basin coalbed methane play. Int. J. Coal Geol. 2008, 76, 111–118. [Google Scholar] [CrossRef]
- Papendick, S.L.; Downs, K.R.; Vo, K.D.; Hamilton, S.K.; Dawson, G.K.; Golding, S.D.; Gilcrease, P.C. Biogenic methane potential for Surat Basin, Queensland coal seams. Int. J. Coal Geol. 2011, 88, 123–134. [Google Scholar] [CrossRef]
- Schoell, M. The hydrogen and carbon isotopic composition of methane from natural gases of various origins. Geochim. Cosmochim. Acta 1980, 44, 649–661. [Google Scholar] [CrossRef]
- Fuex, A. Experimental evidence against an appreciable isotopic fractionation of methane during migration. Phys. Chem. Earth 1980, 12, 725–732. [Google Scholar] [CrossRef]
- Kinnon, E. Analysis of gas and water production pathways in coal seams. MPhil Thesis, University of Queensland, St. Lucia, Australia, 2010. [Google Scholar]
- Faiz, M.; Saghafi, A.; Sherwood, N.; Wang, I. The influence of petrological properties and burial history on coal seam methane reservoir characterisation, Sydney Basin, Australia. Int. J. Coal Geol. 2007, 70, 193–208. [Google Scholar] [CrossRef]
- Faiz, M.M.; Saghafi, A.; Sherwood, N.R. Higher Hydrocarbon Gases in Southern Sydney Basin Coals. In Coalbed Methane: Scientific, Environmental and Economic Evaluation; Springer Science and Business Media LLC: Berlin, Germany, 1999; pp. 233–255. [Google Scholar]
© 2020 by the authors. Licensee MDPI, Basel, Switzerland. This article is an open access article distributed under the terms and conditions of the Creative Commons Attribution (CC BY) license (http://creativecommons.org/licenses/by/4.0/).