1. Introduction
The proper calculation of seismic static corrections is one of the core processing stages. It is even more important when the main target is to find the source of geothermal energy in a region where complex geology occurs [
1]. Obtaining an optimal time shift for each trace is not always a simple calculation of time according to the depths and velocities of particular refraction layers. The complexity of the near-surface zone (NSZ) is usually high because of varying rock types, low compaction, and a strong influence of weathering processes [
2]. NSZ complexes could be faulted or have disturbances inside the layers that cannot be easily obtained using the standard refraction seismic method, e.g., anisotropy. The Carpathians is one of the regions where seismic processing requires special approaches and dedicated algorithms to obtain an image for interpretation [
3,
4]. Including P-wave azimuthal anisotropy in standard procedures of seismic processing has been neglected for years [
5,
6]. To date, there have been no published results of including anisotropy for static correction calculations in Poland. In recent years, the benefits of including P-wave azimuthal anisotropy effects have become more important and increasingly used in processing and interpretation worldwide. More and more accurate and detailed surveys are being designed. New and more sensitive detectors are being used. It must be understood that subsurface deposits are more or less anisotropic and their effects have to be included in seismic surveys when the acquisition is three-dimensional (3D) or a wide azimuth two-dimensional (2D) type. Otherwise, the poor resolution of faults, misinterpreted events, poor migration results, and many other negative effects will occur [
5]. This paper is focused on including the effect of NSZ anisotropy for seismic static correction calculations. This paper presents the results of the application of this processing approach in the reprocessing of difficult 3D seismic data. This data had initially been processed in 2001 in Omega SLB software, and in 2016, the reprocessing was performed using ProMAX software. In 2019, the GK Processing team performed another reprocessing. The main idea was to examine the new processing scheme strongly oriented toward anisotropy effects.
2. Local Geology and Region Characterization
The presented research was conducted on data acquired in the Carpathian Inner Mountain Basin in 2001. Using terminology reported by Ślączka et al. [
7], the Carpathians can be divided into Polish, Slovakian, and Ukrainian ones. The Polish Carpathians can be divided into three sections: Central Carpathians, Outer Carpathians, and Carpathian Foredeep. In this paper, the Central Carpathians are examined. The Pieniny Klippen Belt separates the Outer Carpathians in the north from the Central Carpathians in the south. In the Central Carpathians, the Eocene- to Oligocene-age deposits consist mostly of mudrocks, shales, and sandstones. Podhale Syncline consists of Palaeogene Flysh. The different lateral facies dated to the Paleogene age can be found parallel to the tectonic strike. In the northernmost region of Podhale Flysh, the Szaflary beds of thin-bedded sandstones are present. Because of their contact with the Pieniny Klippen Belt, the strong folding to the vertical position occurs. Dark and grey shales, locally with sandstones layers, are typical for Zakopane beds [
8]. The glaciers and river Pleistocene deposits occur in a small Zakopane basin. Next, the Nowy Targ, Lipto, and Poprad-Hernad basins are localized (Paleocene to Eocene facies). They consist mostly of different types of sandstone, marl rocks, and shales.
Granitoids with Mesozoic sedimentary complexes (the autochthonous core of granitoids and Late Cretaceous complexes shifted from the south) build the High Tataras area [
9].
We decided to start our analysis from an examination of the NSZ with a different approach to the standard approaches in the exploration seismic processing scheme. After a detailed analysis of surface geological maps and geophysical studies on the NSZ (electric tomography and shallow refraction), we decided to use algorithms that correct the static correction values according to the anisotropy effect.
The research made by Ostrowski, Ostrowska-Rybak, and Lasocki [
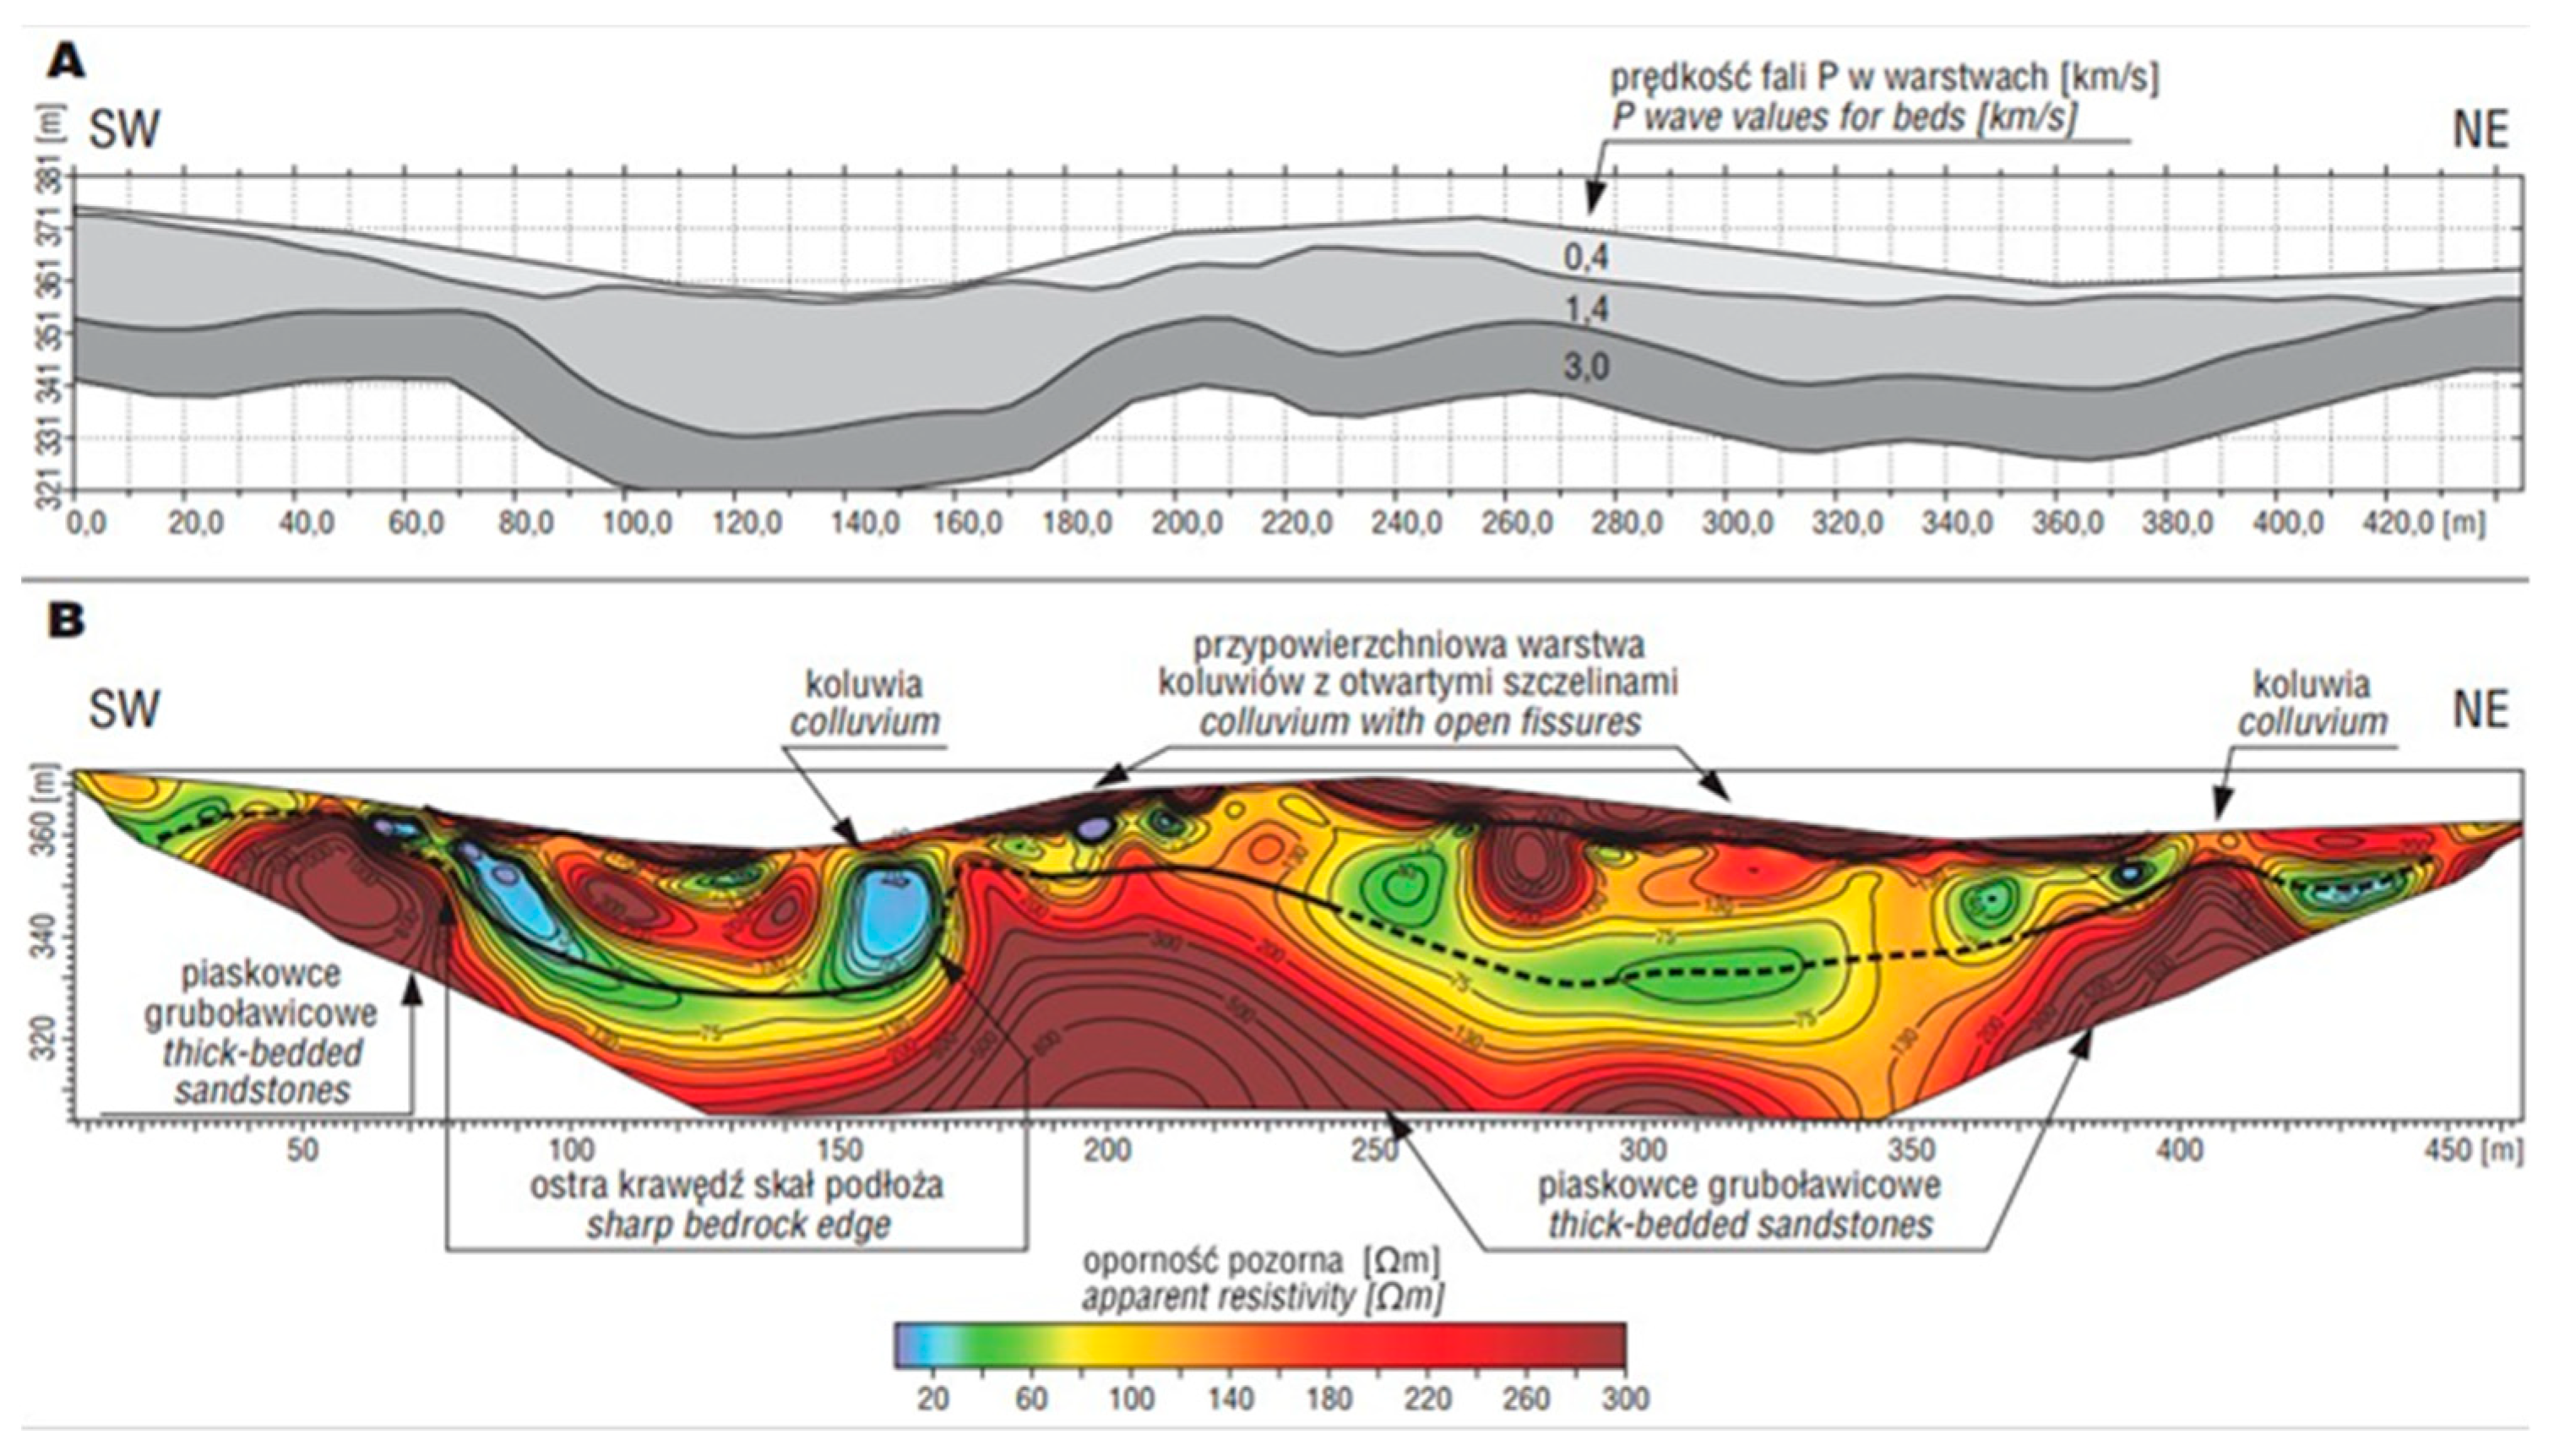
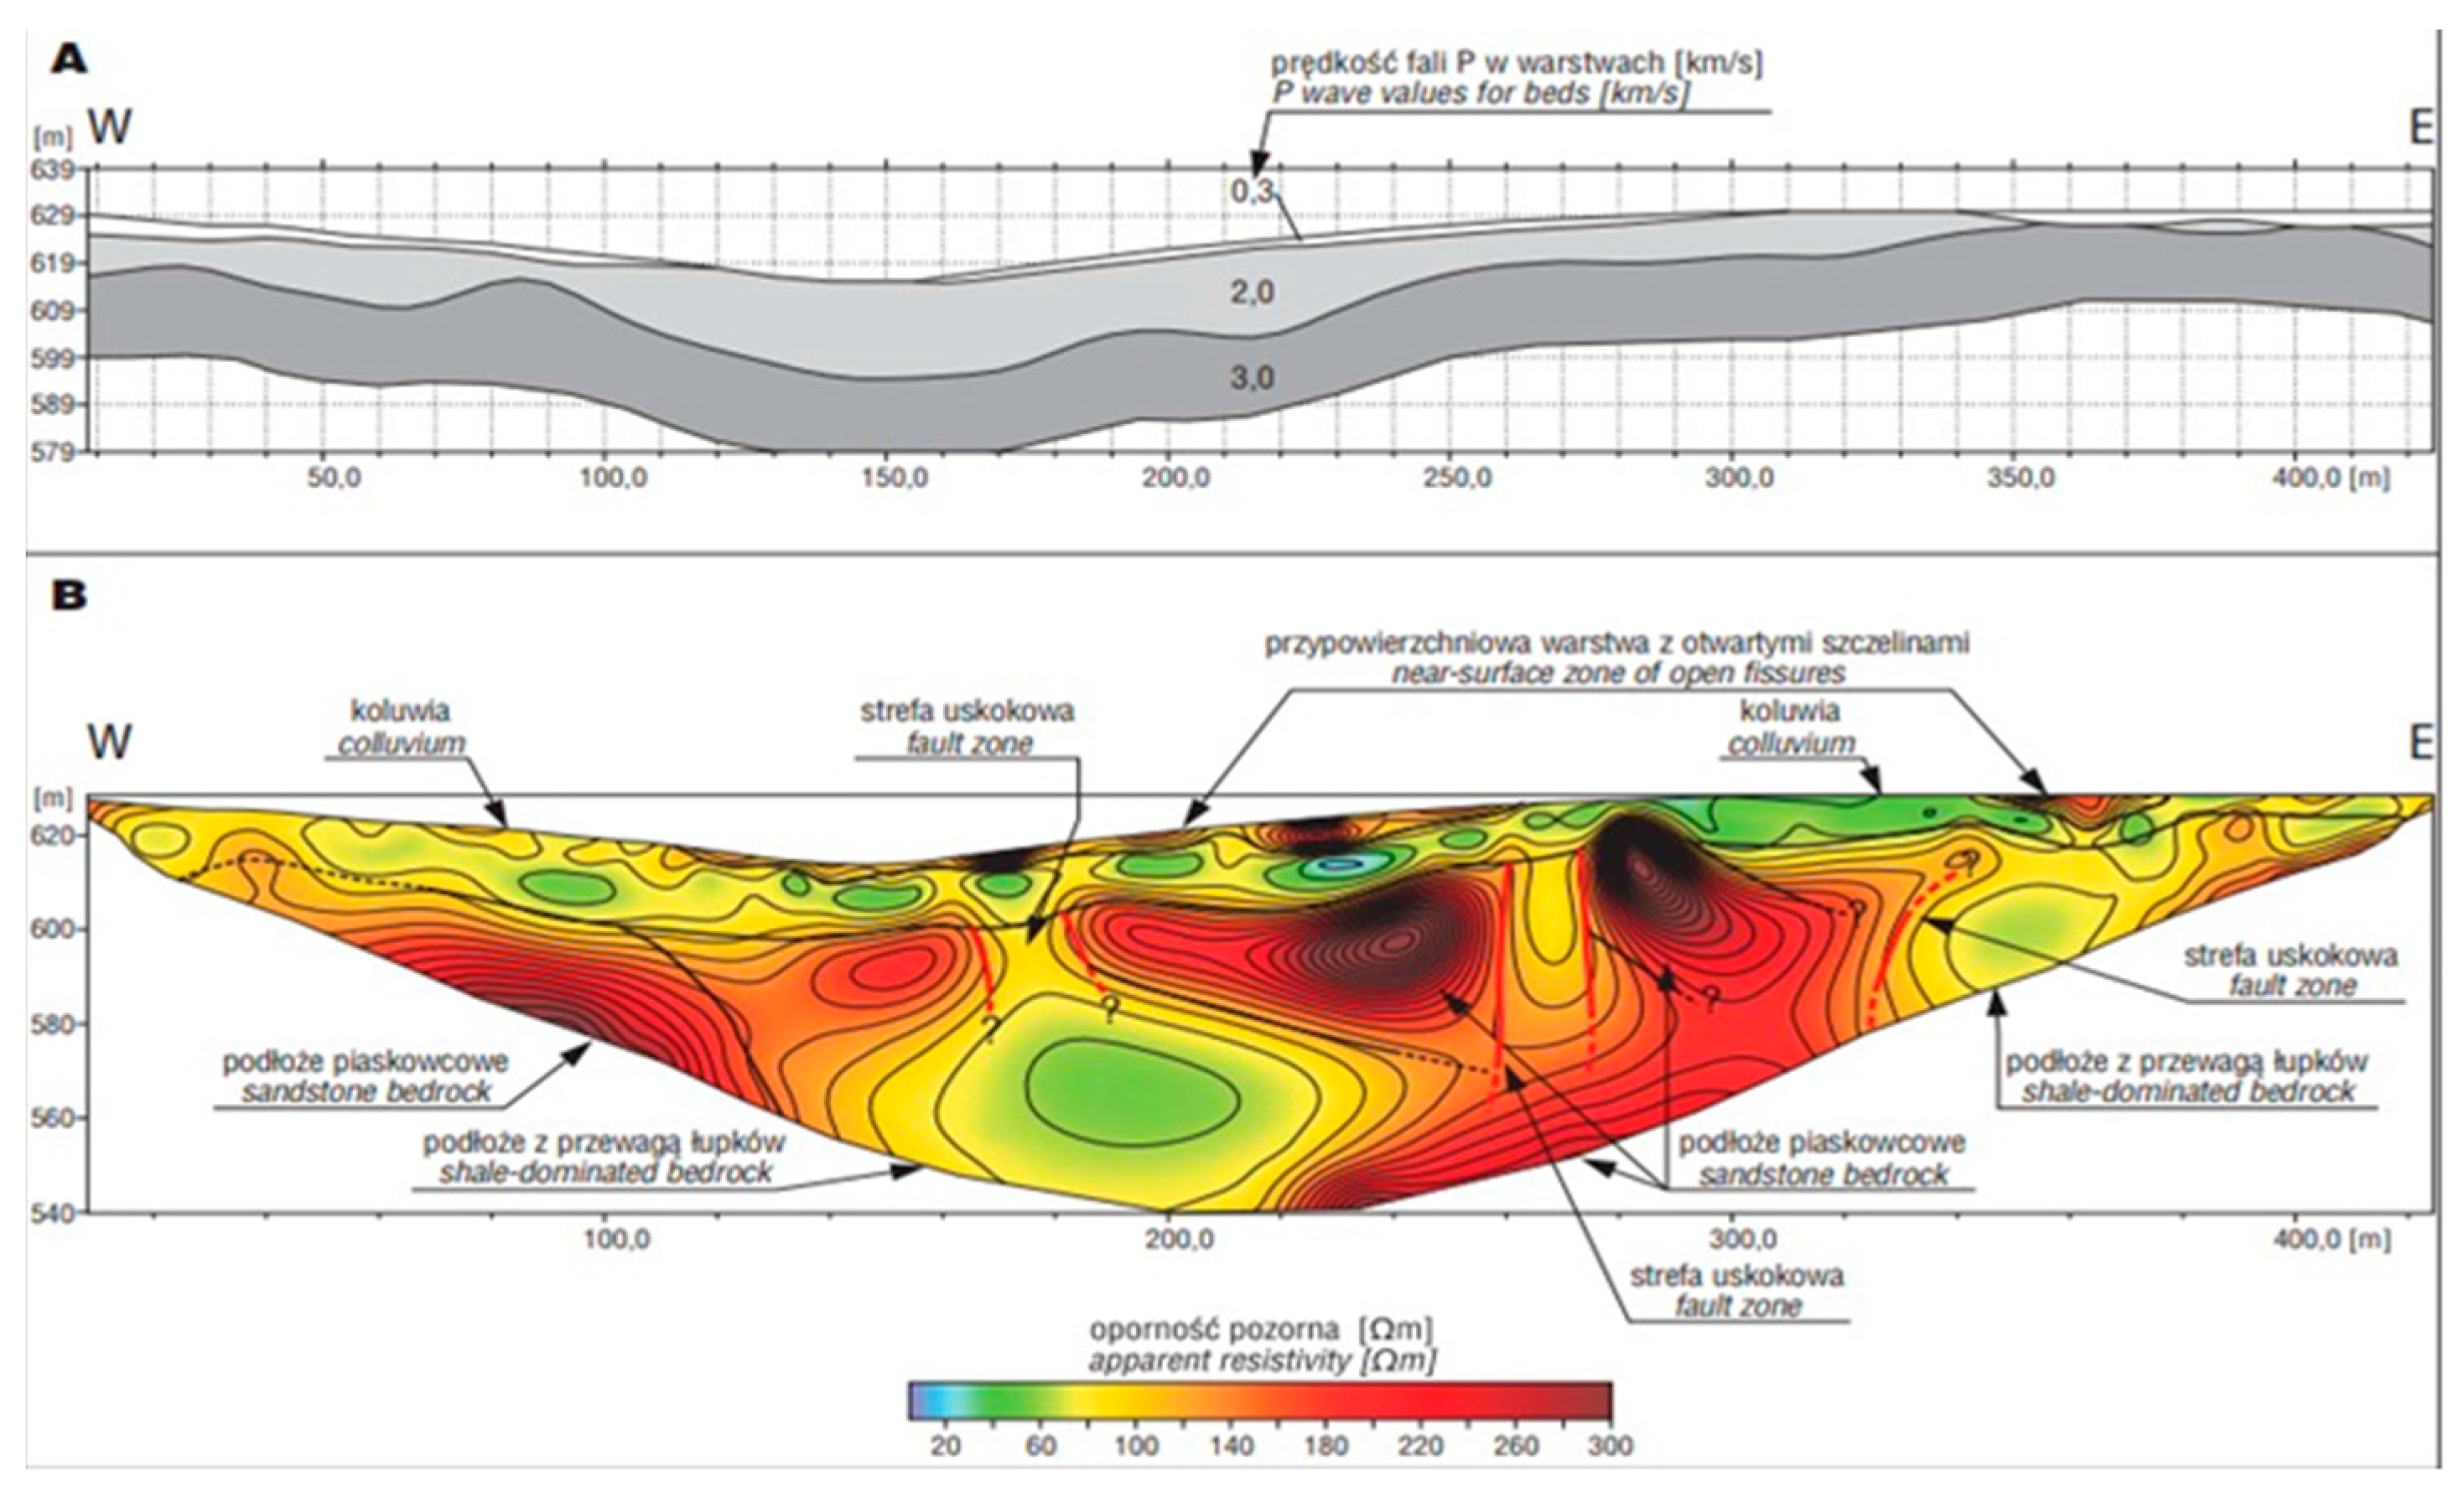
10] shows the comparison between electrical resistivity tomography (ERT) and seismic refraction surveys for the investigation of the NSZ in the Carpathians. In
Figure 1 and
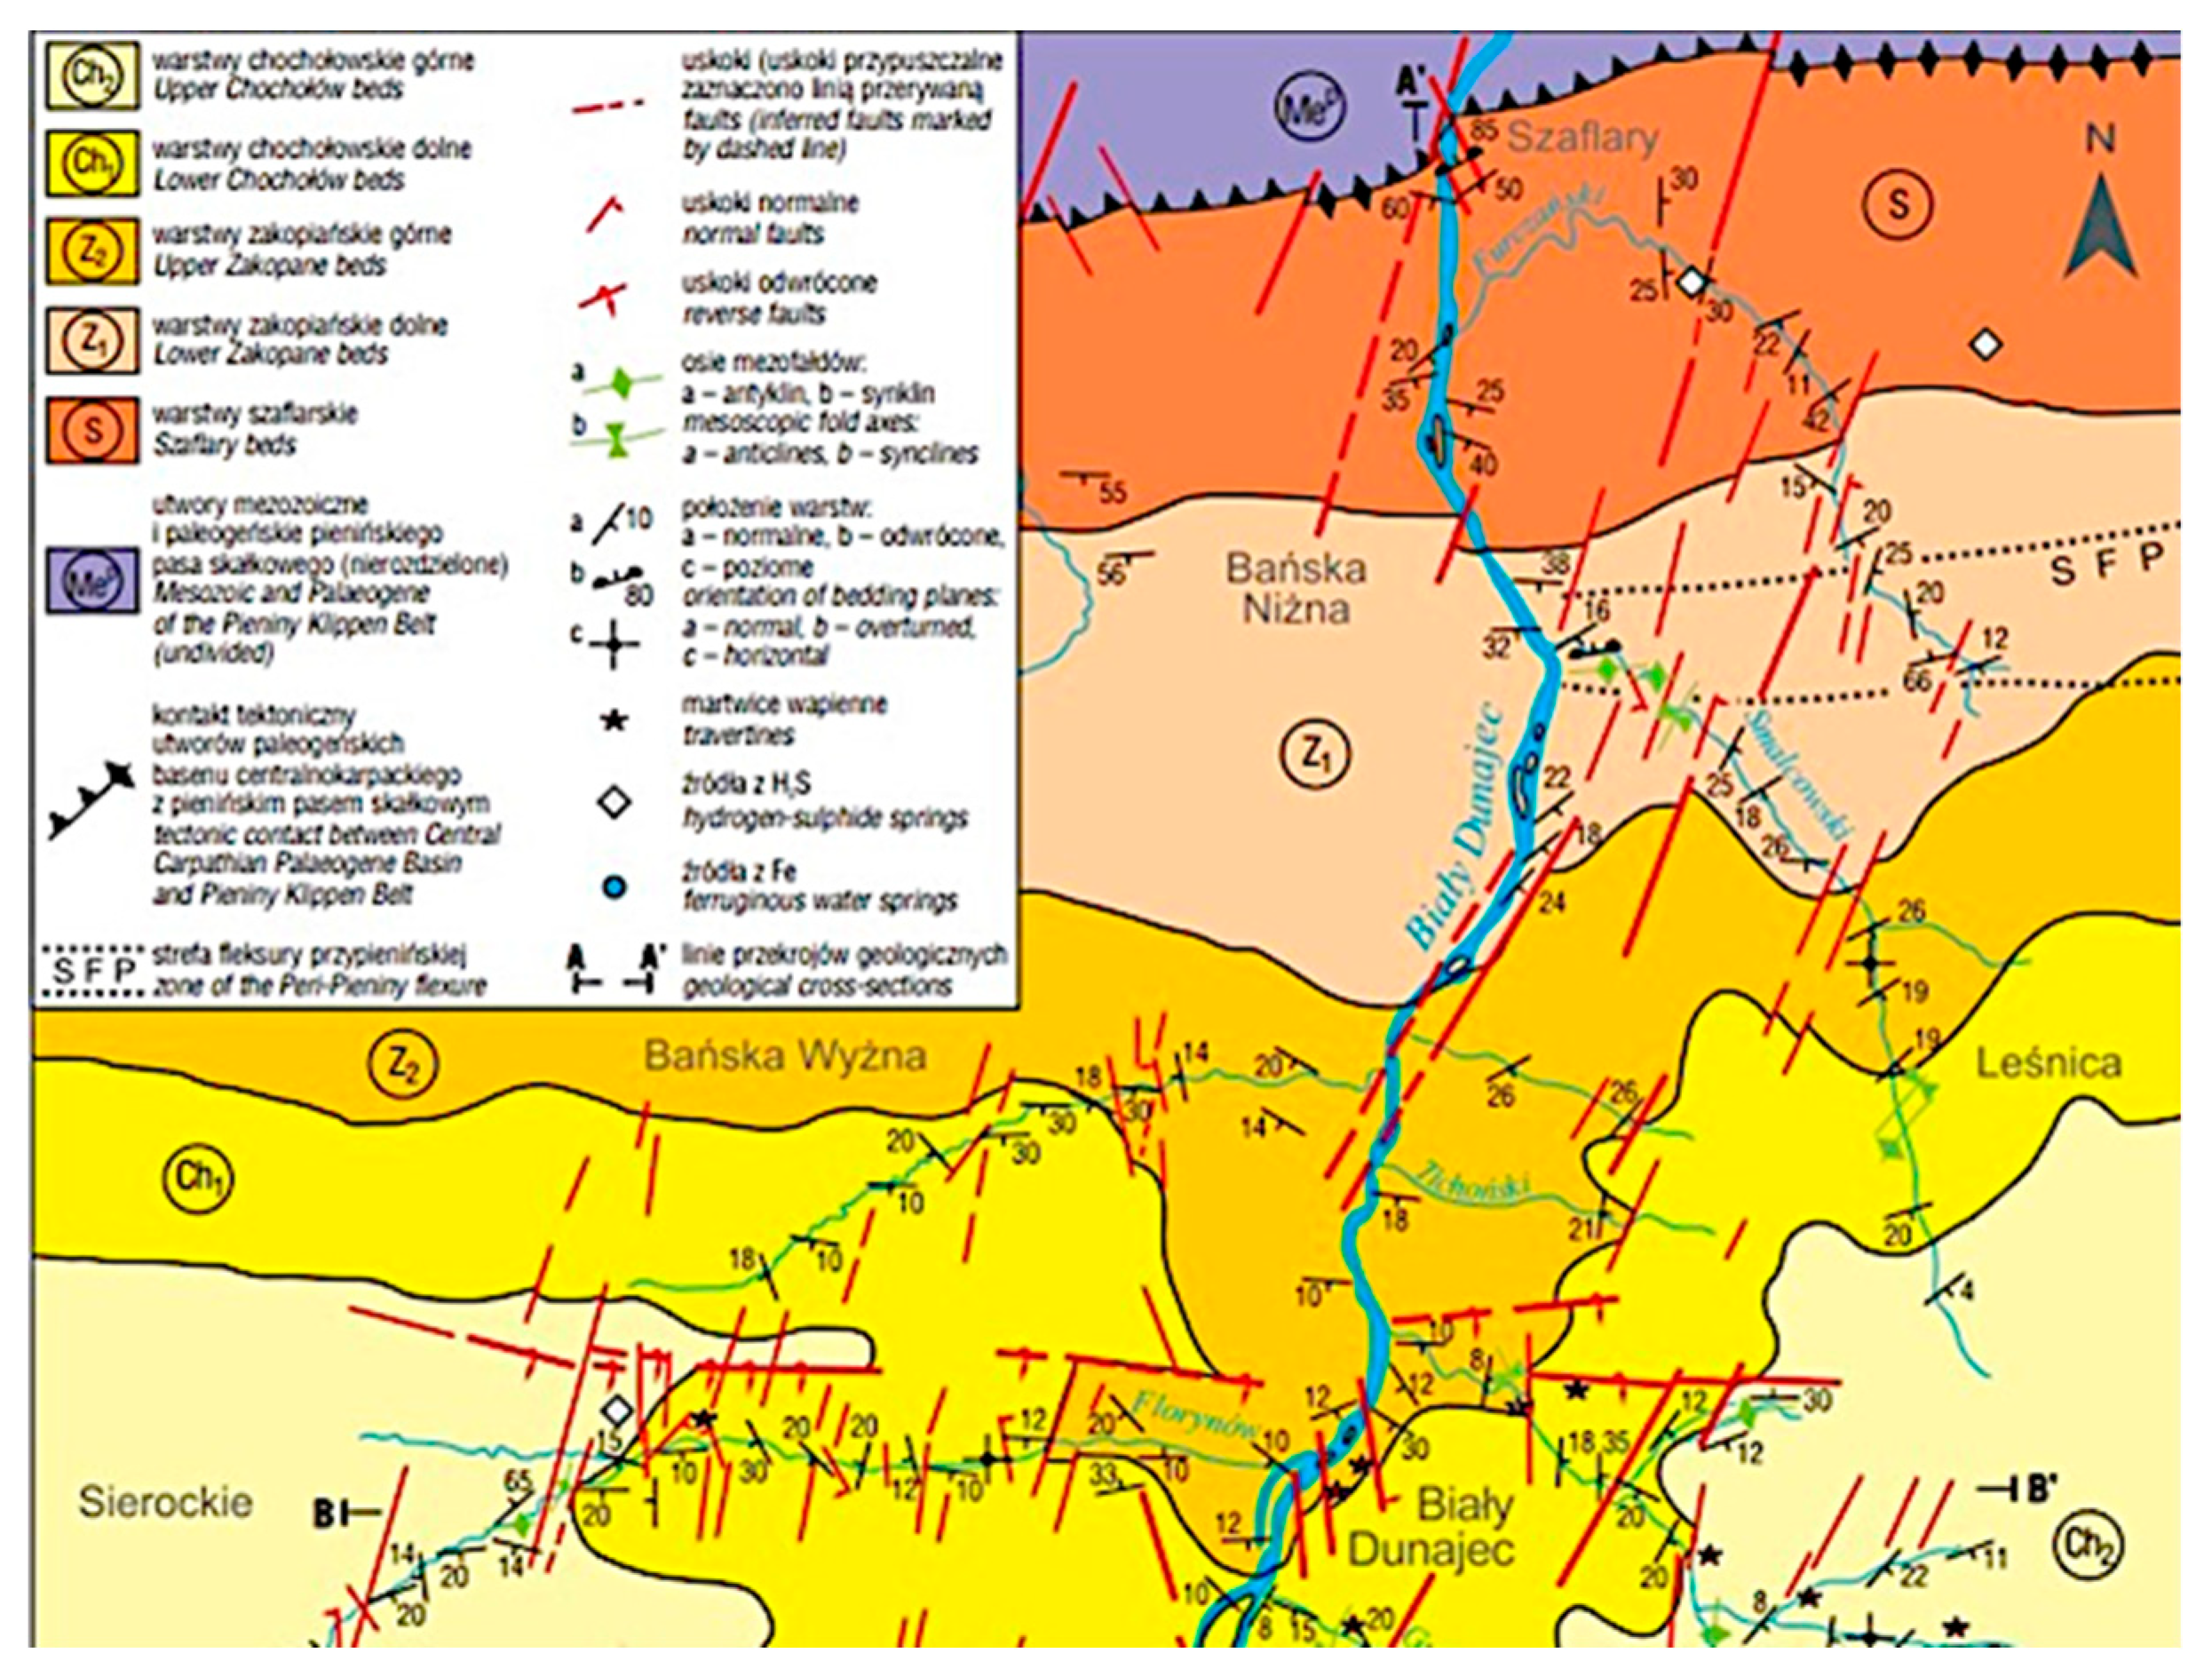
Figure 2, the seismic refraction profile can be seen at the top, and the ERT profile of the same line is at the bottom. It is clearly visible that in one seismic layer (constant P-wave velocity), rock types are differentiated by their apparent resistivity. The lower value of apparent resistivity can be related to shales where the high value is related to sandstones, so the two different types of rocks with different elastic properties can be found in one seismic refraction layer. Additionally, the surface study of Bialy Dunajec Valley made by Mastella, Ludwiniak, and Klimkiewicz [
10] shows the geological map with faults of mostly south–north direction (
Figure 3).
3. Anisotropy Approach for Statics Calculation
Seismic statics corrections can be divided into first-order static corrections (deterministic methods) and second-order static corrections (statistical methods). It is important to obtain the best solution of the first-order statics because it can affect the solution of the second-order statics. The most basic version of the first-order correction is elevation statics, where the time shift is calculated using only elevation and replacement velocity. The next often-used type is uphole statics, where the first break time from source (buried at a particular depth in the shallow borehole) to a receiver is used. However, it is necessary to perform the time-consuming quality control of upholes when reprocessing is done, especially in the case of older data. The reason is that the depth of a source in headers or observer logs could, in fact, be shallower. Usually, in practice, the following methods are used: reciprocal methods, tomographic inverse methods, and generalized linear inverse methods. Second-order static corrections are called direct or residual. The most-used approaches are the molecular crystallization method and the Monte Carlo method.
In this paper, for the static calculations, we used the delay time analysis method (DTA) corrected by refractor anisotropy effects. We used Flatirons
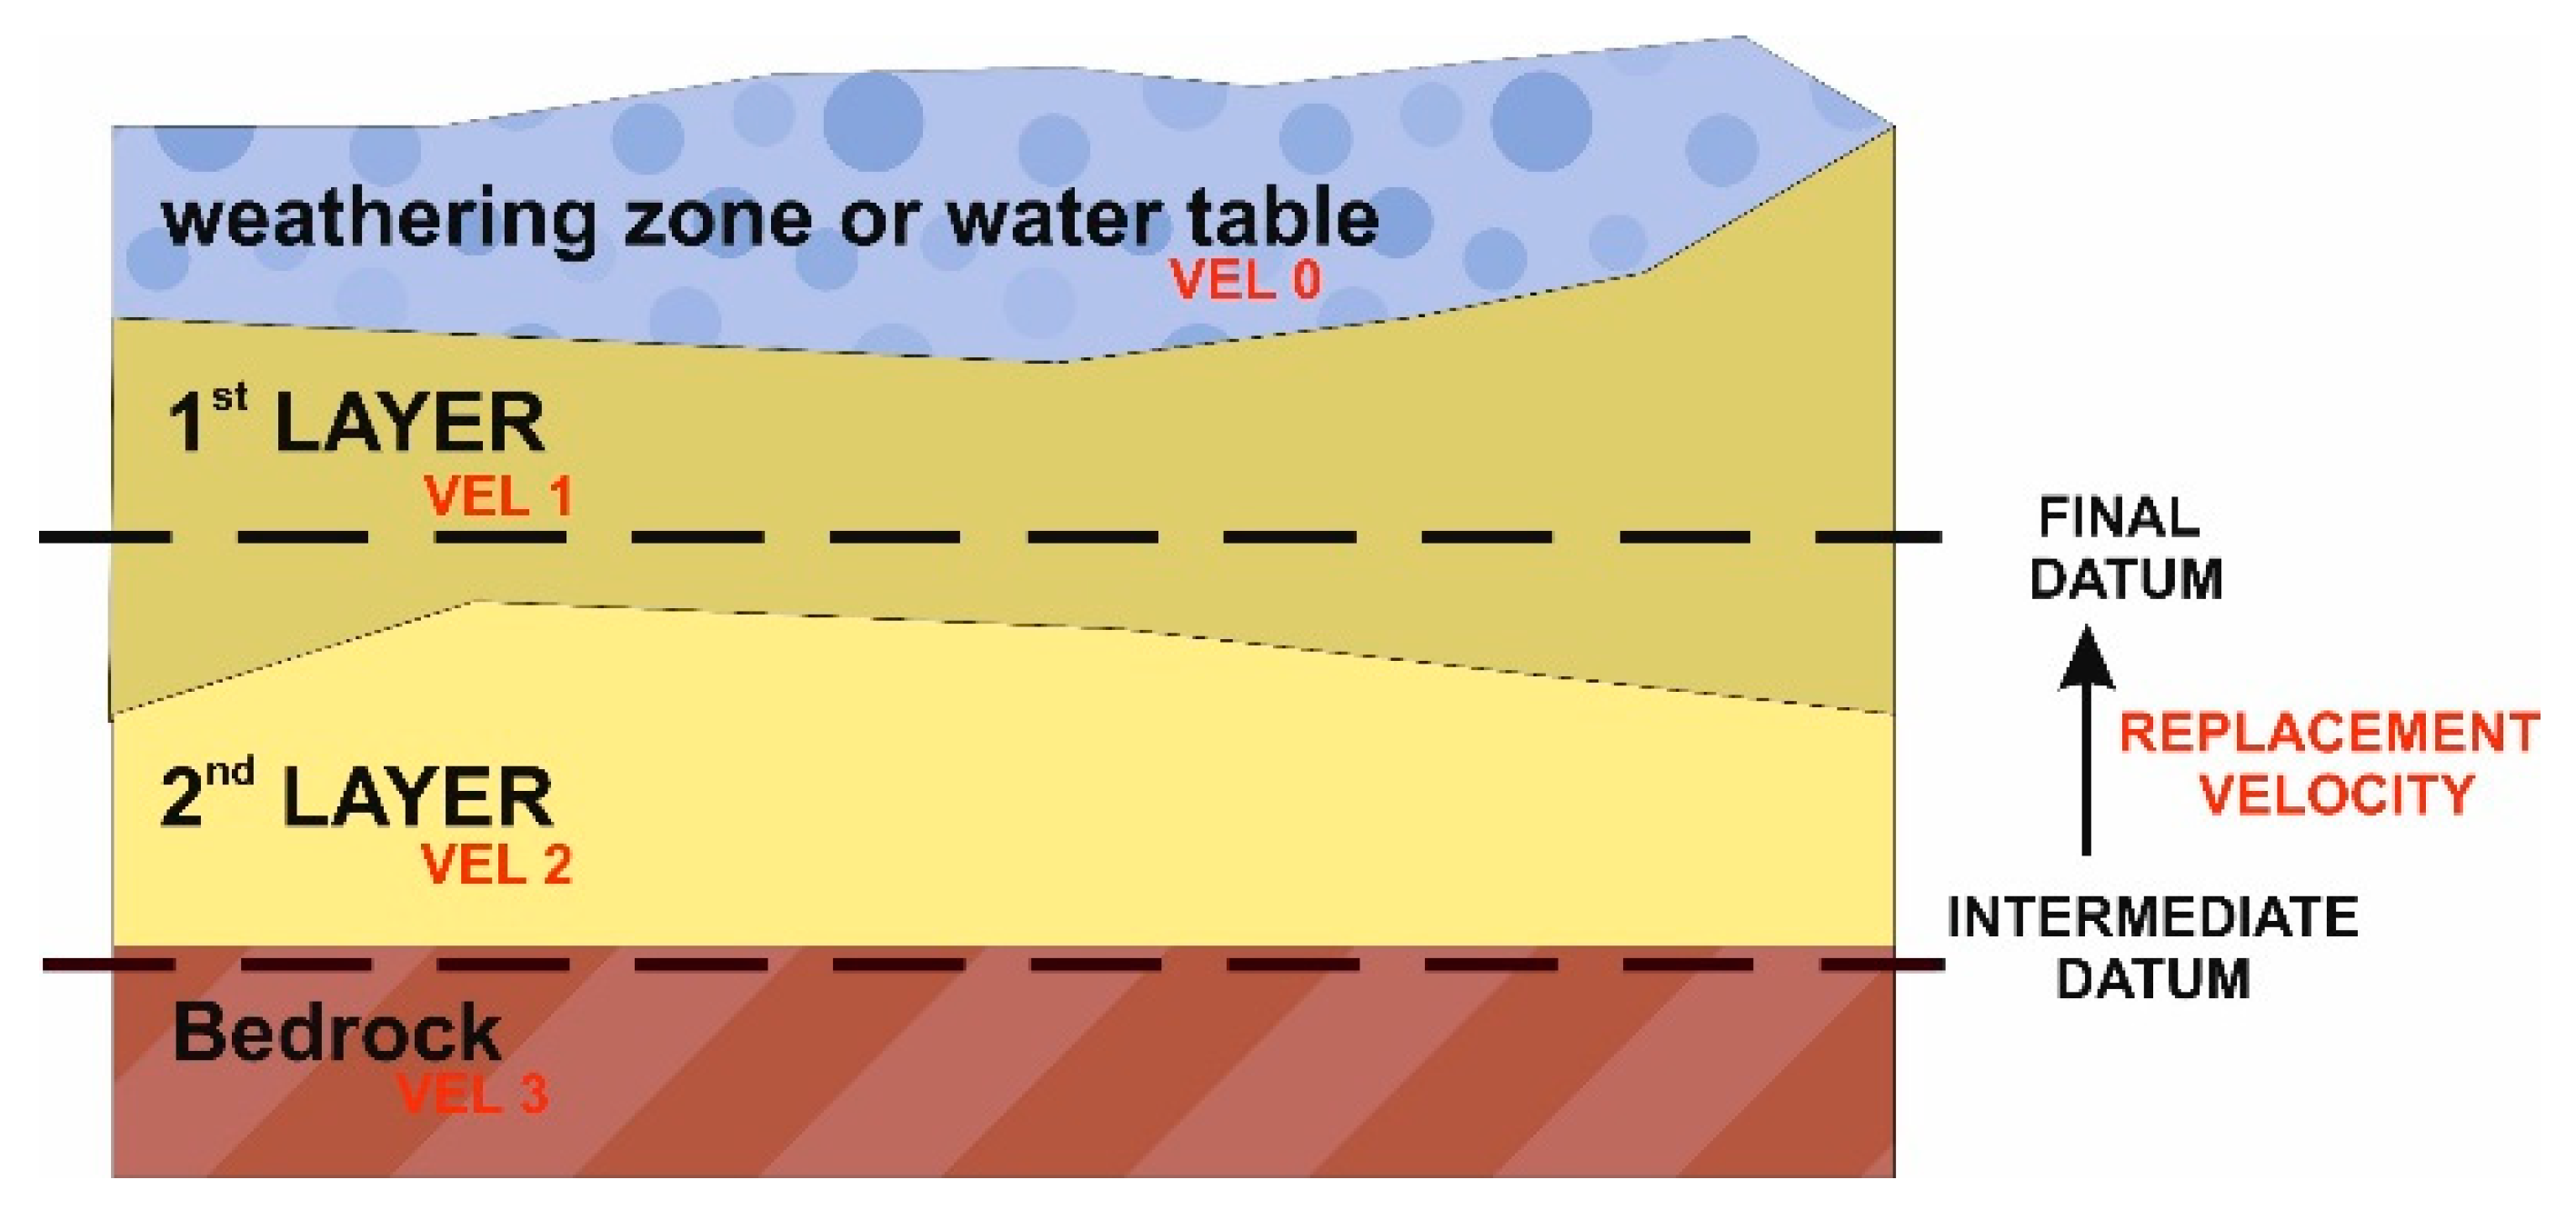
TM software in the Omega Schlumberger Processing Platform. In
Figure 4, the general purpose of first-order static corrections is shown. In this processing stage, the influence of NZS (from the surface to intermediate datum) is removed by applying the time shift correction for each receiver and shot point in a surface-consistent manner. Then, data are shifted from the intermediate datum to final datum using the replacement velocity.
The delay time method can be described as follows: we assume that the distance traveled by rays along the refractor (see
Figure 5) is described as the difference between the line distance from the source to the receiver (O) and the sum of the horizontal components of the ray path from source to refractor and receiver to refractor (d
S and d
R):
Then, the refraction travel time t from the source to the receiver is equal to the sum of time traveled from the source to the refractor (distance RS) with the velocity of the first layer, time traveled along the refractor with refractor velocity, and the time traveled from the refractor to the receiver (distance RR) with the velocity of the first layer. Equations (2) and (3) are called “time equations”:
Delay times from the shot and the receiver can be determined using Equations (4) and (5):
Now, the refraction travel time can be calculated as shown in the following equation:
Then, the delay time equations are presented in Equations (7) and (8):
The cosine function of the refraction angle is equal to:
Then, the final form of delay times is as follows:
Using Equations (1)–(11), the effect of a refractor’s velocity anisotropy is not included. It can be observed on shot gathers first breaks (FBs) after applying the delay time solution’s time shift. On the shot gather with isotropic refractor (in case of P-wave velocity), FBs are around zero time, if the refractor is anisotropic—FBs have the shape of a sine function around zero time. In the case of 2D surveys, velocity dependence on the direction can be omitted. The reason for this is that only two azimuths on the one line (one direction) are available. Three-dimensional seismic surveys have different geometry with (in general) full azimuth fold. A typical 3D land acquisition is shown in
Figure 6. The colors on the map represent the different velocities of the same refractor. The velocity measured on azimuth 1 (AZI 1) and azimuth 2 (AZI 2) will be similar, however, when we consider azimuth 0 and AZI 1, the difference will be visible. It is important to include this change in processing when static corrections are estimated when the survey is performed for seismic high-definition fracture identification. To include this effect, the correction according to Equation (12) (proposed by Matt Duiker from XtremGeo LLC [
12]) should be performed:
where the function of AZI can be determined using the following formula:
where M is a magnitude of anisotropy (the largest distortion from the isotropic circular pattern) in ms, and j is the azimuth of the largest delay time for a particular shot point. Using this procedure, elliptical anisotropy is considered as a purely mathematical problem and without geophysical interpretation of observed effects in the NSZ model. So, essentially, we mathematically include the effect observed as elliptical anisotropy to improve statics. These effects can be due to anisotropy itself or can be the result of other effects such as inheterogenities.
In practice, the procedure goes as follows:
Geometry quality control (QC)
First-breaks (FBs) picking (in shot plane)
Refraction branches assignment
FB picks editing (values outside the branches’ zone and the time corridor around branch center removal)
Delay time solution calculation
NZS model creating
Static corrections calculation
QC stack
Anisotropy terms (magnitudes and azimuths) calculation
Updating DTA solution with values from point nr 9
Static corrections update
QC stack
4. Results
In this paper, 3D seismic data from the Carpathian Inner-Mountain Basin were analyzed. The analysis method was a third reprocessing. The quality of input gathers was good. Before the calculation of the static corrections, basic denoising was applied. More advanced procedures were applied afterward. First, break-picking was performed using a neutral network, and then some of them were corrected manually. The quality control of first breaks was performed in Flatirons
TM software and was again corrected (if needed). Static corrections were calculated using the standard DTA approach (isotropic). The results can be seen in
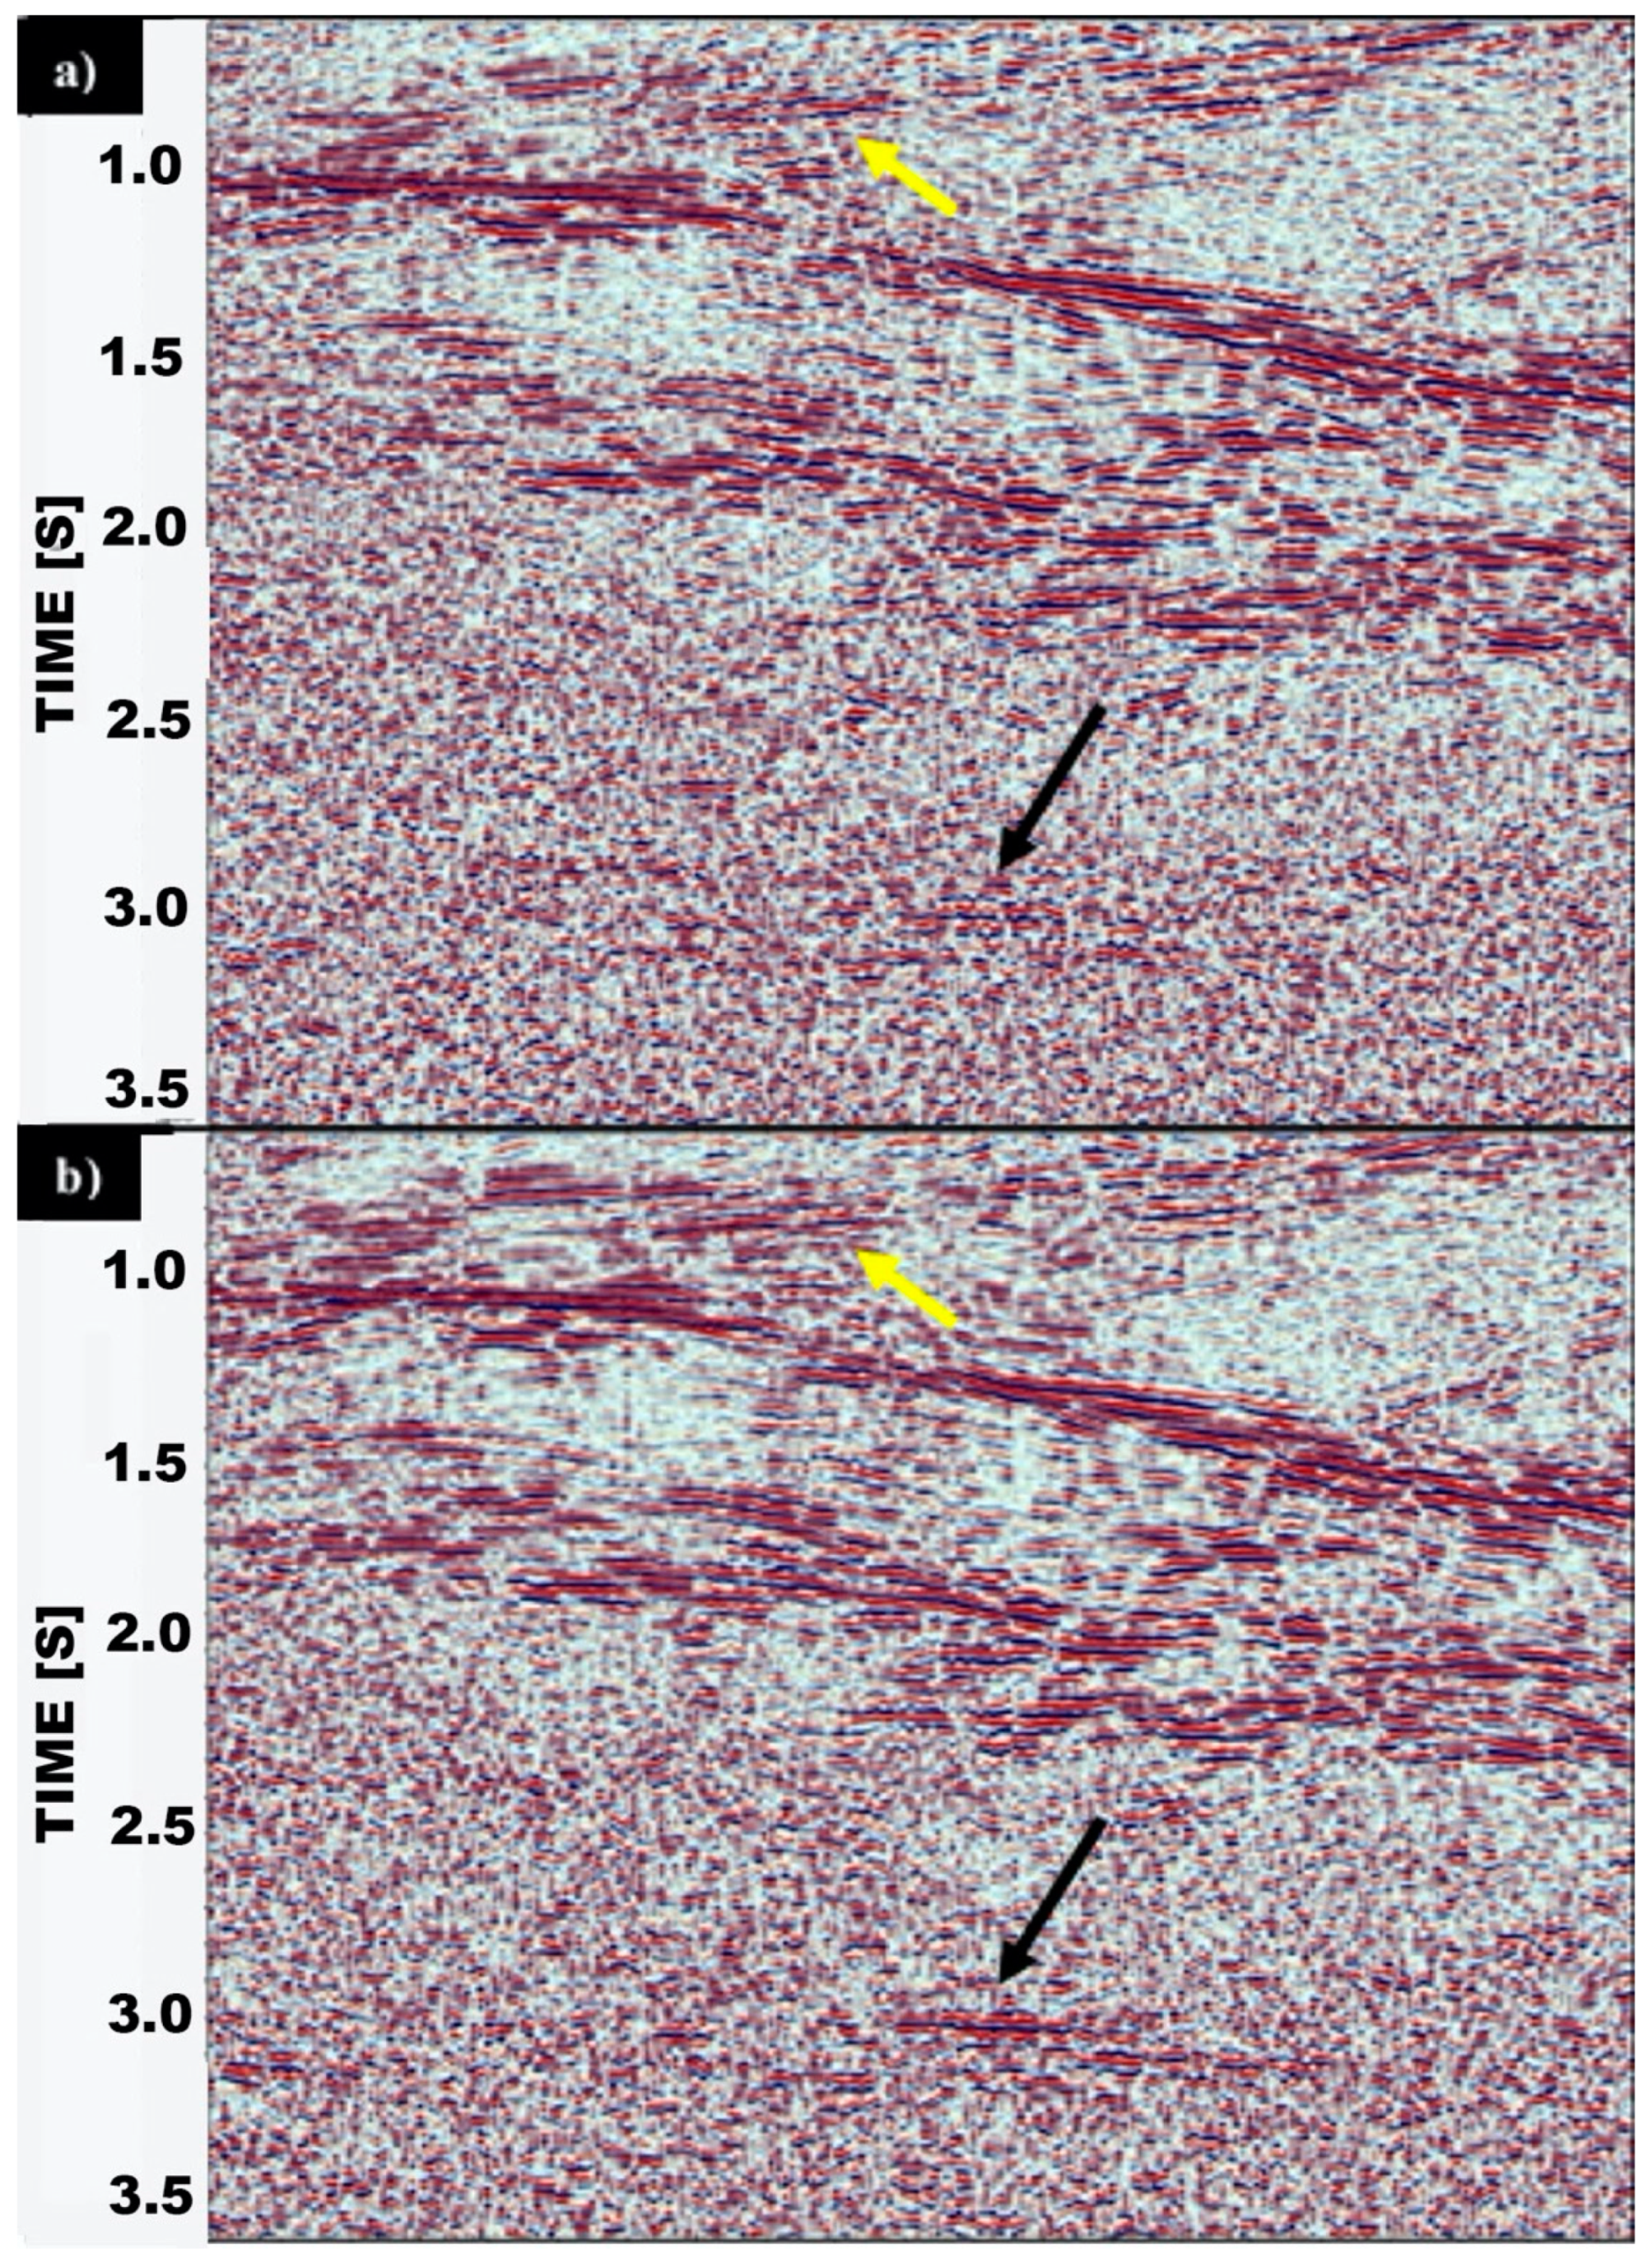
Figure 7a (in-line stack) and
Figure 8a (cross-line stack). It can be noticed that the continuity of the horizons from Zakopane, Szaflary, and Chochołów Beds and Upper Sub-Tatric Units (yellow and orange arrows) and Lower Sub-Tatric Units (black arrow) is good. However, there are many points of discontinuity that do not correspond to faults or other possible geological features. After this, the anisotropic correction according to Equations (12) and (13) was calculated and applied.
Figure 7b and
Figure 8b show the stacks with static correction, including the effects of NSZ anisotropy. It is clearly visible that the continuity of horizons was improved. Additionally, the new horizons can be found in
Figure 7b (yellow arrow) after anisotropic statics application. A similar situation can be observed in
Figure 8b (orange arrows). It is clearly visible that the quality of the stack is significantly higher. It is easier to perform a reliable interpretation of data after including the anisotropic effect of the NSZ for static correction calculations, especially when we consider a horizon like the one marked in
Figure 8 (yellow arrows). For the isotropic, the standard approach of static calculation, the energy, and continuity of this horizon are very low.
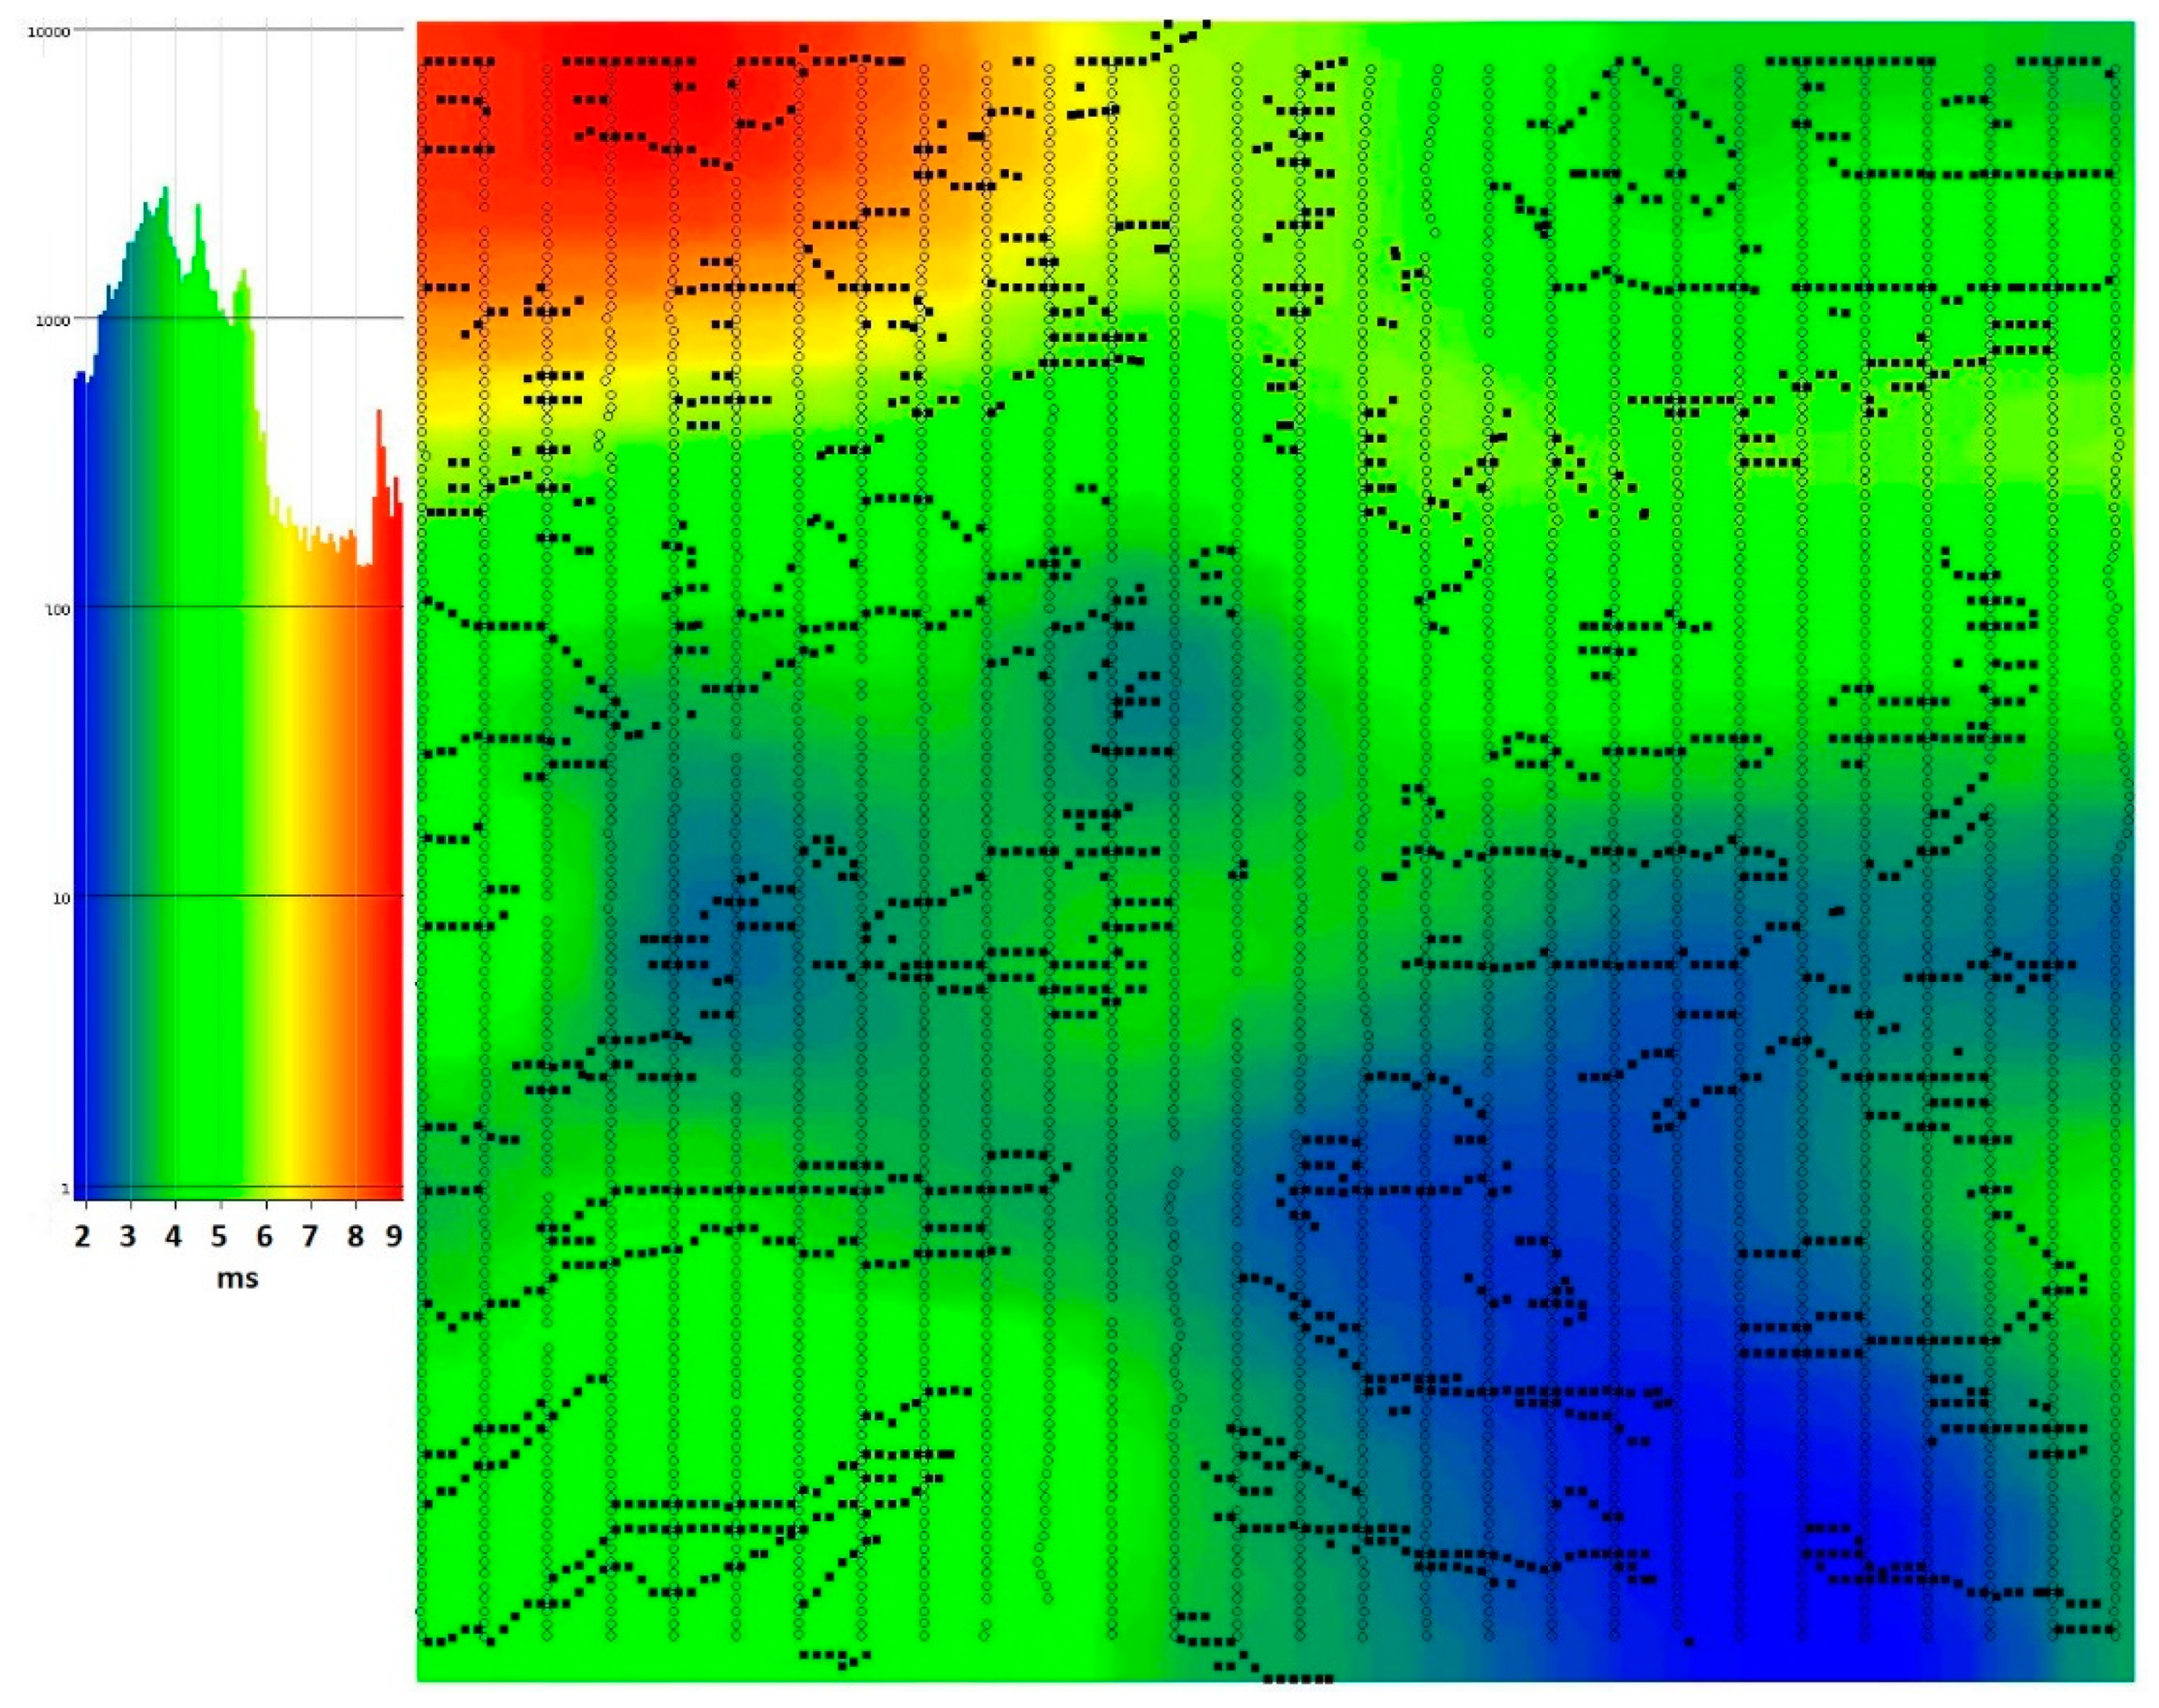
Figure 9 and
Figure 10 show the calculated anisotropy parameters. The correlation between obtained azimuths and fault directions, as shown in
Figure 3, is clearly visible.
5. Conclusions
Presently, the search for new geothermal energy sources and for the reliable structural interpretation of such sources shows that the use of a novel approach for seismic static calculations is needed. Including the effect of refractor anisotropy in time shift corrections in places where the NSZ layers have favored the direction of P-wave propagation has the desired effects in final seismic stack quality. The presented case study from Carpathians Inner Mountain Basin shows the results of applying anisotropy-corrected first-order static corrections for the advanced processing of 3D seismic data collected in Southern Poland. Notably, including the effects of NSZ anisotropy for static correction calculations provided a significantly better quality of a seismic image.
It was shown that DTA with anisotropy effect correction should be used for advanced 3D seismic data processing. It allows not only for more reliable interpretation, but also for the enhancement of seismic horizons by the redistribution of a significant amount of structural information in the form of properly placed seismic energy. Additionally, it allows for obtaining subtle information regarding geological structures such as small anticlines. According to the presented study, it is necessary to include NSZ anisotropy effects for seismic static calculations where the anisotropy of the NSZ is strong enough to affect first-break linearity after applying standard static corrections.
