Transgressive Architecture of Coastal Barrier Systems in the Ofanto Incised Valley and Its Surrounding Shelf in Response to Stepped Sea-Level Rise


Abstract
1. Introduction
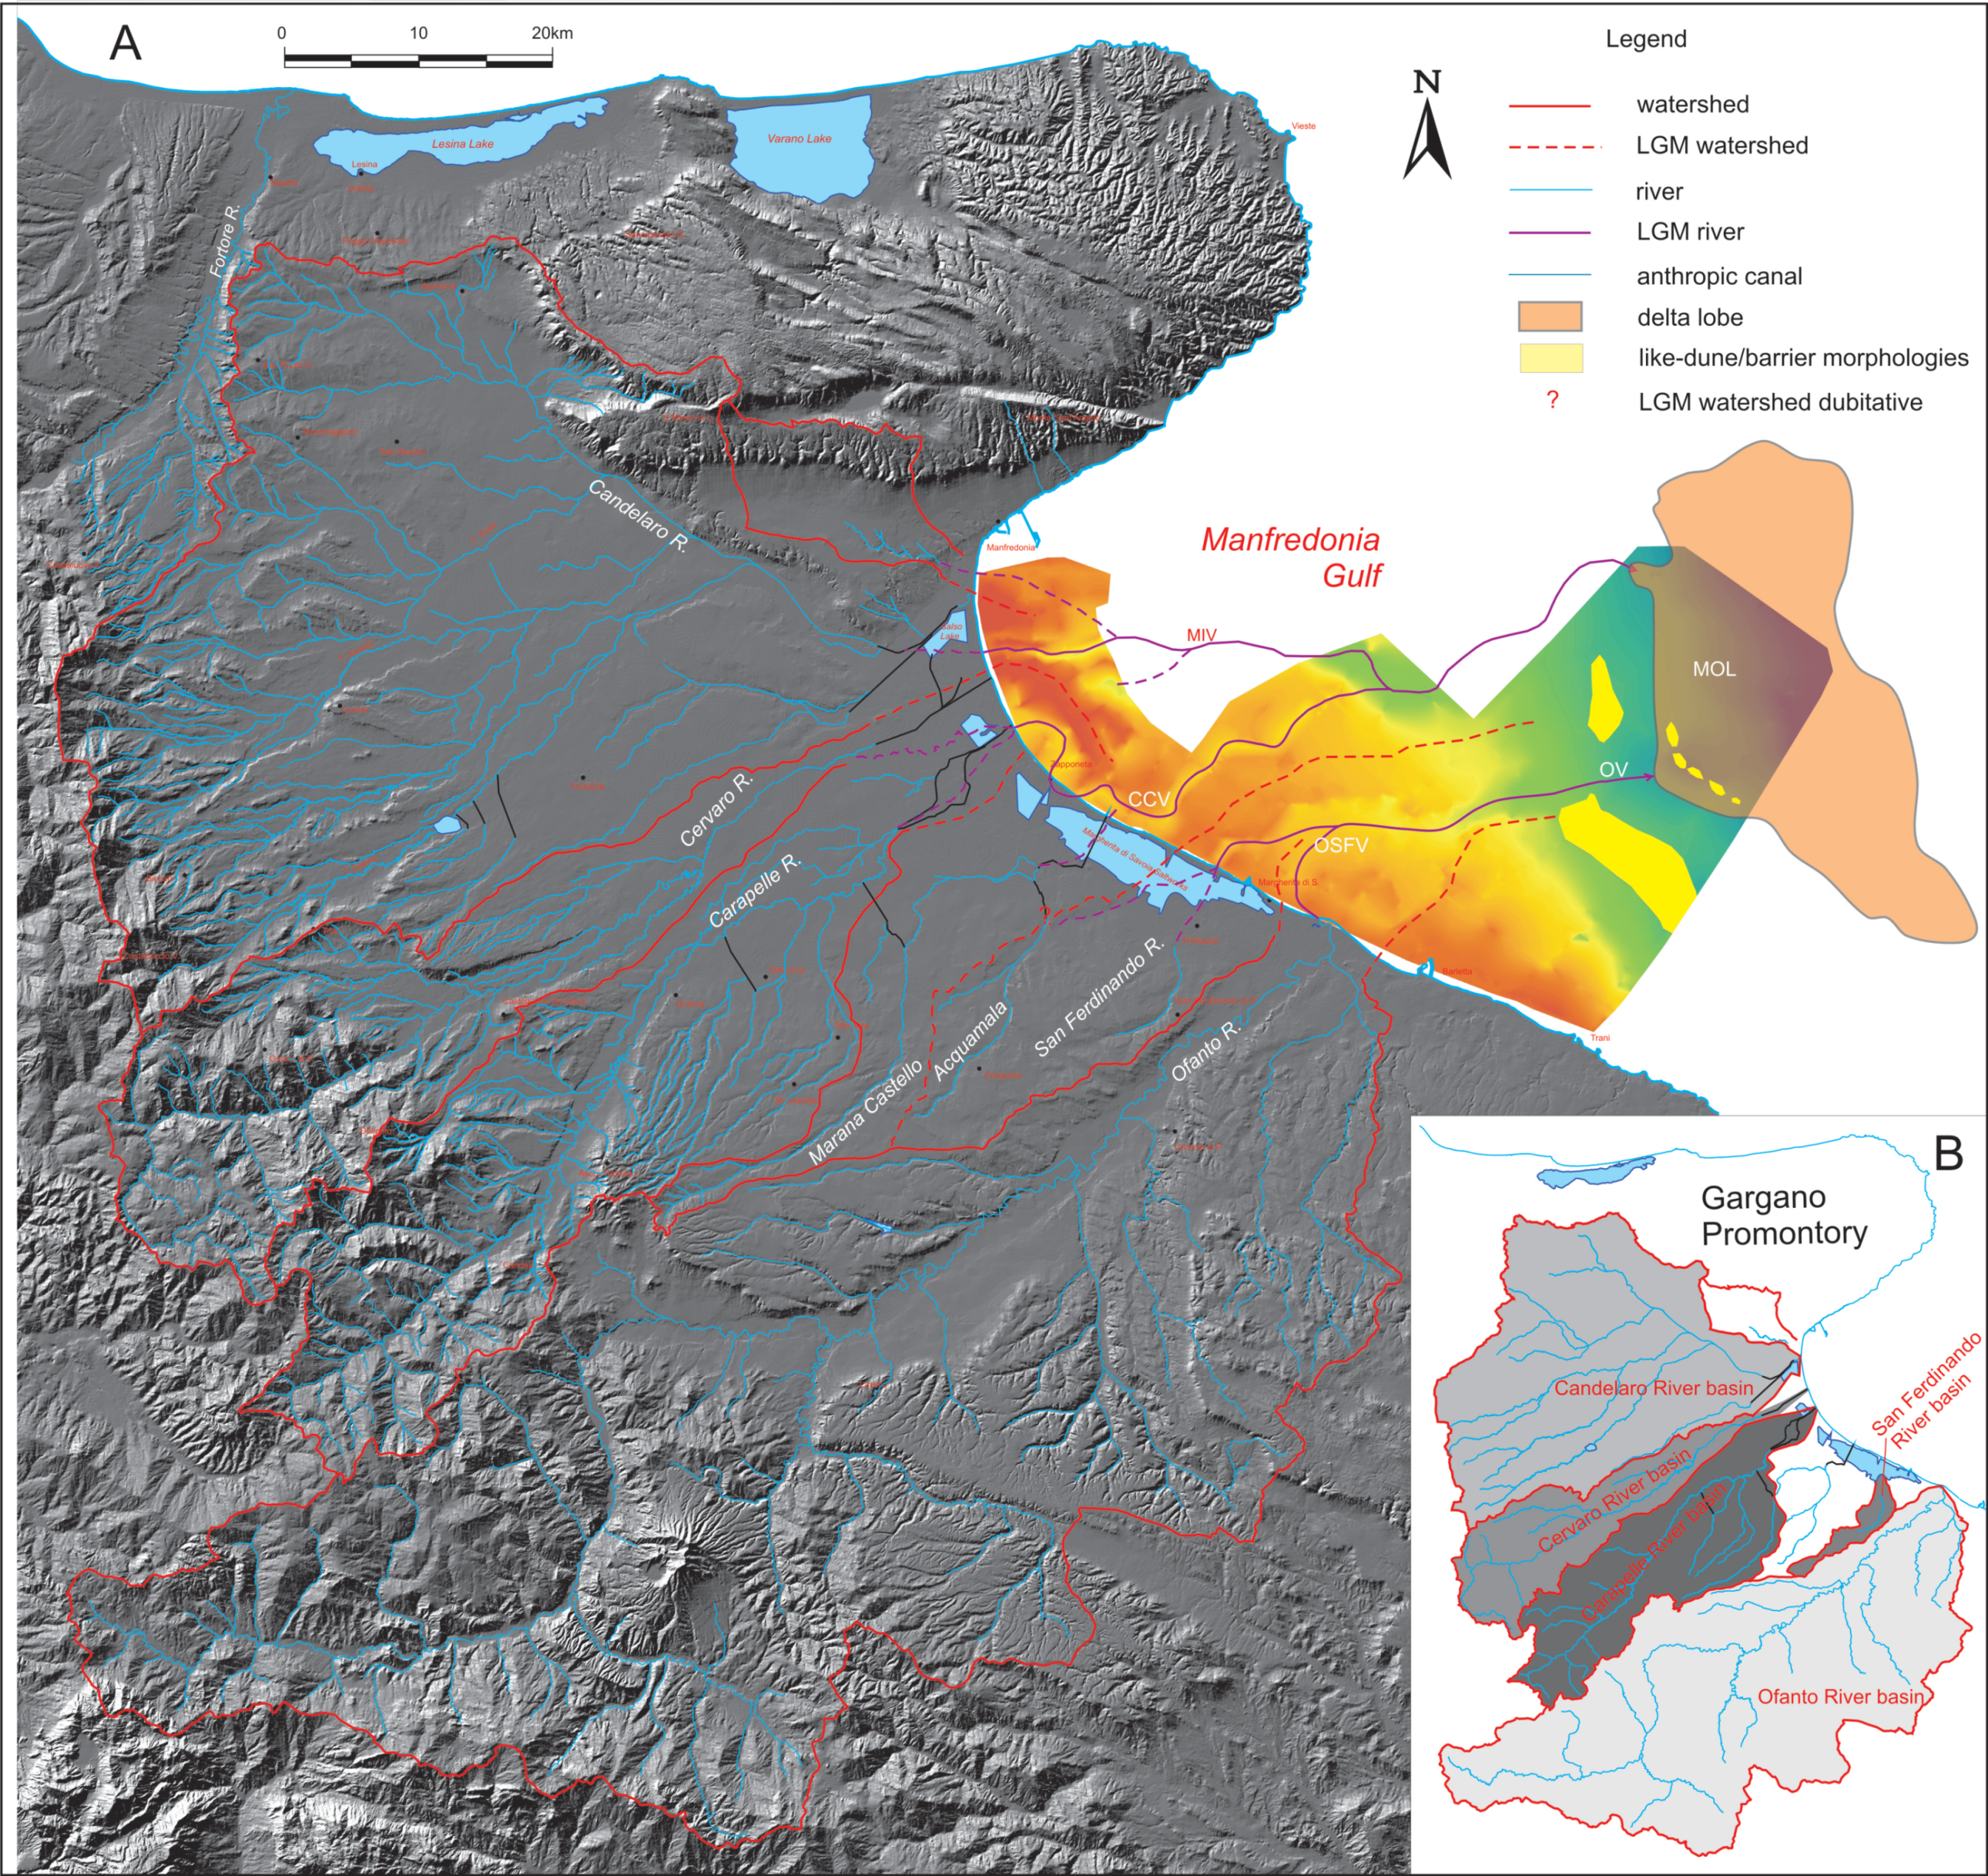
2. Regional Setting
3. Methods
3.1. Seismic Surveys, Seismic Facies and Unconformity-Bounded Seismic Units
3.2. Sea-Level Rise and Age Range Evaluation Method
4. Data and Results
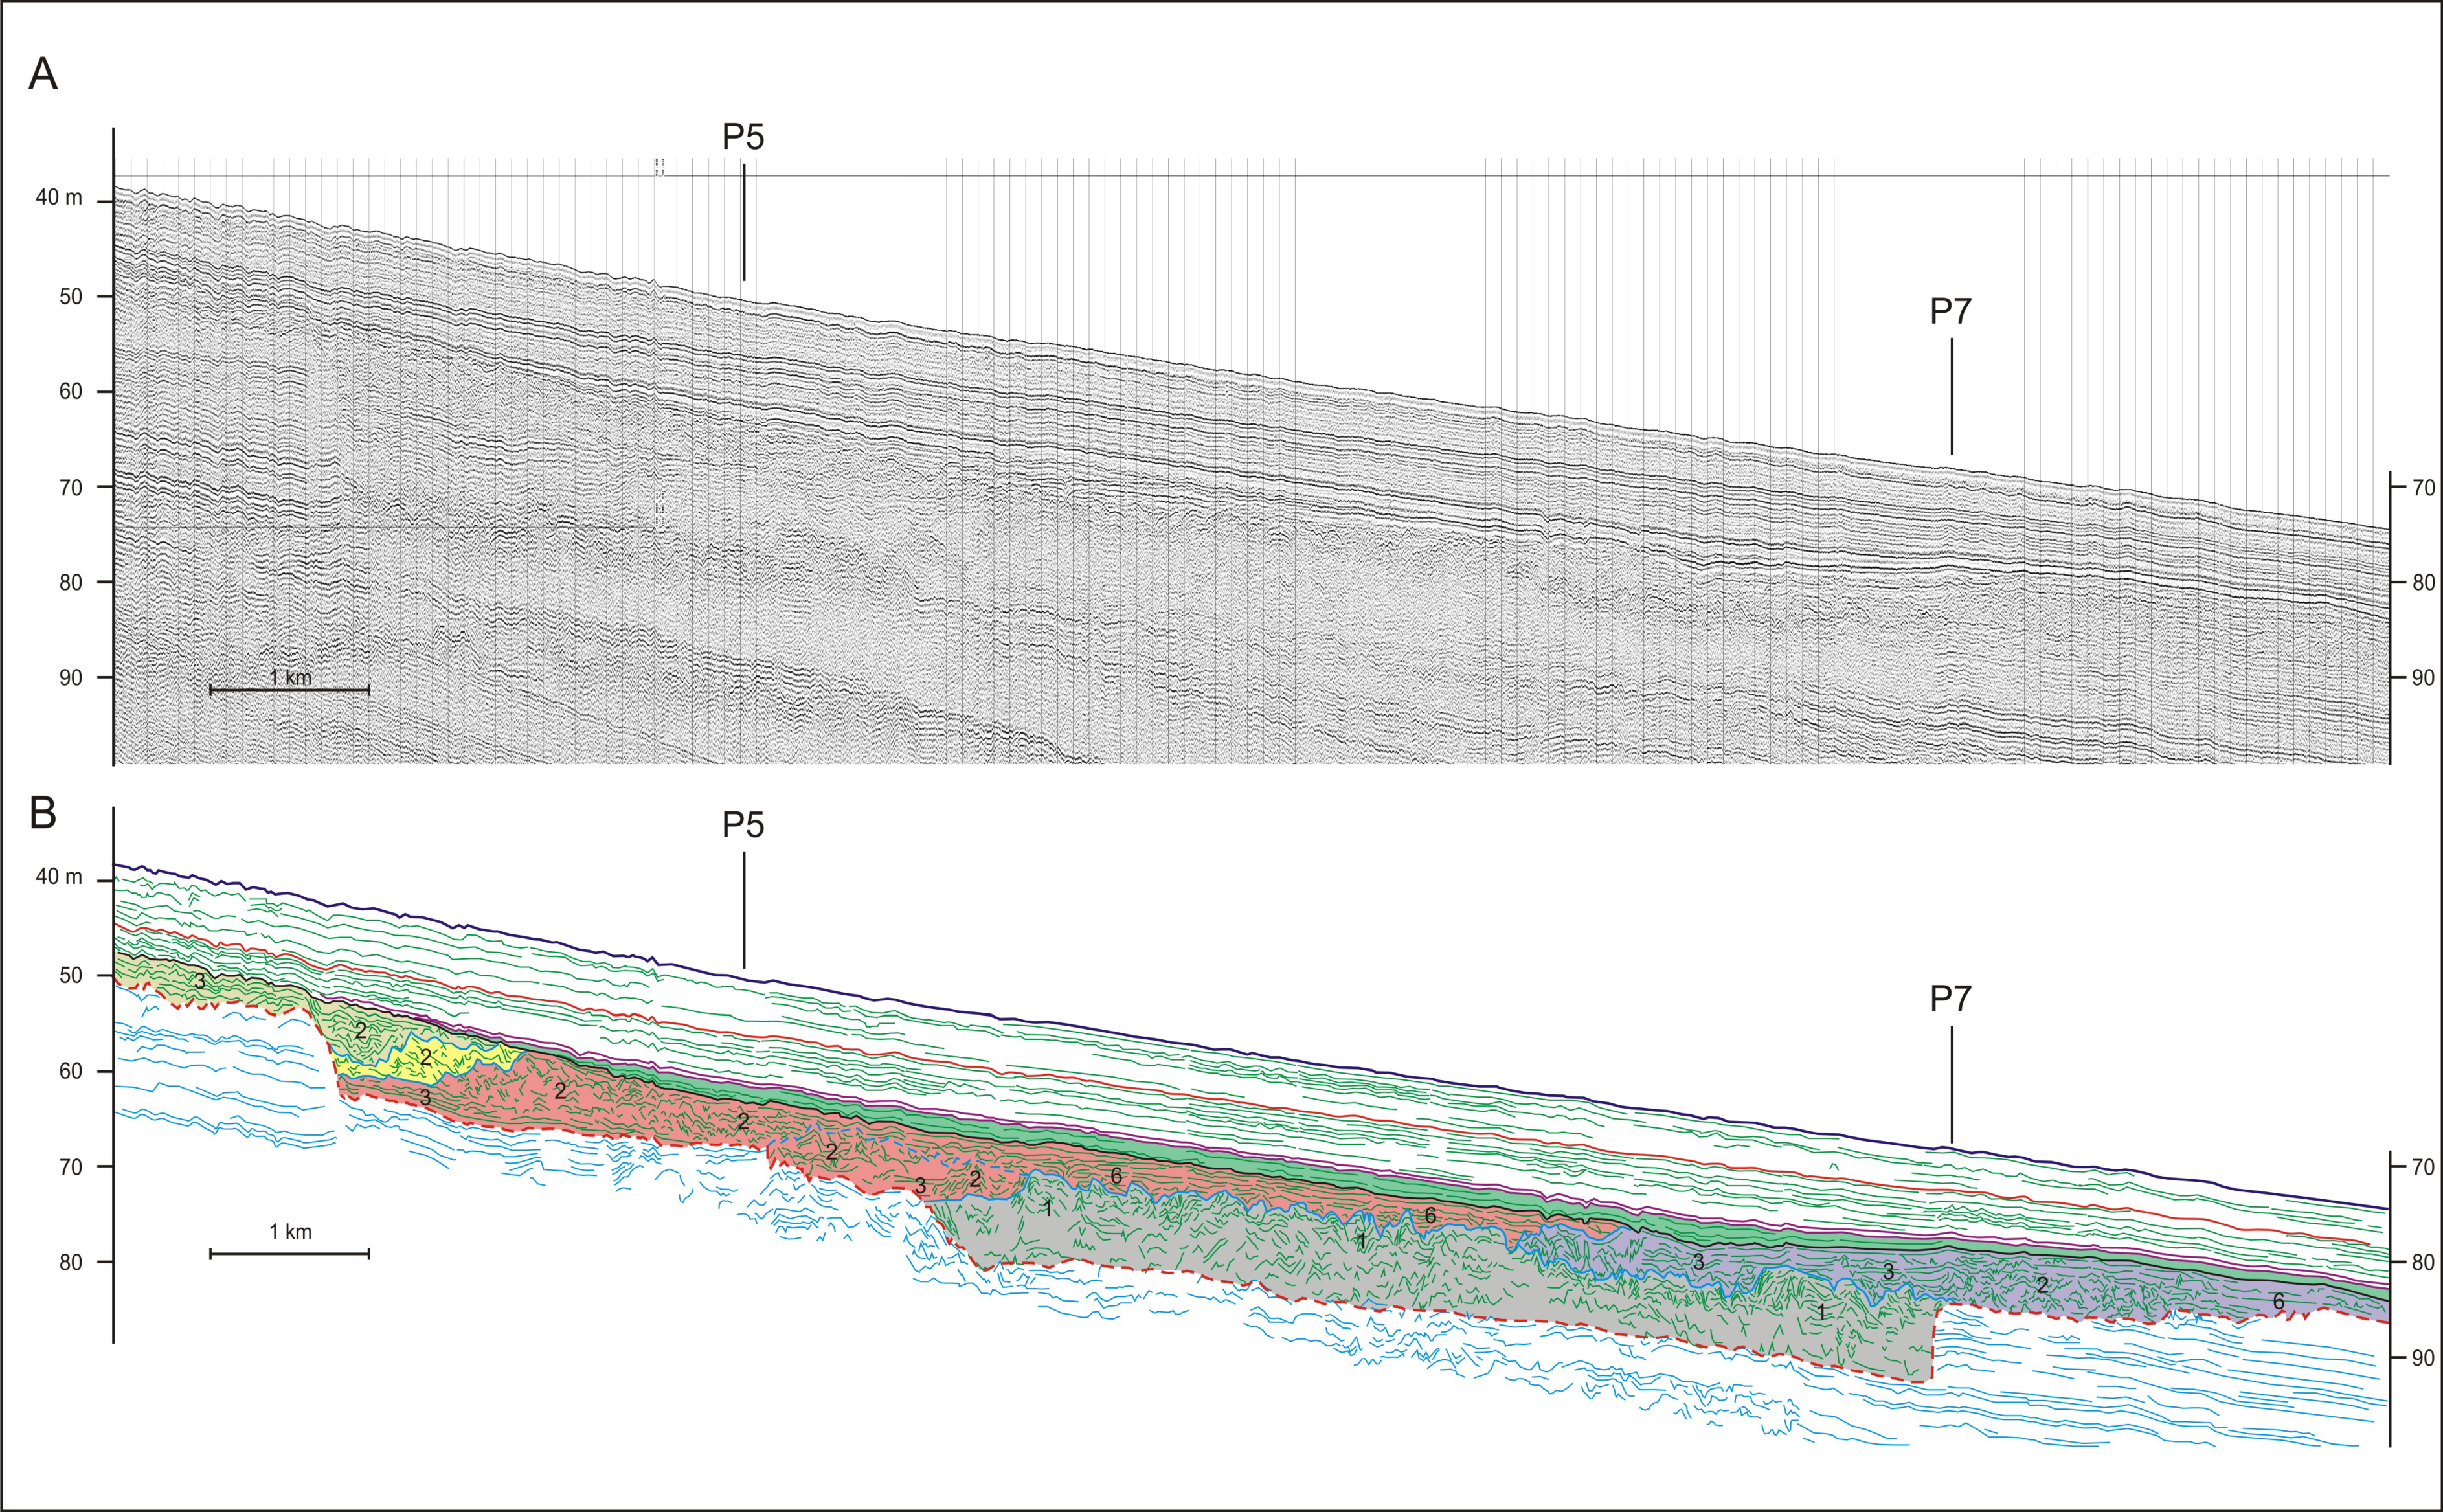
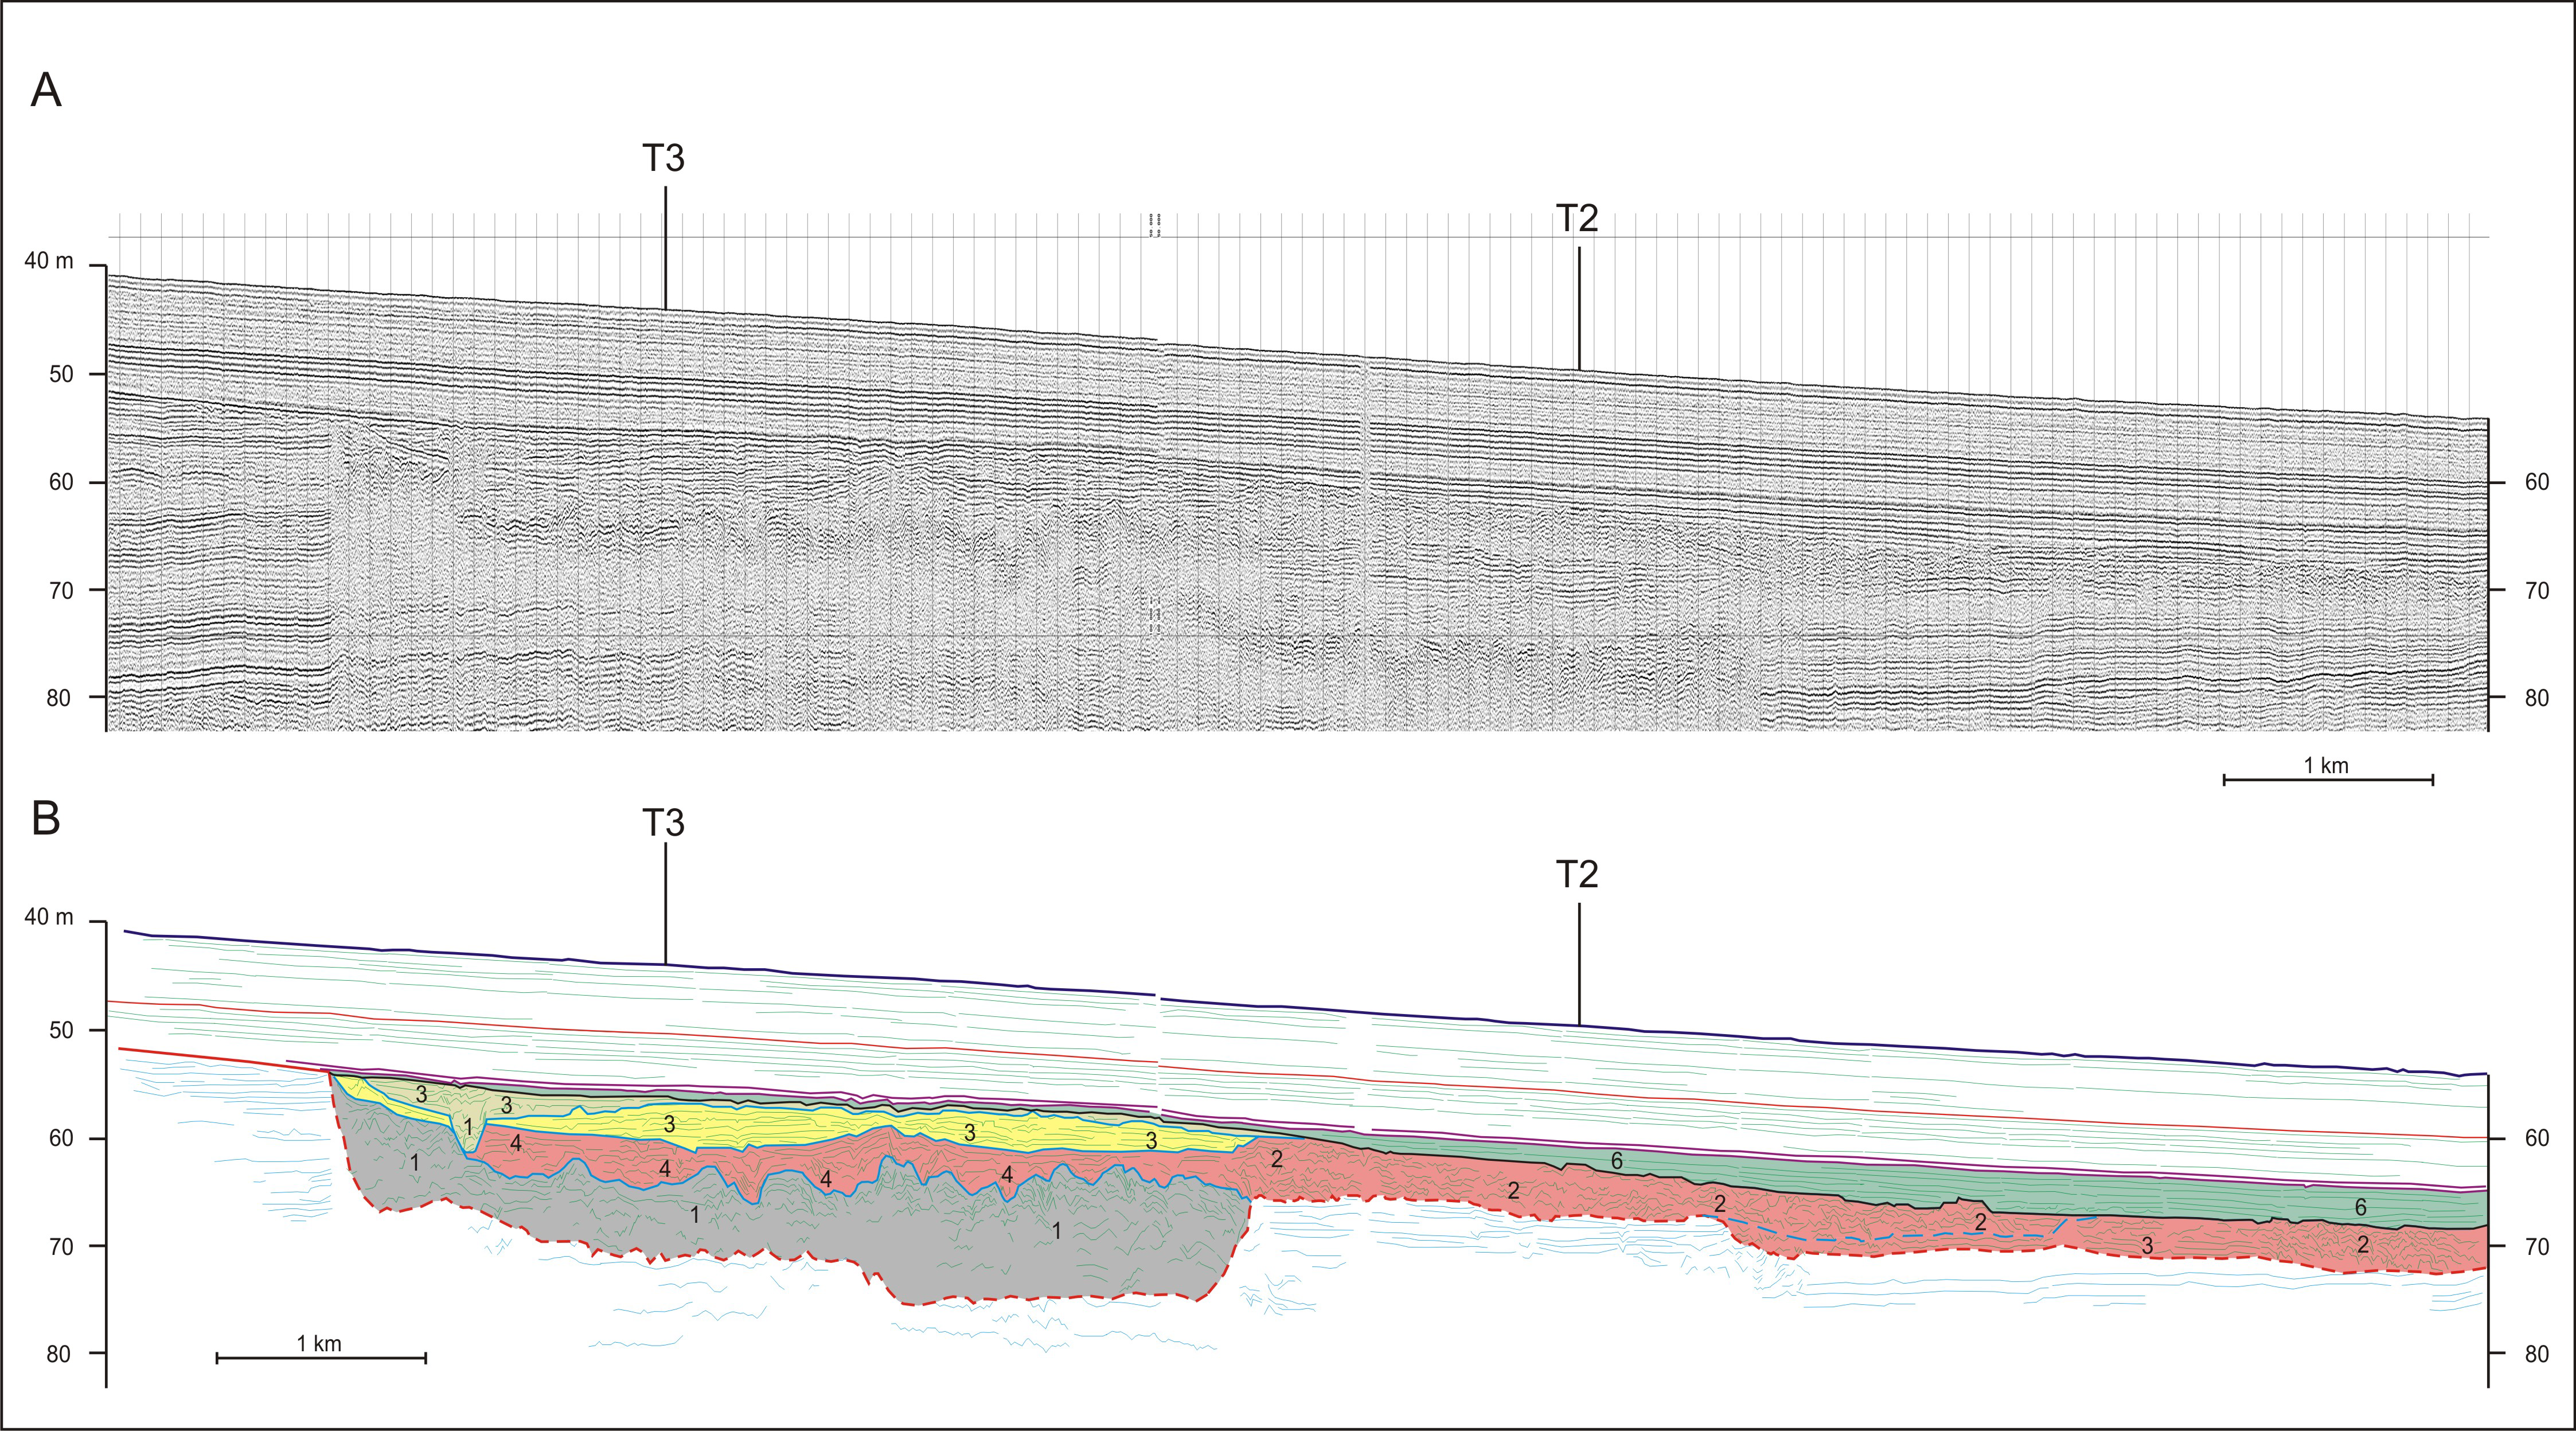
4.1. Ofanto Valley
4.2. Transgressive System Tract
4.2.1. Seismic Facies
4.2.2. Unconformity-Bounded Seismic Units
5. Discussion
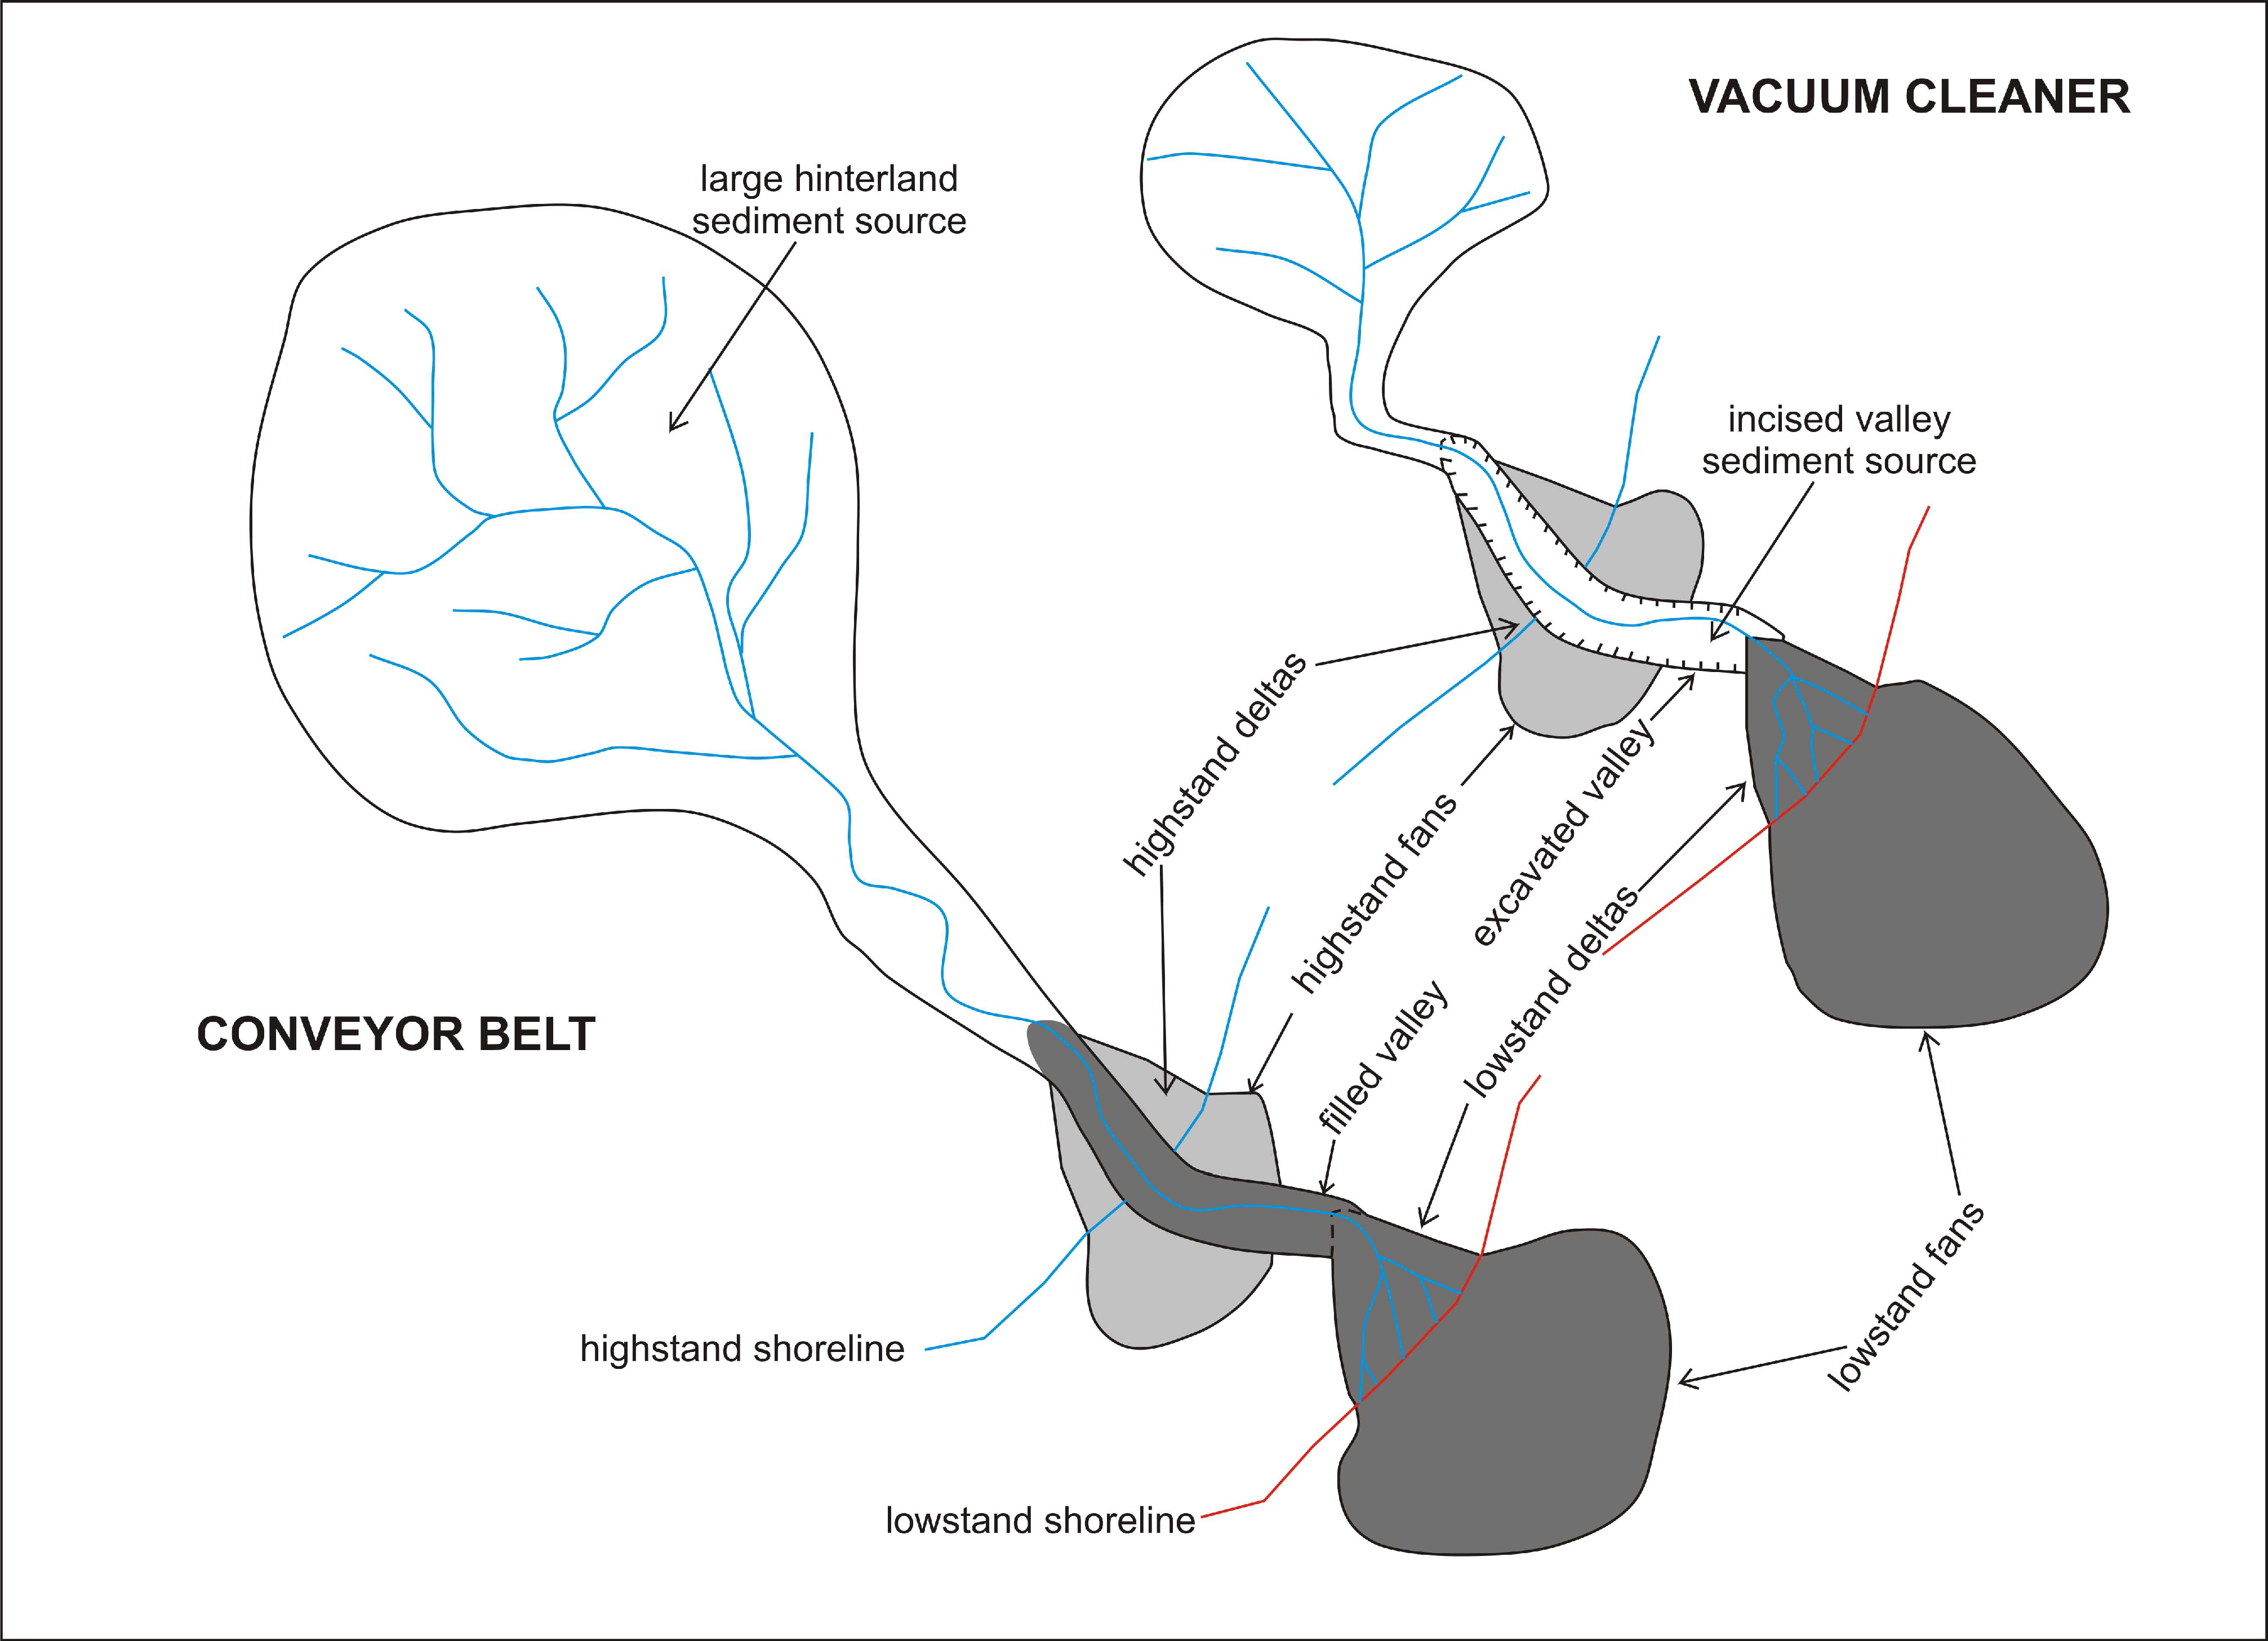
5.1. Ofanto Incised Valley and Its Differences from the Main Adjacent Incised Valleys
5.2. Transgressive System Tract
5.2.1. Unit BU1l
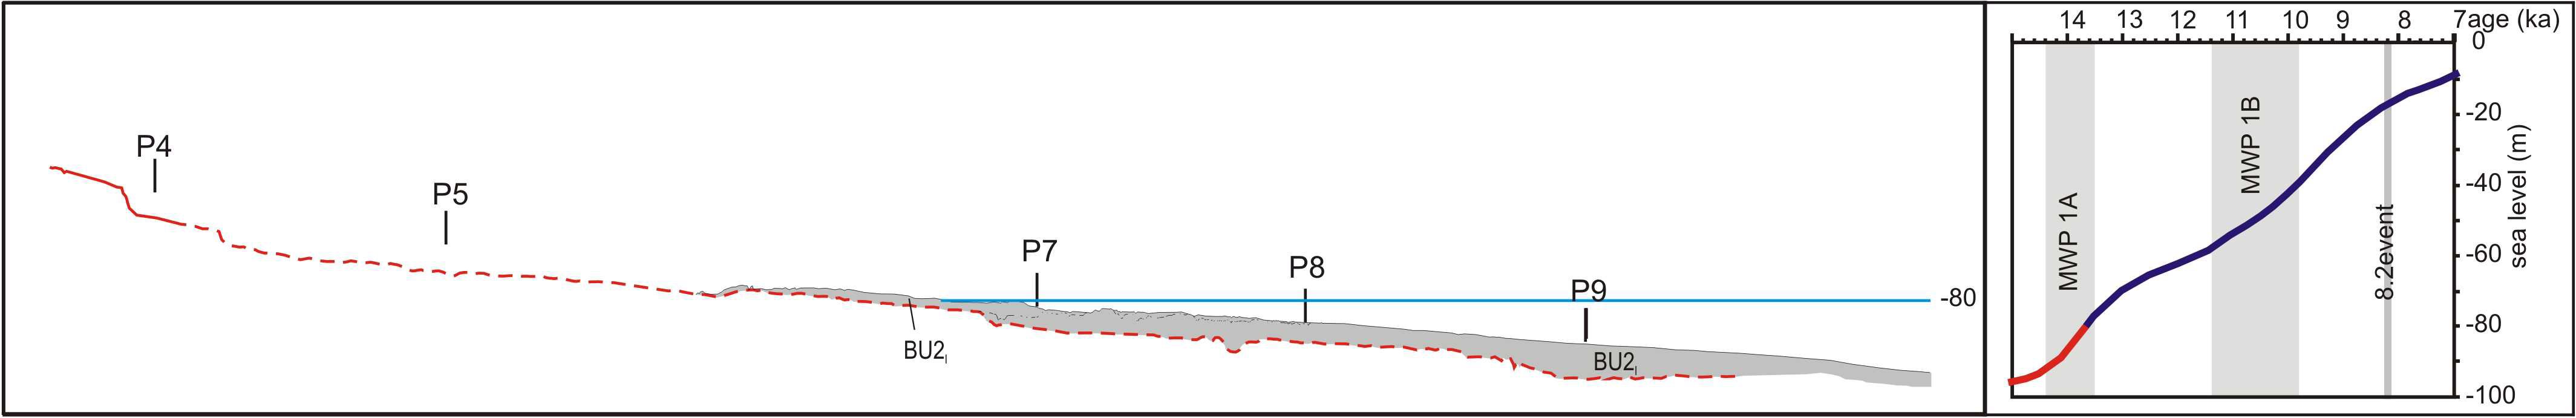
5.2.2. Unit BU2l
5.2.3. Unit Al
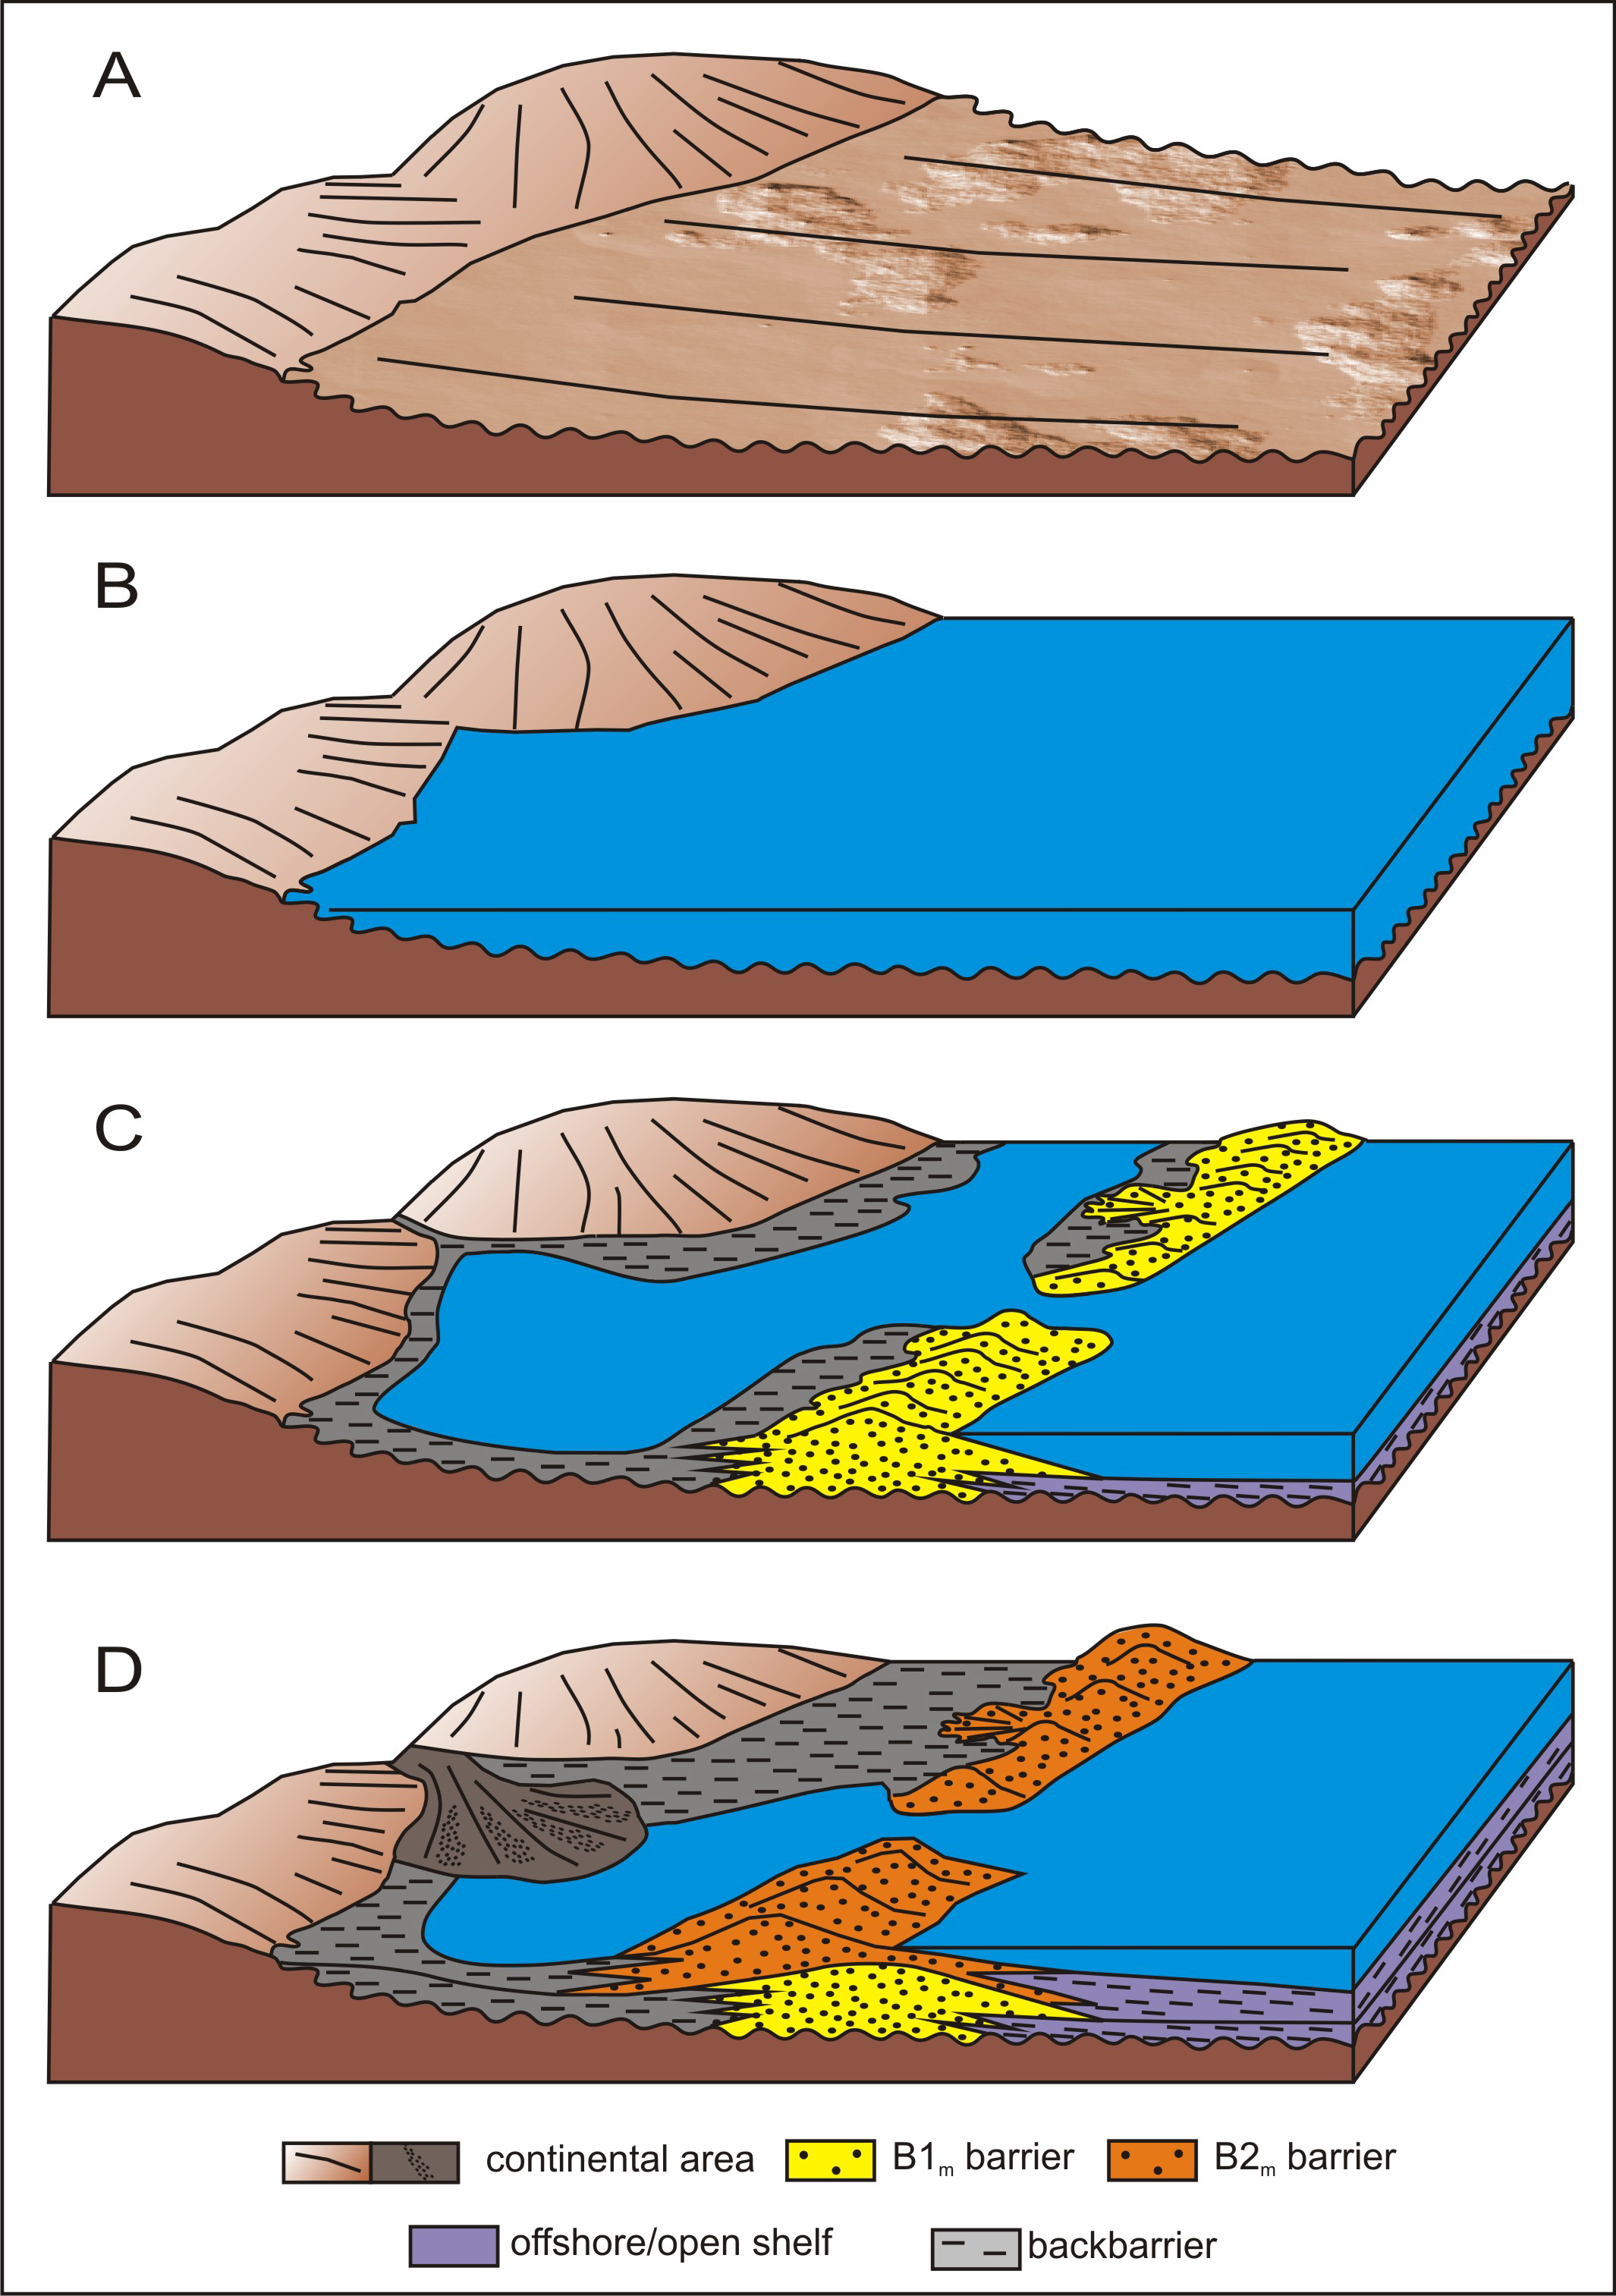
5.2.4. Unit Bm
5.2.5. Units Cm and Dm
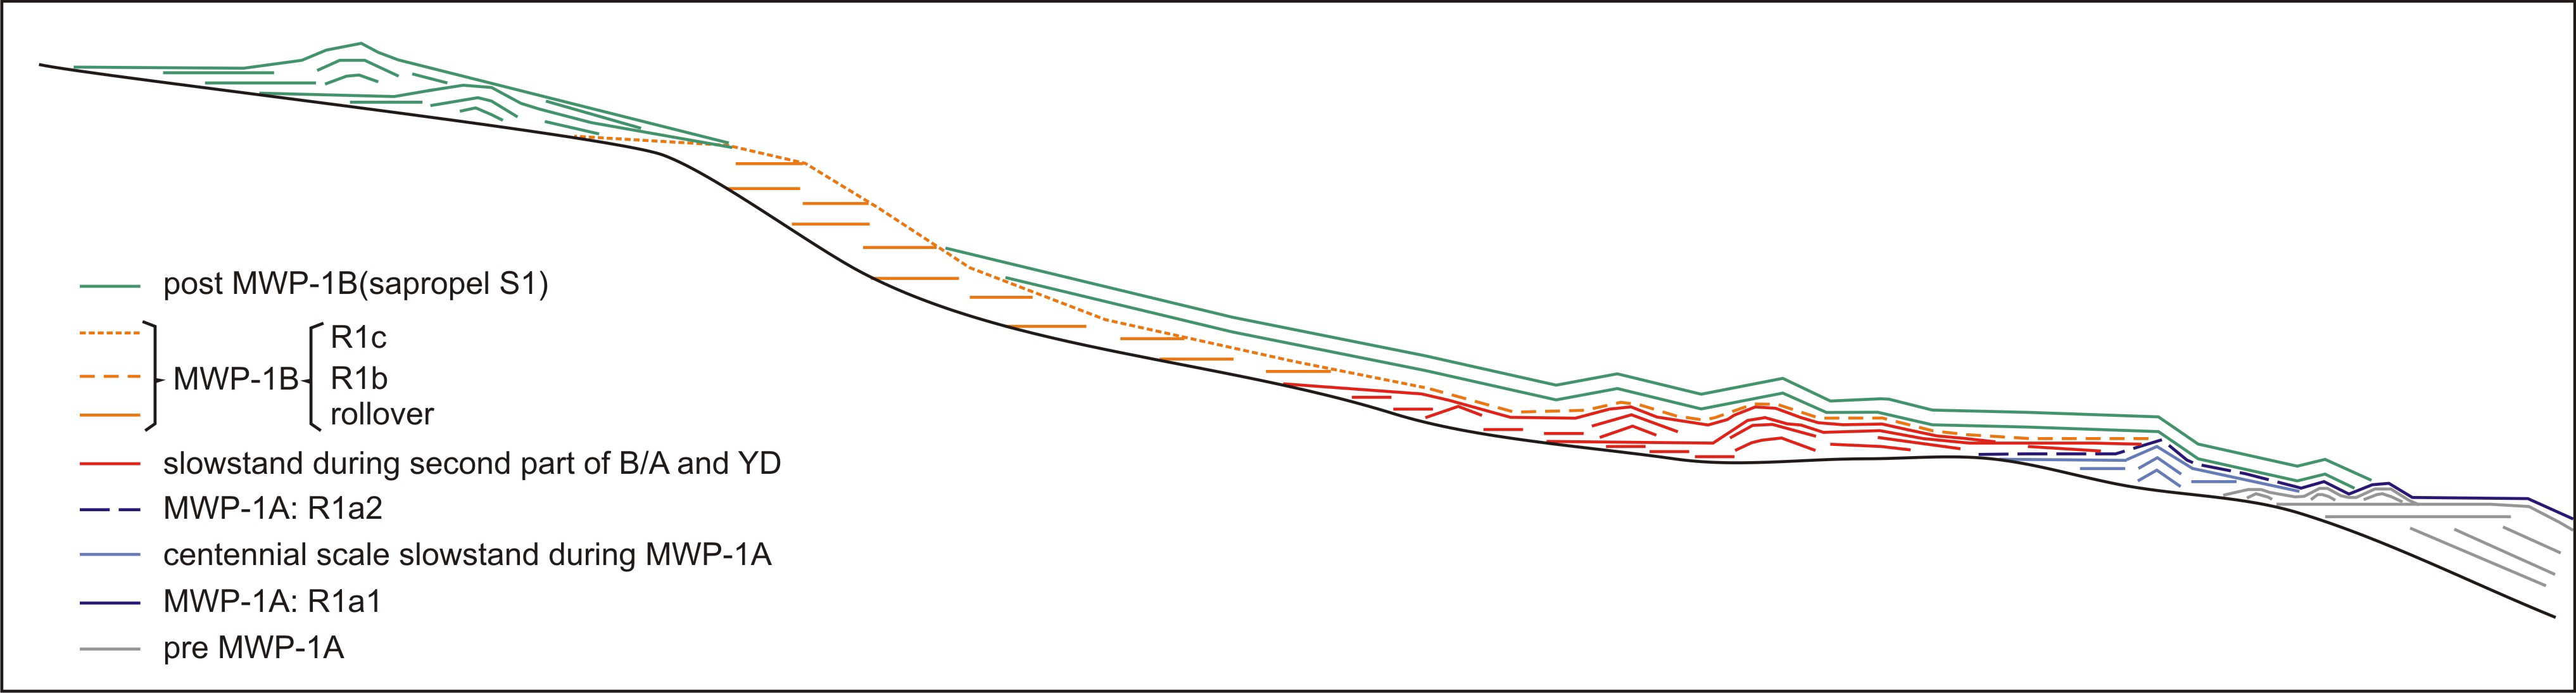
5.2.6. Reflector R1
5.2.7. Unit Su and Reflectors RR
5.2.8. Dune-Like Fields within Units Al and Bm
6. Conclusions
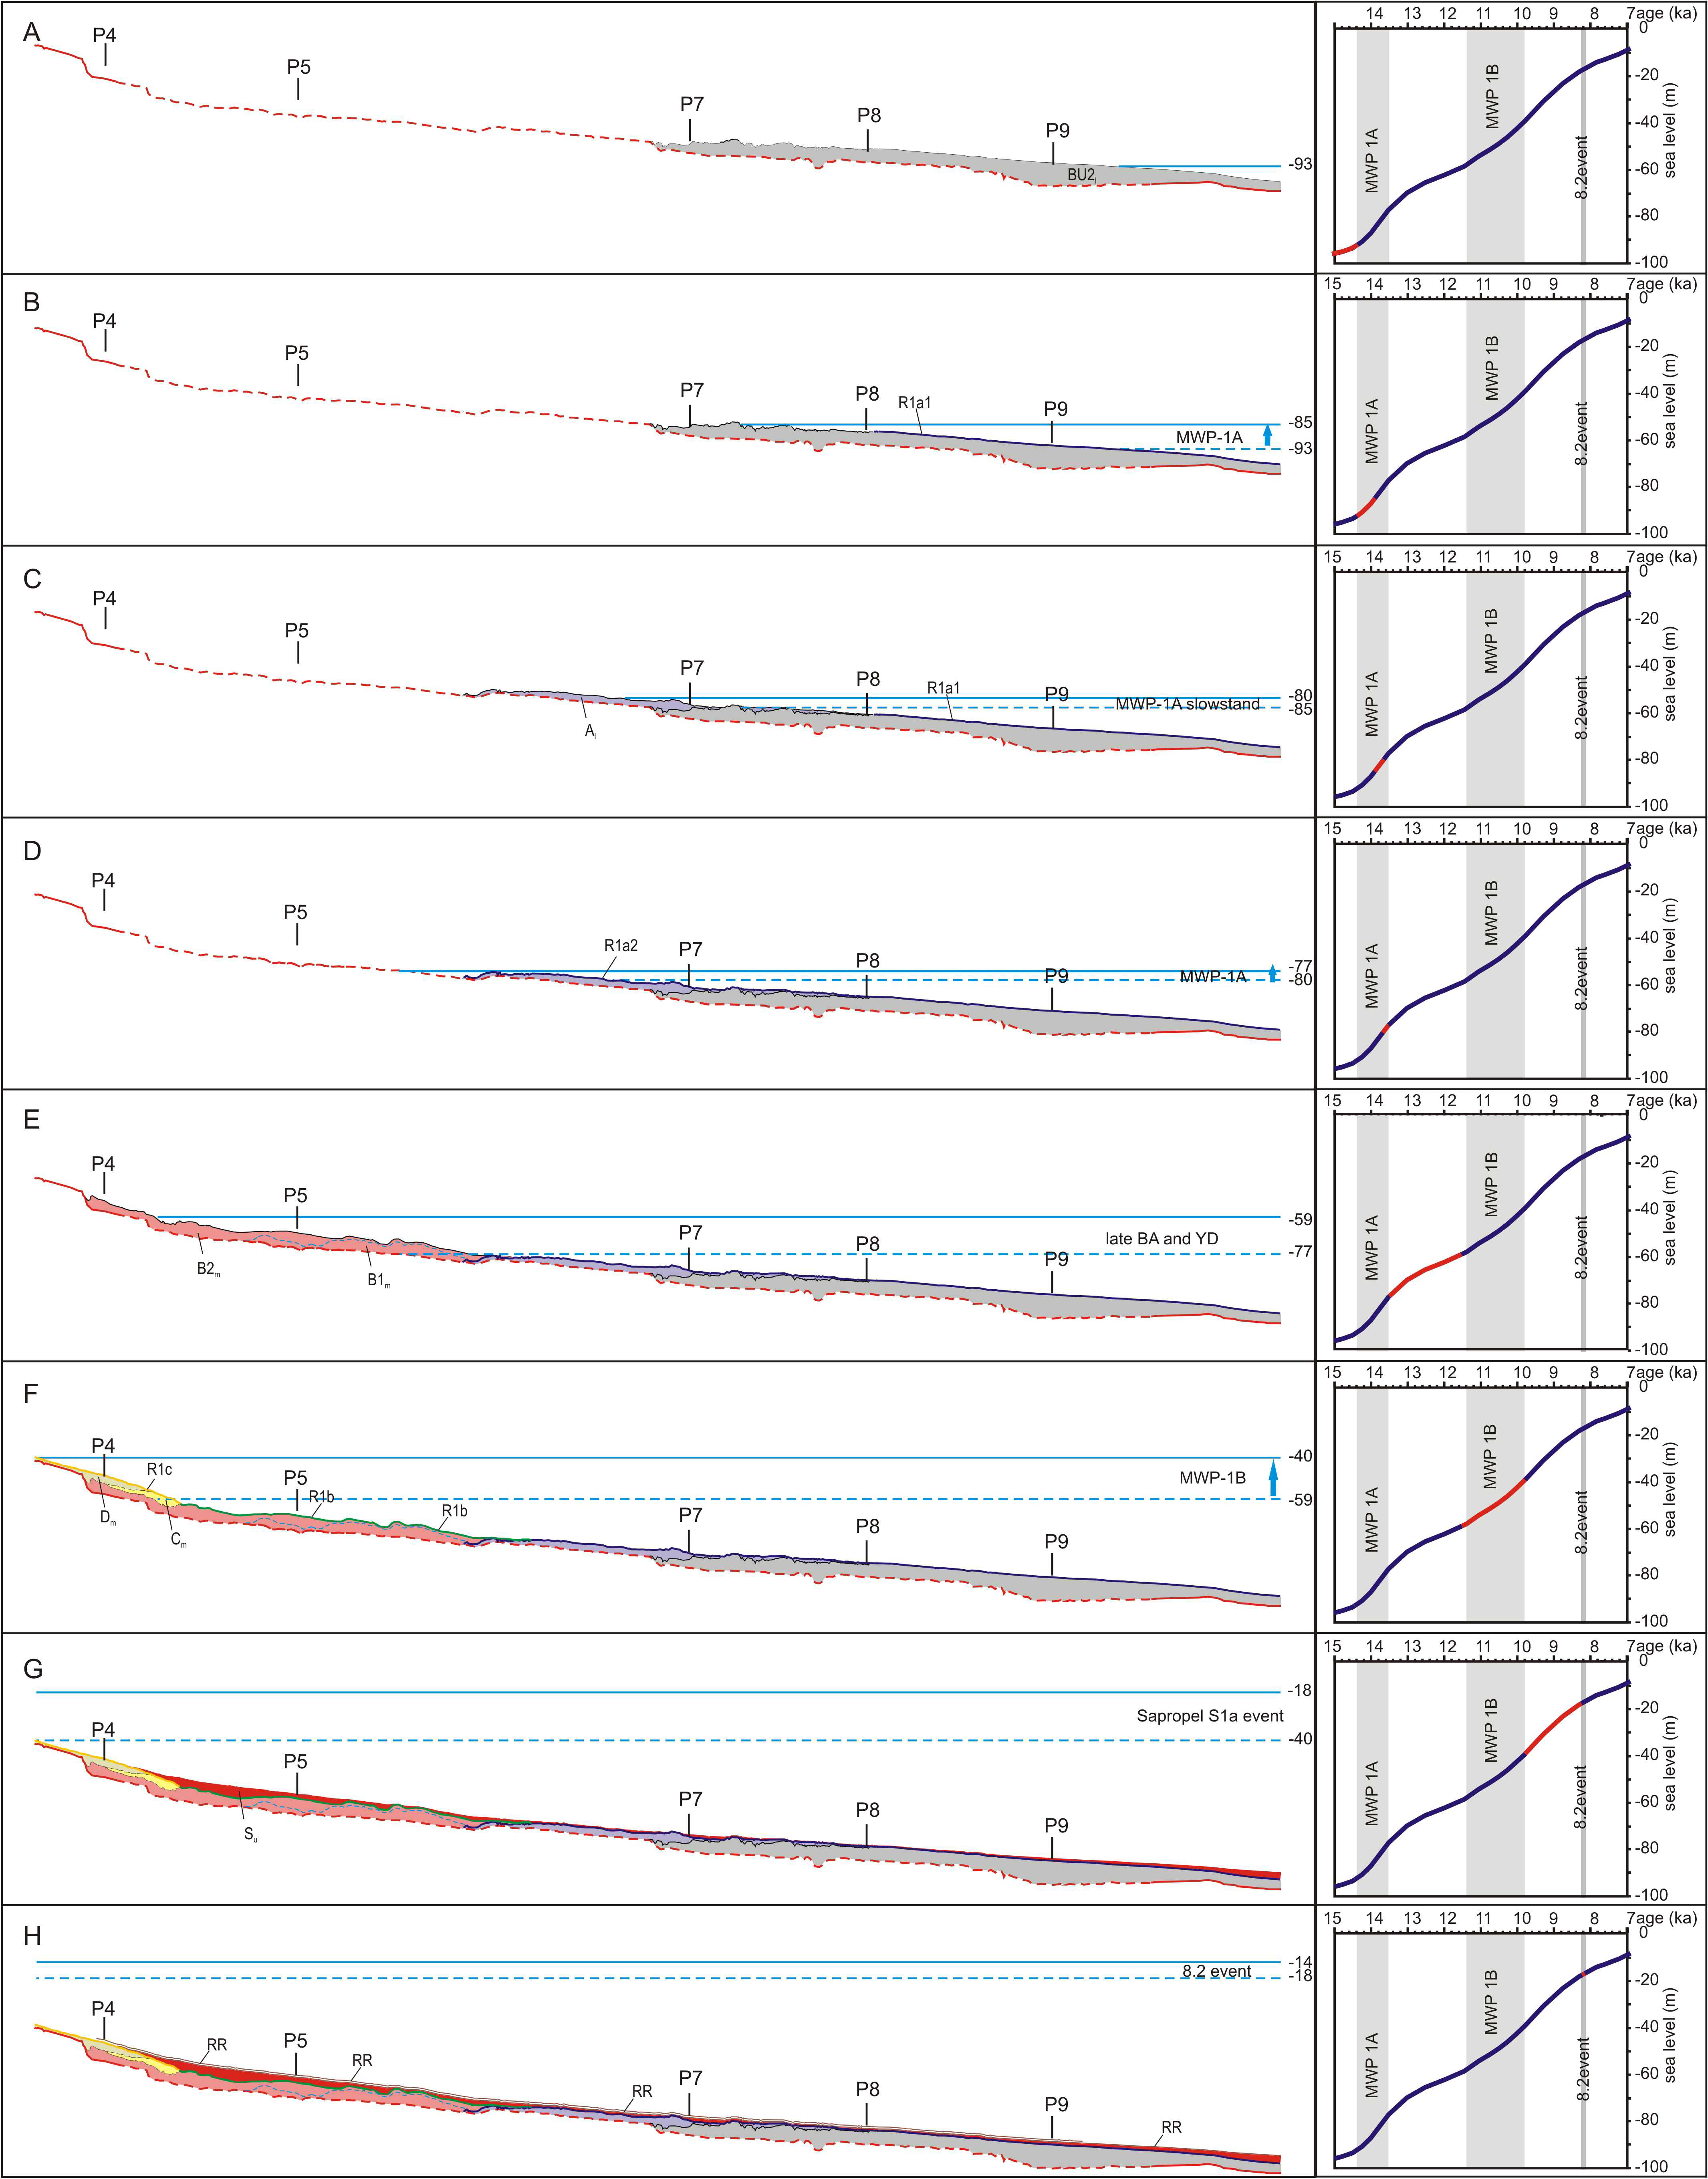
- pre meltwater pulse 1A: construction of the Manfredonia–Ofanto Lobe;
- first part of meltwater pulse 1A: interruption of the sedimentation of the Manfredonia–Ofanto Lobe and formation of reflector R1a1;
- brief slowstand, perhaps at a centennial scale, during meltwater pulse 1A: construction of the coastal system of the Al unit;
- the second part of the meltwater pulse 1A: drowning and overstepping of unit Al; interruption of the sedimentation and formation of the reflector R1a2 on the unit Al;
- slowstand during the late Bølling-Allerød and during the Younger Dyas: formation of the coastal barrier system of the Bm unit with a continuous landward backstepping process, due to the combination of the enhanced sediment input, low-gradient setting and slow sea-level rise;
- Meltwater pulse 1B: drowning and overstepping of the coastal system of the Bm unit and formation of the R1b surface. Simultaneously, rollover of the coastal system and formation of the R1c surface (wave ravinement surface);
- post Meltwater pulse 1B and Sapropel S1: renewal of the conditions for the construction of coastal barrier systems in a continuous landward backstepping pattern; in this case, the condition of enhanced sediment input was due to the Sapropel S1 event [27].
Author Contributions
Funding
Acknowledgments
Conflicts of Interest
References
- Mellett, C.L.; Plater, A.J. Drowned Barriers as Archives of Coastal-Response to Sea-Level Rise. In Barrier Dynamics and Response to Changing Climate; Moore, L.J., Murray, A.B., Eds.; Springer: Cham, Switzerland, 2018; pp. 57–89. ISBN 978-3-319-68086-6. [Google Scholar]
- De Falco, G.; Antonioli, F.; Fontolan, G.; Lo Presti, V.; Simeone, S.; Tonielli, R. Early cementation and accommodation space dictate the evolution of an overstepping barrier system during the Holocene. Mar. Geol. 2015, 369, 52–66. [Google Scholar] [CrossRef]
- Green, A.N.; Cooper, J.A.G.; Salzman, L. The role of shelf morphology and antecedent setting in the preservation of palaeo-shoreline (beachrock and aeolianite) sequences: The SE African shelf. Geo-Mar. Lett. 2018, 38, 5–18. [Google Scholar] [CrossRef]
- Pretorius, L.; Green, A.N.; Cooper, J.A. Submerged beachrock preservation in the context of wave ravinement. Geo-Mar. Lett. 2018, 38, 19–32. [Google Scholar] [CrossRef]
- Zecchin, M.; Catuneanu, O.; Caffau, M. Wave-ravinement surfaces: Classification and key characteristics. Earth-Sci. Rev. 2019, 188, 210–239. [Google Scholar] [CrossRef]
- Storms, J.E.A.; Weltje, G.J.; Terra, G.J.; Cattaneo, A.; Trincardi, F. Coastal dynamics under conditions of rapid sea-level rise: Late Pleistocene to Early Holocene evolution of barrier-lagoon systems on the northern Adriatic shelf (Italy). Quat. Sci. Rev. 2008, 27, 1107–1123. [Google Scholar] [CrossRef]
- Green, A.N.; Cooper, J.A.G.; Leuci, R.; Thackeray, R. Formation and preservation of an overstepped segmented lagoon complex on a high-energy continental shelf. Sedimentology 2013, 60, 1755–1768. [Google Scholar] [CrossRef]
- Pretorius, L.; Green, A.N.; Cooper, J.A.G.; Hahn, A.; Zabel, M. Outer- to inner-shelf response to stepped sea-level rise: Insights from incised valleys and submerged shorelines. Mar. Geol. 2019, 416, 105979. [Google Scholar] [CrossRef]
- Billy, J.; Robin, N.; Hein, C.J.; FitzGerald, D.M.; Certain, R. Impact of relative sea-level changes since the last deglaciation on the formation of a composite paraglacial barrier. Mar. Geol. 2018, 400, 76–93. [Google Scholar] [CrossRef]
- Billy, J.; Robin, N.; Hein, C.J.; Certain, R.; FitzGerald, D.M. Insight into the late Holocene sea-level changes in the NW Atlantic from a paraglacial beach-ridge plain south of Newfoundland. Geomorphology 2015, 248, 134–146. [Google Scholar] [CrossRef]
- Wang, R.; Colombera, L.; Mountney, N.P. Geological controls on the geometry of incised-valley fills: Insights from a global dataset of late-Quaternary examples. Sedimentology 2019, 66, 2134–2168. [Google Scholar] [CrossRef]
- Maselli, V.; Trincardi, T.; Asioli, A.; Ceregato, A.; Rizzetto, F.; Taviani, M. Delta growth and river valleys: The influence of climate and sea level changes on the South Adriatic shelf (Mediterranean Sea). Quat. Sci. Rev. 2014, 99, 146–163. [Google Scholar] [CrossRef]
- Maselli, V.; Hutton, E.W.; Kettner, A.J.; Syvitski, J.P.M.; Trincardi, F. High-frequency sea level and sediment supply fluctuations during Termination I: An integrated sequence-stratigraphy and modeling approach from the Adriatic Sea (Central Mediterranean). Mar. Geol. 2011, 287, 54–70. [Google Scholar] [CrossRef]
- Trincardi, F.; Cattaneo, A.; Asioli, A.; Correggiari, A.; Langone, L. Stratigraphy of the Late-Quaternary deposits in the central Adriatic basin and the record of short term climatic events. Mem. Ist. Ital. Idrobiol. 1996, 55, 39–70. [Google Scholar]
- Berné, S.; Jouet, G.; Bassetti, M.A.; Dennielou, B.; Taviani, M. Late Glacial Preboreal sea-level rise recorded by the Rhône deltaic system (NW Mediterranean). Mar. Geol. 2007, 245, 65–88. [Google Scholar] [CrossRef]
- Caldara, M.; Pennetta, L. Pleistocenic buried abrasion platforms in southeastern “Tavoliere” (Apulia, South Italy). Alp. Mediterr. Quat. 1991, 4, 303–309. [Google Scholar]
- Caldara, M.; Iannone, A.; Lopez, R.; Simone, O.; De Santis, V.; Torres, T.; Ortiz, J.E. New data on the Pleistocene of Trani (Adriatic coast, southern Italy). Ital. J. Geosci. 2013, 132, 239–253. [Google Scholar] [CrossRef]
- De Santis, V.; Caldara, M.; Torres, T.; Ortiz, J.E. Stratigraphic units of the Apulian Tavoliere Plain: Chronology, correlation with marine isotope stages and implication regarding vertical movements. Sediment. Geol. 2010, 228, 255–270. [Google Scholar] [CrossRef]
- De Santis, V.; Caldara, M.; Pennetta, L.; Torres, T.; Ortiz, J.E. Unconformity bounded stratigraphic units in an Italian alluvial plain area: Recognising and dating. J. Sediment. Res. 2013, 83, 96–114. [Google Scholar] [CrossRef]
- De Santis, V.; Caldara, M.; Pennetta, L. The marine and alluvial terraces of Tavoliere di Puglia plain (southern Italy). J. Maps 2014, 10, 114–125. [Google Scholar] [CrossRef]
- De Santis, V.; Caldara, M.; Torres, T.; Ortiz, J.E. Two middle Pleistocene warm stages in the terraced deposits of the Apulia region (southern Italy). Quat. Int. 2014, 332, 2–18. [Google Scholar] [CrossRef]
- De Santis, V.; Caldara, M.; Torres, T.; Ortiz, J.E.; Sánchez-Palencia, Y. A review of MIS 7 and MIS 5 terrace deposits along the Gulf of Taranto based on new stratigraphic and chronological data. Ital. J. Geosci. 2018, 137, 349–368. [Google Scholar] [CrossRef]
- De Santis, V.; Caldara, M.; Torres, T.; Ortiz, J.E.; Sánchez-Palencia, Y. The role of beach ridges, spits, or barriers in understanding marine terraces processes on loose or semiconsolidated substrates: Insights from the givoni of the Gulf of Taranto (Southern Italy). Geol. J. 2020, 55, 2951–2975. [Google Scholar] [CrossRef]
- Fabbri, A.; Gallignani, P. Ricerche geomorfologiche e sedimentologiche nell’Adriatico meridionale. Giorn Geol. 1972, 38, 453–498. [Google Scholar]
- Caldara, M.; Centenaro, E.; Mastronuzzi, G.; Sansò, P.; Sergio, A. Features and present evolution of apulian coast (Southern Italy). J. Coast. Res. 1998, SI26, 55–64. [Google Scholar]
- De Santis, V.; Caldara, M. The 5.5-4.5 kyr climatic transition as recorded by the sedimentation pattern of coastal deposits of Apulia region, southern Italy. Holocene 2015, 25, 1313–1329. [Google Scholar] [CrossRef]
- De Santis, V.; Caldara, M.; Pennetta, L. Continuous Backstepping of Holocene Coastal Barrier Systems into Incised Valleys: Insights from the Ofanto and Carapelle-Cervaro Valleys. Water 2020, 12, 1799. [Google Scholar] [CrossRef]
- Trincardi, F.; Argnani, A.; Correggiari, A. Note Illustrative della Carta Geologica dei Mari Italiani, Alla Scala 1:250,00, Foglio NK33-6 Vieste, e Foglio NK33-8/9 Bari; ISPRA: Roma, Italy, 2011; pp. 1–194. [Google Scholar]
- Trincardi, F.; Correggiari, A.; Ridente, D.; Verdicchio, G.; Cattaneo, A.; Minisini, D.; Remia, A.; Taviani, M.; Asioli, A.; Piva, A.; et al. Carta Geologica dei Mari Italiani, Foglio NK33-8/9 Bari; ISPRA: Roma, Italy, 2011. [Google Scholar]
- Maselli, V.; Trincardi, F. Large-scale single incised valley from a small catchment basin on the western Adriatic margin (central Mediterranean Sea). Glob. Planet. Chang. 2013, 100, 245–262. [Google Scholar] [CrossRef]
- Ridente, R. Late Pleistocene post-glacial sea level rise and differential preservation of transgressive “sand ridges” deposits in the Adriatic sea. Geosciences 2018, 8, 61. [Google Scholar] [CrossRef]
- De Santis, V.; Caldara, M. Evolution of an incised valley system in the southern Adriatic Sea (Apulian margin): An onshore-offshore correlation. Geol. J. 2016, 51, 263–284. [Google Scholar] [CrossRef]
- Catuneanu, O.; Galloway, W.E.; Kendall, C.G.S.T.C.; Miall, A.D.; Posamentier, H.W.; Strasser, A.; Tucker, M.E. Sequence stratigraphy: Methodology and Nomenclature. Newsl. Stratigr. 2011, 44, 173–245. [Google Scholar] [CrossRef]
- Amorosi, A.; Maselli, V.; Trincardi, F. Onshore to offshore anatomy of a late Quaternary source-to-sink system (Po Plain–Adriatic Sea, Italy). Earth-Sci. Rev. 2016, 153, 212–237. [Google Scholar] [CrossRef]
- Cattaneo, A.; Correggiari, A.; Langone, L.; Trincardi, F. The late-Holocene Gargano subaqueous delta, Adriatic shelf: Sediment pathways and supply fluctuations. Mar. Geol. 2003, 193, 61–91. [Google Scholar] [CrossRef]
- Cattaneo, A.; Trincardi, F. The late-Quaternary transgressive record in the Adriatic epicontinental sea: Basin widening and facies partitioning. In Isolated Shallow Marine Sand Bodies: Sequence Stratigraphic Analysis and Sedimentologic Interpretation; Bergman, K., Snedden, J., Eds.; SEPM: Broken Arrow, OK, USA, 1999; Volume 64, pp. 127–146. [Google Scholar]
- Correggiari, A.; Trincardi, F.; Langone, L.; Roveri, M. Styles of failure in heavily-sedimented highstand prodelta wedges on the Adriatic shelf. J. Sediment. Res. 2001, 71, 218–236. [Google Scholar] [CrossRef]
- Pellegrini, C.; Maselli, V.; Cattaneo, A.; Piva, A.; Ceregato, A.; Trincardi, F. Anatomy of a compound delta from the post-glacial transgressive record in the Adriatic Sea. Mar. Geol. 2015, 362, 43–59. [Google Scholar] [CrossRef]
- Cooper, J.A.G.; Green, A.N.; Meireles, R.P.; Klein, A.H.F.; Souza, J.; Toldo, E.E. Sandy barrier overstepping and preservation linked to rapid sea level rise and geological setting. Mar. Geol. 2016, 382, 80–91. [Google Scholar] [CrossRef]
- Esker, D.; Eberli, G.P.; McNeill, D.F. The Structural and Sedimentological Controls on the Reoccupation of Quaternary Incised Valleys, Belize Southern Lagoon. AAPG Bull. 1998, 82, 2075–2109. [Google Scholar]
- Labaune, C.; Tesson, M.; Gensous, B.; Parize, O.; Imbert, P.; Delhaye-Prat, V. Detailed architecture of a compound incised valley system and correlation with forced regressive wedges: Example of Late Quaternary Têt and Agly rivers, western Gulf of Lions, Mediterranean Sea, France. Sediment. Geol. 2010, 223, 360–379. [Google Scholar] [CrossRef]
- Maio, C.V.; Gontz, A.M.; Sullivan, R.M.; Madsen, S.M.; Weidman, C.R.; Donnelly, J.P. Subsurface evidence of storm-driven breaching along a transgressing barrier system, Cape Cod, U.S.A. J. Coast. Res. 2015, 32, 264–279. [Google Scholar] [CrossRef][Green Version]
- Nordfjord, S.; Goff, J.A.; Austin, J.A., Jr.; Gulick, S.P.S. Seismic facies of incised-valley fills, New Jersey continental shelf: Implications for erosion and preservation processes acting during latest Pleistocene-Holocene transgression. J. Sediment. Res. 2006, 76, 1284–1303. [Google Scholar] [CrossRef]
- Raynal, O.; Bouchette, F.; Certain, R.; Sabatier, P.; Lofi, J.; Séranne, M.; Dezileau, L.; Briqueu, L.; Ferrer, P.; Courp, T. Holocene evolution of a Languedocian lagoonal environment controlled by inherited coastal morphology (northern Gulf of Lions, France). Bull. Soc. Geol. Fr. 2010, 181, 211–224. [Google Scholar] [CrossRef]
- Lambeck, K.; Antonioli, F.; Anzidei, M.; Ferranti, L.; Leoni, G.; Silenzi, S. Sea level change along the Italian coasts during Holocene and prediction for the future. Quat. Int. 2011, 232, 250–257. [Google Scholar] [CrossRef]
- Lambeck, K.; Rouby, H.; Purcell, A.; Sun, Y.; Sambradge, M. Sea level and global ice volumes from the Last Glacial Maximum to the Holocene. Proc. Natl. Acad. Sci. USA 2014, 111, 15296–15303. [Google Scholar] [CrossRef] [PubMed]
- Liu, J.P.; Milliman, J.D. Reconsidering melt-water pulses 1A and 1B: Global impacts of rapid sea-level rise. J. Ocean Univ. China 2004, 3, 183–190. [Google Scholar] [CrossRef]
- Bard, E.; Hamelin, B.; Delanghe-Sabatier, D. Deglacial meltwater pulse 1B and younger dryas sea levels revisited with Boreholes at Tahiti. Science 2010, 327, 1235–1237. [Google Scholar] [CrossRef] [PubMed]
- Zecchin, M.; Ceramicola, S.; Gordini, E.; Deponte, M.; Critelli, S. Cliff overstep model and variability in the geometry of transgressive erosional surfaces in high-gradient shelves: The case of the Ionian Calabrian margin (Southern Italy). Mar. Geol. 2011, 281, 43–58. [Google Scholar] [CrossRef]
- Zecchin, M.; Gordini, E.; Ramella, M. Recognition of a drowned delta in the northern Adriatic Sea, Italy: Stratigraphic characteristics and its significance in the frame of the early Holocene sea-level rise. Holocene 2015, 25, 1027–1038. [Google Scholar] [CrossRef]
- Civile, D.; Lodolo, E.; Zecchin, M.; Ben-Avraham, Z.; Baradello, L.; Accettella, D.; Cova, A.; Caffau, M. The lost Adventure Archipelago (Sicilian Channel, Mediterranean Sea): Morpho-bathymetry and Late Quaternary palaeogeographic evolution. Glob. Planet. Chang. 2015, 125, 36–47. [Google Scholar] [CrossRef]
- Caldara, M.; Capolongo, D.; Del Gaudio, V.; De Santis, V.; Pennetta, L.; Maiorano, P.; Simone, O.; Vitale, G. Note Illustrative della Carta Geologica d’Italia alla Scala 1:50.000 Foglio, 422 “Cerignola”; Istituto Superiore per la Protezione e la Ricerca Ambientale: Roma, Italy, 2011; pp. 1–96. ISBN 978-88-240-2989-6. [Google Scholar]
- Caldara, M.; Capolongo, D.; Del Gaudio, V.; De Santis, V.; Pennetta, L.; Maiorano, P.; Simone, O. Note Illustrative della Carta Geologica d’Italia alla Scala 1:50.000 Foglio, 409 “Zapponeta”; Istituto Superiore per la Protezione e la Ricerca Ambientale: Roma, Italy, in press.
- Boenzi, F.; Caldara, M.; Pennetta, L.; Simone, O. Environmental aspects related to the physical evolution of some wetlands along the Adriatic coast of Apulia (Southern Italy): A review. J. Coast. Res. 2006, SI39, 170–175. [Google Scholar]
- Strong, N.; Paola, C. Fluvial landscapes and stratigraphy in a flume. Sediment. Rec. 2006, 4, 4–8. [Google Scholar] [CrossRef]
- Strong, N.; Paola, C. Valleys that never were: Time surfaces versus stratigraphic surfaces. J. Sediment. Res. 2008, 78, 579–593. [Google Scholar] [CrossRef]
- Schumm, S.A.; Brackenridge, S.A. River response. In North America and Adjacent Oceans during the Last Deglaciation; Ruddiman, W.F., Wright, H.E., Jr., Eds.; Geological Society of America, The Geology of North America: Boulder, CO, USA, 1987; pp. 221–240. [Google Scholar]
- Leckie, D.A. Canterbury Plains, New Zealand–implications for sequence stratigraphic models. AAPG Bull. 1994, 78, 1240–1256. [Google Scholar] [CrossRef]
- Posamentier, H.W. Lowstand alluvial bypass systems: Incised vs unincised. Am. Assoc. Pet. Geol. Bull. 2001, 85, 1771–1793. [Google Scholar] [CrossRef]
- Posamentier, H.W.; Allen, G.P. Siliciclastic Sequence Stratigraphy: Concepts and Applications. In SEPM Concepts in Sedimentology and Paleontology; Society for Sedimentary Geology: Tulsa, OK, USA, 1999; Volume 7, pp. 1–210. [Google Scholar]
- Paola, C.; Heller, P.L.; Angevine, C.L. The largescale dynamics of grain-size variation in alluvial basins, 1: Theory. Basin Res. 1992, 4, 73–90. [Google Scholar] [CrossRef]
- Blum, M.; Martin, J.; Milliken, K.; Garvin, M. Paleovalley systems: Insights from Quaternary analogs and experiments. Earth-Sci. Rev. 2013, 116, 128–169. [Google Scholar] [CrossRef]
- Van Heijst, M.W.I.M.; Postma, G. Fluvial response to sea-level changes: A quantitative analogue, experimental approach. Basin Res. 2001, 13, 269–292. [Google Scholar] [CrossRef]
- Loget, N.; Van Den Driessche, J. Wave train model for knickpoint migration. Geomorphology 2009, 106, 376–382. [Google Scholar] [CrossRef]
- Makinouchi, T.; Mori, S.; Danhara, T.; Takemura, K. Stratigraphic horizon and formational process of the First Gravel Formation (BG) in the Nohbi Plain. In Recent Progress on the Understanding of So-called Chuseki-so. Mem. Geol. Surv. Jpn. 2006, 59, 129–139. [Google Scholar]
- Ishihara, T.; Sugai, T.; Hachinohe, S. Fluvial response to sea-level changes since the latest Pleistocene in the near-coastal lowland, central Kanto Plain, Japan. Geomorphology 2012, 147–148, 49–60. [Google Scholar] [CrossRef]
- Ishihara, T.; Sugai, T. Eustatic and regional tectonic controls on late Pleistocene paleovalley morphology in the central Kanto Plain. Jpn. Quat. Int. 2017, 456, 69–84. [Google Scholar] [CrossRef]
- Blum, M.D.; Tornqvist, T.E. Fluvial responses to climate and sea-level change: A review and look forward. Sedimentology 2000, 47, 2–48. [Google Scholar] [CrossRef]
- Mattheus, C.R.; Rodriguez, A.B.; Greene, D.L.; Simms, A.R.; Anderson, J.B. Control of upstream variables on incised-valley dimension. J. Sediment. Res. 2007, 77, 213–224. [Google Scholar] [CrossRef]
- Mattheus, C.R.; Rodriguez, A.B. Controls on late Quaternary incised-valley dimension along passive margins evaluated using empirical data. Sedimentology 2011, 58, 1113–1137. [Google Scholar] [CrossRef]
- Phillips, J.D. Drainage area and incised valley fills in Texas rivers: A potential explanation. Sediment. Geol. 2011, 242, 65–70. [Google Scholar] [CrossRef]
- Blum, M.D.; Womack, J.H. Climate change, sea level change, and fluvial sediment supply to deepwater systems. In External Controls on Deep Water Depositional Systems: Climate, Sea-Level, and Sediment Flux; Kneller, B., Martinsen, O.J., McCaffrey, B., Eds.; SEPM: Broken Arrow, OK, USA, 2009; Volume 92, pp. 15–39, Special Publication. [Google Scholar]
- Patruno, S.; Hampson, G.J.; Jackson, C.A.-L. Quantitative characterisation of deltaic and subaqueous clinoforms. Earth-Sci. Rev. 2015, 142, 79–119. [Google Scholar] [CrossRef]
- Cattaneo, A.; Trincardi, F.; Asioli, A.; Correggiari, A. The western Adriatic shelf clinoform: Energy-limited bottomset. Cont. Shelf Res. 2007, 27, 506–525. [Google Scholar] [CrossRef]
- Correggiari, A.; Cattaneo, A.; Trincardi, F. The modern Po Delta system: Lobe switching and asymmetric prodelta growth. Mar. Geol. 2005, 222–223, 49–74. [Google Scholar] [CrossRef]
- Engelbrecht, L.; Green, A.N.; Cooper, J.A.G.; Hahn, A.; Zabel, M.; Mackay, C.F. Construction and evolution of submerged deltaic bodies on the high energy SE African coastline: The interplay between relative sea level and antecedent controls. Mar. Geol. 2020, 424, 106170. [Google Scholar] [CrossRef]
- Stanford, J.D.; Hemingway, R.; Rohling, E.J.; Challenor, P.G.; Medina-Elizalde, M.; Lester, A.J. Sea-level probability for the last deglaciation: A statistical analysis of far-field records. Glob. Planet. Chang. 2011, 79, 193–203. [Google Scholar] [CrossRef]
- Sømme, T.O.; Piper, D.J.W.; Deptuck, M.E.; Helland-Hansen, W. Linking Onshore–Offshore sediment dispersal in the Golo source-to-sink system (Corsica, France) during the Late Quaternary. J. Sediment. Res. 2011, 81, 118–137. [Google Scholar] [CrossRef]
- Green, A.N.; Cooper, J.A.G.; Salzmann, L. Geomorphic and stratigraphic signals of postglacial meltwater pulses on continental shelves. Geology 2014, 24, 151–154. [Google Scholar] [CrossRef]
- Ariztegui, D.; Asioli, A.; Lowe, J.J.; Trincardi, F.; Vigliotti, L.; Tamburini, F.; Chondrogianni, C.; Accorsi, C.A.; Bandini Mazzanti, M.; Mercuri, A.M.; et al. Palaeoclimate and the formation of sapropel S1: Inferences from Late Quaternary lacustrine and marine sequences in the central Mediterranean region. Palaeogeogr. Palaeoclimatol. Palaeoecol. 2000, 158, 215–240. [Google Scholar] [CrossRef]
- Tesi, T.; Asioli, A.; Minisini, D.; Maselli, V.; Dalla Valle, G.; Gamberi, F.; Langone, L.; Cattaneo, A.; Montagna, P.; Trincardi, F. Large-scale response of the Eastern Mediterranean thermohaline circulation to African monsoon intensification during sapropel S1 formation. Quat. Sci. Rev. 2017, 159, 139–154. [Google Scholar] [CrossRef]
- Cronin, T.M.; Vogt, P.R.; Willard, D.A.; Thunell, R.C.; Halka, J.; Berke, M.; Pohlman, J. Rapid sea level rise and ice sheet response to 8200-year climate event. Geophys. Res. Lett. 2007, 34. [Google Scholar] [CrossRef]
- Hijma, M.P.; Coen, K.M. Timing and magnitude of the sea-level jump preluding the 8200 yr event. Geology 2010, 38, 275–278. [Google Scholar] [CrossRef]
- Rampino, M.R.; Sanders, J.E. Holocene transgression in south-central Long Island, New York. J. Sediment. Petrol. 1980, 50, 1063–1080. [Google Scholar]
- Sanders, J.E.; Kumar, N. Evidence of shoreface retreat and in-place “drowning” during Holocene submergence of barriers, shelf off Fire Island, New York. Geol. Soc. Am. Bull. 1975, 86, 65–76. [Google Scholar] [CrossRef]
- Cooper, J.A.G.; Green, A.N.; Compton, J.S. Sea-level change in southern Africa since the Last Glacial Maximum. Quat. Sci. Rev. 2018, 201, 303–318. [Google Scholar] [CrossRef]


| Seismic Facies | |
|---|---|
1 | Description: always present within the incised valleys, on the ES1; characterised by a high amplitude downlapping reflector or reflectors with concave and convex or wavy shapes; frequent changes are present in the immersion of the reflectors; the lateral continuity is low-moderate. |
| Interpretation: fluvial lag; deposition under high-energy riverine conditions | |
2a | Description: chaotic, nonsymmetrical internal configuration with reflectors of low or very low amplitude and low lateral continuity, with a V and Λ shape, or undulating, concave and convex. From offshore to onshore, a transition between facies 2 and facies 3 is often observed |
| Interpretation: predominantly siliciclastic sandy deposit rich in coarse bioclasts, with a minor content of silt and/or clay, as the expression of high-energy coastal sediments (beach/shoreface/barrier (bsb)) | |
2b | Description: sigmoidal and/or clinoform reflectors with moderate–high amplitudes and medium–high lateral continuity, which alternate with low amplitude reflectors or with chaotic and nonsymmetrical packages, all inclined landward. Not present in the seismic profiles shown in this article |
| Interpretation: beach/shoreface/barrier (bsb) deposit within a transgressive barrier or spit that migrated landward by wave erosion and overwashing | |
3 | Description: medium amplitude, plane-parallel reflectors with medium lateral continuity; alternatively, reflectors are weakly undulating with low lateral continuity. Often facies 2 transitions landwards to facies 3 |
| Interpretation: low energy, backbarrier deposit (perhaps a semienclosed bay/microtidal estuarine lagoon) behind a coastal barrier | |
4 | Description: medium- to high amplitude, medium-high lateral continuity wavy, concave or convex reflectors alternating with plane-parallel reflectors. In some cases, facies 2 transitions landward into facies 4 |
| Interpretation: open backbarrier (bay/microtidal estuarine lagoon), probably of silty nature. Presence of currents and channels, which create a moderate energy environment. The wavy undulations which characterise this facies can be interpreted in some cases as channel features, in other cases as deformation of the backbarrier bottom due to waves or currents | |
5 | Description: medium amplitude and medium lateral continuity reflectors, with the presence of a topset, foreset and bottomset |
| Interpretation: prograding deltaic body | |
6 | Description: medium- to high amplitude reflectors with the maximum observed lateral continuity, onlapping onto inclined substrate and/or draping over uneven substrate. Reflectors are gently seaward-inclined or subhorizontal |
| Interpretation: lower shoreface/offshore, probably silty-clay deposit, related to the end of wave action on the sea bottom |
| Seismic Facies | |
|---|---|
7 | Description: irregular, strictly undulated reflectors of medium–low amplitude and medium-low lateral continuity. Alternatively, seaward–inclined reflectors, subparallel to the underlying ES1 or with a greater inclination. In some cases, this facies transitions seaward into facies 3 |
| Interpretation: slope deposits |
Publisher’s Note: MDPI stays neutral with regard to jurisdictional claims in published maps and institutional affiliations. |
© 2020 by the authors. Licensee MDPI, Basel, Switzerland. This article is an open access article distributed under the terms and conditions of the Creative Commons Attribution (CC BY) license (http://creativecommons.org/licenses/by/4.0/).
Share and Cite
De Santis, V.; Caldara, M.; Pennetta, L. Transgressive Architecture of Coastal Barrier Systems in the Ofanto Incised Valley and Its Surrounding Shelf in Response to Stepped Sea-Level Rise. Geosciences 2020, 10, 497. https://doi.org/10.3390/geosciences10120497
De Santis V, Caldara M, Pennetta L. Transgressive Architecture of Coastal Barrier Systems in the Ofanto Incised Valley and Its Surrounding Shelf in Response to Stepped Sea-Level Rise. Geosciences. 2020; 10(12):497. https://doi.org/10.3390/geosciences10120497
Chicago/Turabian StyleDe Santis, Vincenzo, Massimo Caldara, and Luigi Pennetta. 2020. "Transgressive Architecture of Coastal Barrier Systems in the Ofanto Incised Valley and Its Surrounding Shelf in Response to Stepped Sea-Level Rise" Geosciences 10, no. 12: 497. https://doi.org/10.3390/geosciences10120497
APA StyleDe Santis, V., Caldara, M., & Pennetta, L. (2020). Transgressive Architecture of Coastal Barrier Systems in the Ofanto Incised Valley and Its Surrounding Shelf in Response to Stepped Sea-Level Rise. Geosciences, 10(12), 497. https://doi.org/10.3390/geosciences10120497