Article

Extensive Sills in the Continental Basement from Deep Seismic Reflection Profiling

1
Department of Earth and Atmospheric Sciences, Cornell University, Ithaca, NY 14853, USA
2
Department of Geology, University of Maryland, College Park, MD 20742, USA
*
Author to whom correspondence should be addressed.
Geosciences 2020, 10(11), 449; https://doi.org/10.3390/geosciences10110449
Submission received: 28 July 2020 / Revised: 24 September 2020 / Accepted: 21 October 2020 / Published: 10 November 2020

Abstract

:
Crustal seismic reflection profiling has revealed the presence of extensive, coherent reflections with anomalously high amplitudes in the crystalline crust at a number of locations around the world. In areas of active tectonic activity, these seismic “bright spots” have often been interpreted as fluid magma at depth. The focus in this report is high-amplitude reflections that have been identified or inferred to mark interfaces between solid mafic intrusions and felsic to intermediate country rock. These “frozen sills” most commonly appear as thin, subhorizontal sheets at middle to upper crustal depths, several of which can be traced for tens to hundreds of kilometers. Their frequency among seismic profiles suggest that they may be more common than widely realized. These intrusions constrain crustal rheology at the time of their emplacement, represent a significant mode of transfer of mantle material and heat into the crust, and some may constitute fingerprints of distant mantle plumes. These sills may have played important roles in overlying basin evolution and ore deposition.

1. Introduction

The geometry, composition, and mechanics of crustal intrusions, including sills, have been subject of numerous field and lab investigations; the associated literature is extensive [1,2,3,4,5,6]. Although sills are often observed in surface geological outcrops and thus available for direct sampling [7,8], their subhorizontal geometry makes them less likely to outcrop than near-vertical dykes, especially if buried beneath later sedimentary basins. The detection and delineation of magma, especially if still molten, at depth has been an explicit goal of many geophysical surveys using a variety of techniques, each with its own strengths and limitations. Gravity, for example, can be used to identify mass excess or mass deficiency that can be attributed respectively to mafic or granitic materials (molten or frozen) at depth [9,10,11,12]. Magnetotelluric methods have been widely used to detect magma at depth due their sensitivity to the high conductivities associated with magma and magmatic fluids [13,14]. However, gravity is notoriously non-unique [15], as are the various electrical methodologies [16,17]. Both offer relatively limited resolution at depth, especially if the target is a thin planar structure. Seismic methods using both artificial and earthquake sources have also been widely used to define crustal structure in general and magmatic additions both hot and cold. Thybo and Artemieva [18]) review many of the controlled source refraction/wide angle results that have been used to infer massive magmatic underplating in the crust. Seismic tomography is also now a commonly used tool to search for magma in all its forms at depth [19,20,21]. However, even the most recent tomography is limited in spatial resolution to tens of kilometers [22,23]. A somewhat greater resolution can be achieved using receiver functions computed from teleseismic recordings. Receiver functions have been interpreted to indicate an extensive sill beneath the Altiplano-Puna volcanic zone of the central Andes [24,25].
In many applications, the seismic reflection technique [26], also known as seismic reflection profiling or multichannel seismic profiling, offers the highest resolution of any geophysical technique. Seismic reflection surveying, the primary geophysical method used for oil and gas exploration, has become a highly sophisticated tool for imaging the subsurface in both 2D and 3D at depths ranging from the near surface to the upper mantle. Oil industry reflection surveys have already had a major impact on our understanding of the sill distributions in sedimentary basins [27,28,29].
Here, we focus on published examples of identified or inferred sills in the continental basement hidden beneath the sedimentary cover, with special attention to frozen sills that may be fingerprints of ancient thermal processes and the large-distance lateral transport of magma in the crystalline crust.

2. Observations

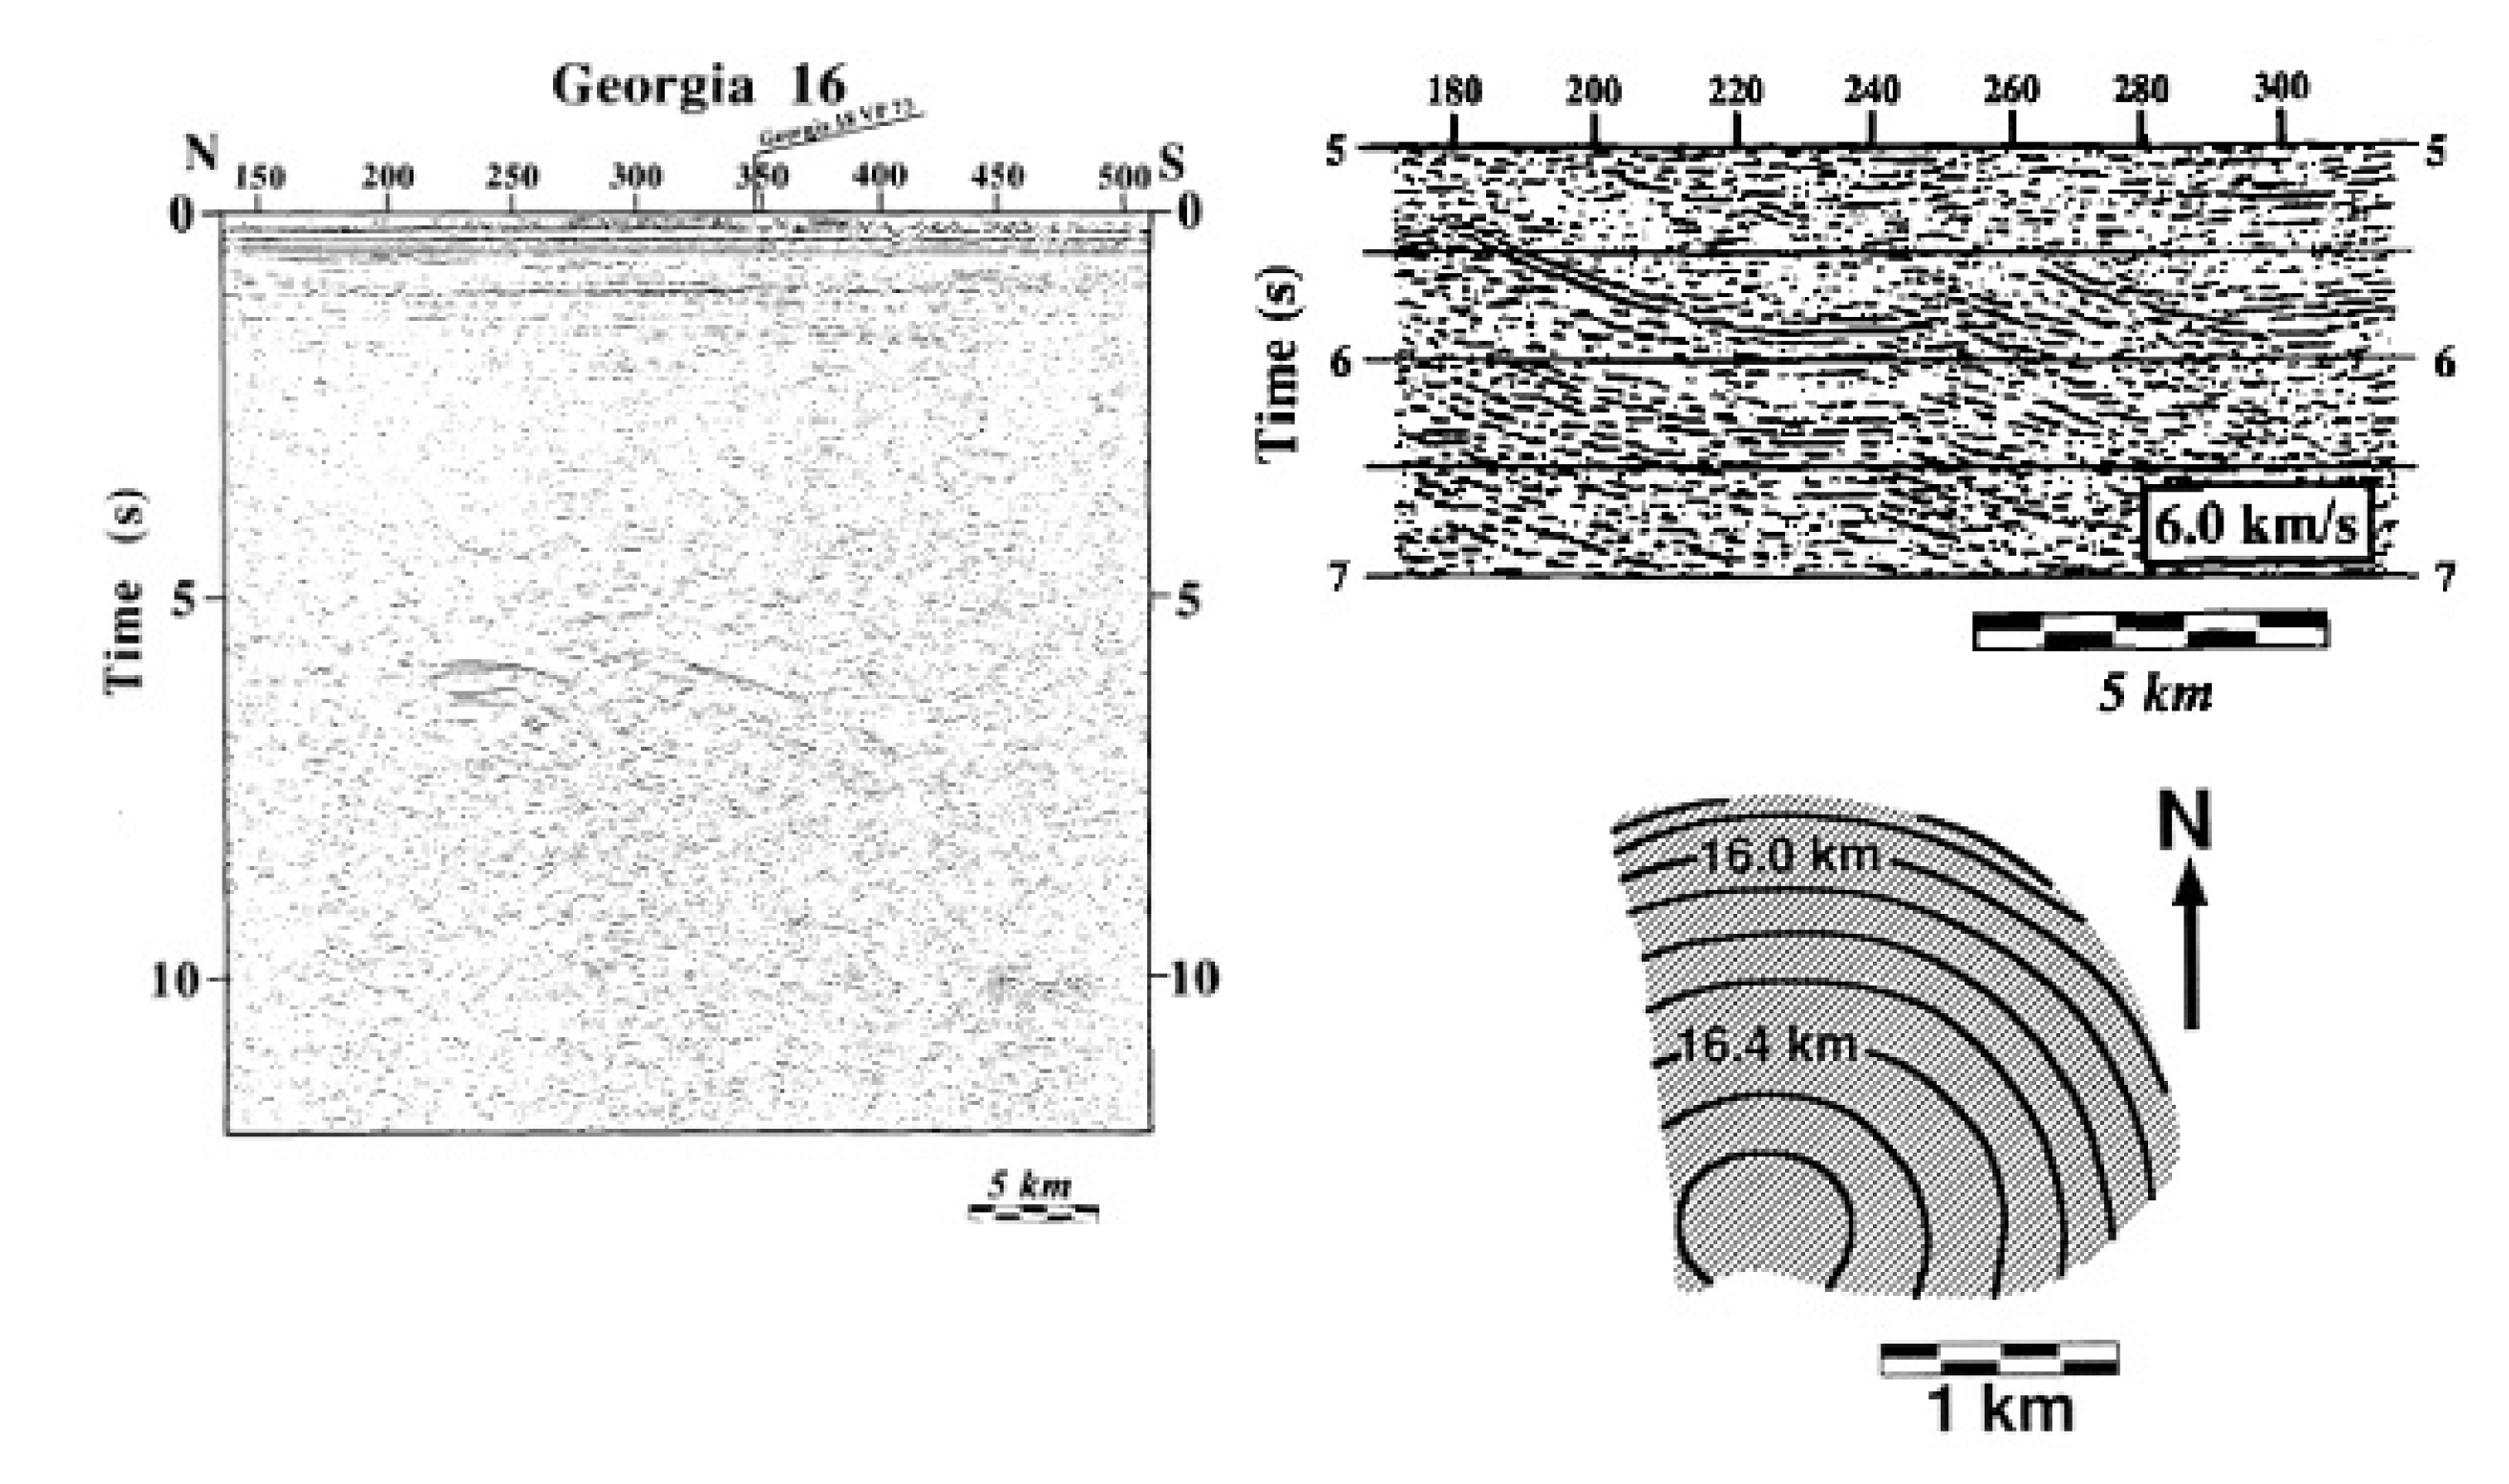
2.1. Seismic Bright Spots and Magma in the Crust

The starting point for the recognition of sills on seismic reflection recordings is their expected strong seismic contrast with surrounding rock, as expressed by the reflection coefficient. The reflection coefficient (RC) for vertically incident seismic waves upon a horizontal interface with density (ρ1) and seismic velocity (V1) overlying a layer with density (ρ2) and seismic velocity (V2) is given by the formula [26]:
RC = (ρ2V2 − ρ1V1)/(ρ2V2 − ρ1V1).
While this relation applies to both compressional (P) waves and shear (S) waves, the reflection data reported here was collected using P waves only. The representative density and P wave velocity values for rocks most representative to this review are shown in Table 1.
If a phyllite body in an average upper continental crust (UCC) is taken as representative of most reflection coefficients encountered in deep reflection surveys, the reflection coefficients for “hot” sills—silicic or mafic—emplaced in the UCC are an order of magnitude larger and imply that the corresponding reflection amplitudes would be anomalously strong. With respect to “cold” magmas, intermediate composition sills are likely to give rise to modest amplitudes at best, while mafic sills would still be expected to give rise to notably strong reflections compared to the surrounding heterogeneities.
However, the observed reflection amplitudes are affected by a number of factors other than the reflection coefficient, including geometrical focusing, layer tuning, transmission loss, and anelastic attenuation [26,29], so that these values should considered as rough guides only. Nevertheless, a reflection with an amplitude that appears to be anomalously strong compared to its neighboring reflections could be a candidate for either a still fluid magma (granitic or mafic) or a frozen mafic sill.
The shear wave reflection coefficients from “hot” magma at depth would be expected to be even larger since shear wave velocities approach 0 in a fluid. Studies in the Rio Grande Rift of New Mexico by Alan Sanford and his colleagues [34] and at volcanoes in northeastern Japan by Hasegawa and colleagues [35] are pioneering examples of detecting and mapping magma at depth using anomalous reflected shear waves from microearthquake sources.
The anomalous shear wave reflectors at midcrustal depths near Socorro, New Mexico, referred to as the Socorro Magma Body (SMB; [36]), attracted the attention of the nascent COCORP (Consortium for Continental Reflection Profiling) project in 1976. COCORP multichannel vibroseis source surveys then imaged an anomalously strong P wave reflector (called the Socorro Bright Spot) that corresponds directly with the anomalous S reflector (Figure 1 and Figure 2; [37]). The unusually strong amplitude P waves from the COCORP controlled source survey (Figure 2) and the anomalous S waves reflections on microearthquake recordings [34,38] are both consistent with a solid–fluid interface [35,39]. A hot magma interpretation is also consistent with the tectonic setting—i.e., a Cenozoic rift characterized by high heat flow—and is supported by MT measurements of high conductivities at mid-crustal depths [40]. Of particular significance are the geodetic and INSAR observations of contemporary surface uplift that suggest active magma inflation at the depth of this reflector [41,42,43]. The receiver function analysis of teleseismic data [44] confirms that the SMB is a relatively thin layer of magma corresponding to the seismic reflection bright spot.
The Socorro Bright Spot has served as a model for a magma interpretation of other anomalously strong deep seismic reflections (bright spots) reported from other regions of the world [45]. Examples include Death Valley in southern California [46], the Basin and Range of northwestern Nevada [47], the southern Tibetan Plateau [48], the central Andes [49], and the Taupo Volcanic Zone in central New Zealand [50]. Marine reflection profiling and 3D reflection surveys have also proved effective in mapping of likely magma chambers in the crystalline oceanic crust beneath mid-ocean ridges [51,52,53]. In most of these examples, the magma interpretation is bolstered by complementary geophysical observations, including MT and wide-angle refraction/reflection surveys and/or tomographic imaging with natural sources. A proper review of such “hot” magma reflections would entail a quantitative comparison of the individual survey results, as well as expansion to include the diverse range of other geophysical observations that have been reported to indicate similar features. Here, we choose instead to focus on the lesser known examples of frozen sills for which reflection surveys may be the only methodology capable of their detection.

2.2. “Frozen” Sills Detected by Reflection Surveys

The geometry and physical contrasts associated with solid intrusions at depth suggest that they should be less easily detectable than fluid magma by many geophysical techniques. However, the reflection coefficient associated with solid mafic sills emplaced in upper continental crust (Table 1) and their subhorizontal geometry both favor detection and mapping by multichannel reflection profiling. The examples reviewed below confirm that expectation. In most cases, the interpretation of strong basement reflections as mafic sills is largely circumstantial and lean heavily on analogy. However, in one particular case the interpretation is unassailable.

2.2.1. Ground Truth: Siljan, Sweden

Of special importance to inferring sills from reflection data is the multichannel seismic reflection profiling at the Siljan Ring in east central Sweden (Figure 1 and Figure 3; [54,55,56]). The Siljan seismic profiles (Figure 3) reveal a distinctive sequence of strong reflections that have been identified as dolerite sills by drill holes (Figure 4). Analogy with the reflection character of the Siljan reflections (high amplitudes, subhorizontal orientation, linear extent) has been a primary argument for the interpretation of similar appearing reflections elsewhere in the world, including those discussed in this paper.

2.2.2. Identification via Outcrop

The Siljan reflections are relatively unique in terms of being tested by drilling. However, outcrop correlations have also been used to infer mafic sills as being responsible for similar reflection sequences. Surveys by the Consortium for Continental Reflection Profiling (COCORP) in central Arizona revealed a relatively thick suite of strong reflections in the upper crust (A in Figure 5) very similar to the Siljan seismic images (Figure 1 and Figure 5 [57]). The seismic modeling of mafic sills exposed in basement outcrops approximately 20 km southeast of Line 3 was found to closely reproduce the character of the reflections seen on the seismic sections, bolstering their interpretation as arising from the subsurface extension of the outcropping cold diabase intrusions. This correlation is significant because the tectonic setting in Arizona would also be consistent with the presence of fluid magma in the subsurface. The deeper reflection C might be a candidate for hot magma, a suggestion based primarily on its discordance with sequence A and similarity in depth to the Socorro Magma body.

2.2.3. Extensive Sills in the Canadian Craton: Relicts of a Proterozoic Plume?

Among the most distinctive sill-like reflections, at least in terms of their observed extent, are a series of reflectors traced by the seismic surveys collected by the LITHOPROBE deep seismic program in Alberta and Saskatchewan, northwest Canada (Figure 1 and Figure 6). The Winagami Reflection Sequence, first reported by Ross and Eaton [59], is a set of distinctive reflections that bears clear similarities to the Siljan reflections. Cross-cutting relationships between the Winagami reflections and weaker dipping reflections associated with dated tectonic events support an intrusive origin and suggest that the Winagami sequence was emplaced by a thermal event between 1.760 and 1.890 GA [59]. Originally estimated to extend beneath 120,000 km2 of Paleoproterozoic basement, subsequent profiling reported by Mandler and Clowes [60] traced comparable reflections (the Head-Smashed In sequence) over an additional 6000 km2 in similar tectonic terrane further south
Even more distinctive than the Winagami Sequence is the Wollaston Lake reflector (Figure 1 and Figure 7 [62]), traced by the LITHOPROBE reflection profiles in the Trans-Hudson hinterland of Saskatchewan, approximately 500 km northeast of the Winagami surveys. The Wollaston Lake Reflector presents as a distinct narrow band of reflections that can be traced for over 160 km. Mandler and Clowes [62] associate the Wollaston Lake reflector with the 1.265 Ga McKenzie thermal event, which is associated with well-known outcroppings of diabase dykes [63]. This is substantially younger than the inferred age of the Winagami sequence and thus implies two distinct thermal events, both with extensive plutonic injections. While the long-distance lateral transport of magma has been documented in outcropping sills and dikes [7,63,64] the continuity of individual sills like the Wollaston Lake over such large distances is made most evident by these seismic images.

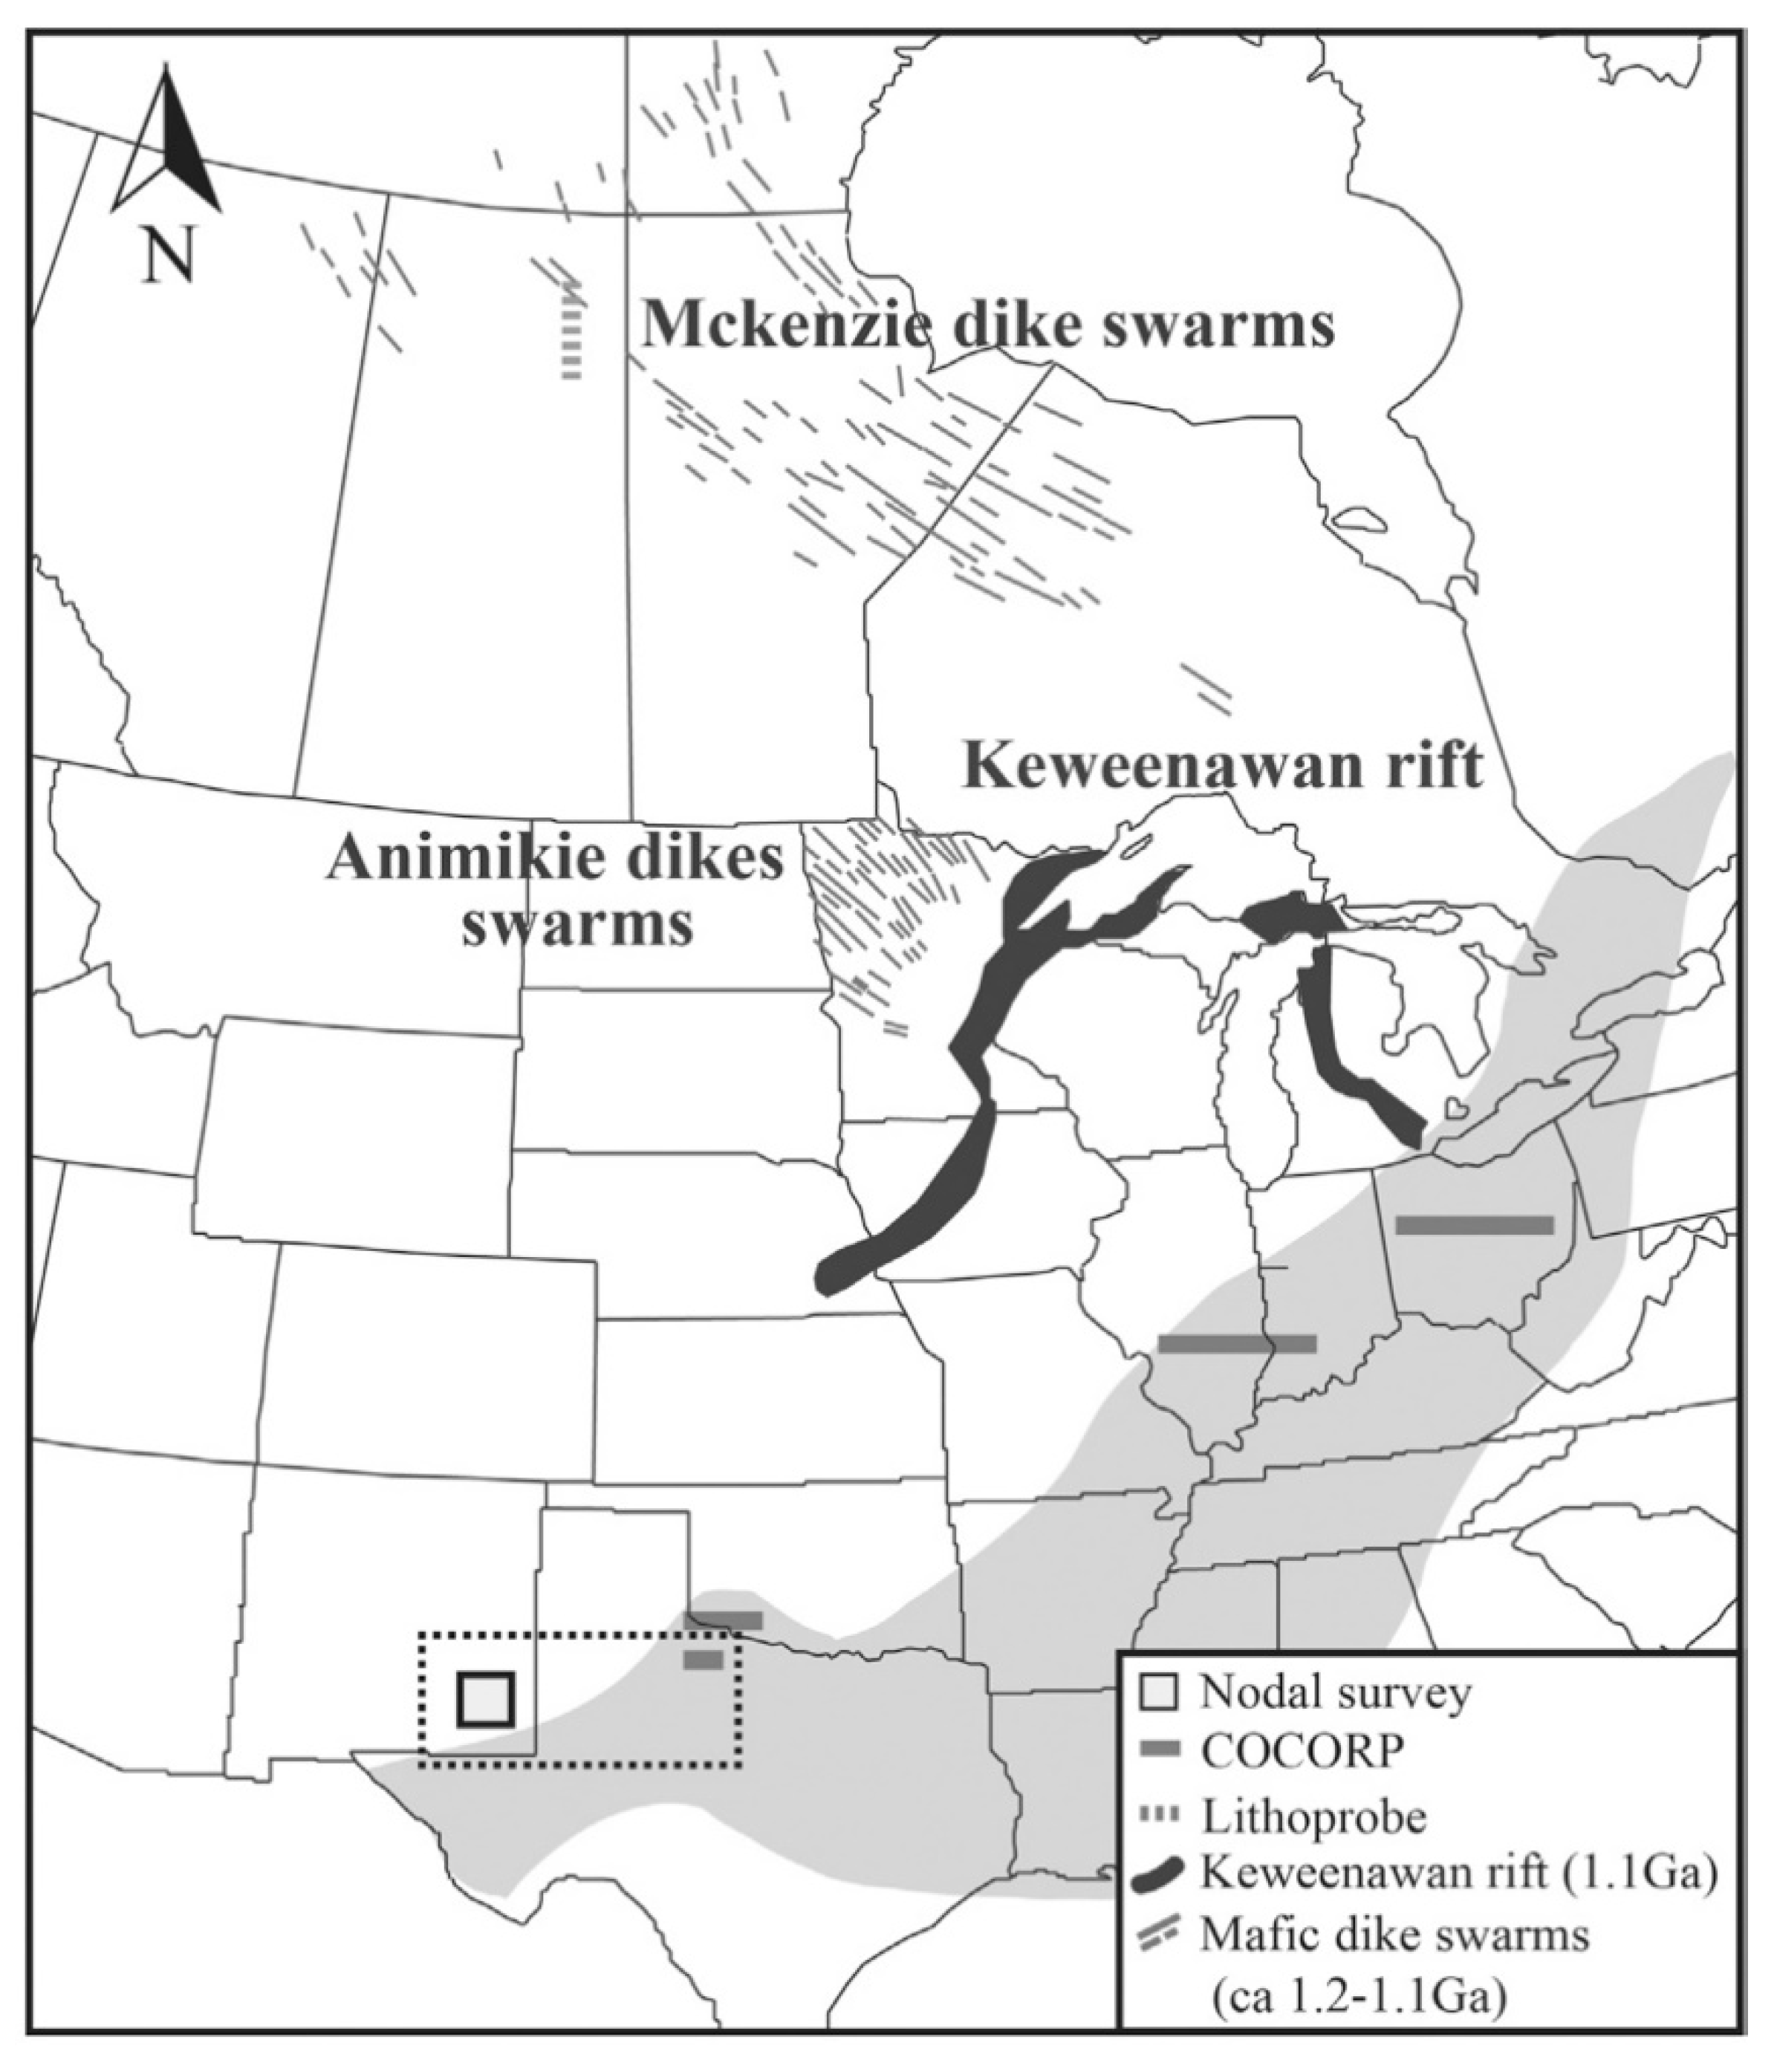
2.2.4. Basement Layering across the Central US: Fingerprints from the Keweenawan Plume?

The very first COCORP profiles were carried out in Hardeman County, northern Texas (Figure 1 [65]. The most notable discovery of those surveys was a distinctive sequence of subhorizontal reflections in the uppermost crystalline basement. These reflections were traced by subsequent COCORP surveys well into southern Oklahoma, where they are abruptly truncated by the Wichita Uplift (Figure 8). The extensive, layered nature of these reflections was initially interpreted to suggest a Proterozoic sedimentary or metasedimentary origin [66]. A supracrustal interpretation was reinforced by the observation of similarly layered reflections on COCORP seismic reflection profiling in Indiana, Illinois, and Ohio (Figure 1 and Figure 9 [67]) and oil industry data in eastern New Mexico (Figure 1 and Figure 10 [68,69]). The vast extent implied by correlating these layers from eastern New Mexico to central Ohio (Figure 11) is consistent with a depositional origin, although the apparent spatial correlation of these layers with the 1.5 MYA Granite-Rhyolite province [70] suggest the possibility that volcanic material (rhyolite?) rather than sedimentary rocks is involved [67]. However, the similarity of the Texas reflections to the Siljan images (compare Figure 8 with Figure 5) has continued to raise the question as to whether this midcontinent basement layering is actually a series of diabase sills.
Kim and Brown [69] revisited this issue in their interpretation of basement layering imaged by the reprocessing of 3D oil exploration seismic data in eastern New Mexico. Strong intrabasement reflections were reported from previous work by Adams and Miller [68] on 2D oil industry seismic data located nearby (Figure 10). Both of these papers referenced observations from an oil industry drillhole in southwest Texas that encountered layered ultramafic rocks at depths that seem to correspond to the basement layering in New Mexico (Figure 10 [72]). The ultramafic rocks recovered from the borehole were found to be of Keweenawan age (1.1635 Ga; [71]). Ernst and Buchan [73] describes links between layered ultramafic bodies and large-scale sill/dike intrusions. Kim and Brown ([69]) suggest that the southwest Texas borehole “calibration”, the similarity in appearance of the upper basement layering on COCORP seismic data from New Mexico to Ohio, together with their similarity to the Siljan results support their interpretation as mafic sills associated with the Keweenawan plume. If correct, this interpretation indicates lateral injection of Keweenawan magma in the upper crust of the central US on a continental scale (Figure 11). Kim and Brown [69] point out this extent is comparable to the spatial extent of the McKenzie dikes in NW Canada [62] which are presumably from the same plume source as the Wollaston Lake reflector (Figure 11).

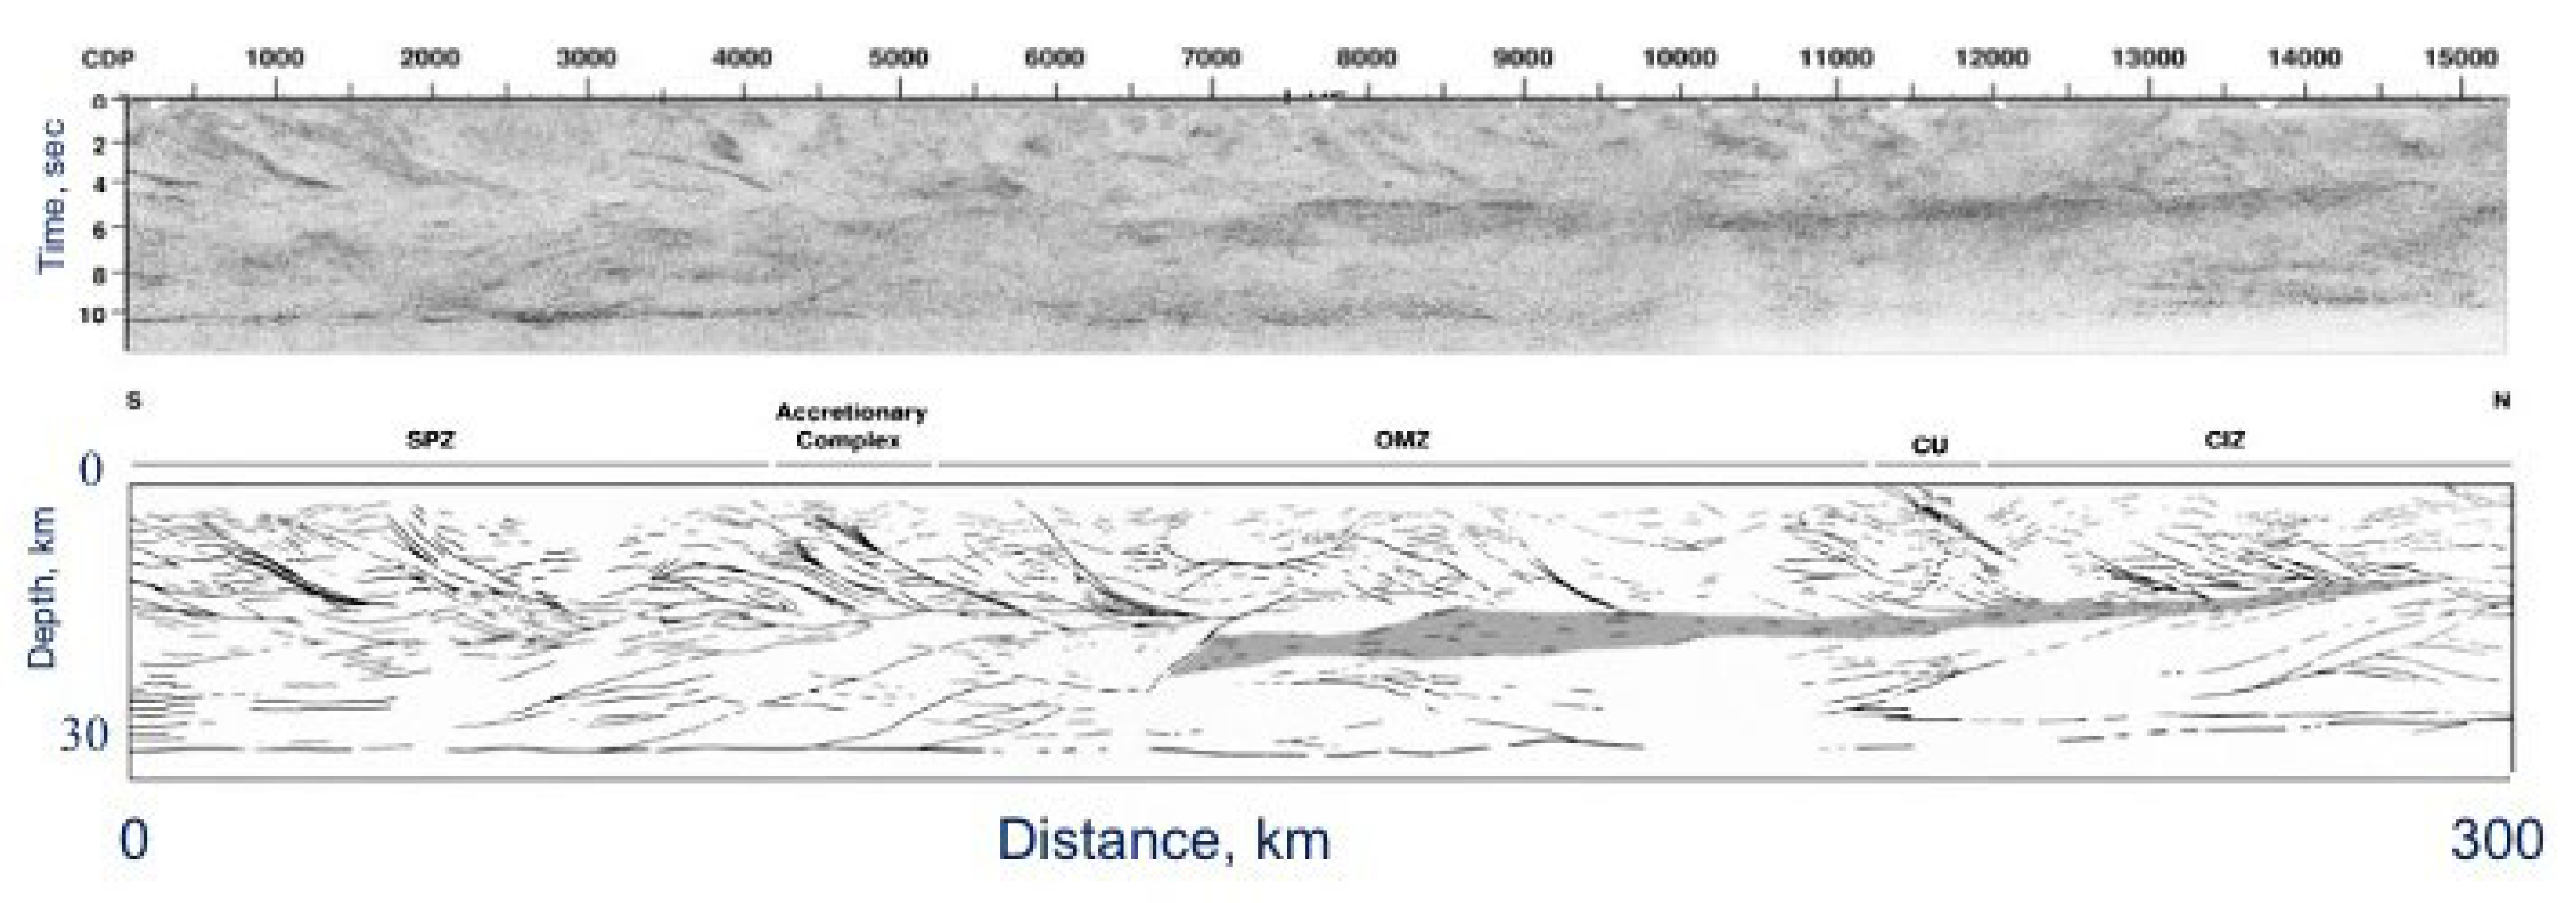
2.2.5. Deep Sills and Ore Deposits—The Iberian Massif

The extensive nature of the aforementioned examples of known and possible sills suggest thermal events of a substantial nature. Both heat and fluid transfer attendant on their emplacement may have been a significant factor in ore development. A possible link between deep sill emplacement and ore deposits is perhaps most strongly suggested by a deep seismic profile in southwestern Spain (Figure 1 and Figure 12). The IBERSEIS seismic profile across the Iberian massif [74,75] revealed a prominent subhorizontal band of strong reflectivity at midcrustal depths (Figure 12). The interpretation of this 140 km-long feature, known as the Iberian Reflective Body (IRB), as a mafic sill is argued from its relatively high reflection amplitudes (20% higher than reflections immediately above and below), its geological setting (exposing late Carboniferous mafic intrusions in an early collision zone), and its correspondence with a relatively high conductivity indicated by MT and high density inferred from gravity data [76]. The IRB also appears to have served as a rheological decollement for structures both above and below [74,76].
The correlation with high conductivity would seem to suggest that fluids (partial melts?) are still present, but the lack of modern magmatism in the geological record argues against such an inference. Carbonell et al. [76] suggests instead that the conductivity correlation is due to the enhancement of connectivity between graphite deposits in the overlying Ossa-Morena Zone during the emplacement of the IRB.
The IRB underlies the Ni-Fe deposits of the Aguablanca Ni-Fe deposits [77] and terminates beneath the massive sulfide deposits of the Iberian Pyrite belt [78] near Rio Tinto. Both of these Late Variscan mineralizations imply a substantial heat source at depth, most likely from mantle-derived mafic intrusions. That the IRB represents the remains of mafic magmatism that provided both the heat and fluids to generate the overlying ore deposits may be speculative, but it is certainly plausible [76]. The tectonic origin of this magmatism is unclear, though Carbonell et al. [76] suggest that is linked to a Carboniferous mantle plume which impacted a large part of northwestern Europe.

2.2.6. Mantle Sills?

Although the mantle has proven far less heterogeneous than the crust, at least in terms of reflectivity, prominent mantle reflections have now been traced by a number of seismic reflection profiles. Perhaps the best known of these have been mapped by the BIRPS (British Institutions Reflection Profiling Syndicate) in northwestern Britain [79,80,81]. The mantle reflections which have received the most attention are dipping features, often interpreted as “fossil” subduction zones [82,83,84,85]. However, relative extensive subhorizontal reflections have also been observed in the mantle near Britain which resemble those in the upper crust that have been interpreted as sills (e.g., Figure 13). Some of these “flat” mantle reflections are spatially linked to the nearby dipping mantle reflections [86] and thus may be genetically related. In any case, they too may represent igneous sills, although other speculative explanations have been put forward (e.g., detachments [87]).

3. Discussion

The preceding description of prominent, relative extensive reflections and reflection sequences has emphasized their interpretation as mafic sills. The basis for these interpretations ranges from unequivocal (e.g., Siljan reflections—drilled) to likely (Arizona—outcrop) to speculative (central U.S. seismic character). There are a number of caveats that must be considered in evaluating the interpretations of these and other reported images of deep intrusions. For example, the seismic sections shown in this paper are all 2D. Without 3D control, apparently subhorizontal reflections could just as well be along-strike images of features that are actually dipping at right angles to the line of the section. However, most of the examples here are based on surveys that did include 3D control, either in the form of a local grid of surveys (e.g., Siljan [54], North Texas [65], Great Britain [81]) or as formal three D seismic arrays (e.g., the Winagami reflections sequence [61], layered reflections in eastern New Mexico [69]).
Another consideration is that igneous intrusions may be manifest with different seismic characteristics than that exemplified by the Siljan sequence—i.e., narrow bands of strong reflectivity separated by larger bands of non-reflectivity. For example, Figure 14 (Upper left) shows a sample of BIRPS marine deep seismic reflection profiling data from northwest Britain [88] that indicates a lower crust that is highly layered and strongly reflective, a pattern commonly referred to as Layered Lower Crust (LLC). However, the layering in this case is more of a lamination, without the distinctive separation between reflective units that has been used to associate many of the sill examples in this paper with Siljan. This laminated appearance is characteristic of a number of seismic profiles in western Europe, particularly in areas affected by post-Variscan extension [89]. Based on the strong amplitudes of reflections making up this lamination, Warner [88] argues that they are most likely due to igneous intrusions or the juxtaposition of contrasting metamorphic compositions by pervasive shearing, although this remains a matter of debate [18]. Meissner et al. [90] argue from seismic anisotropy that the LLC develops by ductile processes (extension?) within warm, low-viscosity felsic lower crust with intercalations of mafic intrusions. Numerical modeling by Gerya and Berg [91] illustrates how crustal rheology can control the geometry of mafic intrusion, with a warm lower crust resulting in the lateral spread of magma with coeval viscous deformation. Thus, the different presentations of sills like Siljan/Wollaston vs. the LLC may be due to a contrast in crustal rheology—i.e., hot and ductile for the LLC vs. cold and brittle for the Siljan and its analogous reflectors—modulated by the stress field at the time of emplacement. However, the seismic data from the extended Norwegian continental margin [4,92] suggest that this maybe an over-simplification, as they show relatively continuous, distinct lower crustal sill reflectors (e.g., Figure 14; upper right) that resemble Siljan more than the LLC around Britain.
A number of mafic sills in both outcrop and seismic sections from basins exhibit a characteristic “saucer” shape which has fueled recent discussion about intrusion mechanics in sedimentary sequences [4,27,29,93,94]. This distinctive saucer shape has also been reported for intrabasement reflections on a several deep seismic profiles [48,95,96]. Figure 15 shows one particular distinctive example, the Surrency Bright Spot (SBS) encountered during a COCORP survey of the inferred suture zone between Laurasia and Gondwanaland buried beneath the coastal plain sedimentary rocks of southeastern Georgia. The strong amplitude of this spatially limited reflection was originally interpreted to indicate fluid involvement [95] though magma was ruled out due to its location on a long inactive passive continental margin. The saucer shape of the SBS (Figure 15) is now recognized as identical to that documented not only in oil industry 3D seismic data for various sedimentary basins but in notable outcrops of mafic intrusions [27]. The presence of saucer-shaped reflectors deep in the continental basement provides new context to evaluate mechanical models proposed to explain this geometry within sedimentary strata [4,38,93]. Thus the SBS (Surrency Bright Saucer?) is most likely a mafic intrusion, perhaps emplaced during the rifting of the Atlantic margin.
Moho reflections on many deep seismic surveys also exhibit strong amplitudes (e.g., Figure 2; [98]) and/or a layered character [99]. These characteristics have been interpreted to represent “underplating”, which may be another aspect of accreting/injecting mafic sills at the base of the crust [47,100].
Not every extensive prominent reflection or band of reflections is necessarily a sill. Setting aside the obvious example of sedimentary units (e.g., the finely layered, upper few seconds of the seismic sections shown in Figure 6, Figure 8, Figure 9 and Figure 10). Other processes can produce distinct reflection bands traceable over large distance. Figure 16 (right) show seismic data from west central Sweden not too distant from Siljan [101]. Lacking any other constraints, it would be tempting to interpret these as sills, perhaps related to the Siljan reflections. However, the tectonic setting, outcropping geology, and—most definitively—drill holes make clear that these reflections are actually thrust faults, part of a crustal scale nappe complex emplaced during the Caledonian orogeny [101]. Regional detachment faults have also appeared on crustal reflections surveys as strong, subhorizontal reflections of regional extent. The southern Appalachian detachment traced on COCORP surveys in Tennessee and Georgia [102] and the Main Himalayan Thrust imaged by the INDEPTH surveys in southern Tibet [103] are prime examples.
Implicit in our discussion of strong reflections is the presumption that the magmas involved—whether hot or frozen—represent emplacement from below. An alternative to consider is that the reflections arise from in situ melting. This was originally one interpretation of the seismic bright spots imaged by INDEPTH in Tibet [48,104]. A fluid magma at depth, whether a planar intrusion or an in-situ melt, should give rise to a prominent reflection (e.g., Table 1) regardless of its composition. It is unlikely that reflection data, or any geophysical observations, could distinguish between these two possibilities However, if a reflector under consideration is a frozen product of in situ melt, it is unlikely to have a significant reflection contrast with its surrounding country rock (of the same composition) unless substantial fractional crystallization is involved. On the other hand, a saucer-like reflection geometry in a strong indication that mechanical intrusion is involved. Of course, intrusions may well represent crustal as well as mantle melts, though the silicic composition of the former is less likely to generate a strong reflection unless it is still molten.
The seismic character of a reflector on a seismic section depends heavily on both details of acquisition and processing. This is particularly true for reflection amplitudes. For example, the upwardly convex geometry of saucer shaped intrusions implies some degree of amplification of the associated reflection due to focusing, which in turn is ameliorated by seismic migration [105]. Therefore, caution is warranted when basing interpretation on superficial similarities in appearance between reflections on seismic sections collected and processed by different groups and individuals.

4. Tectonic Implications

The direct implications of sills within sedimentary basins have been addressed in recent papers by Magee et al. [29], Schofield [106], as well as elsewhere in this volume [107,108]. The influence of deeper intrusives may be less obvious. Haxby et al. [109] modeled the effect of a high-density intrusion into the lower crust as a driver for basin formation, though this involved massive underplating rather than intrabasement sill emplacement. The deep sills cited in this paper, which appear as relatively thin layers, may seem volumetrically small compared to other plutonic manifestations (e.g., batholiths), however the more extensive examples, such as the Winagami reflector or the COCORP midcontinent basement layering, suggest thermal perturbation over very large areas. The potential link of these two examples with the McKenzie and Keweenawan events, respectively, implies that they may serve as fingerprints of distant mantle plumes in a manner similar to the better known exposed dyke swarms [110].
The form of sill reflectivity—e.g., distinct reflections or reflection sequences vs. finely laminated zones—may be a proxy for crustal rheology and an indicator of the stress regime at the time of their emplacement [91,111,112].. The presentation of basement sills as saucers versus planar geometries is another clue to the emplacement mechanics [27]. The observation that many of these reflectors appear largely undeformed by subsequent tectonic events places constraints on the post-intrusive evolution of the crust—e.g., the lack of substantial deformation. The limited and relatively biased sampling of the crust represented by modern deep reflection profiling undermines any substantive generalization about the age distribution of observed sills, although many of the ‘frozen” examples shown here either occur in Proterozoic crust or are believed to be Proterozoic in age.

5. Conclusions

Crustal seismic reflection profiles have revealed anomalously strong reflectors at numerous sites around the world. Seismic “bright spots” in tectonically active regions have been frequently attributed to fluid magma at depth, most often associated with modern extensional regimes. Some of the most distinctive reflections have been found within Precambrian basement and presumed to be “frozen” magma, most likely mafic since silicic intrusions are unlikely to provide a sufficient reflection contrast with host rock. The drilling of prominent basement reflectors near Siljan, Sweden, has confirmed them to be Proterozoic diabase sills. The correlation of similar strong reflection sequences in the southwestern US with adjacent outcrops of mafic intrusions strongly corroborates their interpretation as mafic sills as well. Extensive prominent reflections in northwestern Canada are likely to be buried manifestations of the McKenzie Dike swarm. More speculatively, an extensive layered sequence of strong reflections in the upper crust on COCORP seismic profiles that stretch from eastern New Mexico to central Ohio may be related to a distant Keweenawan mantle plume based on correlation with ultramafic rocks encountered in an oil industry borehole in west Texas. Both of these examples detail the long distance lateral transport of magma in brittle regimes. As “fingerprints” of major thermal events (plumes?), indicators of crustal rheology and stress during emplacement, and markers for post-emplacement deformation, sill reflections in the continental basement offer new constraints for models of crust and basin evolution.

Author Contributions

D.K. contributed the results for the US mid-continent and their analogy to the Canadian observations. L.D.B. provided the examples of magma bright spots and the colds sills outside North America as well as the concluding discussion. All authors have read and agreed to the published version of the manuscript.

Funding

This research received no external funding.

Conflicts of Interest

The authors declare no conflict of interest.

References

  1. Bradley, J. Intrusion of major dolerite sills. Trans. R. Soc. 1965, 3, 27–55. [Google Scholar]
  2. Hargraves, R.B. Physics of Magmatic Processes; Princeton University Press: Princeton, NJ, USA, 1980; p. 565. [Google Scholar]
  3. Spence, D.A.; Turcotte, D.L. Magma-driven propagation of cracks. J. Geophys. Res. 1985, 90, 575–580. [Google Scholar] [CrossRef]
  4. Cartwright, J.; Hansen, D.M. Magma transport through the crust via interconnected sill complexes. Geology 2006, 34, 929–932. [Google Scholar] [CrossRef]
  5. Marsh, B.D. Magmatism, magma, and magma chambers. In Treatise on Geophysics: Crust and Lithosphere Dynamics; Watts, A.B., Ed.; Elsevier: Amsterdam, The Netherlands, 2007; Volume 6, pp. 275–333. [Google Scholar]
  6. Thomson, K. Determining magma flow in sills, dykes and laccoliths and their implications for sill emplacement. Bull. Volcanol. 2007, 70, 183–201. [Google Scholar] [CrossRef]
  7. Elliot, D.H.; Fleming, T.H.; Kyle, P.R.; Fland, K.A. Long-distance transport of magmas in the Jurassic Ferrar large igneous province. Antarct. Earth Planet. Sci. Lett. 1999, 167, 89–104. [Google Scholar] [CrossRef]
  8. Muirhead, J.D.; van Eaton, A.R.; Re, G.; White, J.-D.; Ort, M.H. Monogenetic volcanoes fed by interconnected dikes and sills in the Hopi Buttes volcanic field, Navajo Nation, USA. Bull. Volcanol. 2016, 78, 11. [Google Scholar] [CrossRef]
  9. Bott, M.H.P.; Smithson, S.B. Gravity investigations of subsurface shape and mass distributions of granite batholiths. Geol. Soc. Am. Bull. 1967, 78, 859–878. [Google Scholar] [CrossRef]
  10. Oliver, H.W. Gravity and magnetic investigations of the Sierra Nevada batholith, California. Geol. Soc. Am. Bull. 1977, 88, 445–461. [Google Scholar] [CrossRef]
  11. Kauahikaua, J.; Hildebrand, T.; Webring, M. Deep magmatic structures of Hawaiian volcanoes, imaged by three-dimensional gravity models. Geology 2000, 28, 883–886. [Google Scholar] [CrossRef]
  12. Tizzani, P.; Battaglia, M.; Zeni, G.; Atzori, S.; Berardino, P.; Lanari, R. Uplift and magma intrusion at Long Valley caldera from INSAR and gravity measurements. Geology 2009, 37, 63–66. [Google Scholar] [CrossRef] [Green Version]
  13. Wei, W.; Unsworth, M.; Jones, A.; Booker, J.; Tan, H.; Nelson, K.D.; Chen, L.; Li, S.; Solon, K.; Bedrosian, P.; et al. Detection of widespread fluids in the Tibetan crust by magnetotelluric studies. Science 2001, 292, 716–719. [Google Scholar] [CrossRef] [PubMed]
  14. Lee, B.; Unsworth, M.; Arnason, K.; Cordell, D. Imaging the magmatic system beneath Krafla geothermal field, Iceland: A new 3-D electrical resistivity model from inversion of magnetotelluric data. Geophys. J. Int. 2020, 22, 541–567. [Google Scholar] [CrossRef]
  15. Al-Chalabi, M. Some studies relating to nonuniqueness in gravity and magnetic inverse problems. Geophysics 1971, 36, 835–855. [Google Scholar] [CrossRef]
  16. Beblo, M.; Björnsson, K.; Arnason, K.; Stein, B.; Wolfgram, P. Electrical conductivity beneath Iceland—Constraints imposed by magnetotelluric results on temperature, partial melt, crust and mantle structure. J. Geophys. 1983, 53, 16–23. [Google Scholar]
  17. Yin, C. Inherent nonuniqueness in magnetotelluric inversion for 1D anisotropic models. Geophysics 2003, 68, 138–146. [Google Scholar] [CrossRef]
  18. Thybo, H.; Artemieva, I. Moho and magmatic underplating in continental lithosphere. Tectonophysics 2013, 609, 605–619. [Google Scholar] [CrossRef] [Green Version]
  19. Iyer, H.M.; Evans, J.R.; Zandt, G.; Stewart, R.M.; Coakley, J.M.; Roloff, J.N. A deep low-velocity body under the Yellowstone Caldera, Wyoming: Delineation using teleseismic P-wave residuals and tectonic interpretation. Geol. Soc. Am. Bull. 1981, 92, 792–798. [Google Scholar] [CrossRef]
  20. Huang, H.H.; Lin, F.-C.; Schmandt, B.; Farrell, J.; Smith, R.B.; Tsai, V.C. The Yellowstone magmatic system from the upper mantle to the upper crust. Science 2017, 348, 773–776. [Google Scholar] [CrossRef] [Green Version]
  21. Lees, J.M. Seismic tomography of magmatic systems. J. Volcanol. Geotherm. Res. 2007, 167, 37–56. [Google Scholar] [CrossRef]
  22. Schuler, J.; Greenfield, T.; White, R.S.; Roecker, S.W.; Brandsdóttir, B.; Stock, J.M.; Pugh, D. Seismic imaging of the shallow crust beneath the Krafla central volcano, NE Iceland. J. Geophys. Res. Solid Earth 2015, 120, 7156–7173. [Google Scholar] [CrossRef] [Green Version]
  23. Kiser, E.; Palomeras, I.; Levander, A.; Zelt, C.; Harder, S.; Schmandt, B.; Hansen, S.; Creager, K.; Ulberg, C. Magma reservoirs from the upper crust to the Moho inferred from high resolution Vp and Vs models beneath Mount St. Helens, Washington State, USA. Geology 2016, 44, 411–414. [Google Scholar] [CrossRef] [Green Version]
  24. Zandt, G.; Leidig, M.; Chmielowski, J.; Baumont, D.; Yuan, X. Seismic detection and characterization of the Altiplano-Puna magma body, central Andes. Pure Appl. Geophys. 2003, 160, 789–807. [Google Scholar] [CrossRef]
  25. Ward, K.M.; Zandt, G.; Beck, S.; Christensen, D.H.; McFarlin, H.M. Seismic imaging of the magmatic underpinnings beneath the Altiplano-Puna volcanic complex from the joint inversion of surface wave dispersion and receiver functions. Earth Planet. Sci. Lett. 2014, 404, 43–53. [Google Scholar] [CrossRef]
  26. Waters, K. Reflection Seismology: A Tool for Energy Resource Exploration; Wiley: New York, NY, USA, 1981; p. 537. [Google Scholar]
  27. Polteau, S.; Mazzini, A.; Galland, O.; Planke, S.; Malthe-Sorenssen, A. Saucer-shaped intrusions: Occurrences, emplacement and implications. Earth Planet. Sci. Lett. 2008, 266, 195–204. [Google Scholar] [CrossRef]
  28. Thomson, K.; Schofield, N. Lithological and structural controls on the emplacement and morphology of sills in sedimentary basins. Geol. Soc. Lond. Spec. Publ. 2008, 302, 31–44. [Google Scholar] [CrossRef]
  29. Magee, C.; Muirhead, J.D.; Karvelas, A.; Holford, S.P.; Jackson, C.A.; Bastow, L.D.; Schofield, N.; Stevenson, C.T.; McLean, C.; McCarthy, W.; et al. Lateral magma flow in mafic sill complexes. Geosphere 2016, 12, 809–841. [Google Scholar] [CrossRef] [Green Version]
  30. Christensen, N.I. Poisson’s ratio and crustal seismology. J. Geophys. Res. 1996, 101, 3139–3156. [Google Scholar] [CrossRef]
  31. Brocher, T.M. Empirical relations between elastic wave speeds and density in the Earth’s crust. Bull. Seismol. Soc. Am. 2005, 95, 2081–2092. [Google Scholar] [CrossRef]
  32. Murase, T.; McBirney, A.R. Properties of some common igneous rocks and their melts at high temperatures. Geo. Soc. Am. Bull. 1973, 84, 3563–3592. [Google Scholar] [CrossRef]
  33. Christensen, N.I.; Mooney, W.D. Seismic velocity structure and composition of the continental crust: A global view. J. Geophys. Res. 1995, 100, 9761–9788. [Google Scholar] [CrossRef]
  34. Sanford, A.R.; Alptekin, Ö.; Toppozada, T.R. Use of reflection phases on microearthquake seismograms to map an unusual discontinuity beneath the Rio Grande rift. Bull. Seismol. Soc. Am. 1973, 63, 2021–2034. [Google Scholar]
  35. Matsumoto, S.; Hasegawa, A. Distinct S wave reflector in the midcrust beneath Nikko-Shirane volcano in the northeastern Japan arc. J. Geophys. Res. Solid Earth 1996, 101, 3067–3083. [Google Scholar] [CrossRef]
  36. Rinehart, E.J.; Sanford, A.R.; Ward, R.M. Geographic Extent and Shape of an Extensive Magma Body at Mid-Crustal Depths in the Rio Grande Rift Near Socorro, New Mexico. Rio Grande Rift Tectonics Magmatism 1979, 14, 237–251. [Google Scholar]
  37. Brown, L.D.; Krumhansl, P.A.; Chapin, C.E.; Sanford, A.R.; Cook, F.A.; Kaufman, S.; Oliver, J.E.; Schilt, F.S. COCORP seismic reflection studies of the Rio Grande rift. Rio Grande Rift Tectonics Magmatism 1979, 14, 169–184. [Google Scholar]
  38. Long, L.T.; Sanford, A.R. Microearthquake crustal reflections. Bull. Seismol. Soc. Am. 1965, 55, 579–586. [Google Scholar]
  39. Brocher, T.M. Geometry and physical properties of the Socorro, New Mexico, magma bodies. J. Geophys. Res. Solid Earth 1981, 86, 9420–9432. [Google Scholar] [CrossRef]
  40. Hermance, J.F.; Neumann, G.A. The Rio Grande rift: New electromagnetic constraints on the Socorro magma body. Phys. Earth Planet. Inter. 1991, 66, 101–117. [Google Scholar] [CrossRef]
  41. Reilinger, R.; Oliver, J. Modern uplift associated with a proposed magma body in the vicinity of Socorro, New Mexico. Geology 1976, 4, 583–586. [Google Scholar] [CrossRef]
  42. Larsen, S.; Reilinger, R.; Brown, L.L. Evidence of ongoing crustal deformation related to magmatic activity near Socorro, New Mexico. J. Geophys. Res. 1986, 91, 6283–6292. [Google Scholar] [CrossRef]
  43. Fialko, Y.; Simons, M. Evidence for on-going inflation of the Socorro Magma Body, New Mexico, from interferometric synthetic aperture radar imaging. Geophys. Res. Lett. 2001, 28, 3549–3552. [Google Scholar] [CrossRef] [Green Version]
  44. Sheetz, K.E.; Schlue, J.W. Inferences for the Socorro magma body from teleseismic receiver functions. Geophys. Res. Lett. 1992, 19, 1867–1870. [Google Scholar] [CrossRef]
  45. Ross, A. Deep Seismic Bright Spots. Ph.D. Thesis, Cornell University, Ithaca, NY, USA, June 1999. [Google Scholar]
  46. De Voogd, B.; Serpa, L.; Brown, L.; Hauser, E.; Kaufman, S.; Oliver, J.; Troxel, B.W.; Willemin, J.; Wright, L.A. Death Valley bright spot; a midcrustal magma body in the southern Great Basin, California? Geology 1986, 14, 64–67. [Google Scholar] [CrossRef]
  47. Jarchow, C.M.; Thompson, G.A.; Catchings, R.D.; Mooney, W.D. Seismic evidence for active magmatic underplating beneath the basin and range province, western United States. J. Geophys. Res. 1993, 98, 22095–22108. [Google Scholar] [CrossRef]
  48. Brown, L.D.; Zhao, W.; Nelson, K.D.; Hauck, M.; Alsdorf, D.; Ross, A.; Cogan, M.; Clark, M.; Liu, X.; Che, J. Bright spots, structure, and magmatism in southern Tibet from INDEPTH seismic reflection profiling. Science 1996, 274, 1688–1690. [Google Scholar] [CrossRef]
  49. ANCORP Working Group. Seismic reflection image revealing offset of Andean subduction-zone earthquake locations into oceanic mantle. Nature 1999, 397, 341–344. [Google Scholar] [CrossRef]
  50. Gase, A.C.; Van Avendonk, N.L.; Bangs, T.W.; Luckie, D.H.; Barker, S.A.; Henrys, F.G.; Fujie, G. Seismic evidence of magmatic rifting in the offshore Taupo Volcanic Zone, New Zealand. Geophys. Res. Lett. 2019, 46, 12949–12957. [Google Scholar] [CrossRef]
  51. Detrick, R.S.; Buhl, P.; Vera, E.; Mutter, J.; Orcutt, J.; Madsen, J.; Brocher, T. Multi-channel seismic imaging of a crustal magma chamber along the East Pacific Rise. Nature 1987, 326, 35–41. [Google Scholar] [CrossRef]
  52. Kent, G.M.; Singh, S.C.; Harding, A.J.; Sinha, M.C.; Orcutt, J.A.; Barton, P.J.; White, R.S.; Bazin, S.; Hobbs, R.W.; Tong, C.H.; et al. Evidence from three-dimensional seismic reflectivity images for enhanced melt supply beneath mid-ocean-ridge discontinuities. Nature 2000, 406, 614–618. [Google Scholar] [CrossRef]
  53. Canales, J.P.; Dunn, R.A.; Arai, R.; Sohn, R.A. Seismic imaging of magma sills beneath an ultramafic hosted hydrothermal system. Geology 2017, 45, 451–454. [Google Scholar] [CrossRef] [Green Version]
  54. Juhlin, C.; Pedersen, L.B. Reflection seismic investigations of the Siljan impact structure, Sweden. J. Geophys. Res. 1987, 92, 14113–14122. [Google Scholar] [CrossRef]
  55. Juhlin, C. Interpretation of the reflections in the Siljan Ring area based on results from the Gravberg-1 borehole. Tectonophysics 1990, 173, 345–360. [Google Scholar] [CrossRef]
  56. Papasikas, N.; Juhlin, C. Interpretation of reflections from the central part of the Siljan Ring impact structure based on results from the Stenberg-1 borehole. Tectonophysics 1997, 269, 237–245. [Google Scholar] [CrossRef]
  57. Hauser, E.C.; Gephart, J.; Latham, T.; Oliver, J.E.; Kaufman, S.; Brown, L.D.; Lucchitta, I. COCORP Arizona Transect: Strong Crustal Reflections and Offset Moho Beneath the Transition Zone. Geology 1987, 15, 1103–1106. [Google Scholar]
  58. Litak, R.K.; Marchant, R.H.; Brown, L.D.; Pfiffner, O.A.; Hauser, E.C. Correlating crustal reflections with geologic outcrops: Seismic modeling results from the southwestern USA and the Swiss Alps. Amer. Geophys. Union Geodyn. Ser. 1992, 22, 299–305. [Google Scholar]
  59. Ross, G.M.; Eaton, D.W. Winagami reflection sequence: Seismic evidence for post collisional magmatism in the Proterozoic of western Canada. Geology 1997, 25, 199–202. [Google Scholar] [CrossRef]
  60. Mandler, H.A.F.; Clowes, R. The HIS bright reflector: Further evidence for extensive magmatism in the Precambrian of western Canada. Tectonophysics 1998, 288, 71–81. [Google Scholar] [CrossRef]
  61. Welford, J.K.; Clowes, R.M. Three-dimensional seismic reflection investigation of the crustal Winagami sill complex of northwestern Alberta, Canada. Geophys. J. Int. 2006, 166, 155–169. [Google Scholar] [CrossRef] [Green Version]
  62. Mandler, H.A.F.; Clowes, R. Evidence for extensive tabular intrusions in the Precambrian shield of western Canada: A 160-km-long sequence of bright reflections. Geology 1997, 25, 271–274. [Google Scholar] [CrossRef]
  63. Fahrig, W.F. The tectonic settings of continental mafic dyke swarms: Failed arm and early passive margin. Spec. Pap. Geol. Assoc. Can. 1987, 34, 331–348. [Google Scholar]
  64. Muirhead, J.D.; Airoldi, G.; Rowland, J.V.; White, J.D.L. Interconnected sills and inclined sheet intrusions control shallow magma transport in the Ferrar large igneous province. Antarct. Geol. Soc. Am. Bull. 2012, 124, 162–180. [Google Scholar] [CrossRef]
  65. Oliver, J.; Dobrin, M.; Kaufman, S.; Meyer, R.; Phinney, R. Continuous seismic reflection profiling of the deep basement, Hardeman County, Texas. Geol. Soc. Am. Bull. 1976, 87, 1537–1546. [Google Scholar] [CrossRef]
  66. Brewer, J.A.; Brown, L.D.; Steiner, D.; Oliver, J.E.; Kaufman, S.; Denison, R.E. Proterozoic basin in the southern Midcontinent of the United States revealed by COCORP deep seismic reflection profiling. Geology 1981, 9, 569–575. [Google Scholar] [CrossRef]
  67. Pratt, T.; Culotta, R.; Hauser, E.; Nelson, D.; Brown, L.; Kaufman, S.; Oliver, J.; Hinze, W. Major Proterozoic basement features of the eastern midcontinent of North America revealed by recent COCORP profiling. Geology 1989, 17, 505–509. [Google Scholar] [CrossRef]
  68. Adams, D.C.; Miller, K.C. Evidence for late middle Proterozoic extension in the Precambrian basement beneath the Permian basin. Tectonics 1995, 14, 1263–1272. [Google Scholar] [CrossRef]
  69. Kim, D.; Brown, L.D. From trash to treasure: Three-dimensional basement imaging with “excess” data from oil and gas explorations. AAPG Bull. 2019, 103, 1691–1701. [Google Scholar] [CrossRef]
  70. Bickford, M.E.; Van Schmus, W.R.; Karlstrom, K.E.; Mueller, P.A.; Kamenov, G.D. Mesoproterozoic-trans-Laurentian magmatism: A synthesis of continent-wide age distributions, new SIMS U–Pb ages, zircon saturation temperatures, and Hf and Nd isotopic compositions. Precambrian Res. 2015, 265, 286–312. [Google Scholar] [CrossRef]
  71. Kargi, H.; Barnes, C.G. A Grenville-age layered intrusion in the subsurface of west Texas: Petrology, petrography, and possible tectonic setting. Can. J. Earth Sci. 1995, 32, 2159–2166. [Google Scholar] [CrossRef]
  72. Keller, G.R.; Hills, J.M.; Baker, M.R.; Wallin, E.T. Geophysical and geochronological constraints on the extent and age of mafic intrusions in the basement of west Texas and eastern New Mexico. Geology 1989, 17, 1049–1052. [Google Scholar] [CrossRef]
  73. Ernst, R.E.; Buchan, K.L. Layered mafic intrusions: A model for their feeder systems and relationship with giant dyke swarms and mantle plume centres. S. Afr. J. Geol. 1997, 100, 319–334. [Google Scholar]
  74. Simancas, J.F.; Carbonell, R.; Lodeiro, F.G.; Estaún, A.P.; Juhlin, C.; Ayarza, P.; Kashubin, A.; Azor, A.; Poyatos, D.M.; Almodóvar, G.R.; et al. Crustal structure of the transpressional Variscan orogen of SW Iberia: SW Iberia deep seismic reflection profile (IBERSEIS). Tectonics 2003, 22, 1062. [Google Scholar] [CrossRef]
  75. García-Lobón, J.L.; Rey-Moral, C.; Ayala, C.; Martín-Parra, L.M.; Matas, J.; Reguera, M.I. Regional structure of the southern segment of Central Iberian Zone (Spanish Variscan Belt) interpreted from potential field images and 2.5 D modelling of Alcudia gravity transect. Tectonophysics 2014, 614, 185–202. [Google Scholar] [CrossRef] [Green Version]
  76. Carbonell, R.; Simancas, F.; Juhlin, C.; Pous, J.; Pérez-Estaûn, A.; Gonzalez-Lodero, F.; Muñoz, G.; Heise, W.; Ayarza, P. Geophysical evidence of a mantle derived intrusion in S.W. Iberia. Geophys. Res. Lett. 2004, 31. [Google Scholar] [CrossRef]
  77. Tornos, F.; Casquet, C.; Galindo, C.; Velasco, F.; Canales, A. A new style of Ni-Cu mineralization related to magmatic breccia pipes in a transpressional magmatic arc. Aguablanca. Min. Depos. 2001, 36, 700–706. [Google Scholar] [CrossRef] [Green Version]
  78. Leistel, J.M.; Marcoux, E.; Thiéblemont, D.; Quesada, C.; Sánchez, A.; Almodóvar, G.R.; Pascual, E.; Sóez, R. The volcanic-hosted massive sulphide deposits of the Iberian Pyrite Belt. Miner. Depos. 1998, 33, 2–30. [Google Scholar] [CrossRef]
  79. Smythe, D.K.; Dobinson, A.; McQuillin, R.; Brewer, J.A.; Matthews, D.H.; Blundell, D.J.; Kelk, B. Deep structure of the Scottish Caledonides revealed by the MOIST reflection profile. Nature 1982, 299, 338–340. [Google Scholar] [CrossRef]
  80. Brewer, J.A.; Matthews, D.H.; Warner, M.R.; Hall, J.; Smythe, D.K.; Whittington, R.J. BIRPS deep seismic reflection studies of the British Caledonides. Nature 1983, 305, 206–210. [Google Scholar] [CrossRef]
  81. Flack, C.A.; Klemperer, S.L.; McGeary, S.E.; Snyder, D.B.; Warner, M.R. Reflections from mantle fault zones around the British Isles. Geology 1990, 18, 528–532. [Google Scholar] [CrossRef]
  82. Warner, M.; Morgan, J.; Barton, P.; Morgan, P.; Price, C.; Jones, K. Seismic reflections from the mantle represent relict subduction zones within the continental lithosphere. Geology 1996, 24, 39–42. [Google Scholar] [CrossRef]
  83. Steer, D.N.; Knapp, D.J.H.; Brown, L.D. Super-deep reflection profiling: Exploring the continental mantle lid. Tectonophysics 1998, 286, 111–121. [Google Scholar] [CrossRef]
  84. Cook, F.A.; van der Velden, A.J.; Hall, K.W.; Roberts, B.J. Tectonic delamination and subcrustal imbrication of the Precambrian lithosphere in northwestern Canada mapped by LITHOPROBE. Geology 1998, 26, 839–842. [Google Scholar] [CrossRef]
  85. van der Velden, A.J.; Cook, F.A. Relict subduction zones in Canada. J. Geophys. Res. 2005, 110, B08403. [Google Scholar] [CrossRef] [Green Version]
  86. Snyder, D.B.; Flack, C.A. A Caledonian age for reflectors within the mantle lithosphere north and west of Scotland. Tectonics 1990, 9, 903–922. [Google Scholar] [CrossRef]
  87. Reston, T.J. Mantle shear zones and the evolution of the North Sea basin. Geology 1990, 18, 272–275. [Google Scholar] [CrossRef]
  88. Warner, M. Basalts, water, or shear zones in the lower continental crust? Tectonophysics 1990, 173, 163–174. [Google Scholar] [CrossRef]
  89. Sadowiak, P.; Wever, T.; Meissner, R. Deep seismic reflectivity patterns in specific tectonic units of Western and Central Europe. Geophys. J. Int. 1991, 105, 45–54. [Google Scholar] [CrossRef] [Green Version]
  90. Meissner, R.; Rabbel, W.; Kern, H. Seismic lamination and anisotropy of the Lower continental crust. Tectonophysics 2006, 416, 81–99. [Google Scholar] [CrossRef]
  91. Gerya, T.V.; Burg, J.-P. Intrusion of ultramafic magmatic bodies into the continental crust: Numerical simulation. Phys. Earth Planet. Inter. 2007, 160, 124–142. [Google Scholar] [CrossRef]
  92. Wrona, T.; Magee, C.; Fossen, H.; Gawthrope, R.L.; Bell, R.E.; Jackson, C.A.-L.; Faleide, J.I. 3-D seismic images of an extensive igneous sill in the lower crust. Geology 2019, 47, 729–733. [Google Scholar] [CrossRef] [Green Version]
  93. Hansen, D.M.; Cartwright, J. The three-dimensional geometry and growth of forced folds above saucer-shaped igneous sills. J. Struct. Geol. 2006, 28, 1520–1535. [Google Scholar] [CrossRef]
  94. Goulty, N.R.; Schofield, M. Implications of simple flexure theory for the formation of saucer-shaped sills. J. Struct. Geol. 2008, 30, 812–817. [Google Scholar] [CrossRef]
  95. Pratt, T.L.; Mondary, J.F.; Brown, L.D. Crustal structure and deep reflector properties: Wide angle shear and compressional wave studies of the midcrustal Surrency bright spot beneath southeastern Georgia. J. Geophys. Res. 1993, 98, 17723. [Google Scholar] [CrossRef]
  96. Ivanic, T.; Korsch, R.J.; Wyche, S.; Jones, L.E.A.; Zibra, I.; Blewett, R.S.; Jones, T.; Milligan, P.; Costelloe, R.D.; van Kranendonk, M.J.; et al. Preliminary interpretation of the 2010 Youanmi deep seismic reflection lines and magnetotelluric data for the Windimurra igneous complex. In Proceedings, Youanmi and Southern Carnarvon Seismic and Magnetotelluric Workshop; 2013; pp. 93–102. Available online: https://www.academia.edu/33355649/Youami_and_Southern_Carnarvon_seismic_and_magnetotelluric_MT_workshop_2013 (accessed on 22 October 2020).
  97. Barnes, A.E.; Reston, T.J. A study of two mid-crustal bright spots from southeast Georgia (USA). Geophys. J. Int. 1992, 108, 683–691. [Google Scholar] [CrossRef]
  98. Carbonell, R.S.; Smithson, B. The bright Moho reflection in the 1986 Nevada PASSCAL, seismic experiment. Tectonophysics 1995, 243, 255–276. [Google Scholar] [CrossRef]
  99. Klemperer, S.L.; Hauge, T.A.; Hauser, E.C.; Oliver, J.E.; Potter, C.J. The Moho in the northern Basin and range province, Nevada, along the COCORP 40-N seismic reflection transect. Geol. Soc. Amer. Bull. 1986, 97, 603–618. [Google Scholar] [CrossRef]
  100. Suetnova, E.; Carbonell, R.; Smithson, S.B. Magma in layering at the Moho of the basin and range of Nevada. Geophys. Res. Lett. 1993, 20, 2945–2948. [Google Scholar] [CrossRef]
  101. Hedin, P.C.; Christopher, J.; Gee, D.G. Seismic imag8ng of the Scandinavian Caledonides to define ICDP drilling sites. Tectonophysics 2012, 554–557, 30–41. [Google Scholar] [CrossRef] [Green Version]
  102. Cook, F.A.; Vasudevan, K. Reprocessing and enhanced interpretation of the initial COCORP southern Appalachians traverse. Tectonophysics 2006, 420, 161–174. [Google Scholar] [CrossRef]
  103. Zhao, W.; Nelson, K.D.; Project INDEPTH Team. Deep seismic reflection evidence for continental underthrusting beneath southern Tibet. Nature 1993, 366, 557–559. [Google Scholar] [CrossRef]
  104. Makovsky, U.; Klemperer, S.L.; Ratschbacher, L.; Brown, L.D.; Li, M.; Zhao, W.; Meng, F. INDEPTH wide-angle reflection observations of P-to-S conversion from crustal bright spots in Tibet. Science 1996, 274, 1690–1691. [Google Scholar] [CrossRef] [Green Version]
  105. Yilmaz, O. Seismic Data Analysis: Processing, Inversion and Interpretation of Seismic Data; Society of Exploration Geophysicists: Tulsa, OK, USA, 2001; Volume 1, p. 2024. [Google Scholar]
  106. Schofield, N.; Holford, S.; Millett, J.; Brown, D.; Jolley, D.; Passey, S.R.; Muirhead, D.; Grove, C.; Magee, C.; Murray, J.; et al. Regional magma plumbing and emplacement mechanisms of the Faroe-Shetland sill complex: Implications for magma transport and petroleum systems within sedimentary basins. Basin Res. 2017, 29, 41–63. [Google Scholar] [CrossRef]
  107. Syndes, M.; Fjeldskaar, W.; Grunnaleite, I.; Løtveit, I.F.; Mjelde, R. The Influence of magmatic intrusions on diagenetic processes and stress accumulation. Geosciences 2019, 9, 477. [Google Scholar] [CrossRef] [Green Version]
  108. Syndes, M.; Fjeldskaar, W.; Grunnaleite, I.; Løtveit, I.F.; Mjelde, R. Transient thermal effects in sedimentary basins with normal faults and magmatic sill intrusions—A Sensitivity Study. Geosciences 2019, 9, 160. [Google Scholar] [CrossRef] [Green Version]
  109. Haxby, W.F.; Turcotte, D.L.; Bird, J.M. Thermal and mechanical evolution of the Michigan basin. In Developments in Geotectonics; Bott, M.H.P., Ed.; Elsevier: Amsterdam, The Netherlands, 1976; Volume 12, pp. 57–75. [Google Scholar]
  110. Ernst, R.E.; Buchan, K.L. The use of mafic dyke swarms in identifying and locating mantle plumes. Geol. Soc. Am. Spec. Pap. 2001, 352, 247–275. [Google Scholar]
  111. Gretener, P.E. On the mechanics of the intrusion of sills. Can. J. Earth Sci. 1969, 6, 1415–1419. [Google Scholar] [CrossRef]
  112. Menand, T. The mechanics and dynamics of sills in layered elastic rocks and their implications for the growth of laccoliths and other igneous complexes. Earth Planet. Sci. Lett. 2008, 267, 93–99. [Google Scholar] [CrossRef]
Figure 1. Map showing the locations of seismic data cited in this paper. The numbers refer to the figures in this paper.
Geosciences 10 00449 g001
Figure 2. (Left) “True Amplitude” deep seismic reflection section showing a “bright spot” interpreted to mark magma in the mid-crust in the central Rio Grande Rift. (Right) reflection amplitude vs. depth for the sum of raw seismic traces quantifying the anomalous nature of the reflection amplitude of the Socorro Bright Spot (COCORP Line 1; [36,45]).
Geosciences 10 00449 g002
Figure 3. Strong subhorizontal reflections mapped in the upper 10 km of Proterozoic crust by seismic reflection profiling at the Siljan Ring Sweden [55]. Depth assuming the average velocity of 6 km/s. R1–R5 label individual reflectors in this stack.
Geosciences 10 00449 g003
Figure 4. Detail of the Siljan Ring reflections in Figure 3 correlated with the borehole observations of diabase intrusions (solid black lines, with indicated thicknesses [55]). The sills date from 850 to 1700 my. This clear identification of strong reflectivity with mafic sills [55,56] has served as a reference for the interpretation for similar appearing reflection sequences in other areas.
Geosciences 10 00449 g004
Figure 5. Prominent layered reflections (A) traced by the COCORP seismic reflection profiles in central Arizona [57]. Seismic modeling of mafic intrusions exposed nearby, together with the similarity in reflection character to the Siljan Ring reflectors, supports the interpretation of this sequence as also due to mafic intrusion [58]. The deeper reflections (C, B) may mark still-fluid magma. M indicates possible Moho reflections.
Geosciences 10 00449 g005
Figure 6. (Top) the Winagami reflection sequence revealed by LITHOPROBE reflection profiling in Alberta, NW Canada [59]. (Bottom) presumably correlative northward extension of the Winagami reflectors mapped by LITHOPROBE 3D seismic profiling [61].
Geosciences 10 00449 g006
Figure 7. The Wollaston Lake reflector, imaged by LITHOPROBE seismic reflection profiling in Saskatchewan, NW Canada [62]. This feature can be traced as a distinct narrow band of reflections for 160 km within the Early Proterozoic Trans-Hudson hinterland. Based on its reflection character and tectonic context, it has been interpreted as a diabase sill associated with the 1.27 Ga McKenzie igneous event.
Geosciences 10 00449 g007
Figure 8. Layered reflectors traced by COCORP seismic profiles in northern Texas and southern Oklahoma [66]. P-C indicates the top of Precambrian basement from local boreholes. Arrows mark the reflective sequence (A, B, and C), here interpreted as mafic sills. Dashed line indicates the apparent truncation of basement reflections along the Burch fault of the Wichita Mountains.
Geosciences 10 00449 g008
Figure 9. Layered basement reflections from the COCORP reflection profiles in western Ohio [67].
Geosciences 10 00449 g009
Figure 10. (Left and Right) layered basement reflections from the reprocessing of oil exploration seismic data from east central New Mexico [68,69]. (Center) oil industry drilling has identified correlative layered reflectors in southwest Texas as being from layered ultramafic rocks [71]. After Kim and Brown [69].
Geosciences 10 00449 g010
Figure 11. Comparison of the extent of sills, represented by LITHOPROBE seismic lines, and exposed dikes in northwest Canada associated with the Proterozoic McKenzie event with the extent of layered reflectors that appear to be correlative beneath much of the US midcontinent sedimentary rock cover, as represented by COCORP surveys. The lightly shaded area indicates the inferred extent of the Proterozoic Granite-Rhyolite provide [70]. After Kim and Brown [69].
Geosciences 10 00449 g011
Figure 12. IBERSEIS deep seismic reflection profile tracing a prominent midcrustal reflection sequence beneath the Iberian Massif [74]. Top: time migrated seismic section. Bottom: line drawing.
Geosciences 10 00449 g012
Figure 13. Strong, subhorizontal reflector in the mantle beneath northwest Great Britain from BIRPS marine data (After Snyder and Flack [86]). M indicates the position of the Moho at approximately 8 s (ca 25 km). Note that the top of this section corresponds to 5 s TWTT instead of the customary 0 s (surface).
Geosciences 10 00449 g013
Figure 14. (Left) laminated reflections in the lower crust of NW Britain from the BIRPS marine reflection profiling [88]. (Right) distinct reflections interpreted as sills in the extended lower crust of the Norwegian continental margin [4]. T is interpreted as a reflection from the top of a high velocity body (HVB; mafic underplating?).
Geosciences 10 00449 g014
Figure 15. (Left) Unmigrated COCORP true amplitude section showing the Surrency Bright Spot [95]. (Upper Right) Blow up of migrated image of the Surrency Bright Spot [95]). (Lower Right) depth contour of the Surrency Bright Spot from the COCORP 3D seismic survey [97]. The “saucer” shape of this basement reflector is comparable to those associated with mafic intrusions imaged by 3D oil industry data and in outcrop [27].
Geosciences 10 00449 g015
Figure 16. High amplitude, subhorizontal, and west dipping layered reflections from deep seismic surveys in west-central Sweden. Drilling and outcrop correlations identify these as thrust structures rather than intrusion [101].
Geosciences 10 00449 g016
Table 1. Relevant physical properties of representative materials. The velocity measurements correspond to 200 MPa and the magma measurements correspond to 2000 °C.
MaterialVp (km/s) @ 200 MpaDensity, kg/m3RC % against UCCSource
granite-granodiorite6.2462.760.3[30,31]
diabase6.7122.879.3[30,31]
andesitic magma2.52.45−46.3[32] Mt. Hood andesite
basaltic magma6.2432.76−30.6[32] Columbia River Basalt
Phyllite6.2432.760,7[30,31]
Average upper continental crust (UCC)6.22.760.0[31,32,33]
Publisher’s Note: MDPI stays neutral with regard to jurisdictional claims in published maps and institutional affiliations.

