Reconstructing Boulder Deposition Histories: Extreme Wave Signatures on a Complex Rocky Shoreline of Malta


School of the Environment, Geography and Geosciences, University of Portsmouth, Portsmouth PO1 3HE, UK
*
Author to whom correspondence should be addressed.
Geosciences 2020, 10(10), 400; https://doi.org/10.3390/geosciences10100400
Submission received: 31 August 2020
/
Revised: 25 September 2020
/
Accepted: 29 September 2020
/
Published: 6 October 2020
(This article belongs to the Special Issue Geomorphological and Sedimentological Imprints of Storm Events)
Abstract
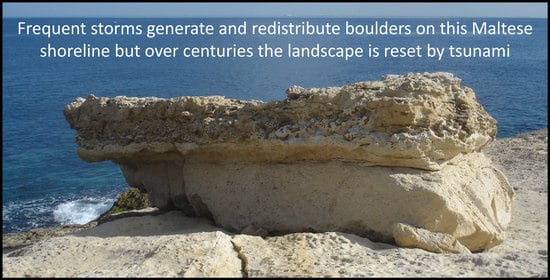
:The Żonqor coastline, southeast Malta, displays an exceptional range of geomorphic signatures of extreme coastal events. This paper brings together evidence acquired from a field survey, analysis of time-sequential imagery, and hydrodynamic modelling to investigate the histories of boulder groups identified by their intrinsic and contextual characteristics. Clear differences are revealed between the distribution of boulders recently moved and those of considerable age. Tracking the movement of boulders since 1957 confirms that storms of surprisingly frequent interval are capable of complex boulder movements, including lifting of megaclasts. Scrutiny of the ancient boulders, including weathering features and fascinating landward-facing (reverse) imbrication, cautiously suggests tsunami as the agent for their emplacement. A novel method is developed for depicting the velocity decay profiles of hypothetical waves, which overcomes some of the limitations of the Nott approach. Applied here, the wave run-up context further sets the ancient movers apart from their recent mover companions. The combined evidence implies a palimpsestic landscape where storm waves are regular geomorphic agents that add to and rework the distribution of boulders close to the shoreline, but over long time periods the landscape becomes reset by tsunami—a concept that is of value to agencies in Malta responsible for coastal safety, planning and management.
1. Introduction
Over the past two decades, a plethora of studies has sought to identify, classify and interpret geomorphic evidence of extreme waves along shorelines based on analyses of coastal boulder deposits (CBDs) (e.g., [1,2,3,4,5,6,7,8,9,10]). A frequent finding within such studies is that both storm and tsunami waves can detach, transport and deposit particles up to megaclast size making it difficult to assign unambiguous formative mechanisms for CBDs. Nevertheless, the reliable results from such studies are valuable for application within assessments of the potential hazards that extreme waves could present to local coastlines (e.g., [11,12]). Thus, it is important to ascertain values of the magnitudes and frequencies of occurrence of the extreme waves that created the CBDs. Notable challenges have been to discriminate between CBDs created by storm or tsunami waves (e.g., [13]) and to determine the extent to which the critical extreme waves are unique and/or exceptional, or instead associated with more frequent strong storm events (e.g., [14,15]).
A common method of discrimination has been to apply hydrodynamic equations to hindcast likely wave velocities and heights within a range of related procedures collectively termed the ‘Nott approach’ by Cox et al. [13], after initial development by Nott [16,17,18] and subsequent revisions (e.g., [19]). Typically, it involves hydrodynamic equations applied according to the dimensions and masses of a representative range of boulders to determine the minimum wave velocities and heights required to achieve their detachment. These wave heights are then compared to details of the local wave climate maxima. Overlap between modelled and local wave heights is taken as being indicative of storm wave detachment and significantly outlying modelled wave heights are interpreted as being indicative of tsunami. Although some such studies utilising effective dating have linked their results to documented historic tsunami [2,3,8,20] or storms [21], such data are not always available. The Nott approach has a burgeoning scientific following but also has its critics. Cox et al. [13] questioned the reliability of the wave height calculations and thus their application for distinguishing between detachment due to storm or tsunami waves, with notable warning on the uncertainty associated with conversion of wave velocity to wave height based on the Froude number (see also [22]). These are important considerations in areas such as the Mediterranean where both storms and tsunami are well documented and there is disagreement over their relative importance [14,15]. In relating wave energy to boulder transport, such equations should be employed in complement with field and other sources of evidence [13].
It is a definitive characteristic of extreme waves that their run-up extends further onshore and to higher elevations than regular storms, and deposit coarse clastic material throughout the entire area which they inundate. Inevitably, then, there is an overlap of extreme and storm wave signatures in the lower part of a site wherein both are intermingled, whereas on higher elevation zones extreme wave signatures alone may leave their mark as reported for southeast Sicily by Barbano et al. [23,24]. The result is a varied spatial distribution of erosional and depositional evidence that complicates the task of discriminating between storms and tsunami as geomorphic agents. This is exacerbated by the fact that contemporary storm waves also continue to act in the zone of overlap, routinely modifying the disposition of pre-existing sediments as reported for southeast Malta by Causon Deguara and Gauci [21]. Thus, there is also a need to distinguish these elements and to consider the full coastal slope that may contain evidence of more ancient events additional to the narrower shoreline zone of contemporary storm activity.
The location of Malta in the centre of the Mediterranean Sea means that it is exposed both to storm waves and tsunami [12,25]. Recent research has presented evidence of extreme wave impacts on Maltese coasts at elevations up to >20 m above sea level (asl) [7,8,26]. The evidence embraces a range of both depositional and erosional signatures, with many existing features within the range of potential storm wave energy [8] and some outlying features being interpreted as tsunamigenic in origin [7,26]. The specific study site was selected carefully at Żonqor on the southeast coast of Malta because it exhibited significant CBDs and has been exposed to documented historic tsunami and extreme storms [7,12].
This paper addresses the aforementioned issues by blending evidence from field survey, analysis of time-sequential imagery and hydrodynamic modelling with the overarching aim to explore the sequence of mechanisms and events that have led to the deposition of a complex CBD at Żonqor. It seeks to discriminate between the transport histories of boulder groups identified by their intrinsic and contextual characteristics and, in doing so, we investigate the nature of extreme wave deposits and their relationship to those evidently emplaced by contemporary storm activity.
A series of previous studies has been valuable in placing the site in the context of other Maltese sites [7,8]. Two previous studies applied the Nott approach to examine the detachment of boulders at and close to the shore [8,21]. The majority of their results placed the hindcast detachments within the ranges of both likely storm and historic tsunami waves so that discrimination was not possible. Observations by Causon Deguara and Gauci [21] revealed movements of large boulders by contemporary storms and led to the contention that detachment and reworking are possible by both storm and tsunami agents in repeated episodes.
The complexity of the CBD at this site presents challenge and opportunity for further research and this paper endeavours to build upon the previous studies by: (i) application of several independent indicators including wave propagation, boulder attitude and weathering state to elucidate likely boulder mobility rather than reliance on the Nott approach alone; (ii) a focus on locations and patterns of boulder deposition rather than dependence on hindcasting the point of boulder detachment; (iii) compilation of boulder transport histories as a means with which to disentangle the effects of multiple extreme wave events on the composition of the CBD. In addition, the paper presents a novel approach for characterising the decay of velocity, at an indicative level, as breaking extreme waves inundate the shore. It is potentially suitable for scenario-modelling different types of wave and elucidating the importance of storm waves experienced over recent decades in explaining the distribution of boulder deposits.
This study makes a significant advance in investigating the origins and geomorphic impact of historical extreme wave events on the east coast of Malta and, thereby, contributes to an awareness of contemporary coastal hazard threats. Given the extent to which this coastline is developed in respect of residential settlement, economic activity and public utilities, these factors must also be considered in hazard planning and for public safety.
2. Study Site and Context
2.1. Geographical and Geological Setting
Situated on the south-east coast of Malta, the study site at Żonqor stretches from Żonqor Point in the south to an unnamed bay to the north (14.564° E, 35.877° N), a linear distance of 1.5 km (Figure 1 and Figure 2). In general planform, the coastline is broadly linear and facing northeast, terminating at the southern end at the Marsaskala (Wied Il-Għajn) estuary. Landward from the shoreline, moderate coastal slopes rise inland from Marsaskala Bay towards a summit ridge at 50 m above sea level (asl). A minor planform convexity in the coastal slope terminates in the low headland of Iż-Żelliqa. To both north and south, this coastal bulge is flanked by rocky inlets at Għar Id-Duħħan and Il-Ilsien, respectively. At elevations below 11 m asl, this coastline displays an abundance of large and very large boulders of up to 10 m in a-axis length, and embraces strong evidence of extreme wave activity and abundant evidence of boulder movement by contemporary storm waves.
Malta lies within a microtidal environment in which tidal range varies from c. 0.046 m at neaps to c. 0.206 m at spring tides [27]. The maximum recorded height of a storm wave propagating from the north-northeast to impact the northeast coast of Malta is 6.75 m; from this value a maximum significant breaking wave height at break point was calculated as 7.70 m [21]. The duration of the observations on which these calculations rely was, however, limited to 21 months and, statistically, would have been unlikely to capture events of a longer return period. Furthermore, the height of the highest single wave would typically be some 1.5 to 2 times greater than the maximum significant wave height [28]. Although this suggests that the most extreme storm waves offshore could exceed 10 m at the recording site northwest of Gozo, the propagation of such heights inshore is likely to be limited by nearshore water depths at the study site where the −10 m bathymetric contour is c. 130 m offshore and the −5 m contour is some 30 to 80 m offshore. Allowing for the moderately sloping nearshore bed, a wave will typically break in water depths of 0.8 to 1 times the wave height [28] so that the largest waves would break well before reaching the shore; thus, the maximum breaking storm wave of 7.7 m defined by Causon Deguara and Gauci [21] suitably represents the theoretical highest single storm wave that can break at the shoreline itself.
The Żonqor site is underlain by gently dipping sedimentary rocks of Oligocene and Miocene age. Lower Globigerina Limestone (LGL) comprises the dominant lithology across the study area. It is characterised by a homogeneous yellow micrite with a high Globigerina content and exhibiting an orthogonal joint pattern, with individual sedimentary units as thick as 1.5 m [29,30,31]. The LGL commonly forms a distinct scarp up to 1.5 m high. Phosphorite Conglomerate Beds (PCB) typically lie at the base of the Lower Globigerina Limestone (at the same stratigraphic level as the basal Globigerina Limestone Phosphatic Bed at sites elsewhere in Malta, described by Carbone et al. [32] and Baldassini and Di Stefano [33]. These beds, commonly c. 0.5 m in thickness, are conglomerates composed of gravel, pebbles and rounded cobbles formed of phosphatic concretions set in a matrix of Globigerina micrite, and impregnated and hardened by francolite, dahllite and glauconite crystallisation [34,35]. Pedley [34] stated that the principal components of the nodules are calcium carbonate and calcium phosphate, together comprising over 80% of the rock. Hardened by phosphate mineralisation, its top surface is relatively planar in form, whereas its basal contact may be highly irregular. In some places, there is a concentration of cobbles in its lower part which form a less consolidated stratum. PCB outcrops are largely restricted to the lower part of the coastal ramp, in a zone of active erosion by incoming waves. This distinctive lithology renders PCB suitable as a tracer of boulder transport across the coastal ramp, either as individual clasts or, more commonly, attached to a mass of LGL.
Finally, Lower Coralline Limestone (LCL) in part outcrops close to the shoreline and completes the tripartite geological composition of the shore zone at this site.
2.2. Geomorphology of the Coastal Slope
The coastal zone of current interest lies mostly below 15 m asl, as illustrated by the generalised schematic slope profile in Figure 3.
A clear geomorphic zonation of original surface features can be identified from the shoreline landwards, anthropogenic modifications to the landscape notwithstanding. The zonation is most fully developed along a transect directly inland from the Iż-Żelliqa headland and is clearly visible on Google Earth imagery (14 April 2013). The individual zonal components depicted in Figure 3 vary in both width and elevation along the shore. From the immediate shoreline, a platform of rock is formed by the Lower Coralline Limestone. It is characterised by a pocked surface darkened by biofilm and commonly extends some 3 to 25 m inland (Zone 1). It is overlooked by the scarp face (Zone 2) of the overlying Lower Globigerina Limestone, a vertical cliff up to 1.5 m high and commonly undercut by an erosional notch at its base along the exposure of the PCB unit.
It is evident that the Lower Globigerina scarp is a major source of clast production, exposed as it is to storms and other wave activity by its position at the head of the shore platform. Typically, the scarp foot may be as low as 1.9 m asl and is regularly washed by wave run-up to form a horizontal notch that is coincident with the less indurated middle unit of the PCB. The undercut may create an unsupported mass of LGL up to 1.5 m thick with horizontal overhang of up to 3.5 m.
This allows storm waves driving into the undercut to create a lift force on the base of the overhang causing a tension crack to develop at the head of the notch. Alternatively, as the notch develops and deepens, the overhang itself may simply become unstable geotechnically, thus opening a tension crack at the top surface of the overhang. In either case, the outcome is the detachment and settlement of the overhanging mass onto the platform surface below. There are several such rock masses lying adjacent to the scarp with maximum long axis length frequently in the range 6–10 m, the largest of which at c. 55 tonnes has box dimensions of 10 m × 6 m × 1.5 m (Figure 4).
Landward from the scarp top, the ramped shore platform surface of fresh clean rock rises landward with a gradient of c. 6° and a width of up to 20–40 m (Zone 3). Large boulders, generally with a-axes exceeding 2 m, are sparsely distributed across its surface, whereas finer clastic material is conspicuously absent from this zone, implying that it has been swept clear by contemporary storm wave run-up and backwash. At the head of the ramp lies a major berm up to 20 m wide (Zone 4), formed by large boulders frequently exceeding 4 m in long axis, with occasional individuals up to 6 m.
Underneath the berm the bedrock surface is very different in nature. Here, subsoil karstic rock features [36,37,38] are present in the form of smooth rounded pockets and holes which contain original terra rossa soil (displayed clearly in Figure 5, at 14.56935° E, 35.87307° N). These features are characteristic of subcutaneous karstic weathering and indicative of an ancient land surface, in contrast with the fresh aspect of the nearby exposed platform shoreward of the berm. At the landward margin of the boulder berm, at an elevation of c. 7 m asl, a low bluff with a subtle change in gradient marks the onset of a gravel- and cobble-strewn overwash plain of variable width (Zone 5), with thin surface soil, smears of red soil on rock surfaces and some vegetation; examples of severely weathered individual boulders are also present. The scrub vegetation appears to be associated with the presence of collapsed rocky walls, indicative of former field enclosure and agricultural usage. The boulder berm and bluff line appear to represent a significant boundary between the recently eroded marine surface below and an ancient land surface above and, thereby, to demarcate the maximum extent of regular wave erosion.
South of Għar Id-Duħħan, the view landward is dominated by a vegetated sub-vertical bluff, which creates a salient facet of the landscape. This, in fact, is the elevated terrace strip of made ground atop the former municipal refuse tip, now occupied by a trackway, forming a landward limit to the lower shore Zones 1–5. Visible components of the made ground are gravel and well-shaped building stones among the general rubble.
Some 60–90 m from the shoreline, another zone of boulders is present at elevations of c. 10.5–12 m asl (Zone 6). The boulder fields in this zone are frequently characterised by individuals showing deeply recessed surfaces, honeycomb patterning, overhanging visors and a darker hue, all features indicative of long-weathered rock surfaces. North of Għar Id-Duħħan, however, the coastal track climbs above the elevation of this boulder evidence on the ground. Thus, at elevations above 10 m asl and some 70–80 m from the shoreline, the profile differs between north and south; this boulder zone is found above the trackway at the south end of the Żonqor coast (Figure 2, labelled S+) and below the trackway along the Għar Id-Duħħan coast (Figure 2, labelled N+).
It is unfortunate that the terrace of artificial made ground occupied by the track serves to obscure a zone of natural terrain at 7–10 m asl critical to the discrimination between the marine influences and historical anthropogenic activity. The origin of recent artificially made ground masking the original natural land surface was identified from aerial photography as sometime between 1967 and 1988; it appears to have been completed by 2002 (Google Earth). The aerial photography of 1967, however, does reveal the former features of the subsequently buried surface, complete with field boundaries and the presence of large boulders now buried, although not at a high resolution. Nevertheless, the made ground denies important visual perspectives across the coastal landform assemblage, hampering observation of field relationships between geomorphic forms and patterns and thereby complicating the successful interpretation of landscape reconstruction; its limits are mapped (Figure 2) and define the area excluded from this study.
At elevations above 12 m asl, agriculture is still currently active and the artificial terraced landscape (Zone 7) has obliterated any relevant evidence of extreme wave signatures that may have been present, such as those displayed at elevations up to 20 m asl at L-Aħrax, some 23 km northwest from Żonqor along the same coast [7].
3. Materials and Methods
A combination of approaches has been employed to characterise and discriminate between boulders that have been transported upslope beyond the shore platform over recent decades and those that have remained in situ over longer time periods. This offers a degree of confidence in suggesting agencies responsible for creating and changing the current boulder distributions and thus in interpreting their histories. Boulders which offer significant information of their prior movement and depositional history were sought and identified in the field on the basis of a range of potentially diagnostic criteria. We define these as boulders of interest (BOI), which are the prime focus of this study. Discrimination is made between three categories of boulder deposition history within the study site: (a) boulders identifiably deposited by storm waves after 1957 (the year of the earliest available aerial photography); we term these recent movers (RM); (b) boulders associated with extreme waves (ancient movers, AM), and; (c) boulders in the overlap zone lacking in diagnostic characteristics, which may be either the nearshore products of unknown former extreme waves, or have been deposited and/or redeposited prior to 1957 by historical storm waves (indeterminate movers, IM).
3.1. Field Observations and Time-Sequential Imagery
In selecting the BOI, greater attention was paid to the larger individuals in each locality, on the grounds that they are more indicative of the highest velocity of flow and, thereby, the magnitude the event that emplaced them. In addition, focus was placed on boulders which offered properties helpful in providing some indication of their history in relation to the magnitude of a boulder within its immediate context, or distinctive features clearly evidencing some aspect of its history, such as micro-topography, distinctive weathering forms, or aspects of its current location. The BOI are thus parameterised on the basis of two sets of properties, contextual characteristics and intrinsic characteristics (Table 1).
Contextual parameters embrace the elevation, location and distance from shoreline of the point at which a BOI was deposited. The location of each BOI was identified in the field by Global Positioning System (GPS). Google Earth imagery was used in observing distance to shoreline of each boulder for ranges of 10 m or more, a procedure that was checked against direct field measurements and found to be accurate. Smaller distances were measured directly in the field by survey tape. Laboratory observations of boulder elevations were acquired from mapped light detection and ranging (LiDAR) contours at one metre intervals (to a precision of +/− 0.5 m). Intrinsic boulder characteristics observed in the field included the principal axes (a, b, c), boulder attitude (normal/inverted), long axis orientation and presence of imbrication and its orientation, all of which supply information on a boulder’s resistance to flow and, thereby, the flow velocity required to transport the boulder and deposit it at its current location. In some cases, it was possible with sequential aerial photography to trace prior locations along their transport pathways and identify routes of intermittent movement. In other cases, surface characteristics were observed such as distinctive weathering forms or micro-topography indicative of long-term rock decay in the current location of the BOI.
Recent movers (RM) were identified by scrutiny of aerial imagery of variable quality from 1957, 1967, 1978, 1988, 1994 (source: Malta Environment and Planning Authority; Malta Planning Authority) together with satellite imagery from 2002 and 2013 (Google Earth). These sources provide direct evidence of boulder movement through recent decades, enabling individual boulder movements to be tracked from origin to destination across a quasi-regular sequence of six intervals, thus defining the RM zone and its position within the tripartite zonation of boulders. This is, subject to the quality of the imagery, ostensibly hard evidence of intermittent boulder movement and also, importantly, boulders that have remained in place throughout the period from 1957 until the present.
Care is required in using these sources, for clarity and resolution are somewhat variable across both sets of images. Identification of individual boulders depends also on the strength of light and the mode of its incidence on the boulders at a particular time during the day [21]. It is possible, for instance, to find a particular boulder on one image, only to find it absent in the next consecutive image in the series, and then see it reappear on the next image to follow, conceivably eluding capture by the intermediate imagery but remaining in situ as a non-mover. Clearly, caution is required in interpreting such occurrences but by excluding images of potentially ambiguous interpretation, those retained therefore represent a minimum number of recent movers and serve as helpful representatives of boulder movement processes.
Non-recent boulders were sampled by a random walk process, covering the contrasting areas of the site throughout which the boulders are distributed but excluding those areas which bear signs of human disturbance. Within each area, priority was given to the largest boulders, those of outstanding magnitude in relation to their near neighbours, since they are the most meaningful indicators of the magnitude of the flow that deposited them in their current resting place. Attention was then focused on intrinsic boulder characteristics potentially indicative of their transport history, such as lithological composition, boulder attitude, long-axis orientation, and weathering state.
The ancient movers (AM) were proposed primarily on the basis of the field characteristics of the boulders, supported by consideration of the contextual parameters such as elevation and distance from shoreline. Boulders of uncertain origin, the indeterminate movers (IM), were then classified by default as those boulders lacking in exceptional and informative characteristics.
3.2. Boulder Transport Modelling
Hydrodynamic modelling provides a method of retrodicting indicative wave conditions responsible for boulder entrainment and, potentially, their deposition. A range of one-dimensional modelling approaches have been reported widely in the literature applied to boulder deposits in a range of settings (with various examples being identified by Cox et al. [13]). Typically, based on boulder size and shape and derived by resolving the moments of hydrodynamic forces applied to individual boulders, the equations reveal estimates of the minimum wave velocity (and potentially height, through further assumptions) of the flow required to initiate (and theoretically terminate) movement according to a suite of transport modes.
Following Nandasena [19], wave velocity is used here as a proxy variable for the energy afforded by a wave to perform geomorphic work, suitable as auxiliary evidence to facilitate the discrimination between boulders likely to be transported by storm waves over recent decades and those mobilised by historical extreme waves, including ancient tsunami. Here, modelling is employed to identify the threshold flow condition, expressed as minimum velocity, corresponding to when wave run-up is assumed to have transported a boulder to its site of deposition and come to final rest (an approach adopted in other studies, e.g., [23]); this differs from other analyses that focus on initiation of motion at the ‘pre-transport’ setting. In addition, modelling is used here to reveal potential conditions for exemplary boulders that display field evidence of rolling or pivoting over the Globigerina scarp. A further parameter of interest is the orientation of a boulder, whether it has travelled with its long axis normal or parallel to the direction of flow, since this impacts on the resolution of forces acting on a boulder (notably drag) and is thus a significant influence on the magnitude of the force required to transport it. In applying boulder transport models, their derivations and assumptions are not repeated here as they are covered extensively in their respective originating publications.
Hydrodynamic analysis of boulder emplacement following sliding over the platform was carried out by application of the Nandasena et al. [19] equation (their Equation (24)):
where: V = wave velocity (m s−1); b = b-axis length (m); c = c-axis length (m); θ = gradient of ground surface (degrees); ρs = density of boulder (kg m-3); ρw = density of seawater (assumed 1024 kg m−3); g = acceleration due to gravity (9.81 m s−2); Cd = coefficient of drag (typically 1.95); Cl = coefficient of lift (typically 0.178); μs = coefficient of static friction (typically 0.7).
The published equation assumes transportation with boulder principal a-axis oriented normal to the flow direction (often assuming that the flow direction is perpendicular to the shoreline). In the case where the boulder a-axis (m) is oriented parallel to flow, it can be suitably modified (by substitution of a for b) to:
The sliding mechanism serves as the default mode of transport immediately prior to resting and is the most conservative in terms of energy required for movement in the absence of direct evidence of any other mode, such as rolling or saltating. However, it is entirely conceivable that boulders might arrest their movement during wave inundation while rolling without sliding, with a myriad of obstacles and barriers to transport (other deposits, scarp features and topographic variation in the shore platform itself). The equation for overturning/rolling with a-axis normal to the wave as provided by Nandesena et al. [19] is given by (their Equation (26)):
For the case of a-axis parallel to the flow:
Far more unlikely, but not implausible, is the possibility of boulders coming to rest abruptly while saltating. As lifting a boulder during the passage of a wave is a function of the c-axis alone, the expression for transport by lifting/saltation does not discriminate between the orientation of the a-axis. The equation provided by Nandasena et al. [19] is as follows (their Equation (28)):
In the case of boulders that have clearly pivoted over a significant scarp feature, the approach developed by Hansom et al. [39] is appropriate, which accounts for pivoting over a ‘large obstacle’ (their Case 3), here given for when the a-axis is oriented normal to the wave:
where: Cd = coefficient of drag, CL1 = primary lift coefficient (assumed 0.1), CL2 = additional lift coefficient (assumed 0.8), ae = correction term for drag when a-axis is oriented normal to the flow direction (given as a−b/2).
For the case of a-axis parallel to the flow:
where: be = correction term for drag when a-axis is oriented parallel to the flow direction (given as 0.75b).
In both Equations (4a) and (4b) the drag coefficient Cd is not a constant but a function of the boulder geometry based on analysis by Barltrop and Adams [40]; here Cd is estimated by linear interpolation of the values in their Figure 6.45 for rectangular prisms. Also of significance is that gradient does not feature in the Hansom et al. [39] model. Critically, as the boulder is overturning about its top edge, the drag force imparts a restoring moment and thus provides a source of inertia. Consequently, the minimum flow velocity required to pivot over an obstacle such as a platform scarp is often lower when the boulder is oriented with a-axis parallel to the flow rather than normal (depending on the geometry of the boulder); this is contrary to the case for motion by sliding and rolling.
In applying Equations (1)–(4) to the Żonqor site, it is important to recognise the composite nature of the great majority of BOIs, which incorporate a majority of LGL with an attachment of denser PCB. Gatt [29] quoted a density value for LGL as 1780 kg m−3; a value of 1900 kg m−3 was thus adopted in the modelling to account for this.
As practiced frequently, it is convenient to estimate minimum wave height, H, from velocity, linked by the Froude number, Fr, such that:
Advocates of the Nott approach have almost ubiquitously purported that Fr = 1 for storm waves and Fr = 2 for tsunami, a premise that has endured with little challenge despite the obvious fact that a storm wave must always be four times larger than a tsunami to do the same amount of work [13]. In their critique, Cox et al. [13] claimed that this assertion overrides other studies that reveal tsunami flows with Fr often considerably below 2 (e.g., [22,41,42,43]) and storm waves with Fr greater than 1 as not rare and above 2 quite plausible (e.g., [44,45]). Thus, despite the relevance of Equation (5), given its uncertainty in the surf zone its application must be exercised with caution [22] and the choice of Fr formally justified.
Here, we resist the temptation to apply the default Fr values above in preference of an alternative methodology that compares velocities derived from Equations (1)–(4) with the velocity decay profile for an inundating wave, as outlined below.
All data pertaining to the Boulders of Interest investigated here are available in the Supplemental Materials, which also includes Visual Basic for Applications (VBA) macros to facilitate the execution of the Nandasena et al. [19] and Hansom et al. [39] equations above, and the novel velocity decay model below.
3.3. Wave Velocity Decay Model
The inundation of an extreme wave has been modelled for a number of studies based on the theoretical formulation developed by Cox and Machemehl [46], which assumes that flow propagates as a breaking spilling wave after overtopping a berm, resembling the processes of a bore. This approach was adopted by Noormets et al. [47] for wave-generated flow over a shore platform and subsequently has been applied in a range of studies [5,6,23,24,48,49], notably as a device for differentiating between storm and tsunami waves in their ability to mobilise and emplace large boulders. Cox and Machemehl’s original equation enables the wave ‘height’ profile to be specified, as height against distance travelled. However, to compare the height profile against minimum wave heights for entrainment/emplacement using the Nott approach requires pre-specification of the Froude Number and thus the approach is subject to the limitations highlighted by Cox et al. [13], above. In addition, the original derivation by Cox and Machemehl assumed a Froude number of 1.0, thus compounding the predicament.
Here we revisit the Cox and Machemehl method and develop a novel re-formulation that enables the velocity decay profile to be generated, rather than wave height, as outlined in Appendix A.1.1. The approach remains theoretical and assumes run-up as a breaking spilling wave over a mild slope, with results treated at the indicative level only.
For practical application, the velocity, V, (m s−1) of a decaying wave over horizontal distance X (m) and upshore gradient θ° is given by the following linear relationship (Appendix A.1.2):
where: T = wave period (seconds); Vc = velocity for a calibration event (an independently estimated velocity for the known movement of a boulder) (m s−1); X = distance from the shoreline (m), and Xc = distance from the shoreline where Vc is assessed (m).
In applying the method to explore the boulder transporting potential of storm waves experienced over recent decades, the method relies on a record of known boulder movements over a reasonable period of record; here, we are fortunate to have investigated boulders that have moved since 1957. The calibration event, therefore, refers to the observed movement of a selected boulder and the velocity required to accomplish it, which is judged to represent (conservatively) the greatest wave force encountered over the period, relative to its position from the shoreline. Hence, the calibration event is a proxy for recent storm magnitude and is used to set the overall magnitude of the decay profile, whereas the wave period, T, determines the profile gradient (see Appendix A.1.2). For the chosen calibration boulder, Vc can be estimated from Equations (1)–(4), after Nandasena et al. [19].
Critically, the Froude number, Fr, is not predetermined but back-calculated from the analysis as follows:
where: g = acceleration due to gravity (9.81 m s−2), and; Hb is the breaking wave height (m) at the shoreline (X = 0).
In applying this method, Hb and T require either values relating to hypothetical storm or tsunami events or indicative values for known wave events, utilising available records wherever possible.
4. Results
4.1. Boulders of Interest: Morphometric Considerations
A total of 63 boulders of interest were obtained, located as illustrated in Figure 6, and comprise: 13 RM; 22 AM, and; 28 IM. The spatial distribution of the boulder types is clearly shown, with an evident linear zonation approximately parallel to the shoreline.
The recent movers are defined by analysis of the time-sequential imagery and inevitably the boundary between ancient and indeterminate movers is somewhat fuzzy; initial identification of the ancient movers placed emphasis on their contextual site characteristics (distance from the shoreline and, critically, elevation) and sedimentological characteristics (e.g., weathering), cognisant that there is no definitive proof for all boulders as to their agent of transport and emplacement–storm wave or tsunami. The statistical difference between the three boulder groups was tested using the Kruskal–Wallis 3-way test of difference (Appendix B.1) for distance from shoreline, elevation, a-axis length and box volume (product of the three axes), which confirmed their differentiation at less than the 0.01 level (>99%). Thus, despite the overlaps in values between them, the three groups are clearly statistically separate, as indicated by the box plots in Figure 7 and the companion descriptive statistics of the specific parameters presented in Appendix C.1.
The recent movers are notably concentrated in their proximity to the shoreline (Figure 7 and Figure 8), with a median distance to shoreline of 22 m and a range of 10 to 31 m. The indeterminate movers range from 11 to 55 m, embracing the entire range of the recent movers but with a distinctly higher median distance setting them apart in their pattern of distribution. The ancient movers, in contrast, are located within a range of 11 to 92 m from the shoreline and distributed widely across the coastal zone, but clearly separated in onshore reach from the other two groups by a 40% margin.
There are similar contrasts in elevation between the three groups (Figure 7 and Figure 8b). The recent movers are clustered in a narrow range of low elevations close to sea level at 2.60 to 5.88 m asl. In a regular progression, the indeterminate movers range between 2.34 and 7.74 m asl, showing strong overlap with the recent movers but also a higher maximum of 7.74 m. The ancient movers again stand well apart with a maximum reach in elevation of 11.97 m asl, and also show a median elevation value of 10.06 m as opposed to the medians of the recent and the indeterminate groups at 3.54 and 6.10 m, respectively.
In respect of boulder properties, median long axis length declines steadily from recent to ancient and is mirrored by the axis maximum length (Figure 8), though that is not wholly shared by the minimum axis lengths or range values. Some inconsistency is shown also by the values of box volume. A strong consistency in both boulder metrics is, however, the decline in magnitude of the ancient movers group relative to the other two.
A major conclusion emerges from these considerations: The ancient movers group is exceptionally different from the other two groups, with much larger differences in both their locational setting (in particular elevation and range of distance) and intrinsic characteristics between it and the indeterminate movers than the latter has with the recent movers.
4.2. Boulders of Interest: Field Observations and Time-Sequential Imagery
4.2.1. Boulders Emplaced by Storms 1957–2013 (Recent Movers, RM)
Overall, 18 boulder movements are identified through the 56 years spanned by the available imagery to 2013 (Table 2), a period with no recorded tsunami activity in Malta. Two significant observations arise from the data: first, that boulder movements occur regularly through time and are widely distributed through the time intervals defined by the imagery, occurring in four of six intervals, and; second, the numbers of boulders vary widely between intervals, suggesting that the storm events responsible vary in their magnitude. Boulder movement events are, therefore, unequivocally a regular response to storm activity on the Żonqor coast.
The majority of boulders derived from the LGL are tabular in form, with both long a- and b-axes, but a short c-axis. This configuration is naturally conducive to sliding, which appears to be the most frequent mode of movement. When two or more axes are close to equidimensional or where ground surface irregularities arrest sliding, rolling is more readily facilitated, although requiring a greater energy input. A single roll leads to an inverted boulder, several of which are included in the sample here. The boulders of interest sample embraces a set of individual boulders from across the field area (RM1-6). It also includes a set of boulders of common origin, created by the disintegration of a stratum of LGL by storm action between 1978 and 1988, and subsequently reassembled into a nearby boulder train between 1988 and 1994 (RM7-13).
Table 2 records both boulders that have experienced a single movement over the 56-year observation period and others that have experienced serial perturbations during that time, creating multiple temporal trajectories of movement. In addition to standard parameters of size and shape, an important feature of boulder hydrodynamic behaviour is orientation in relation to the direction of travel, that is, whether normal or parallel to the flow which transports it, the latter being less conducive to transport by sliding or rolling. Also of significance is boulder ‘attitude’, whether stratigraphically the right way up or inverted, the latter indicating that the boulder’s journey must have including rolling or overturning against an obstacle but may also have travelled by sliding and saltating (lifting), modes of transportation that require different amounts of energy input. The different transport mechanisms are thus indicative of the power of flow responsible for the movement and subsequent emplacement.
The majority of boulder movements recorded originated close to sea level, commonly rising upshore by moves of up to 2 m in elevation, to midshore elevations of 2–6 m asl. It is notable that the boulder size (with a couple of exceptions) in the recent movers group is very similar in magnitude and range to that of the indeterminate mover group, suggesting a significant commonality in their origin and travel histories. The recent movers’ elevations and distances from the platform edge overlap with those of the indeterminate movers at the lower end of the latter’s distribution. As late arrivals at a backstop (the berm formed by the earlier indeterminate movers) they are blocked from further progression upshore. Alternatively, it could be that greater wave run-up was involved in deposition of indeterminate movers compared with recent movers mobilised post-1957.
Two boulders are selected below to demonstrate the contrasting trajectories recorded in their respective histories (Figure 9 and Figure 10). The first (RM1) has moved up an unrestricted slope of declining gradient, while the second (RM2) has overcome a vertical scarp in its travel upshore.
Boulder RM1 (Figure 9a) is 7.6 m long and is first visible in 1967 sitting at the margin of a small scarp of a joint-bounded unit of the LGL of which it was formerly a part. It is visible in Figure 9b by virtue of partial detachment from its home socket creating a fissure outlining its planform with shadow in the imagery. The boulder was positioned in 1967 on a 20° seaward slope with its long axis approximately normal to the shoreline and its closest facet some 12 m from the shoreline. The triangular planform of its landward tip is trapped in a matching recess in its parent scarp. By 1978 it had swung out of the trap, pivoted clockwise through 91° as it escaped, and come to rest some 4 m higher on the slope and 20 m from the shoreline in roughly a shoreline-parallel orientation. It remained in the same location through 1988, although with a slight reorientation of 4° anticlockwise. By 1994, however, it was remobilised and moved further upshore to a position some 30 m from the shoreline, slewing its shoreline-parallel orientation anticlockwise by 38°. At this point its movement was arrested by impact with static boulders on the shoreward side of the pre-existing berm. This location remains its current resting place.
The mechanisms of its movement can be summarised as follows. An assailing wave would first encounter the small (3 m2) b/c facet of the boulder at 12 m distance from the shoreline with sufficient velocity to drive the boulder upslope in a sliding motion. In practice, the blocking presence of the scarp into which it remains embedded would not allow such a movement. The crevice on the north side of the boulder separating it from its home scarp would, however, permit entry to an approaching wave and initiate lateral forcing of the boulder to allow it to pivot away from the trap at its pointed landward end. The boulder thus pivoted round to terminate its first movement at an elevation of some 4 m higher, with its long axis now in the slope-normal orientation. A further landward slide during a storm between 1988 and 1994, with a moderate pivot movement, emplaced the boulder at its current position.
The recent history of boulder RM2 (Figure 10a), some 6.6 m long, describes a rather different trajectory of upshore travel. It is first seen in 1957 sitting some 11 m from the shoreline at the base of the PCB scarp with its long axis almost normal to the shoreline, the middle of three large companion boulders detached from their adjacent parent scarp (Figure 10b). Between 1967 and 1978, it pivoted anticlockwise by 54° with its long axis parallel to and abutting the scarp face, whilst remaining approximately in the same location. Between 1988 and 1994, however, it was lifted enough to surmount the vertical 1.5 m scarp cliff while also rotating, as its planform shows, by 93° anticlockwise (or 278° clockwise) and driven upshore before coming to rest perched partially atop the PCB scarp and bridging a gap between the scarp and an adjacent boulder remaining on the shore platform below. Curiously, although the boulder has moved upshore, the configuration of the shoreline means that the boulder’s centre of gravity, which has moved directly southward by some 9 m, is rather closer to the shoreline than its initial position.
It is evident from RM2′s history that it suffered initial disturbance with velocity sufficient to lift slightly and rotate it but with insufficient sustained force to raise it to the scarp top. It is probable that the scarp face acts as a reflector of incoming waves, thus creating turbulent interactions between assailing and reflecting waves in proximity to the scarp face, complicating the hydrodynamics. The boulder’s next movement, between 1988 and 1994, required a vertical hydraulic lift to overtop the scarp, associated with a following assailing wave to drive the boulder upshore. This movement is also associated with a substantial lateral pivot, driven by the angle of wave attack and probably moderated by retarding contact between the boulder and the scarp-top surface beneath it. This boulder has remained in its bridging posture until the present day (2020) without further disturbance, with some uncertainty as to whether its fascinating final positioning (Figure 10a) was due to decaying wave force, resistant substrate or a combination of the two. Conceivably, the particular storm wave that elevated this c. 64 tonne boulder some 1.5 m generated the largest velocities encountered at Żonqor over the period of imagery, while this observable movement remains probably the best signature of the minimum magnitude of the storm that conveyed it.
4.2.2. Boulders Interpreted as Potentially Tsunamigenic in Origin (Ancient Movers, AM)
Two features explored here strongly (but not unequivocally) suggest that an event or events of greater magnitude than regular storm waves have left their signature on this coastline in the form of: (i) boulder fields at the top of the shore zone (Figure 2), situated above 10 m asl, and; (ii) large and inverted (flipped) boulders atop the Globigerina scarp.
The north boulder field stretches roughly 60 m alongshore and up to 15 m wide (Figure 2 and Figure 11). The boulders form an openwork clast-supported sediment wedge banked up against an upslope scarp and thinning downslope, resting on a scoured bedrock surface. These boulders are predominantly sub-angular to sub-rounded in form. They are composed of LGL, occasionally incorporating PCB, strongly suggestive of a shoreline boulder source at the PCB exposure at the base of the Globigerina scarp. More than 20 boulders exhibit a-axes exceeding 1.0 m, with box volumes ranging 0.15–0.77 m3 indicating a maximum mass of c. 1.5 tonnes. With c-axes of 0.2–0.5 m, the most common shape is tabular, facilitating imbrication. This is a particularly significant feature of the accumulation, with orientation of the a-b plane lying exclusively within the southwest quadrant (180–270°) and mean value of 206° (Figure 12). Interestingly, the occurrence of reverse (upslope facing) imbrication suggests strongly that the final agent of their deposition was a downslope flow [50,51]. Realistically, for this to occur an initial upshore flow to an elevation above the sites of the boulders would first be required, followed by a return flow able to generate sufficient power to reverse the imbrication of stacked boulders >1 m in length.
The south boulder field measures 40 m alongshore and up to 8 m wide (Figure 2 and Figure 11), sitting in a location topographically similar to that of the north field. The form of the boulders, however, appears less tabular, with b-axis lengths commonly c. 0.5 m. Only a few tabular forms are present; imbrication is observed with several boulders clearly oriented parallel to the slope and facing inland.
At both boulder fields, the boulders rest on a clean bedrock surface, deepening upslope as they bank up towards the retaining scarp. There is no indication of any association with ancient or historic quarrying in either scarp or boulder fields and they lie higher and more distant from the shoreline than the apparent reach of contemporary storm waves (Figure 8). A further major spread of boulders at similar elevation occurs along the Għar Id-Duħħan coast at elevations of c. 9–11.5 m asl, extending over a distance of some 300 m.
A particularly notable feature of the boulders within these fields, especially at the north field, is the presence of honeycomb weathering forms (Figure 13), with associated deep tafonisation up to 200 mm and very fragile overhanging visors as thin as 2–3 mm. Such forms must have developed over a long period of time subsequent to deposition, as they could not have survived any vigorous process of transportation. They are, therefore, of significant antiquity.
Two large boulders sited above the Globigerina scarp merit closer scrutiny with their flipped (inverted) attitude. A large boulder of axial measurements 6.2 m, 2.8 m and 1.8 m (AM1) currently sits atop the 1.5 m high scarp at an elevation of 6.5 m asl, positioned 11 m inland from the shoreline below and with flow-parallel orientation (14.57219° E, 35.86948° N). The potential source area of this boulder is a shelf above a small arcuate inlet bounded by steep cliffs no more than 3–6 m from the shoreline. The scarp top is formed by LGL, which tapers in thickness to form a mini scarp overlooking a shelf of protruding PCB (Figure 14). This would appear to be a consequence of scarp recession at the margin of the LGL from an initial vertical fracture and, as such, indicative of many decades of exposure to subaerial processes subsequent to the original fracture. This in turn implies that fresh fracture and subsequent rock mass detachment are an infrequent process at a given point in the cliff line.
This boulder was detached along a plane within or at the base of the PCB bed such that the boulder is a composite of both PCB and overlying LGL, matching the geological composition of the scarp itself, with an estimated mass of c. 59 tonnes. The PCB, formerly a protruding shelf, now forms a platform base supporting an LGL mass of similar a-axis length, but a lesser b-axis, creating an L-form transverse cross-section (Figure 14b). The boulder in its current position clearly displays its inversion with the sequence of its component strata in contrast to its in situ attitude in the scarp face below.
The potential modes of movement required to transport and deposit the boulder in its current position include lifting or vertical pivoting with flow-normal long axis in order to extract the boulder from its initial seating followed by planform (a- and b-axis) reorientation to pivot into a flow-parallel orientation. These contortions may have been separate events, or blended into a singular twisting movement.
The planform of nearby detached masses along the cliff-line shows a common habit of shoreline-parallel fractures, creating a detached clast with long axis parallel to the cliff-line. The morphology of its now inverted upper surface matches the mini scarp and shelf features formed in the nearby in situ rock by subaerial processes. It is evident that it has been detached from and pivoted over the clifftop, overturning and rotating such that its long axis, formerly parallel to the cliff line, is now aligned normal to it.
A second sizable boulder (AM2) of axial measurements 4.3, 2.2 and 1.2 m also sits atop the 1.5 m LGL scarp, although with a differing transport history. It rests below a boulder berm at 4.7 m asl (14.57114° E, 35.87100° N), some 28 m from the shoreline (Figure 15). Similarly comprising LGL and PCB in inverted stratigraphic order and with an estimated mass of c. 21.5 tonnes, it lies oriented with long axis parallel to the flow responsible for transporting it to its present position.
Whilst in a terminal disposition similar to AM1 (flow-parallel and overturned), AM2 has travelled some 12 m upshore across the LGL platform from its inferred origin at the parental scarp 16 m from the shoreline. The manoeuvres required to achieve its current location and disposition again include overturning, reorientation, sliding and possibly lifting in order to escape its initial seating. In this case the inversion is more likely to have taken place earlier in the journey, either by overturning the scarp during escape from its seating, or rolling early in the slide. At some point the boulder has reoriented into its flow-parallel disposition; the nature of this adjustment is uncertain but plausibly might have occurred during a complex series of movements while mounting the scarp, as overturning while in flow-normal alignment requires greater force (see Section 3.3 and Section 4.3; [39]). The case for this boulder’s inclusion as an ancient mover is perhaps less convincing, lying closer to the shoreline than those in the boulder fields discussed above and at a lower elevation than AM1; its original elevation was probably around 3.7 m asl.
4.2.3. Boulders of Indeterminate History (Indeterminate Movers, IM)
The diagnostic characteristic of this boulder group is that its members individually lack sufficient distinctive characteristics of location, magnitude or age to help illuminate their individual histories. The group embraces a spread of large boulders typically longer than 1 m and ranging up to a maximum of 6–7 m, scattered across the ramped shore platform up to an elevation of c. 6 m asl, where they commonly form a distinctive berm. These boulders are abundant in the boulder berm that skirts the Iż-Żelliqa promontory. On the shore platform itself the boulders stand out prominently, in that they typically occur on a clean washed platform surface from which finer sediments have been winnowed out by routine storm events.
It is evident that contemporary regular storm waves are capable of removing less coarse sediments, but of insufficient power to move the larger indeterminate clasts. This implies that the indeterminate boulders themselves could be the product of more extreme conditions such as high magnitude-low frequency storms, or tsunami. These boulders are, thus, especially amenable to further investigations utilising hydrodynamic modelling as a means to propose their likely histories.
The larger boulders in particular show case hardening with recessed weathered surfaces characteristically up to 200 mm (and in one extreme case 450 mm), indicative of considerable duration of time since their deposition. Subsequent to that process they have simply resided as non-movers, whilst other boulders transported and deposited more recently have been restricted and arrested by their bulwarked assemblage and tend to accumulate on the seaward side of the berm.
4.3. Boulders of Interest: Hydrodynamic Considerations
Figure 16 illustrates the minimum velocities required to emplace the boulders of interest at Żonqor. The final mode of transport prior to deposition is most likely to be sliding but rolling is entirely plausible if the velocity is of sufficient magnitude, given that other boulders and the irregular form of the shore platform would present numerous, but unknown, obstacles to entrainment. Deposition immediately following lifting/saltation is least likely, requiring the greatest wave force but observed lifting of the recent mover RM2 to deposit atop the Globigerina scarp between 1988 and 1994 confirms its possibility.
Transport and deposition by either rolling or sliding can occur in either flow normal or flow-parallel alignments (or indeed at some oblique angle). While the c-axes of the recent and indeterminate movers are reasonably similar, the latter exhibit more of a tabular shape than both the recent and ancient movers, which tend to be more linear and blade-like. Consequently, the indeterminate group often require greater velocity to move in flow-normal orientation than the recent movers (RM median: 3.51 m s−1; IM median: 3.98 m s−1) and this effect is reversed (albeit with less differentiation) for the flow-parallel case (RM median: 4.62 m s−1; IM median: 4.36 m s−1), despite similar ranges in velocity overall. As the size of the boulders generally diminishes between the groups from recent to ancient, it is not surprising that the ancient movers require considerably lower velocity to slide to their place of deposition (AM median: 2.24 m s−1 flow-normal, 2.97 m s−1 flow-parallel). This general pattern is repeated for the case of rolling, albeit with both magnitudes and ranges increased; median velocities are roughly 40–60% higher for rolling than sliding. Transportation by lifting/saltation according to Equation (3) is not impacted by orientation and is proportional to the square root of boulder c-axis (independent of the other two dimensions) for which median values for the recent, indeterminate and ancient movers groups are 0.9 m, 0.8 m and 0.45 m, respectively. Thus the median velocities are distributed accordingly (RM: 9.14 m s−1; IM: 8.65 m s−1; AM: 6.49 m s−1), although the spread of values for the ancient movers encompasses the ranges of both the recent and indeterminate movers groups.
While Figure 16 enables useful comparisons to be made between the boulder groups, the analysis takes no account of wave run-up and each boulder’s location, namely its elevation and distance from the shoreline. Additional consideration is, therefore, required to relate the distribution of minimum velocities for emplacement in Figure 16 to the theoretical velocity decay profile as flow propagates upshore. Figure 17 illustrates the minimum velocity required to mobilise/emplace each boulder, classified into the three modes of transport, and differentiates velocity according to flow orientation, whether normal or parallel. Three velocity profiles are derived comprising two extreme recent storm wave scenarios and a historical tsunami wave. The gradient of each profile is determined by the wave period, T.
For the storm waves, we assume maximum impact would require waves generally propagating from a northeast direction, impacting the Żonqor shoreline directly. The Maltese Islands are typically subjected to up to 3 m wave heights from the northeast Grigal (Gregale) winds, with a fetch of c. 650 km from the Greek Adriatic Coast [52]. Storm waves approaching more from the east have considerably longer fetch and thus higher waves are possible (5 m is commonly cited in newspapers). Causon Deguara and Gauci [21] estimated the greatest breaking wave height for this coastline of 7.70 m with a corresponding wave period of 8.2 s. Although this is based on registered storm events over a period of only 21 months, the location of the −5 m contour at c. 30–80 m seaward suggests breaking waves at close to the platform edge that are higher than 7.70 m are unlikely. Wind-driven waves typically have a wavelength of 100–200 m and a period between crests of 5–20 s [53]; in the context of Malta’s position in the Mediterranean, however, 10 ± 2 s appears to be a reasonable guide for the wave period of maximum storm waves approaching from either the east or northeast directions [52]. Therefore, we assign a wave period of 10 s (T = 10 s) to demarcate likely maximum storm waves at the decadal scale and a wave period of 20 s (T = 20 s) as a less likely scenario (but not implausible: see also [24]).
Potential tsunami waves engendered from seismic activity occurring within the Calabrian or Hellenic arc zones would also approach the Maltese Archipelago from a general northeast direction [12,54]. Little information on the wave characteristics of historical tsunami is available for Malta, so we adopt values assumed in research related to southeast Sicily [23,24,55]. The 1693 tsunami is surmised to have exhibited a wave period of seven minutes with an indicative (medium) breaking wave height of 2.5 m, based on tentative records. The lesser 1908 tsunami is judged to have had a comparable wave period (eight min) but lower indicative wave height of 1 m [25]. Here, we define a hypothetical (but plausible) tsunami, roughly modelled on the 1693 event, with a 7-mi wave period (T = 420 s).
In Figure 17, the velocity decay profiles for all three design waves pass through the calibration point. For the recent mover group, the observed lifting of the 6.6 m long boulder RM2, with its mass of c. 64 tonnes, to deposit atop the 1.5 m LGL scarp (between 1988 and 1994) at a distance of 10 m from the shoreline is estimated to require a threshold velocity of 12.22 m s−1 and ranks as the highest in the distribution of velocities for transporting and emplacing the recent mover boulders in their upshore positions. This movement thus serves as a suitable calibration for setting the magnitude of the velocity decay profiles (with wave period defining their gradients) and accordingly enables the profiles to discriminate, albeit at an indicative level, between those boulders likely to have been mobilised by storm waves over recent decades and those more likely to have been transported and emplaced by tsunami.
The Froude numbers, Fr, for the three design waves are defined by Equation (7). Assuming a breaking wave height, Hb, at the shoreline of 7.70 m, the two design storm waves have Froude numbers of 1.8 (for T = 10 s) and 1.6 (for T = 20 s), notably higher than 1.0 assumed by the Nott approach but, critically, within the range of reported values [13]. Assuming a wave period of 420 s, the Froude number for the design tsunami wave that would be capable of lifting RM2 onto the LGL scarp, as observed, can take a range of values depending on the estimated breaking wave height, which for ancient tsunami is subject to considerable uncertainty, for example: Fr = 2.4 (for Hb = 2.5 m), and; Fr = 2.0 (for Hb = 3.4 m), the latter corresponding to the Nott approach assumption.
The design storm wave with T = 10 is capable of transporting the recent mover boulders to their places of emplacement within approximately 25 m from the shoreline by either sliding or rolling mechanism. The storm wave with T = 20 is sufficient to emplace all the recent mover group by sliding or rolling, including the large boulders RM1 and RM3 if assuming their flow-normal orientation. The latter storm also generates velocities across the platform to lift nine of the 13 recent movers, at their places of emplacement, including the calibration boulder RM2. It is perhaps not surprising that the T = 20 decay line bisects the indeterminate mover group, which questions the efficacy or storm waves to emplace this group’s boulders at distances exceeding 50 m from the shoreline for sliding and 30 m for rolling. The ancient mover group is also intersected by the T = 20 line, clearly setting boulders sited beyond 60 m from the shoreline as unlikely to have travelled to their current resting points by storm waves. Those ancient movers closer to the shoreline are largely positioned in between the T = 10 and T = 20 lines, which might imply, without other evidence, that they are perhaps not as ancient as initially proposed. On closer inspection, though, all these boulders (save the inverted boulders AM1 and AM2) lie at elevations greater than 8 m asl (see Figure 8) and while the boundary between the ancient and indeterminate boulders might be somewhat fuzzy, it is inconceivable to envisage storm waves powerful enough to move these boulders to their lofty positions.
By contrast, the velocity decay profile for the design tsunami is of greater magnitude than the minimum velocities for transporting and emplacing all the boulders of interest, even by lifting—with the marginal exception of the inverted boulder AM1 (but see below). In their experiments, Imamura et al. [56] revealed how boulders impacted by a propagating bore are more likely to be transported by rolling or in saltation than sliding. Hypothetically, on moving the T = 420 velocity profile down to coincide with RM2’s threshold velocity for rolling in flow-parallel orientation (9.69 m s−1), all boulders of interest would be capable of rolling at their current locations in either orientation; this would correspond to a tsunami with Hb = 2.5 m and Fr = 1.9 or, for the Nott approach, Hb = 2.2 m and Fr = 2.0. Therefore, it is a reasonable supposition that a tsunami wave striking the Żonqor coastline would be capable of sweeping the shore platform of many of its boulders, largely to accumulate in the existing boulder berm at c. 7 m asl and higher boulder fields.
Special attention is given to the two inverted boulders, AM1 and AM2, lying above the LGL scarp as their transport histories involved pivoting over the scarp rather than merely lifting (Figure 18). Here we employ the method devised by Hansom et al. [39] to provide insight, albeit also at the indicative level, into the minimum velocity for such a movement (Equations (4a) and (4b)). The threshold velocity for AM1 is 13.24 m s−1, which is only slightly higher than the velocity for its lifting (12.96 m s−1) and comparable to the velocity required to lift RM2 onto the scarp top (12.22 m s−1); this assumes that the boulder pivots over the scarp in a flow-parallel orientation as excessive drag force would have inhibited the movement when flow-normal and acted to push the boulder firmly against the scarp face. In contrast, the slightly more tabular form and lesser a-axis of AM2 permits pivoting in either orientation, although significantly easier in flow parallel (10.79 m s−1) alignment than in flow-normal (18.97 m s−1). Conceivably, inversion of AM2 as the scarp is surmounted might have been driven by either an extreme storm wave or tsunami and, accordingly, the boulder might equally be allocated to the indeterminate group of boulders. The scarp top elevation of AM1 (at 6.5 m asl), however, suggests the more likely agent for its inversion was an ancient tsunami wave.
5. Discussion
The study of boulder deposition histories at Żonqor, with the range of methods employed, has presented a suite of evidence that as a minimum provides a skeleton narrative of events that have impacted this coastline and the processes and transport pathways that have resulted in the current boulder emplacements. These findings advance earlier investigations at Żonqor [7,8,21] and provide complementary evidence to studies conducted at other sites across the Maltese Islands [25,26,57] and in the Mediterranean more widely (e.g., [3,23]).
The great majority of boulders at Żonqor are created by collapse of rock masses undermined by the erosion of the PCB; they comprise the commonly dominant LGL attached to a subordinate PCB stratum. Although there are zones where the LGL scarp is absent, offering boulders an unimpeded journey upshore, the majority of newly detached rock masses find themselves settled on the irregular surface of the LCL platform below. Here they lie trapped up against the scarp of their origin, as incoming waves simply force them against the impeding scarp face. However, they are occasionally perturbed by stormy conditions, augmented by wave reflection from the adjacent scarp. Hence, the boulders may be shifted periodically by small increments, but occasionally waves incur enough force for more substantial (and complex) movements, including rotation. Repeated perturbing motions create grinding impacts, leading to an intimate contact between the boulder and its rocky bed. It is evident that such boulders reside at the scarp face for many decades, such as the line of three boulders in Figure 19. These boulders have been present at their current location since before 1957 and maybe much longer than that.
Nevertheless, it has been shown that boulders do manage to escape the trap and progress upshore to join up with others that preceded them. The modelling of this process suggests that the strongest storms have the capability to transport even the largest boulders over scarps close to the platform edge (although in the modelling analysis we here place emphasis on boulder transport and emplacement, rather than initial detachment). However, as the distance inland increases, the capability of storm waves to lift and/or pivot large boulders diminishes significantly, whereas the capability associated with tsunami waves does not diminish so greatly landward.
Through our synopsis, we have resisted over-emphasising the speculative ‘tsunami vs. storm wave’ querying that continues to attract healthy debate in the literature, fuelled by a myriad of case studies. This is because the Żonqor site presents a reasonably clear spatial demarcation between those geomorphic signatures indisputably created by recent storm events and those features that were created during historical storms of higher magnitude than experienced over recent decades or even ancient tsunami. The modelling and field evidence combine to suggest that the boulder berm (Figure 3) denotes where the contemporary land surface and realm of storm wave-driven boulder transport (the shore platform) give way to an ancient land surface and deeply weathered ancient boulders at higher elevations. At Żonqor, the boundary between the recent movers (RM) and the ancient movers (AM) (as characterised herein) is a somewhat fuzzy one and those of our BOI that we initially classified as indeterminates have inevitably been given incommensurate treatment in this paper. Whether the ancient movers have been transported by tsunami or not, those in our dataset have not moved over the past six decades–a period that has witnessed a storm wave capable of lifting a 6.6 m long, c. 64 tonne boulder (RM2), through a height of 1.5 m to lie atop the Globigerina scarp.
The possibility that ancient tsunami have had an impact at Żonqor is strengthened by several pieces of interrelated evidence: (i) a range of other studies across the Mediterranean have focused on known tsunami and their associated records, supported by field and modelling evidence; (ii) the hydrodynamic modelling of storm scenarios here reveal limited wave run-up that would fail to either reach boulders classified (in the field) as ancient movers or provide enough velocity to transport and emplace them; (iii) the gently shelving bathymetric topography and shallow waters off the Malta coast suggest the chance of waves breaking with greater height than the 7.7 m assumed here (based on recent data reported by Causon Deguara and Gauci [21]) is unlikely; (iv) the modelling results were calibrated based on the lifting of boulder RM2 (between 1988 and 1994) to its scarp top current position, which provides a proxy for the magnitude of the greatest storm encountered since 1957 and increases the reliability of the modelling outputs in setting the limit of storm wave run-up (albeit at an indicative level); (v) the elevated positions of the ancient movers group, at over 8 m asl, clearly sets them apart from the Recent and Indeterminate Movers groups; (vi) striking field evidence of substantial weathering among the Ancient Movers signifies conclusively that they have remained unmoved for centuries.
The flow velocity of breaking waves has been modelled to reconstruct past events and identify the power and reach of hazard threat in the event of a recurrence of similar events. The hydrodynamic modelling has thus provided an extremely useful device for analysis but we stress that it is employed as supporting evidence only, cognisant that the results are subject to uncertainty and parameterisation of such models that have received much scrutiny in the recent literature [13,58]. Thus, the wave profiling analysis is, and must be treated as, complementary to other field-based evidence-notably the weathering condition of many of the boulders and their distance from the shoreline.
Weathering of rock surfaces in coastal environments can be a very active process and is influenced by many local factors, such as lithology, exposure, aspect, microbes and microclimatic regime [59,60,61]. A benchmark exemplar of weathering of LGL locally is provided by constructional blocks of stone in a terrace wall, some 150 m inland from the shoreline and midslope at an altitude of 24 m asl (Figure 20). Their regular cubic form suggests that they were deliberately shaped prior to emplacement and that their surfaces were freshly exposed at the time of construction, thought to be around 1600 AD [62]. The stones show honeycomb weathering pits with maximum depths of 150–170 mm, implying an average maximum weathering rate of 0.38–0.40 mm per year.
The tafonised extreme wave boulders are found in a zone at 9–12 m asl. A casual sample of 10 such boulders revealed maximum weathering depths commonly around 200 mm with an exceptional case of 450 mm. Applying the ranges of average maximum weathering rate observed to the highly weathered boulders of interest offers a first order approximation of calendar dates of potential deposition. This produces a range of between 500 and 1184 years prior to 2018 when the benchmark stones were observed, clearly indicating a timescale measurable in centuries. This translates into a calendar year range of between 834 CE and 1518 CE.
There is no known record of extreme waves of that period on the Maltese coasts. Considering that the available data permit only a simplistic calculation, it is quite possible that the relevant event lies beyond the constraints indicated. One potential event from the historic records is the 1693 CE tsunami caused by a Sicilian earthquake, which impacted on Gozo. It is described in unrealistically grandiose terms by de Soldanis [63], although no specific tsunami impact on the island of Malta is mentioned. A second potential event is the 365 CE Cretan earthquake and tsunami [64], which impacted on coastlines throughout the Mediterranean, creating havoc in harbours in particular and considered by some authors to be a factor in the decline of the Roman Empire. Sedimentary evidence of this event has been reported from Sicily and from seafloor sediments east of Malta [65,66]. At the current time, the lack of convincing dating of extreme events on Maltese coastlines means that further investigation is required. The ancient mover boulders landward of the boulder berm, therefore, appear most likely to have been delivered by an event that occurred at a minimum some 500 years ago or even more than a millennium ago.
A significant new finding in this study is that of the contrasting flows of water indicated by the imbricate boulders of Żonqor, both uprush (upshore) and backwash (return) flows, and especially the implications of the latter with respect to the maximum elevation of run-up. The boulders at 10–12 m asl (Zone 6) with a landward-facing imbrication are indicative of backwash flow, draining back to the sea with a velocity sufficient to achieve this reverse imbrication [50,51]. The inundation must have been able to build a sufficient head of water to generate such a velocity. This interpretation compares well with run-up levels observed at other exposed east coast sites, such as: L-Aħrax, >20 m asl [7]; Għemieri, Comino, 17 m asl, and; St Anthony’s Head, Gozo, 16 m asl [57].
The results presented here are not without contention, though, and the tripartite field-based classification of our boulder groups remains somewhat fluid at the boundaries. Such is the case for the highlighted boulder AM2, that is shown by the modelling results to be marginally capable of pivoting over the LGL scarp by a storm wave of magnitude not dissimilar to those experienced over recent decades, to then remain inverted during its subsequent slide to final emplacement. A storm-defined history of its loftier brother AM1, however, is less convincing and despite its close proximity to the shoreline, we cautiously interpret it as potentially mobilised by a tsunami event.
Collectively, this rare survival of likely tsunami signatures on the largely urbanised east coast of Malta is a strong signal to the Maltese planning authorities. The historic evidence emphasises the exposure of this urbanised coast to the threat of tsunami propagating from the well-known seismic zones of the Eastern Mediterranean. These include the Hellenic Arc, source of the AD 365 tsunami which impacted coastlines around the Mediterranean, as close to Malta as Sicily and Tunisia.
A further significant insight from this research is the propensity for storm waves not only to move sizable boulders but to do so at evidently frequent intervals operating at the decadal scale, nudging boulders upshore intermittently, and sometimes generating immense force to perform complex lifting movements. Despite this ongoing activity, however, the effective activity of storm waves is strictly constrained to a relatively narrow fringe of the rocky shore, of no broader than some 50 m. The two contrasting recent mover histories presented show that their movements include various combinations of sliding, lateral pivoting and lifting, leading to changes in location and appearance at different points in their histories. Undoubtedly, without the evidence afforded by the analysis of time sequential imagery and tracking the succession of (often complex) boulder transport movements, the results of this paper might have placed more weight on the agency of historical events. However, the story of the shore platform at Żonqor can only be accurate if comparable treatment is given to both contemporary and historical events—in fact, it serves as an exemplar palimpsest that is clearly being rewritten on a frequent basis due to the observed power and variability of regular storms. This research thus sits comfortably with a range of other recent investigations that have stressed the importance of storms in moving coastal boulders (e.g., [4,21,67,68,69,70]).
Looking forward, perhaps, the immediate aftermath of a major storm in Malta in February 2019 provided the opportunity to make field observations of boulders newly transported by storm waves. Eyeball field sampling enabled the identification of at least 12 boulder movements, a figure corroborated by subsequent Google Earth images. The magnitude of this event was sufficient both to effect the detachment of new boulders from their sockets and to mobilise identifiable boulders that had been static throughout recent years. Table 2 shows that detectable boulder movements occurred in four of six consecutive intervals between 1957 and 2013. Including the 2019 storm event data as indicative of the 2013–2019 interval, the movement score rises to five of seven intervals. Analysis of the 2019 storm and thus expansion of the period of observable movements since 1957 will undoubtedly provide further insights into the impact of storm events on boulder movement at the decadal scale and their relationship to tsunami-generated impacts.
With this paper documenting the formulation of a revised hydrodynamic modelling approach, a final discussion point is warranted on its utility value and potential for further application. Here we have adapted an existing method to place emphasis on wave velocity, rather than wave height, and included a novel calibration based on an observed boulder movement. When married with existing boulder transport models (e.g., [19]), we argue the approach provides an improved diagnostic tool for distinguishing between boulders transported and emplaced by storm waves, of comparable magnitude to the largest storms experienced over recent decades, and those more likely to have been mobilised by more historical events and potentially tsunami; in doing so, the approach goes some way to tackle the criticisms raised by Cox et al. [13]. In particular, the method overcomes the reported exaggeration of wave heights required for boulder displacement (and thus emplacement), with the Froude number (in converting wave velocity to wave height) hinted as the culprit (e.g., [21]). Here the Froude number is back-calculated rather than pre-selected, and so is allowed to vary, in stark contrast to the Nott approach. The method adopted here, however, is less than perfect and remains a simplistic treatment of the hydrodynamic processes with generalised inputs, when in reality they are by nature highly complex. Acknowledging this and as a cautionary note for its further application, we reaffirm that the results should be treated as indicative only and complementing other field-based sources of evidence.
6. Conclusions
The Maltese Islands, with their central position in the Mediterranean Sea, are ideally placed to record extreme wave events. In effect they serve as a dipstick for palaeo-environmental coastal events. With a predominance of cliffed coastlines around the archipelago, there is a shortage of rocky shores at elevations close to sea level; on the east side of the islands where most of the rocky shorelines are located, urban development has widely demolished natural land surfaces. The coastline at Żonqor is exceptional, however, in that despite the agricultural development of the adjacent hillslopes, it still preserves a local strip of coastal land that displays geomorphic signatures of extreme coastal events. The observed movement of a number of megaclasts over recent decades makes the coastline even more interesting as an exploratory site for unravelling contemporary and historical geomorphic processes responsible for the forms and features that define the shoreline landscape today. The conclusions from this study can be summarised as follows:
- The study adopted a mixed methods approach for detecting and contrasting boulder histories, bringing together evidence from field survey, analysis of time-sequential imagery and hydrodynamic modelling. Each method proved valuable in generating unique insights but in complement they have enabled a degree of confidence in revealing the impacts of both contemporary storm waves and ancient extreme waves on the complex shore landscape at Żonqor.
- Tracking of boulder movements between 1957 and 2013 focused on the role of contemporary storm waves and enabled an irrefutable group of recent movers to be identified and their transport pathways to be reconstructed and compared. Out of six intervals between successive images, four reveal notable movements. Surprisingly, storm waves are rearranging boulders along the Żonqor coast at frequent intervals and with varying magnitude, with some storms merely performing tinkering work while others are quite capable of pivoting and lifting megaclasts over the Globigerina scarp, thus freeing them from their lower shoreline trap and initiating their subsequent and intermittent shunting up the platform ramp.
- The field survey provided corroborating evidence which added detail to recent mover pathways and enabled speculation of the nature of often complex movements but, inevitably, attention was drawn to the more ancient boulders, classified as such by a range of diagnostic criteria. This led to establishing the notable boulder berm as the boundary separating the shoreward contemporary platform surface, impacted by regular storm waves, from the landward ancient surface with numerous boulders exhibiting significant weathering. Close inspection of a number of the ancient movers suggests that they must have remained static for centuries in order to develop their delicate weathering features. A unique finding for this site is the landward-facing (reverse) imbrication of individuals in the boulder fields at c. 10–12 m asl. The implication is that a wave (or waves) of sufficient magnitude must have travelled further inland to higher elevations in order to create powerful enough backwash necessary to create the reverse imbrication attitudes. Therefore, there is strong evidence that the majority of the ancient movers inspected have been positioned on the landscape by either historical extreme storm waves, of greater magnitude than recent events, or they are tsunamigenic in origin.
- The hydrodynamic modelling results are offered as auxiliary evidence, acknowledging the large uncertainty associated with estimating velocities required for boulder transport/emplacement and whether waves are of sufficient power to generate them. Despite this caution, the results provide the wave run-up context both to define the realm of the recent movers and also to suggest a limited range of storm wave activity, leaving many of the ancient movers clearly immovable by events of comparable magnitude to those of the last half century or so. In addition, the modelling exercise explored the likely velocities required to overturn two ancient movers, closer to the shoreline, with somewhat inconclusive results for one of the boulders suggesting that its pivot over the Globigerina scarp theoretically could have been performed by a storm wave; the other of sufficient elevation to cautiously suggest a tsunami-driven movement.
- The result is a complex assemblage of boulders at Żonqor, with clearly defined groupings, attributable in different ways to both contemporary storm waves and ancient extreme events—a palimpsest where regular storms of varying magnitude appear to rework the distribution of boulders close to the shoreline at surprisingly frequent intervals but over long time periods the landscape becomes reset by tsunami. In light of this, a fully informed understanding of the nature and implications of impacts of such events on coastal environments needs to be developed by agencies in Malta responsible for coastal safety and management.
- Finally, the study provided a test-bed for performing a novel revised method for defining the velocity decay profile associated with wave run-up, which can be compared with existing boulder transport models for ascertaining those boulders likely to have been moved under different design wave conditions. The theoretical formulation is provided together with equations for practical application. The method requires calibration against a known boulder movement and overcomes some of the criticisms associated with converting wave velocity to wave height in the Nott approach, thus providing an alternative means of discriminating between the impact of extreme waves of both storm and tsunami origin.
Supplementary Materials
The following are available online at https://www.mdpi.com/2076-3263/10/10/400/s1: Microsoft Excel Macro-Enabled Workbook file.
Author Contributions
Conceptualization, D.N.M., P.J.S. and M.J.B.; methodology, D.N.M. and P.J.S.; field investigation, D.N.M., M.J.B., L.J.H., modelling, P.J.S.; data curation, D.N.M., and P.J.S.; formal analysis, D.N.M. and P.J.S.; writing—original draft preparation, D.N.M., P.J.S., and M.J.B.; writing—review and editing, D.N.M. and P.J.S.; visualization, D.N.M., P.J.S. and L.J.H. All authors have read and agreed to the published version of the manuscript.
Funding
This research received no external funding.
Acknowledgments
We thank Paul Carter in the School of the Earth, Geography and Geosciences at the University of Portsmouth, UK, for cartographic support. We express gratitude to Ritienne Gauci for introducing us to the Żonqor site and Joanna Causon Deguara for assisting in data collection at an early stage of this study, both of the University of Malta. Kenneth Buhagiar, also of the University of Malta, kindly advised on the age of the historic field walls. In addition, we thank three anonymous reviewers for their constructive comments for improving the manuscript.
Conflicts of Interest
The authors declare no conflict of interest.
Appendix A
Appendix A.1. Wave Velocity Decay Model
Appendix A.1.1. Theoretical Derivation
Cox and Machemehl [46] demonstrated how the rate of energy dissipation in the wave travelling at speed V (m s−1) and with decaying wave height H (m) can be expressed as (their Equation (5)):
where: L = local wavelength (m); D = depth of standing water in front of the propagating wave (m); X is distance from the point of wave breaking (m).
The speed of the wave in shallow water was given by Cox and Machemehl [46] as:
so that (their Equation (6)):
where: T = wave period (s); g = acceleration due to gravity (9.81 m s−2); Fr = Froude number. Cox and Machemehl [46] did not explicitly account for the Froude number and so they tacitly assumed Fr = 1. But for breaking waves, Fr has been found to vary widely.
Substituting Equation (A3) into (A1), yields (their Equation (7)):
The depth of standing water, D, can be expressed as a proportion of the wave height, H, such that:
where a > 0. Cox and Machemehl [46] assumed that a = 0.1. Substituting Equation (A5) into (A4), gives:
Cox and Machemehl [46] then approximated a (a + 1)0.5 to 0.1 in their Equation (8). Inverting Equation (A5) and integrating with respect to wave height yields the following expression for the decayed wave height with increasing distance travelled:
which is a modified version of Cox and Machemehl’s [46] Equation (9), where: Hb = overtopping height (m) and for the case of a wave breaking over a shore platform this can be assumed to equate to the wave height at X = 0.
Substituting Equations (A4) and (A5) into (A7) and rearranging produces the following expression for the decay in velocity with increasing distance (where a > 0):
The Froude number can be evaluated by identifying an X, V pairing suitable for calibration. This can be achieved using a Nott-type expression (e.g., [19]) for the transport of a single boulder where its movement can be identified from sequential aerial photography or other imagery. Ideally, to employ Equation (A8) to simulate extreme storm waves over recent decades and enable discrimination between mobile and immobile boulders, this would be an observable boulder movement requiring the greatest velocity from the modelled dataset of boulders examined. The relation between velocity and travel distance in Equation (8), therefore, passes through the point Xc, Vc. Rearranging Equation (A8), enables the Froude number for this specific wave and calibration boulder movement to be back-calculated as follows:
where Vc (m s−1) is the velocity for the calibration event and Xc is the corresponding distance from the shoreline.
Substituting the Froude number (Equation (A9)) into the velocity expression (Equation (A8)) derives the following simpler relationship between velocity and distance:
Note that this is a linear function and thus unlike the form of parabolic decay in wave ‘height’ curves previously published (e.g., [23]), as H∝V 2. Hb and Fr do not feature in Equation (A8), both subsumed in the calibration velocity, Vc.
Cox and Machemehl [46] presented their original methodology with the premise that the energy loss due to frictional resistance is negligible in comparison to the total breaking energy loss and can thus be ignored; this assumption, therefore, also applies to the revised method here.
Appendix A.1.2. Equations for Practical Application
For practical application, we reinstate a = 0.1 (as assumed by [46]). While the original approach assumed zero gradient, it is reasonable to use X/cosθ for the distance of wave travel for sites with mild slopes (angle θ), where X is the horizontal distance; cognisant that the model does not explicitly account for flow along a sloping shoreline and this adjustment is a trigonometric correction only (a similar refinement was applied by Barbano [23]). For θ < 20°, the impact of this correction is marginal. We stress that in providing the following equations for practical application, their simplified theoretical basis warrants treatment at an ‘indicative’ level at best and subject to some uncertainty.
The Velocity, V, (m s−1) of a decaying wave over horizontal distance X (m) and upshore gradient θ° is given by:
where: T = wave period (seconds); Vc (m s−1) = velocity for a calibration event (independently estimated velocity for the known movement of a boulder), X is distance from the point of wave breaking, i.e., the shoreline (m) and; Xc = distance from the shoreline where Vc is assessed.
Equation (A11) is thus a linear relationship between wave velocity and distance travelled, with gradient of the velocity decay line given by:
Thus, the gradient of the line is dictated by the wave period. The wave velocity at the shoreline edge, Vo, (where X = 0) is given by:
And the wave decays to zero velocity at a distance Xmax (m) given by rearranging Equation (A11) and simplifying by accounting for m and Vo:
Revisiting Equation (A9), the Froude Number is now simplified to:
where Hb = breaking wave height at X = 0. Without a calibration event, we can set Xc in Equation (A15) to zero and take Vc as the velocity at the shoreline assumed by Cox and Machemehl [46], such that:
Substituting Equation (A16) into (A15), produces a Froude number of 1.0, as found in Cox and Machemehl’s [46] original formulation.
In the suite of Equations (A11)–(A14) the analysis centres on the velocity of the wave and avoids the need to calculate minimum wave heights for the movement and emplacement of individual boulders that would require prior specification of the Froude number. However, should the height, H, of the decaying wave be required, the following expression can be employed (derived from Equation (A2)) after first calculating V from Equation A11 and Fr from Equation (A15):
Appendix B
Appendix B.1. Characteristics of Boulders of Interest

Table A1.
Characteristics of boulders of interest.
| Group | Variable | Median | Maximum | Minimum | Range |
|---|---|---|---|---|---|
| Recent Movers (RM) | a-axis (m) | 3.8 | 8.5 | 1.5 | 7.0 |
| Box volume (m3) | 6.99 | 55.25 | 1.80 | 53.45 | |
| Box mass (1000 kg) | 13.29 | 104.98 | 3.42 | 101.56 | |
| Elevation (m asl) | 3.54 | 5.88 | 2.60 | 3.28 | |
| Distance to shoreline (m) | 22.0 | 31.0 | 10.0 | 21.0 | |
| Indeterminate Movers (IM) | a-axis (m) | 3.6 | 6.7 | 2.0 | 4.7 |
| Box volume (m3) | 8.30 | 62.31 | 1.65 | 60.66 | |
| Box mass (1000 kg) | 15.77 | 118.39 | 3.14 | 115.25 | |
| Elevation (m asl) | 6.10 | 7.74 | 2.34 | 5.40 | |
| Distance to shoreline (m) | 39 | 55 | 11 | 44 | |
| Ancient Movers (AM) | a-axis (m) | 1.6 | 6.2 | 1.0 | 5.2 |
| Box volume (m3) | 0.58 | 31.25 | 0.25 | 31.00 | |
| Box mass (1000 kg) | 1.09 | 59.37 | 0.48 | 58.89 | |
| Elevation (m asl) | 10.06 | 11.97 | 4.70 | 7.27 | |
| Distance to shoreline (m) | 65 | 92 | 11 | 81 |
Appendix C
Appendix C.1. Kruskal–Wallis Test between Boulder Groups
Table A2.
Kruskal–Wallis 3-way difference test between boulder groups.
| Variable | H-Factor | p-Value | |
|---|---|---|---|
| Boulder Characteristics | a-axis (m) | 39.30 | <0.01 |
| Box volume (m3) 1 | 15.30 | <0.01 | |
| Contextual Factors | Elevation (m asl) | 28.37 | <0.01 |
| Distance to shoreline (m) | 27.51 | <0.01 |
1 Also accounts for boulder mass as density is constant.
References
- Mastronuzzi, G.; Sansò, P. Large boulder accumulations by extreme waves along the Adriatic coast of southern Apulia (Italy). Quat. Int. 2004, 120, 173–184. [Google Scholar] [CrossRef]
- Mastronuzzi, G.; Pignatelli, C.; Sansò, P.; Selleri, G. Boulder accumulations produced by the 20th of February, 1743 tsunami along the coast of south-eastern Salento (Apulia region, Italy). Mar. Geol. 2007, 242, 191–205. [Google Scholar] [CrossRef]
- Scicchitano, G.; Monaco, C.; Tortorici, L. Large boulder deposits by tsunami waves along the Ionian coast of south-eastern Sicily (Italy). Mar. Geol. 2007, 238, 75–91. [Google Scholar] [CrossRef]
- Etienne, S.; Paris, R. Boulder accumulations related to storms on the south coast of the Reykjanes Peninsula (Iceland). Geomorphology 2010, 114, 55–70. [Google Scholar] [CrossRef]
- Shah-Hosseini, M.; Morhange, C.; Beni, A.N.; Marriner, N.; Lahijani, H.; Hamzeh, M.; Sabatier, F. Coastal boulders as evidence for high-energy waves on the Iranian coast of Makran. Mar. Geol. 2011, 290, 17–28. [Google Scholar] [CrossRef]
- Engel, M.; May, S.M. Bonaire’s boulder fields revisited: Evidence for Holocene tsunami impact on the Leeward Antilles. Quat. Sci. Rev. 2012, 54, 126–141. [Google Scholar] [CrossRef]
- Mottershead, D.; Bray, M.; Soar, P.; Farres, P.J. Extreme wave events in the central Mediterranean: Geomorphic evidence of tsunami on the Maltese islands. Z. Geomorphol. 2014, 58, 385–411. [Google Scholar] [CrossRef] [Green Version]
- Biolchi, S.; Furlani, S.; Antonioli, F.; Baldassini, N.; Causon Deguara, J.; Devoto, S.; Di Stefano, A.; Evans, J.; Gambin, T.; Gauci, R.; et al. Boulder accumulations related to extreme wave events on the eastern coast of Malta. Nat. Hazards Earth Syst. Sci. 2016, 16, 719–756. [Google Scholar] [CrossRef] [Green Version]
- Cox, R.; O’Boyle, L.; Cytrynbaum, J. Imbricated coastal boulder deposits are formed by storm waves, and can preserve a long-term storminess record. Sci. Rep. 2019, 9, 10784. [Google Scholar] [CrossRef]
- Roig-Munar, F.X.; Rodríguez-Perea, A.; Vilaplana, J.M.; Martín-Prieto, J.A.; Gelabert, B. Tsunami boulders in Majorca Island (Balearic Islands, Spain). Geomorphology 2019, 334, 76–90. [Google Scholar] [CrossRef]
- Mastronuzzi, G.; Capolongo, D.; Ferilli, S.; Marsico, A.; Milella, M.; Pignatelli, C.; Piscitelli, A.; Sansò, P. Tsunami maximum flooding assessment in GIS environment. In Tsunami: From Fundamentals to Damage Mitigation; Mambretti, S., Ed.; WIT Press: Southampton, UK, 2013; pp. 61–80. ISBN 978-18-4564-770-4. [Google Scholar] [CrossRef]
- Mueller, C.; Micallef, A.; Spatola, D.; Wang, X. The tsunami inundation hazard of the Maltese Islands (central Mediterranean Sea): A submarine landslide and earthquake tsunami scenario study. Pure Appl. Geophys. 2020, 177, 1617–1638. [Google Scholar] [CrossRef]
- Cox, R.; Ardhuin, F.; Dias, F.; Autret, R.; Beisiegel, N.; Earlie, C.S.; Herterich, J.G.; Kenedy, A.; Paris, R.; Raby, A.; et al. Systematic review shows that work done by storm waves can be misinterpreted as tsunami-related because commonly used hydrodynamic equations are flawed. Front. Mar. Sci. 2020, 7. [Google Scholar] [CrossRef]
- Marriner, N.; Kaniewski, D.; Morhange, C.; Flaux, C.; Giaime, M.; Vacchi, M.; Goff, J. Tsunamis in the geological record: Making waves with a cautionary tale from the Mediterranean. Sci. Adv. 2017, 3, e1700485. [Google Scholar] [CrossRef] [PubMed] [Green Version]
- Vött, A.; Bruins, H.J.; Gawehn, M.; Goodman-Tchernov, B.N.; de Martini, P.M.; Kelletat, D.; Mastronuzzi, G.; Reicherter, K.; Röbke, B.R.; Scheffers, A.; et al. Publicity waves based on manipulated geoscientific data suggesting climatic trigger for majority of tsunami findings in the Mediterranean—Response to ‘Tsunamis in the geological record: Making waves with a cautionary tale from the Mediterranean’ by Marriner et al. (2017). Z. Geomorphol. Suppl. Issue 2019, 62, 7–45. [Google Scholar] [CrossRef]
- Nott, J. Extremely high-energy wave deposits inside the Great Barrier Reef, Australia: Determining the cause—Tsunami or tropical cyclone. Mar. Geol. 1997, 141, 193–207. [Google Scholar] [CrossRef]
- Nott, J. Tsunami or storm waves?: Determining the origin of a spectacular field of wave emplaced boulders using numerical storm surge and wave models and hydrodynamic transport equations. J. Coast. Res. 2003, 19, 348–356. [Google Scholar]
- Nott, J. Waves, coastal boulder deposits and the importance of the pre-transport setting. Earth Plan. Sci. Lett. 2003, 210, 269–276. [Google Scholar] [CrossRef]
- Nandasena, N.A.K.; Paris, R.; Tanaka, N. Reassessment of hydrodynamic equations: Minimum flow velocity to initiate boulder transport by high energy events (storms, tsunamis). Mar. Geol. 2011, 281, 70–84. [Google Scholar] [CrossRef]
- Boulton, S.; Whitworth, M. Block and boulder accumulations on the southern coast of Crete (Greece): Evidence for the 365 CE tsunami in the Eastern Mediterranean. Geol. Soc. Lond. Spec. Publ. 2017, 456, 105–125. [Google Scholar] [CrossRef] [Green Version]
- Causon Deguara, J.; Gauci, R. Evidence of extreme wave events from boulder deposits on the south-east coast of Malta (Central Mediterranean). Nat. Hazards 2017, 86, 543–568. [Google Scholar] [CrossRef]
- Nandasena, N.A.K.; Tanaka, N.; Sasaki, Y.; Osada, M. Boulder transport by the 2011 Great East Japan tsunami: Comprehensive field observations and whither model predictions? Mar. Geol. 2013, 346, 292–309. [Google Scholar] [CrossRef]
- Barbano, M.S.; Pirrotta, C.; Gerardi, F. Large boulders along the south-eastern Ionian coast of Sicily: Storm or tsunami deposits? Mar. Geol. 2010, 275, 140–154. [Google Scholar] [CrossRef]
- Barbano, M.S.; Gerardi, F.; Pirrotta, C. Differentiation between boulders deposited by tsunamis and storm waves along the south-eastern Ionian coast of Sicily (Italy). Boll. Geofis. Teor. Appl. 2011, 52, 707–728. [Google Scholar] [CrossRef]
- Mottershead, D.N.; Bray, M.J.; Soar, P.J. Tsunami landfalls in the Maltese archipelago: Reconciling the historical record with geomorphological evidence. Geol. Soc. Lond. Spec. Publ. 2018, 456, 127–141. [Google Scholar] [CrossRef] [Green Version]
- Mottershead, D.N.; Bray, M.J.; Soar, P.J.; Farres, P.J. Erosional signatures characteristic of tsunami on rocky coasts of the Maltese islands. Earth Surf. Process. Landf. 2015, 40, 2093–2111. [Google Scholar] [CrossRef] [Green Version]
- Drago, A. Sea level variability and the ‘Milghuba’ seiche oscillations in the northern coast of Malta, Central Mediterranean. Phys. Chem. Earth 2009, 34, 948–970. [Google Scholar] [CrossRef]
- Komar, P.D. Beach Processes and Sedimentation, 2nd ed.; Prentice-Hall Inc.: Upper Saddle River, NJ, USA, 1998; ISBN 978-0-13-754938-2. [Google Scholar]
- Gatt, P.A. Model of limestone weathering and damage in masonry: Sedimentological and geotechnical controls in the Globigerina Limestone Formation (Miocene) of Malta. Xjenza 2006, 11, 30–39. [Google Scholar]
- Cassar, J. The use of limestone in a historic context—The experience of Malta. Geol. Soc. Lond. Spec. Publ. 2010, 331, 13–25. [Google Scholar] [CrossRef]
- Diana, G.; Cassar, J.; Zammit, G. Physical characteristics of Globigerina Limestone using ultrasonic and thermographic methods. Q. J. Eng. Geol. Hydrogeol. 2014, 47, 251–257. [Google Scholar] [CrossRef]
- Carbone, S.; Grasso, M.; Lentini, F.; Pedley, H.M. The distribution and palaeoenvironment of Early Miocene phosphorites of southeast Sicily and their relationships with the Maltese phosphorites. Palaeogeogr. Palaeoclimatol. Palaeoecol. 1987, 58, 35–53. [Google Scholar] [CrossRef]
- Baldassini, N.; Di Stefano, A. New insights on the Oligo-Miocene succession bearing phosphatic layers of the Maltese Archipelago. Ital. J. Geosci. 2015, 134, 355–366. [Google Scholar] [CrossRef]
- Pedley, H.M. The Oligo-Miocene Sediments of the Maltese Islands. Ph.D. Thesis, University of Hull, Hull, UK, 1974. [Google Scholar]
- Pedley, H.M. A palaeoecological study of the Upper Coralline Limestone, Terebratula-Aphelesia Bed (Miocene, Malta) based on bryozoan growth-form studies and brachiopod distributions. Palaeogeogr. Palaeoclimatol. Palaeoecol. 1976, 20, 209–234. [Google Scholar] [CrossRef]
- Slabe, T.; Liu, H. Significant subsoil rock forms. In Karst Rock Features: Karren Sculpturing; Carsologica 9; Gines, A., Knez, M., Slabe, T., Dreybrodt, W., Eds.; Založba ZRC: Postojna-Ljubljana, Slovenia, 2009; pp. 123–137. ISBN 978-961-254-161-3. [Google Scholar]
- Szeni, A. Subsoil shaping. In Karst Rock Features: Karren Sculpturing; Carsologica 9; Gines, A., Knez, M., Slabe, T., Dreybrodt, W., Eds.; Založba ZRC: Postojna-Ljubljana, Slovenia, 2009; pp. 103–121. ISBN 978-961-254-161-3. [Google Scholar]
- Farres, P. Palaeosoils: Legacies of past landscapes, with a series of contrasting examples from Malta. In Landscapes and Landforms of the Maltese Islands; Gauci, R., Schembri, J.A., Eds.; Springer Nature: Cham, Switzerland, 2019; pp. 141–152. ISBN 978-30-3015-456-1. [Google Scholar]
- Hansom, J.D.; Barltrop, N.P.D.; Hall, A.M. Modelling the processes of cliff-top erosion and deposition under extreme storm waves. Mar. Geol. 2008, 253, 36–50. [Google Scholar] [CrossRef]
- Barltrop, N.D.P.; Adams, A.J. The Dynamics of Fixed Marine Structures, 3rd ed.; Butterworth-Heineman: Oxford, UK, 1991; ISBN 978-1-4831-3013-2. [Google Scholar]
- Matsutomi, H.; Sakakiyama, T.; Nugroho, S.; Matsuyama, M. Aspects of inundated flow due to the 2004 Indian Ocean tsunami. Coast. Eng. J. 2006, 48, 167–195. [Google Scholar] [CrossRef]
- Tang, H.; Weiss, R. A model for tsunami flow inversion from deposits (TSUFLIND). Mar. Geol. 2015, 370, 55–62. [Google Scholar] [CrossRef] [Green Version]
- Montoya, L.; Lynett, P.; Kie Thio, H.; Li, W. Spatial statistics of tsunami overland flow properties. J. Waterw. Port Coast. Ocean Eng. 2017, 143, 04016017. [Google Scholar] [CrossRef] [Green Version]
- Holland, K.T.; Holman, R.A.; Sallenger, A.H. Estimation of overwash bore velocities using video techniques. In Coastal Sediments’ 91, Proceedings of a Specialty Conference on Quantitative Approaches to Coastal Sediment Processes, Seattle, WA, USA, 25–27 June 1991; Kraus, N.C., Gingrich, K.C., Kriebel, D.L., Eds.; American Society of Civil Engineers: New York, NY, USA, 1991; Volume 1, pp. 489–497. [Google Scholar]
- Matias, A.; Masselink, G.; Castelle, B.; Blenkinsopp, C.E.; Kroon, A. Measurements of morphodynamic and hydrodynamic overwash processes in a large-scale wave flume. Coast. Eng. 2016, 113, 33–46. [Google Scholar] [CrossRef] [Green Version]
- Cox, J.C.; Machemehl, J. Overload bore propagation due to an overtopping wave. J. Waterw. Port Coast. Ocean Eng. 1986, 112, 161–163. [Google Scholar] [CrossRef]
- Noormets, R.; Crook, K.A.W.; Felton, E.A. Sedimentology of rocky shorelines: 3: Hydrodynamics of megaclast emplacement and transport on a shore platform, Oahu, Hawaii. Sediment. Geol. 2004, 172, 41–65. [Google Scholar] [CrossRef]
- de Martini, P.M.; Barbano, M.S.; Smedile, A.; Gerardi, F.; Pantosti, D.; Del Carlo, P.; Pirrotta, C. A unique 4000 year-long geological record of multiple tsunami inundations in the Augusta Bay (eastern Sicily, Italy). Mar. Geol. 2010, 276, 42–57. [Google Scholar] [CrossRef] [Green Version]
- Dewey, J.F.; Ryan, P.D. Storm, rogue wave, or tsunami origin for megaclast deposits in western Ireland and North Island, New Zealand? Proc. Natl. Acad. Sci. USA 2017, 114, E10639–E10647. [Google Scholar] [CrossRef] [PubMed] [Green Version]
- Scheffers, A.M.; Kinis, S. Stable imbrication and delicate/unstable settings in coastal boulder deposits: Indicators for tsunami dislocation? Quat. Int. 2014, 332, 73–84. [Google Scholar] [CrossRef]
- Paris, R.; Ramalho, R.S.; Madeira, J.; Ávila, S.; May, S.M.; Rixhon, G.; Engel, M.; Brückner, H.; Herzog, M.; Schukraft, G.; et al. Mega-tsunami conglomerates and flank collapses of ocean island volcanoes. Mar. Geol. 2018, 395, 168–187. [Google Scholar] [CrossRef] [Green Version]
- Camilleri, D.H. Tsunami and wind-driven wave forces in the Mediterranean Sea. Proc. Inst. Civ. Eng. Mar. Eng. 2012, 165, 65–79. [Google Scholar] [CrossRef]
- Camilleri, D.H. Tsunami construction risks in the Mediterranean-outlining Malta’s scenario. Disaster Prev. Manag. 2006, 15, 146–162. [Google Scholar] [CrossRef]
- Tinti, S.; Armigliato, A.; Pagnoni, G.; Zaniboni, F. Scenarios of giant tsunamis of tectonic origin in the Mediterranean. ISET J. Earthq. Technol. 2005, 42, 171–188. [Google Scholar]
- Tinti, S.; Armigliato, A.; Bortolucci, E. Contribution of tsunami data analysis to constrain the seismic source: The case of the 1693 eastern Sicily earthquake. J. Seism. 2001, 5, 41–61. [Google Scholar] [CrossRef]
- Imamura, F.; Goto, K.; Ohkubo, S. A numerical model for the transport of a boulder by tsunami. J. Geophys. Res. Ocean. 2008, 113, C01008. [Google Scholar] [CrossRef]
- Mottershead, D.; Bray, M.; Causon Deguara, J. Tsunamigenic landscapes in the Maltese Islands: The Comino Channel coasts. In Landscapes and Landforms of the Maltese Islands; Gauci, R., Schembri, J.A., Eds.; Springer Nature: Cham, Switzerland, 2019; pp. 273–288. ISBN 978-3-03-015456-1. [Google Scholar]
- Bujan, N.; Cox, R. Maximal heights of nearshore storm waves and resultant onshore flow velocities. Front. Mar. Sci. 2020, 7, 309. [Google Scholar] [CrossRef]
- Mottershead, D.N. Spatial variations in intensity of alveolar weathering of a dated sandstone structure in a coastal environment, Weston super Mare, UK. In Rock Weathering and Landform Evolution; Robinson, D.A., Williams, R.B.G., Eds.; Wiley International: Chichester, UK, 1994; pp. 151–174. ISBN 978-0-471-95119-3. [Google Scholar]
- Mottershead, D.N. Coastal Weathering. In Treatise on Geomorphology, Vol 4: Weathering and Soils Geomorphology; Shroder, J.F., Pope, G.A., Eds.; Academic Press: San Diego, CA, USA, 2013; Volume 4, pp. 228–244. ISBN 978-01-2374-739-6. [Google Scholar] [CrossRef]
- Mottershead, D.N.; Gorbushina, A.; Lucas, G.; Wright, J.S. The influence of aspect, marine salts and microbes in the weathering of sandstone in two historic structures. Build. Environ. 2003, 38, 1193–1204. [Google Scholar] [CrossRef]
- Buhagiar, K.; University of Malta, Msida, Malta. Personal communication, 2020.
- de Soldanis, G.P.F.A. Il Gozo Antico-Moderno e Sacro-Profano (Gozo, Ancient & Modern, Religious & Profane); Rabat, G., Ed.; National Library of Malta: Valletta, Malta, 1746; Libr.145. Unpublished work, 1746. (In Italian) [Google Scholar]
- Ammianus, M. Res Gestae. Book XXVI.X.; Rome, Italy, c. 380 CE, pp. 16–19. Available online: http://www.tertullian.org/fathers/ammianus_26_book26.htm (accessed on 23 September 2020).
- Köng, E.; Zaragosi, S.; Schneider, J.-L.; Garlan, T.; Bachèlery, P.; San Pedro, L.; Seibert, C.; Racine, C. Untangling the complex origin of turbidite activity on the Calabrian Arc (Ionian Sea) over the last 60 ka. Mar. Geol. 2016, 373, 11–25. [Google Scholar] [CrossRef]
- Polonia, A.; Vaiani, S.C.; de Lange, G.J. Did the A.D. 365 Crete earthquake/tsunami trigger synchronous giant turbidity currents in the Mediterranean Sea? Geology 2016, 44, 19–22. [Google Scholar] [CrossRef]
- Paris, R.; Naylor, L.A.; Stephenson, W.J. Boulders as a signature of storms on rock coasts. Mar. Geol. 2011, 107, 76–90. [Google Scholar] [CrossRef]
- Cox, R.; Jahn, K.L.; Watkins, O.G.; Cox, P. Extraordinary boulder transport by storm waves (west of Ireland, winter 2013–2014), and criteria for analysing coastal boulder deposits. Earth Sci. Rev. 2018, 177, 623–636. [Google Scholar] [CrossRef]
- Cox, R.; Zentner, D.B.; Kirchner, B.J.; Cook, M.S. Boulder ridges on the Aran Islands (Ireland): Recent movements caused by storm waves, not tsunamis. J. Geol. 2012, 120, 249–272. [Google Scholar] [CrossRef] [Green Version]
- Biolchi, S.; Denamiel, C.; Devoto, S.; Korbar, T.; Macovaz, V.; Scicchitano, G.; Vilibić, I.; Furlani, S. Impact of the October 2018 storm Vaia on coastal boulders in the northern Adriatic Sea. Water 2019, 11, 2229. [Google Scholar] [CrossRef] [Green Version]
Figure 1.
Location of the Żonqor study site in southeast Malta. Other sites in the Maltese islands investigated by Mottershead et al. [7,25,26] and Biolchi et al. [8] are underlined.
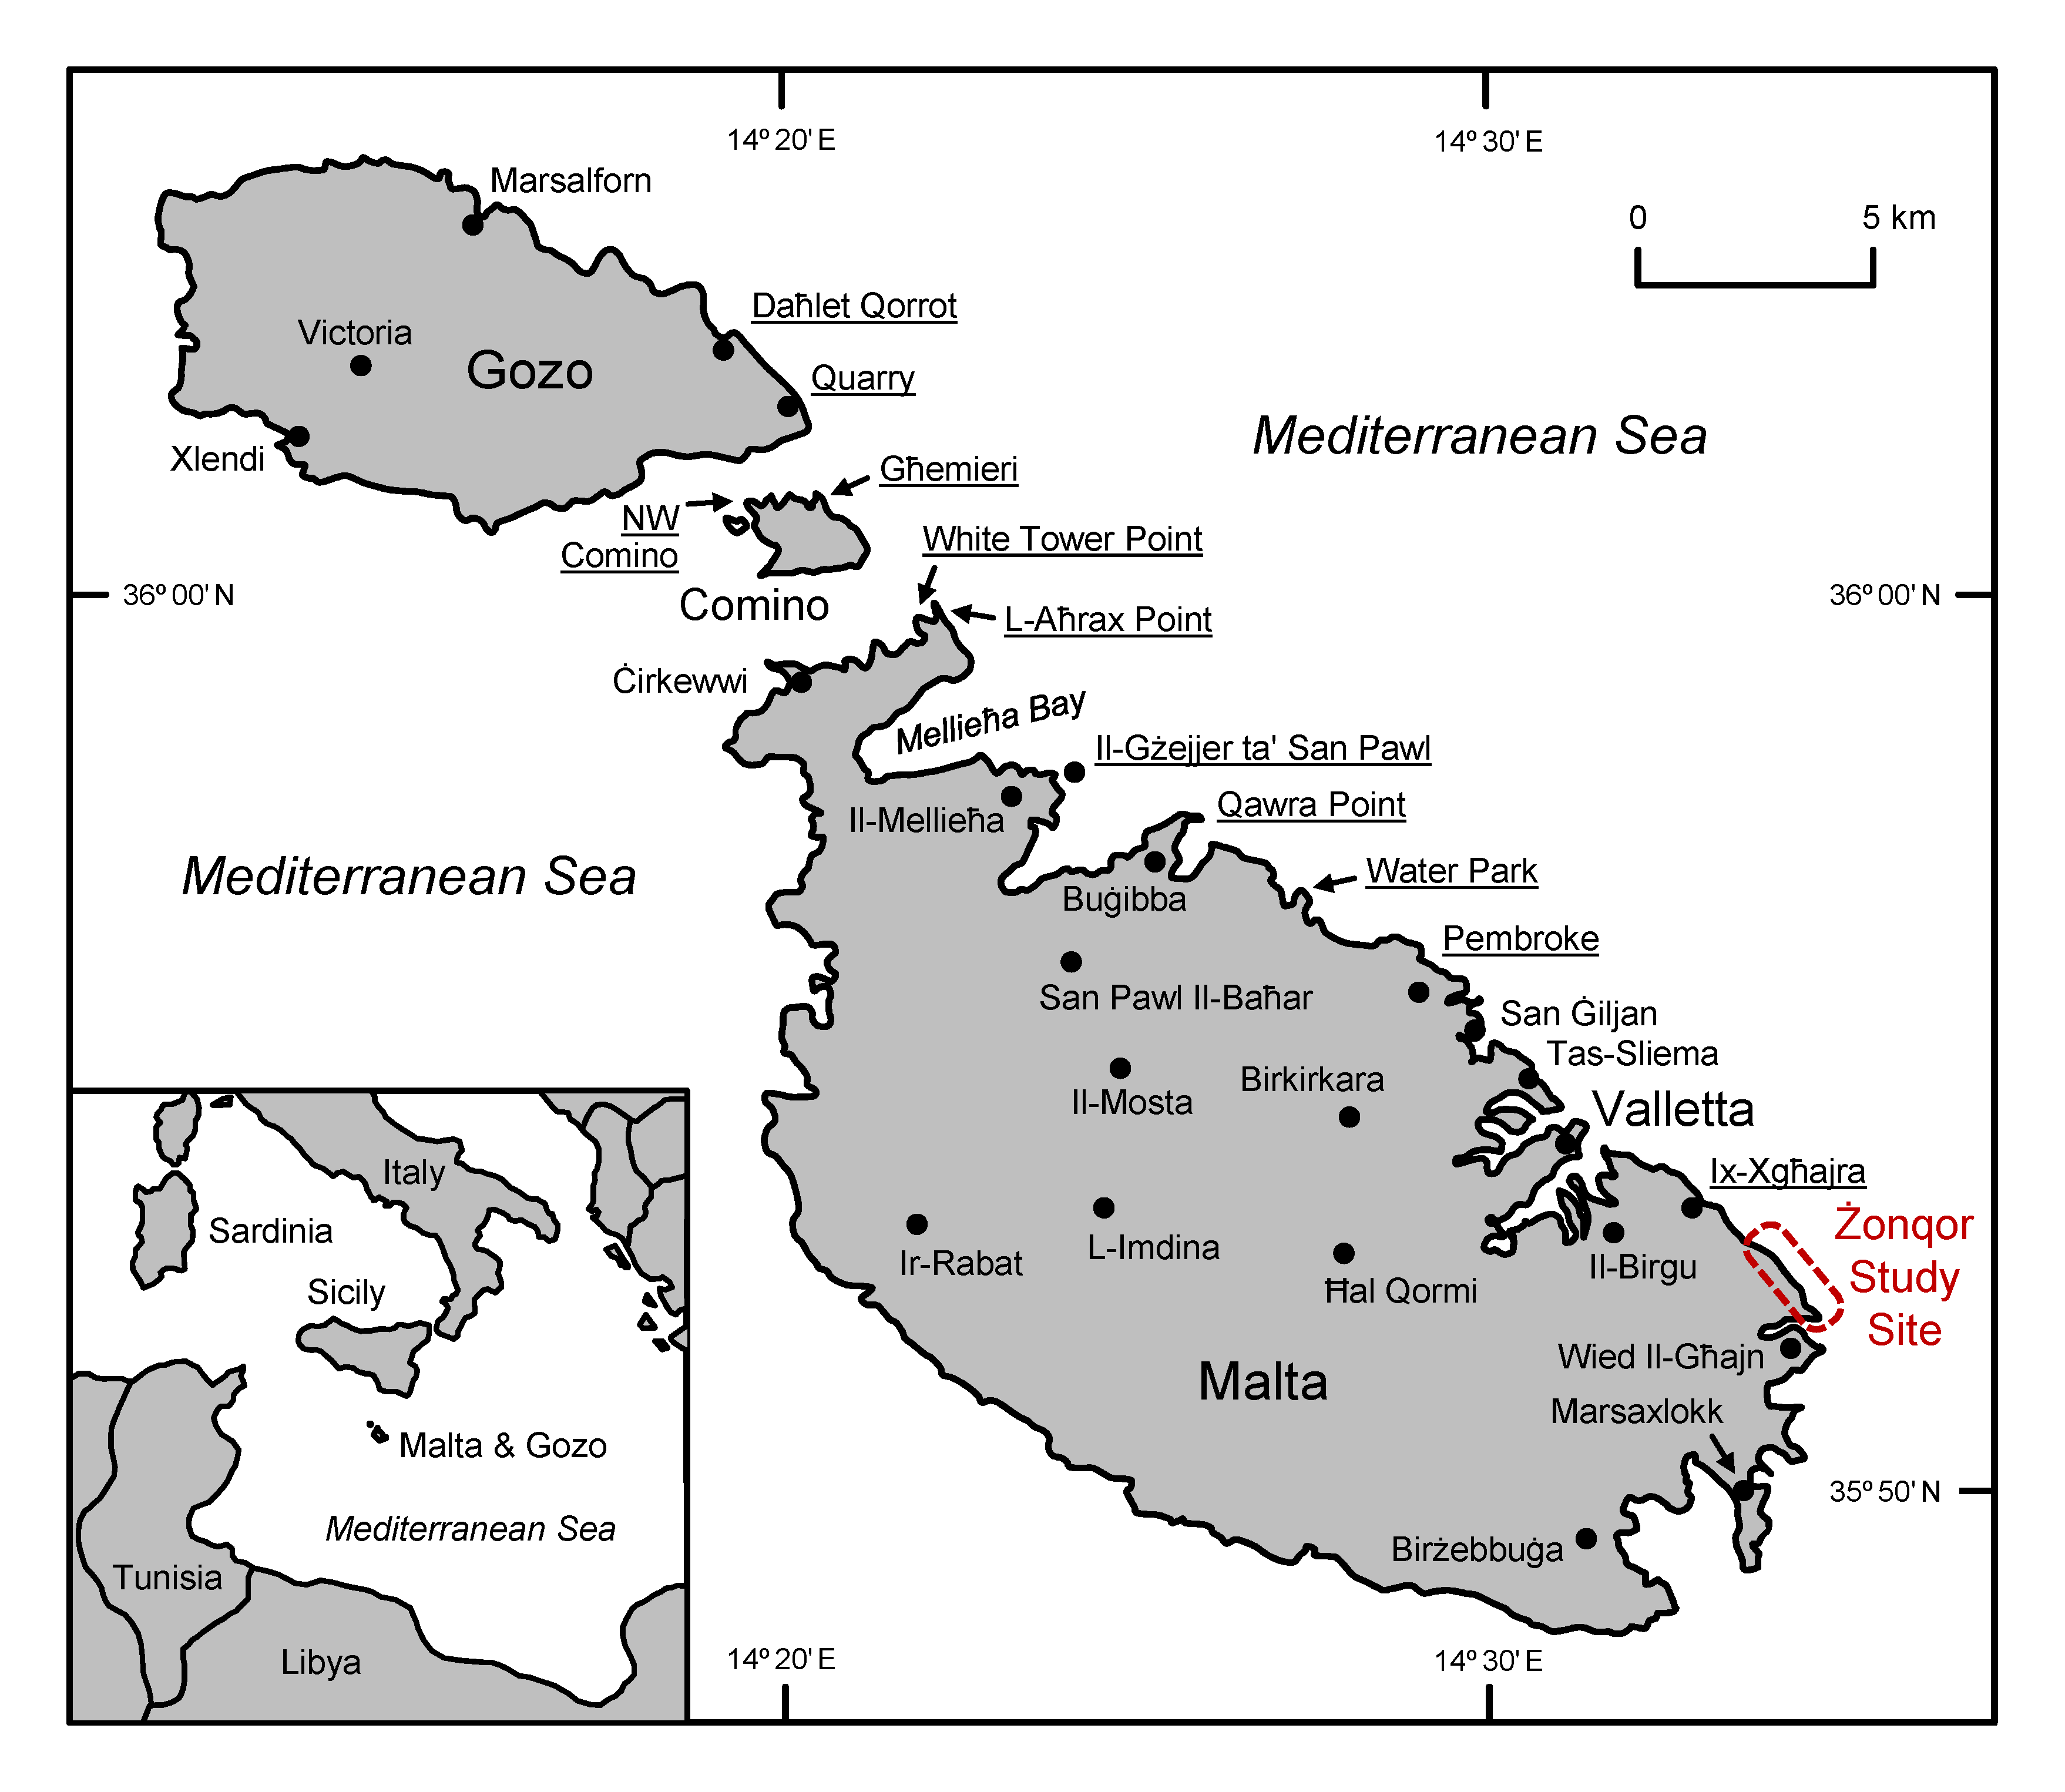
Figure 2.
Map of the Żonqor study site depicting local topographic features: the generalised line of the boulder berm; the locations of the north and south boulder fields (N+ and S+), and; the outline of made ground (grey polygon) that buries surficial geomorphic evidence. Hill shading is based on Light Detection And Ranging (LiDAR) at 1 m pixel resolution.
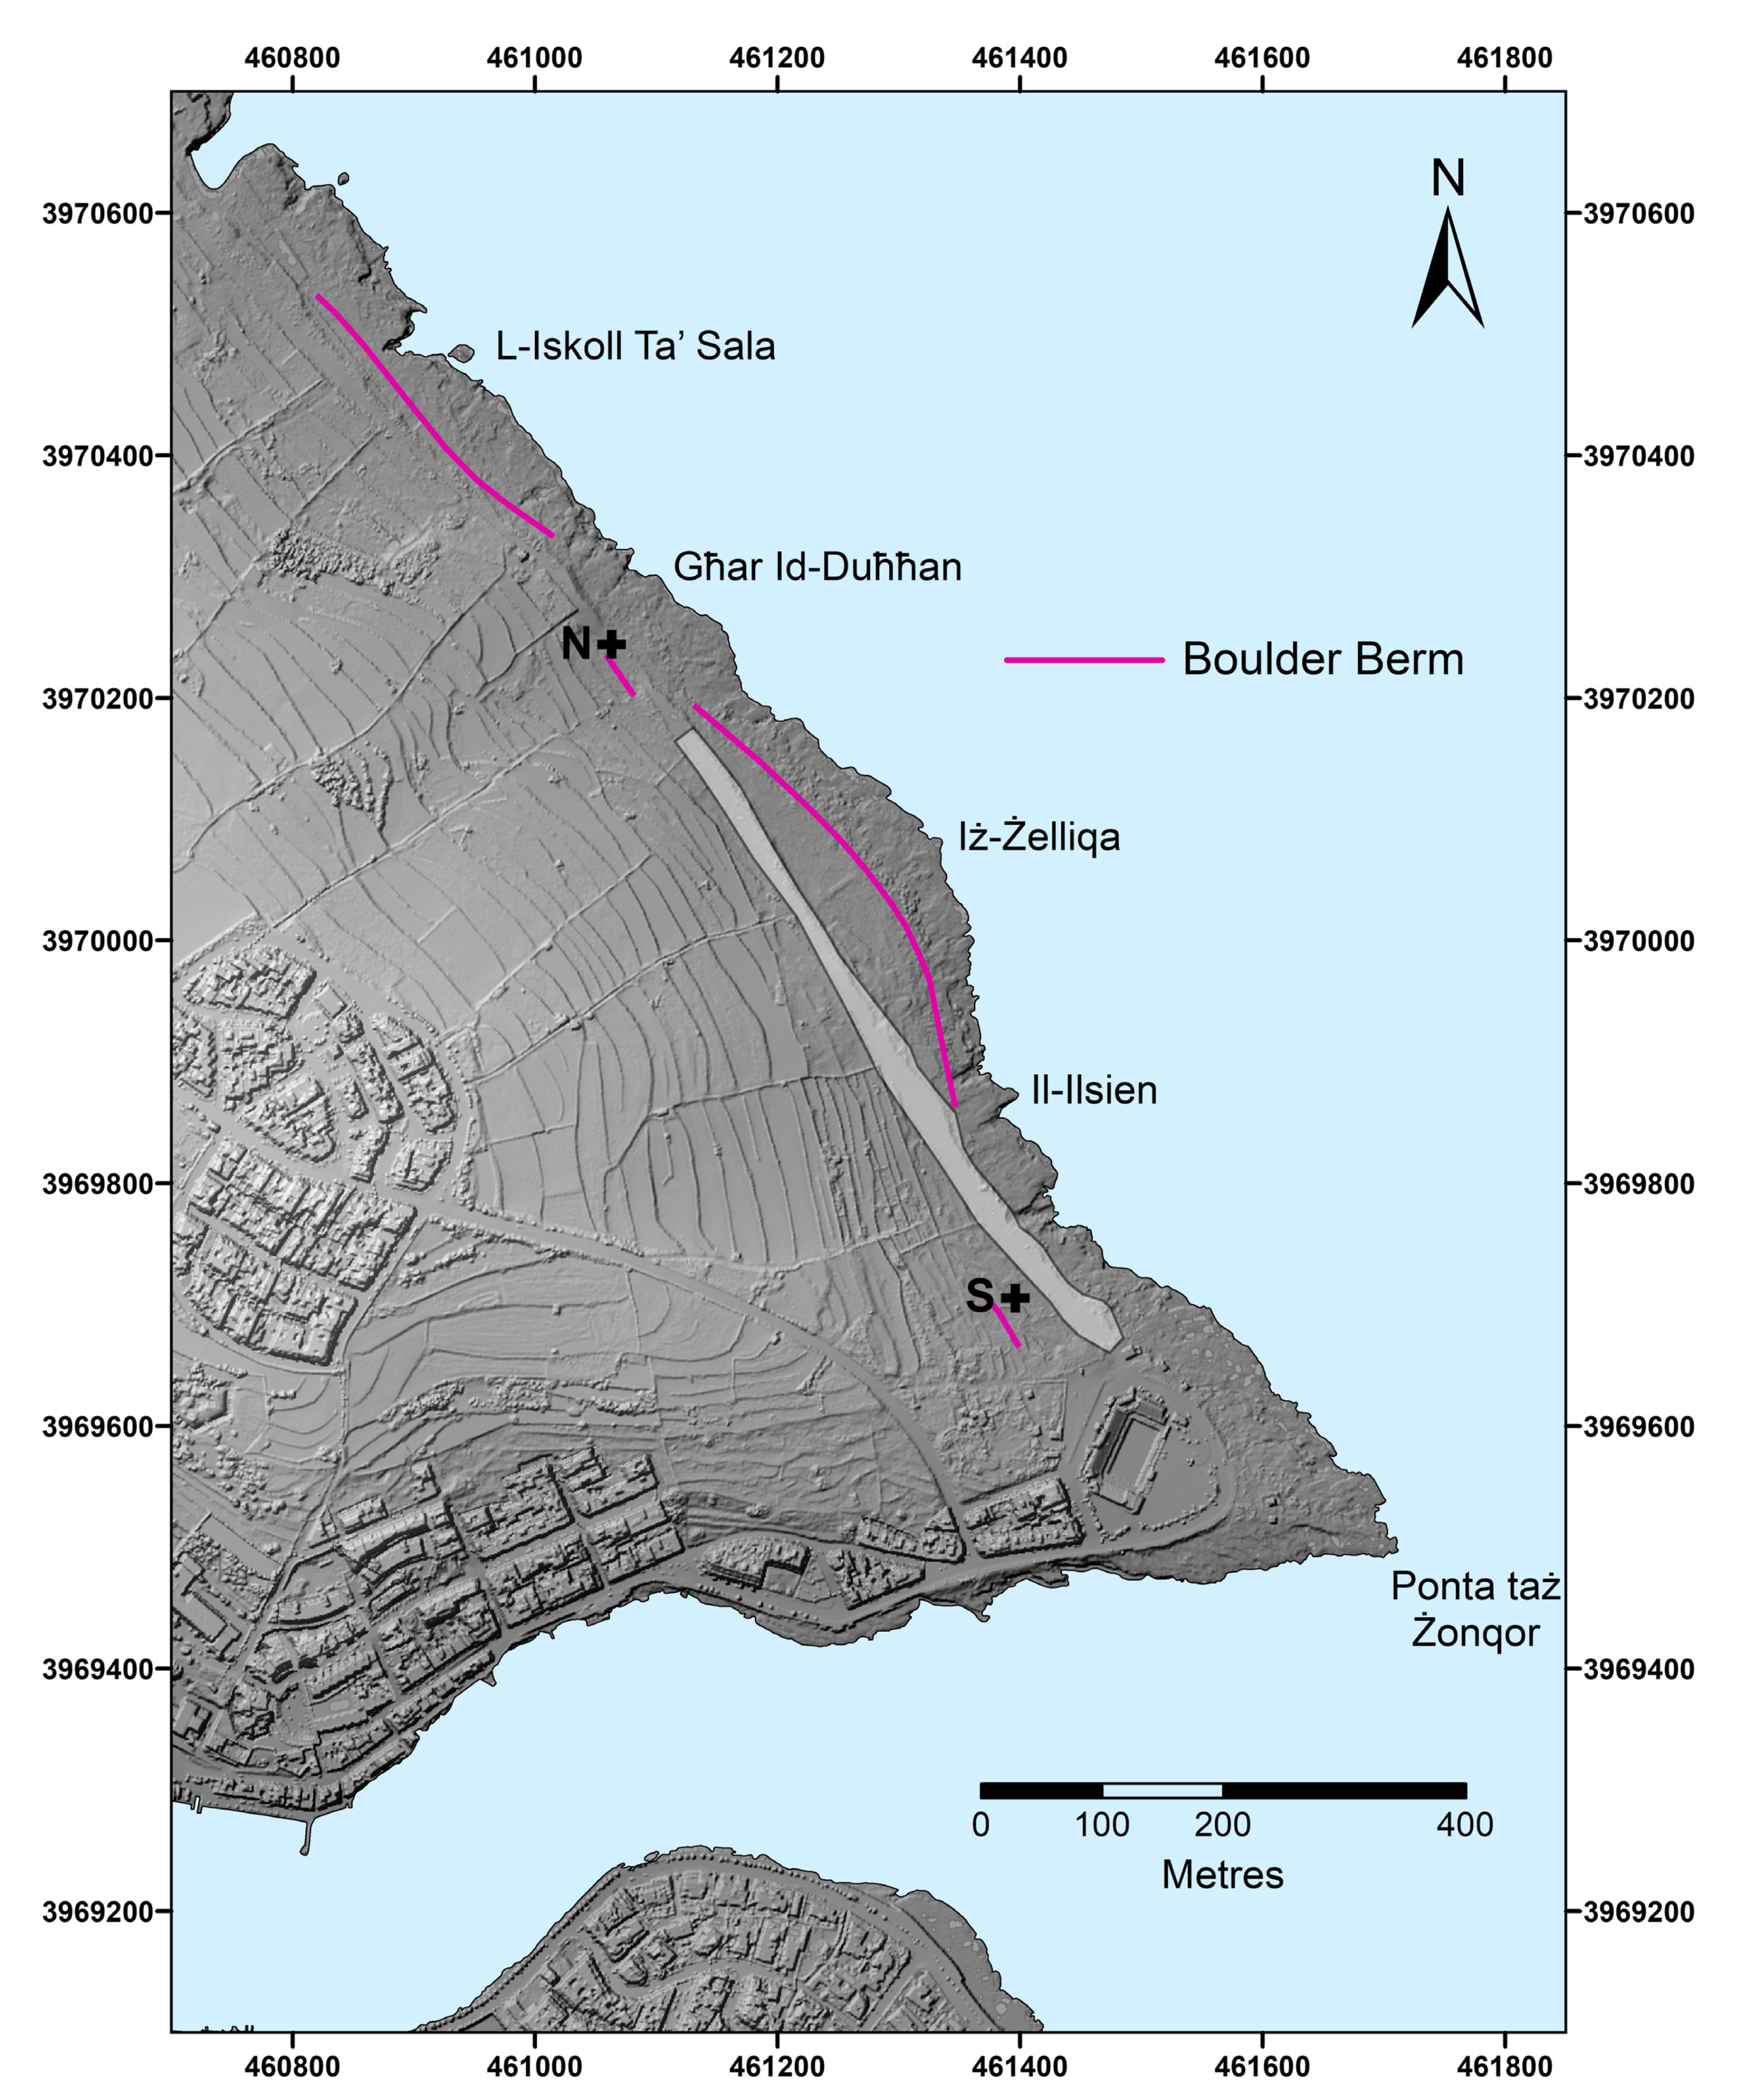
Figure 3.
Schematic cross-section and characterisation of the lower coastal slope at the Żonqor study site. Zones 1–7 are referred to in the text.
Figure 3.
Schematic cross-section and characterisation of the lower coastal slope at the Żonqor study site. Zones 1–7 are referred to in the text.
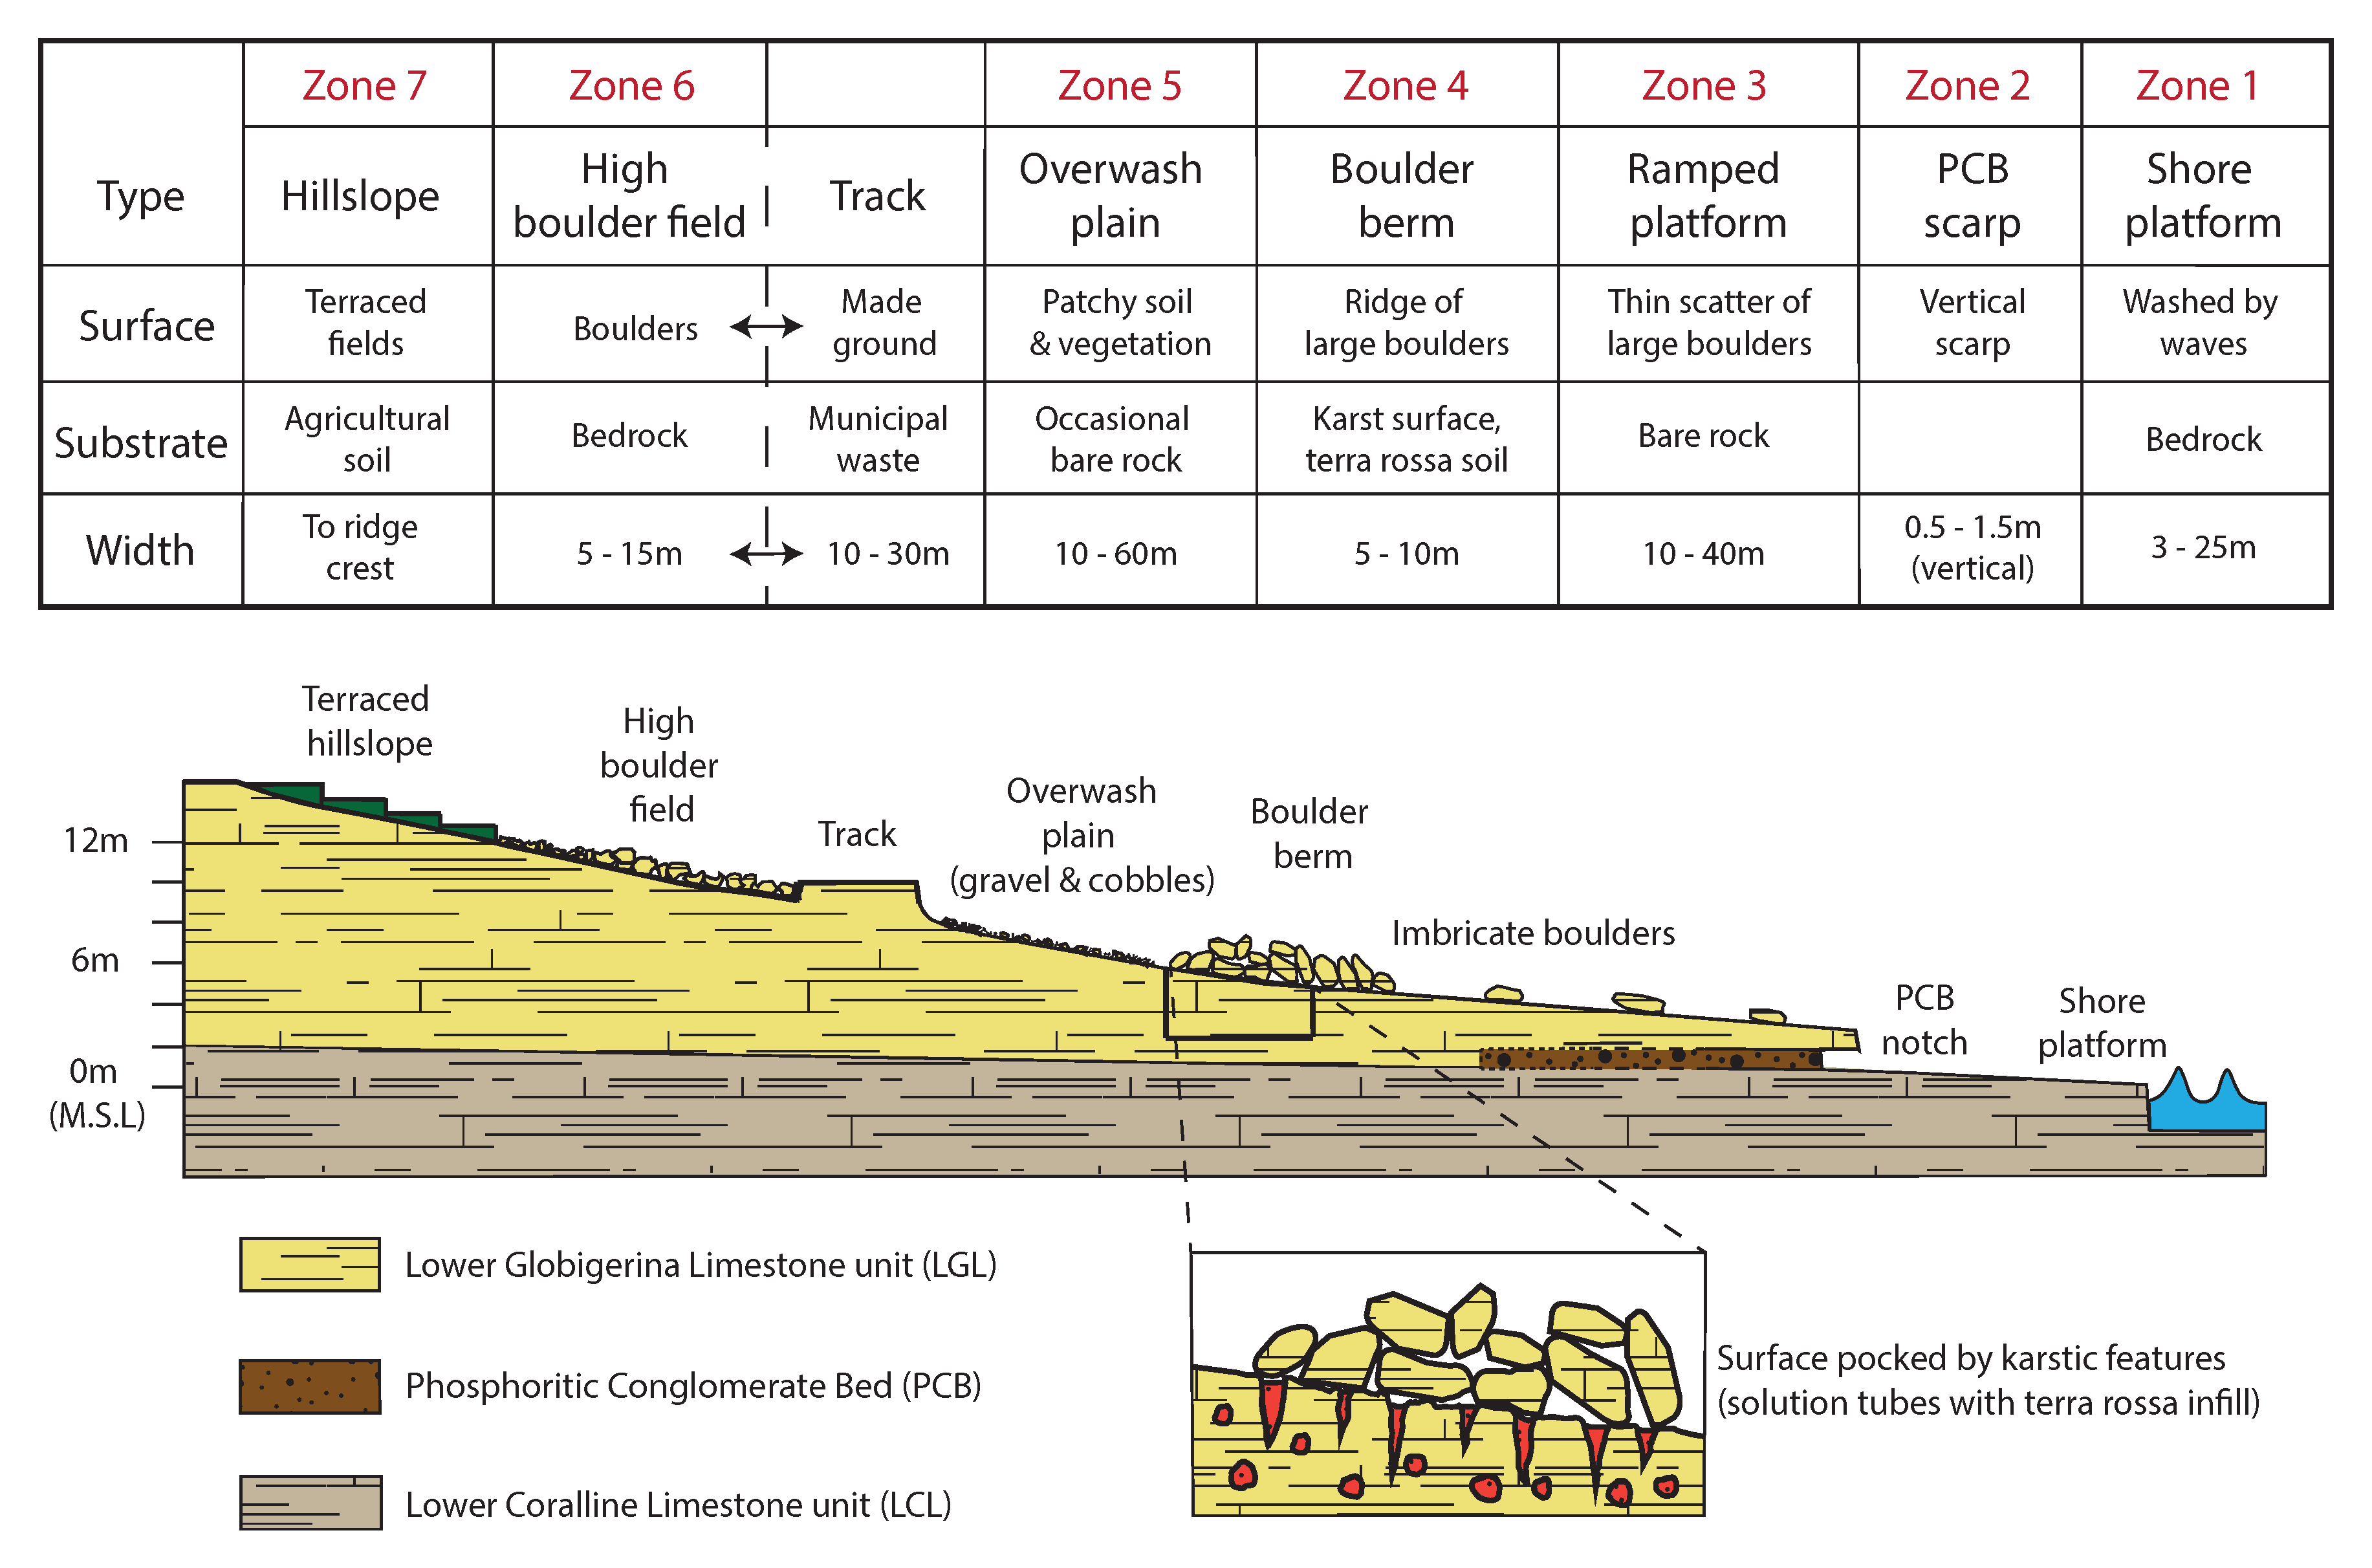
Figure 4.
The Lower Globigerina Limestone (LGL) scarp, here overhanging the basal notch associated with the Phosphoritic Conglomerate Bed (PCB) that in places extends horizontally to a depth of up to 3.5 m. The fallen rock mass (right) has become detached from the scarp face and now rests directly on the shore platform beneath. The stratigraphic boundary clearly visible in the fallen mass can be matched with its in situ counterpart pointed out on the scarp face, indicative of both the height of the notch and the depth of the fall. The knobbly surface of the shore platform is characteristic of Lower Coralline Limestone (LCL). Large boulders are present on the ramp surface above the scarp, including a prominent inverted boulder (PCB bed facing upward) just left of centre.
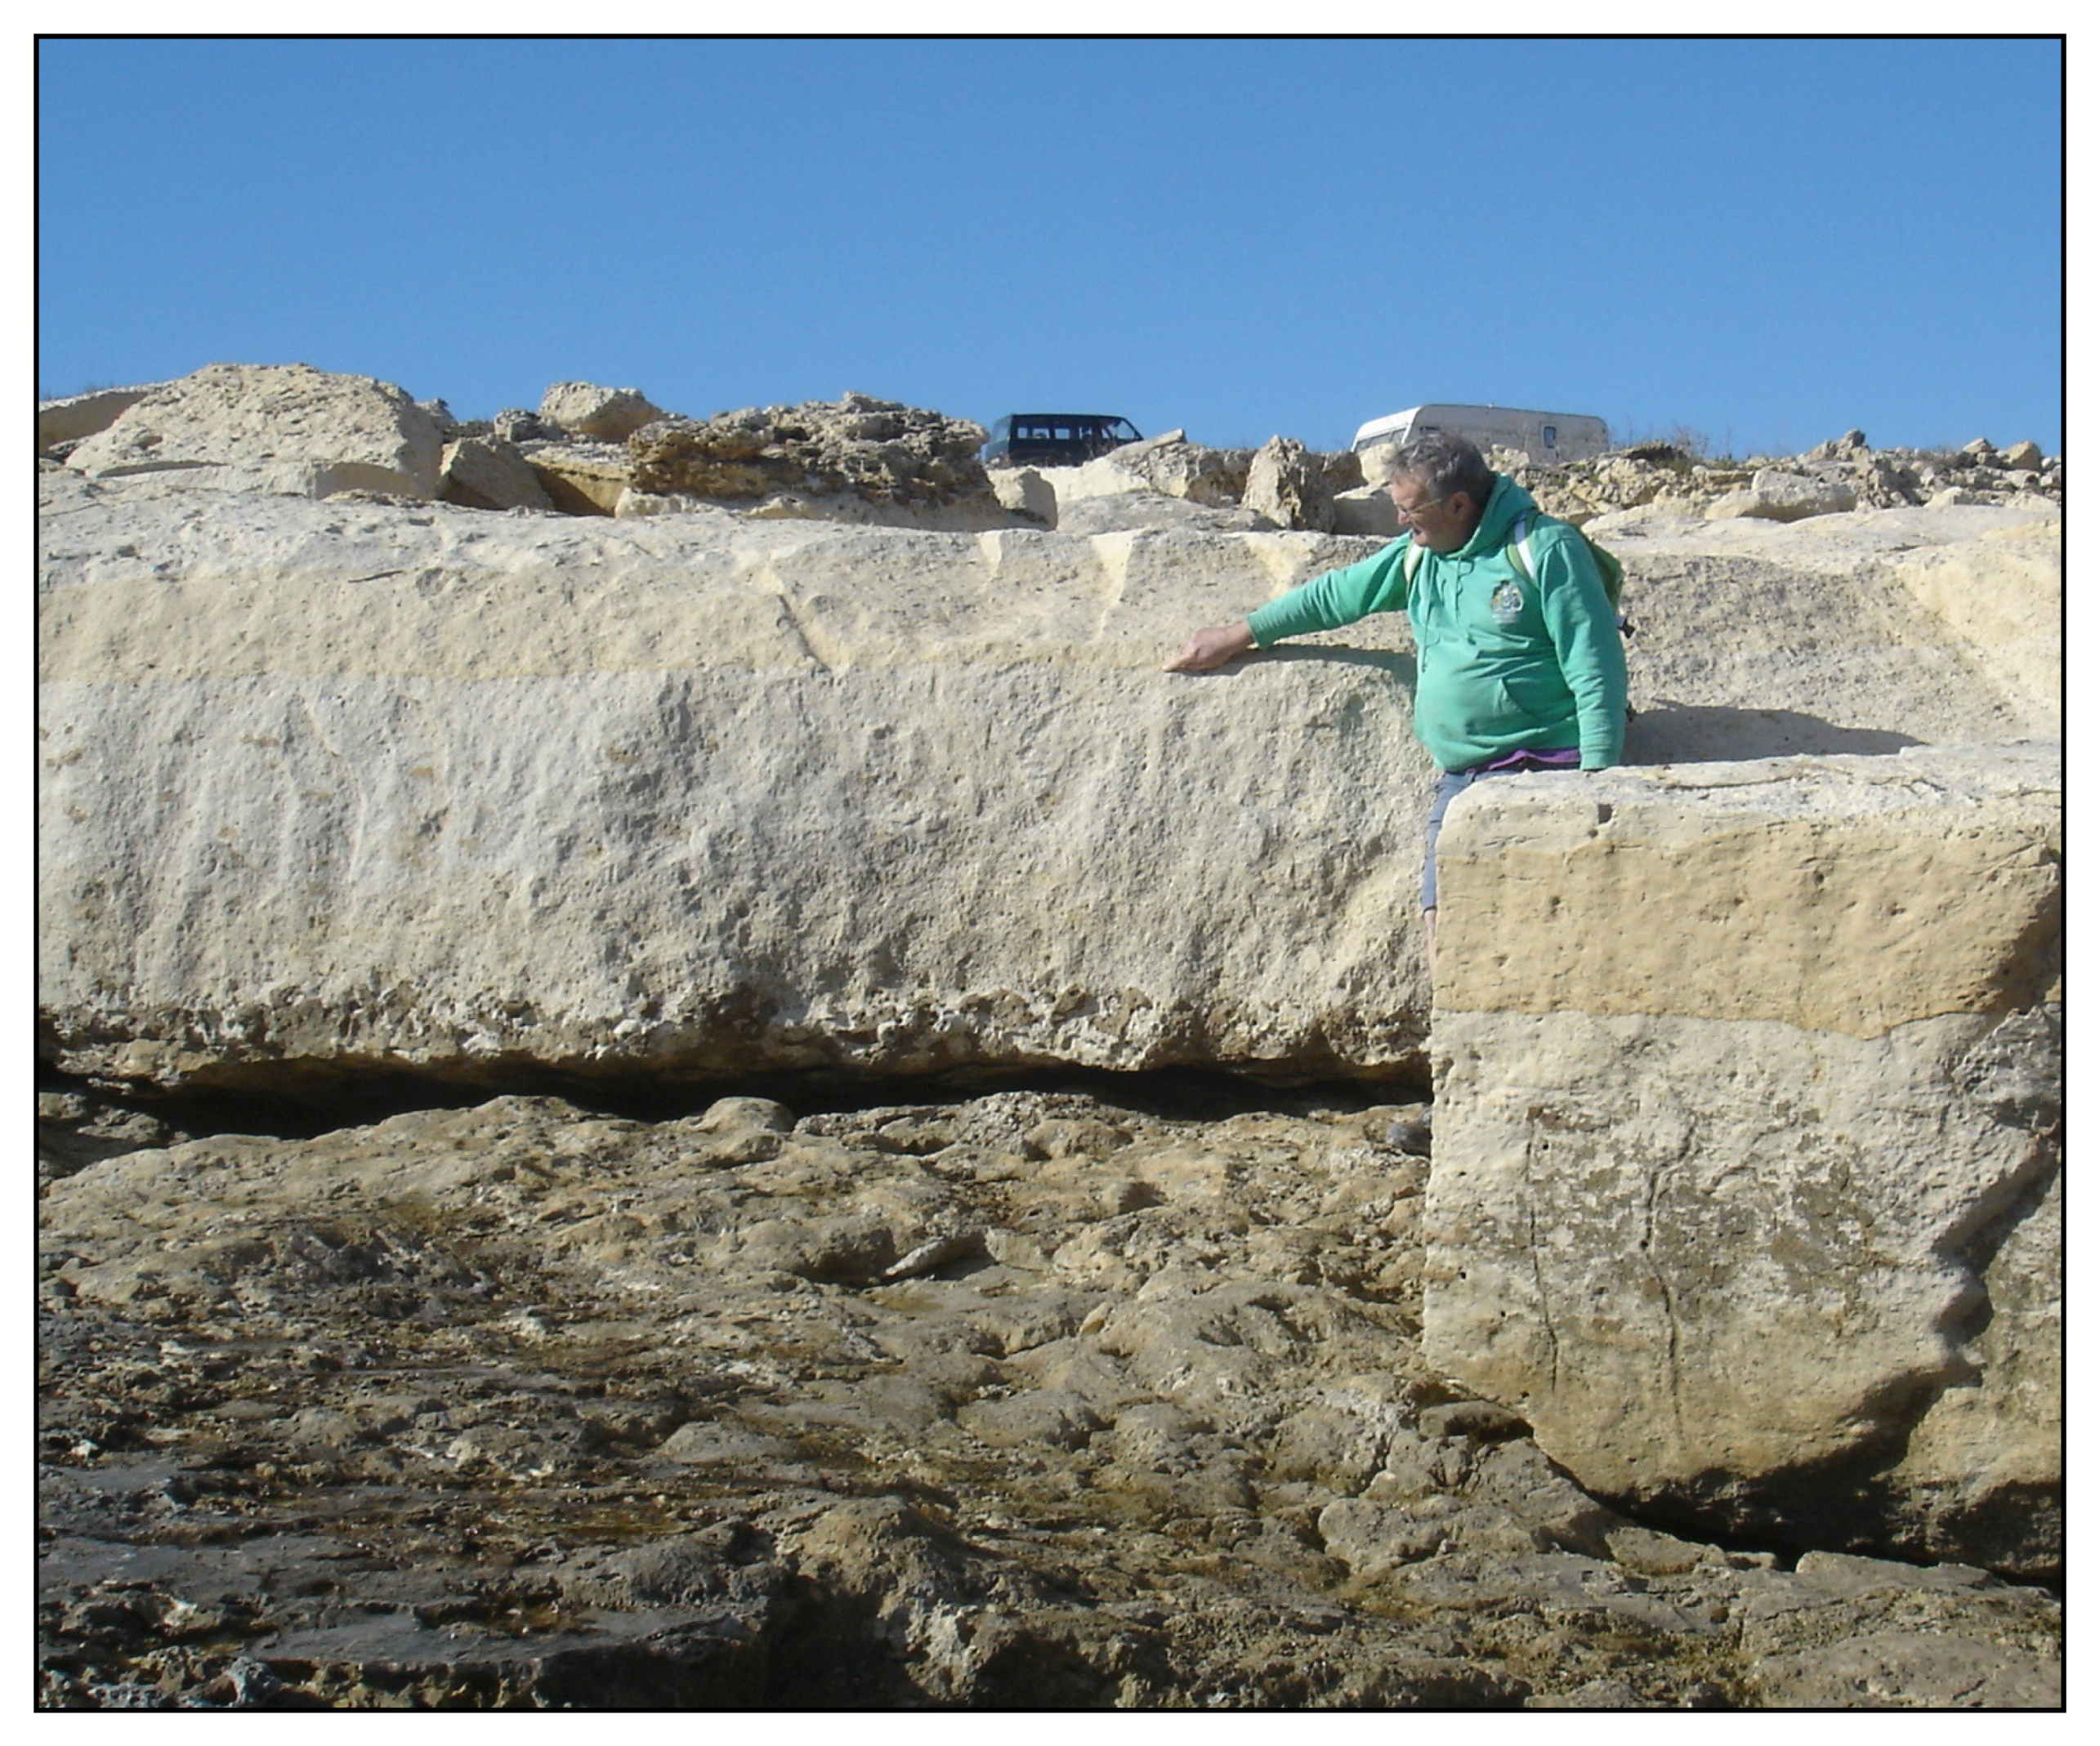
Figure 5.
Karst solutional features beneath the land surface at the boulder berm. The crevice and associated solutional pipes are filled with terra rossa soil, indicative of long-term weathering of the surface above.
Figure 5.
Karst solutional features beneath the land surface at the boulder berm. The crevice and associated solutional pipes are filled with terra rossa soil, indicative of long-term weathering of the surface above.

Figure 6.
Distribution of boulders of interest (BOI), illustrating locations of recent movers (RM), indeterminate movers (IM) and ancient movers (AM). Hill shading is based on LiDAR at 1 m pixel resolution.
Figure 6.
Distribution of boulders of interest (BOI), illustrating locations of recent movers (RM), indeterminate movers (IM) and ancient movers (AM). Hill shading is based on LiDAR at 1 m pixel resolution.
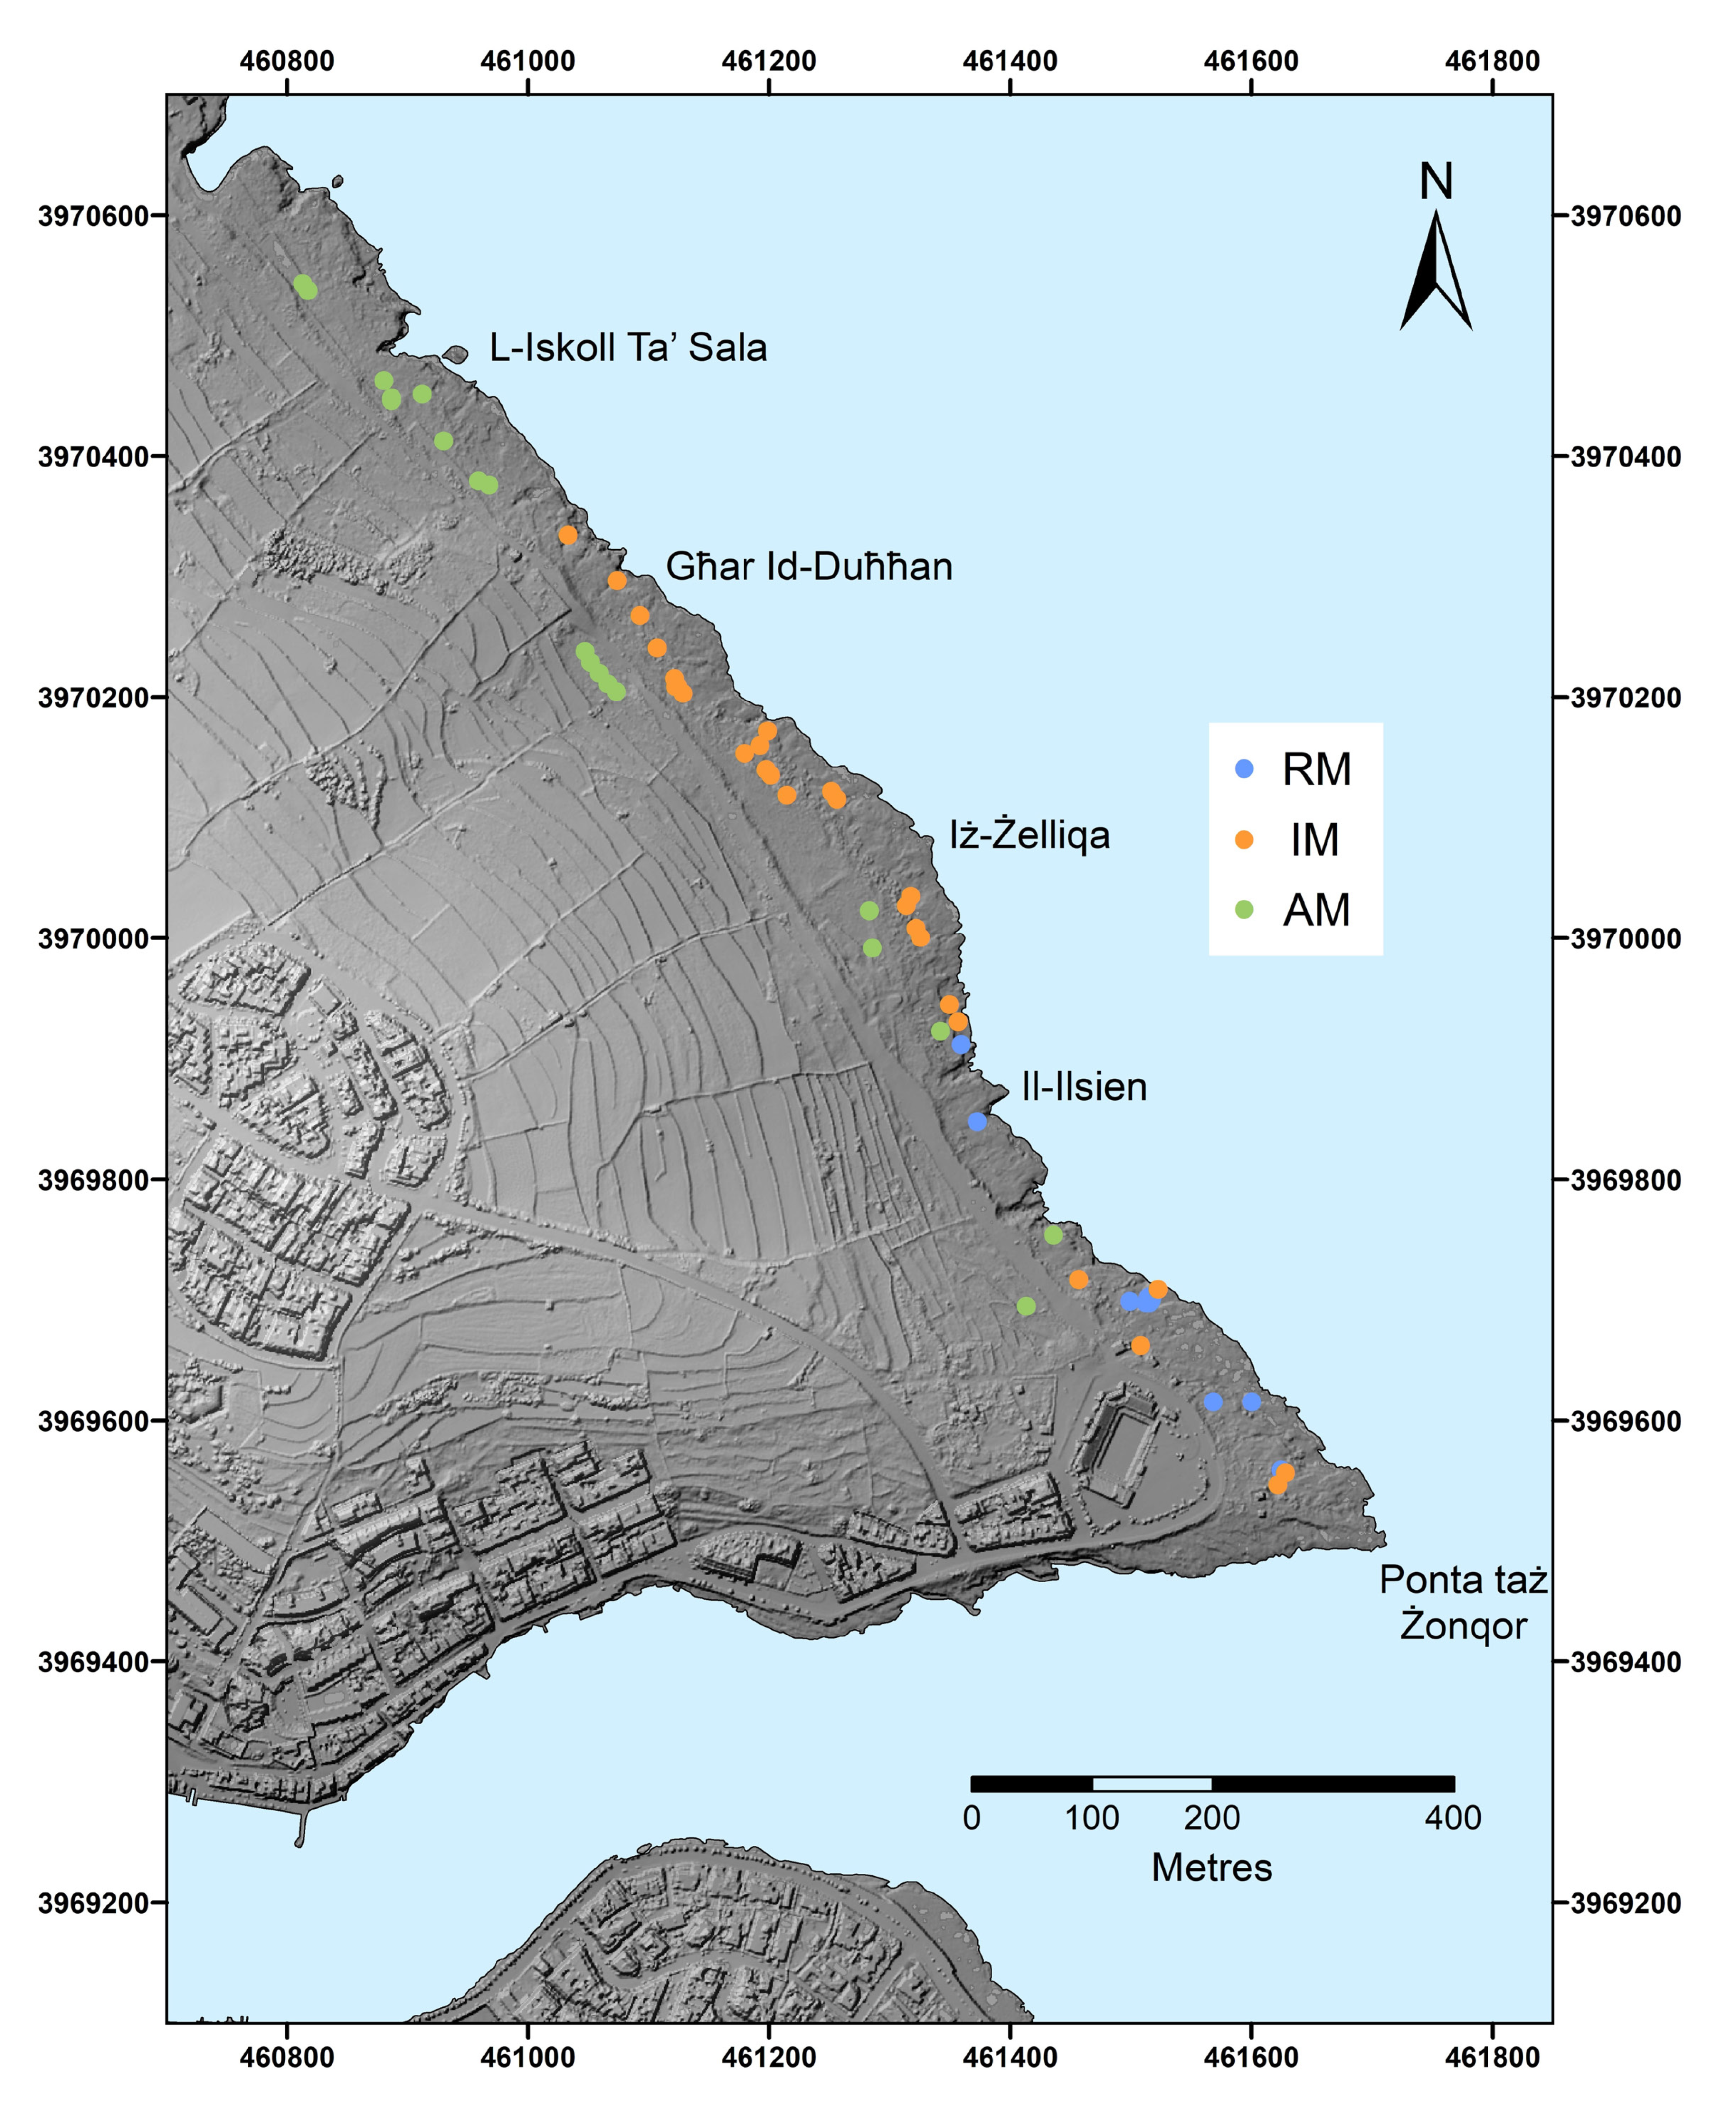
Figure 7.
Box plots illustrating intrinsic (boulder) and contextual characteristics for the boulders of interest, classified as recent movers (RM), indeterminate movers (IM) and ancient movers (AM).
Figure 7.
Box plots illustrating intrinsic (boulder) and contextual characteristics for the boulders of interest, classified as recent movers (RM), indeterminate movers (IM) and ancient movers (AM).
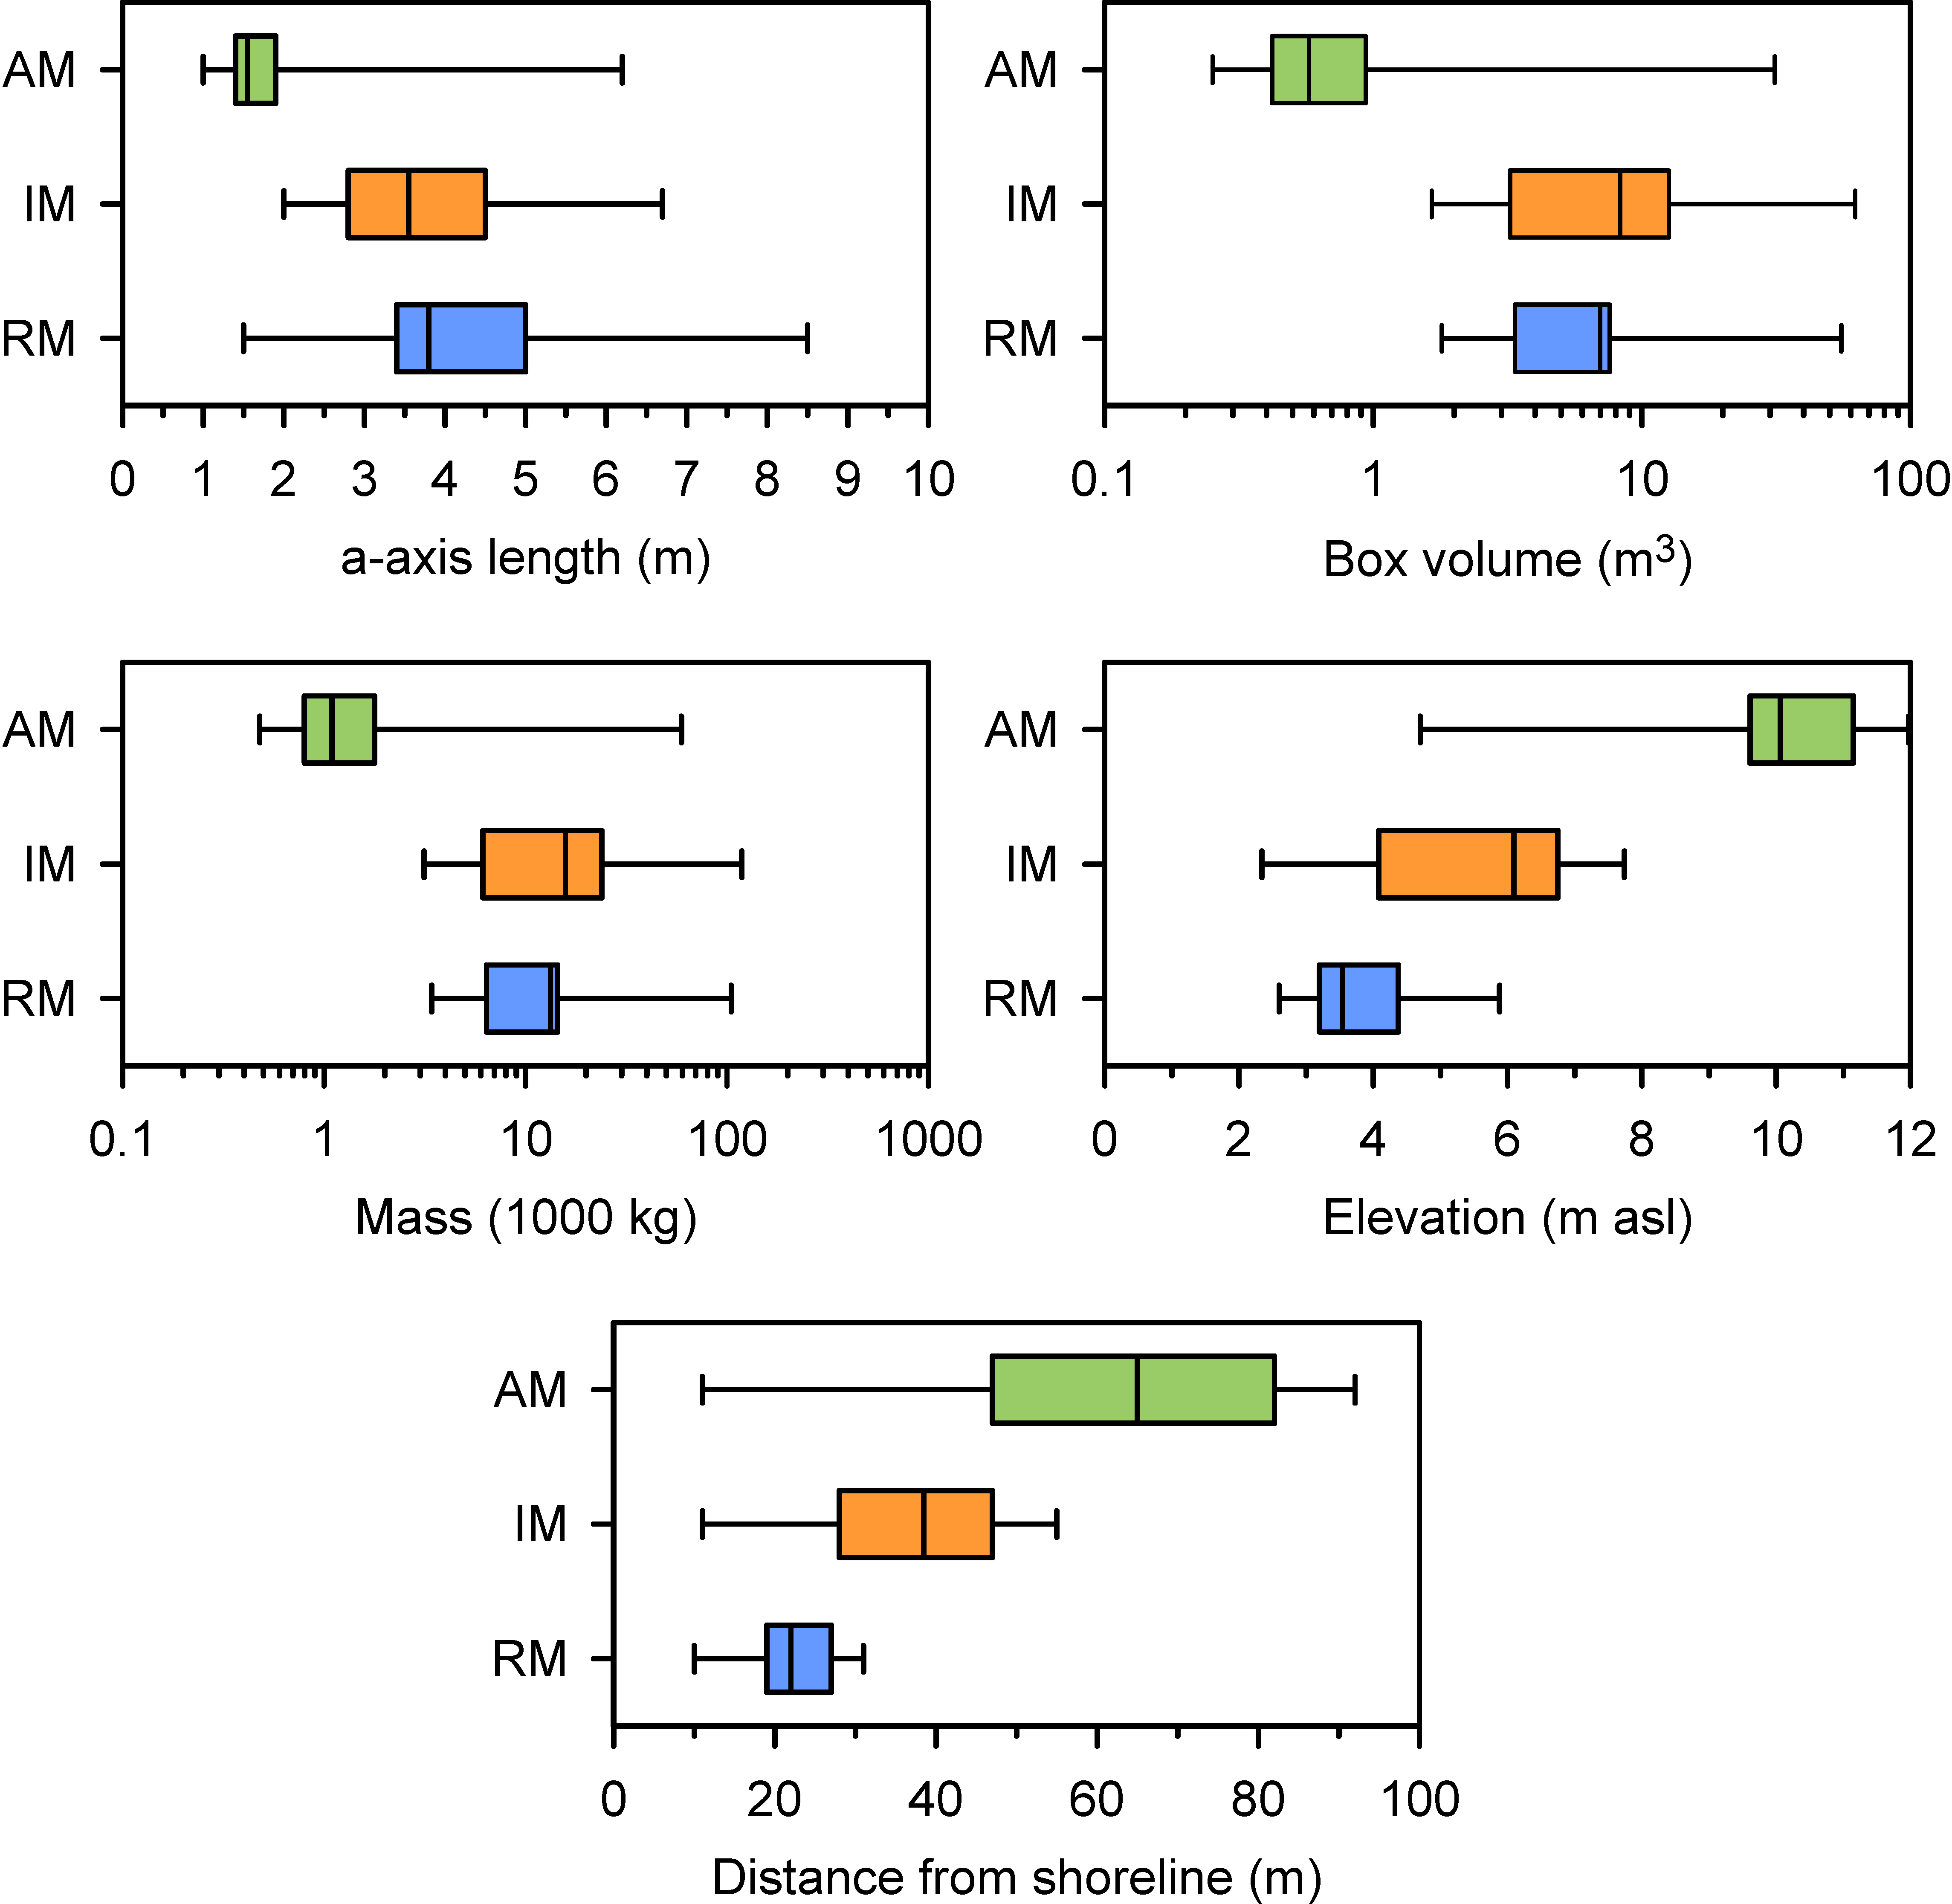
Figure 8.
Distribution of the boulders of interest, illustrating the relationships between distance from the shoreline and: (a) boulder mass, and; (b) ground elevation. The boulders of interest are separated into recent movers (RM), indeterminate movers (IM) and ancient movers (AM), enabling comparison between boulder size (a-axis shown by symbol size); prominent labelled boulders are discussed in the text.
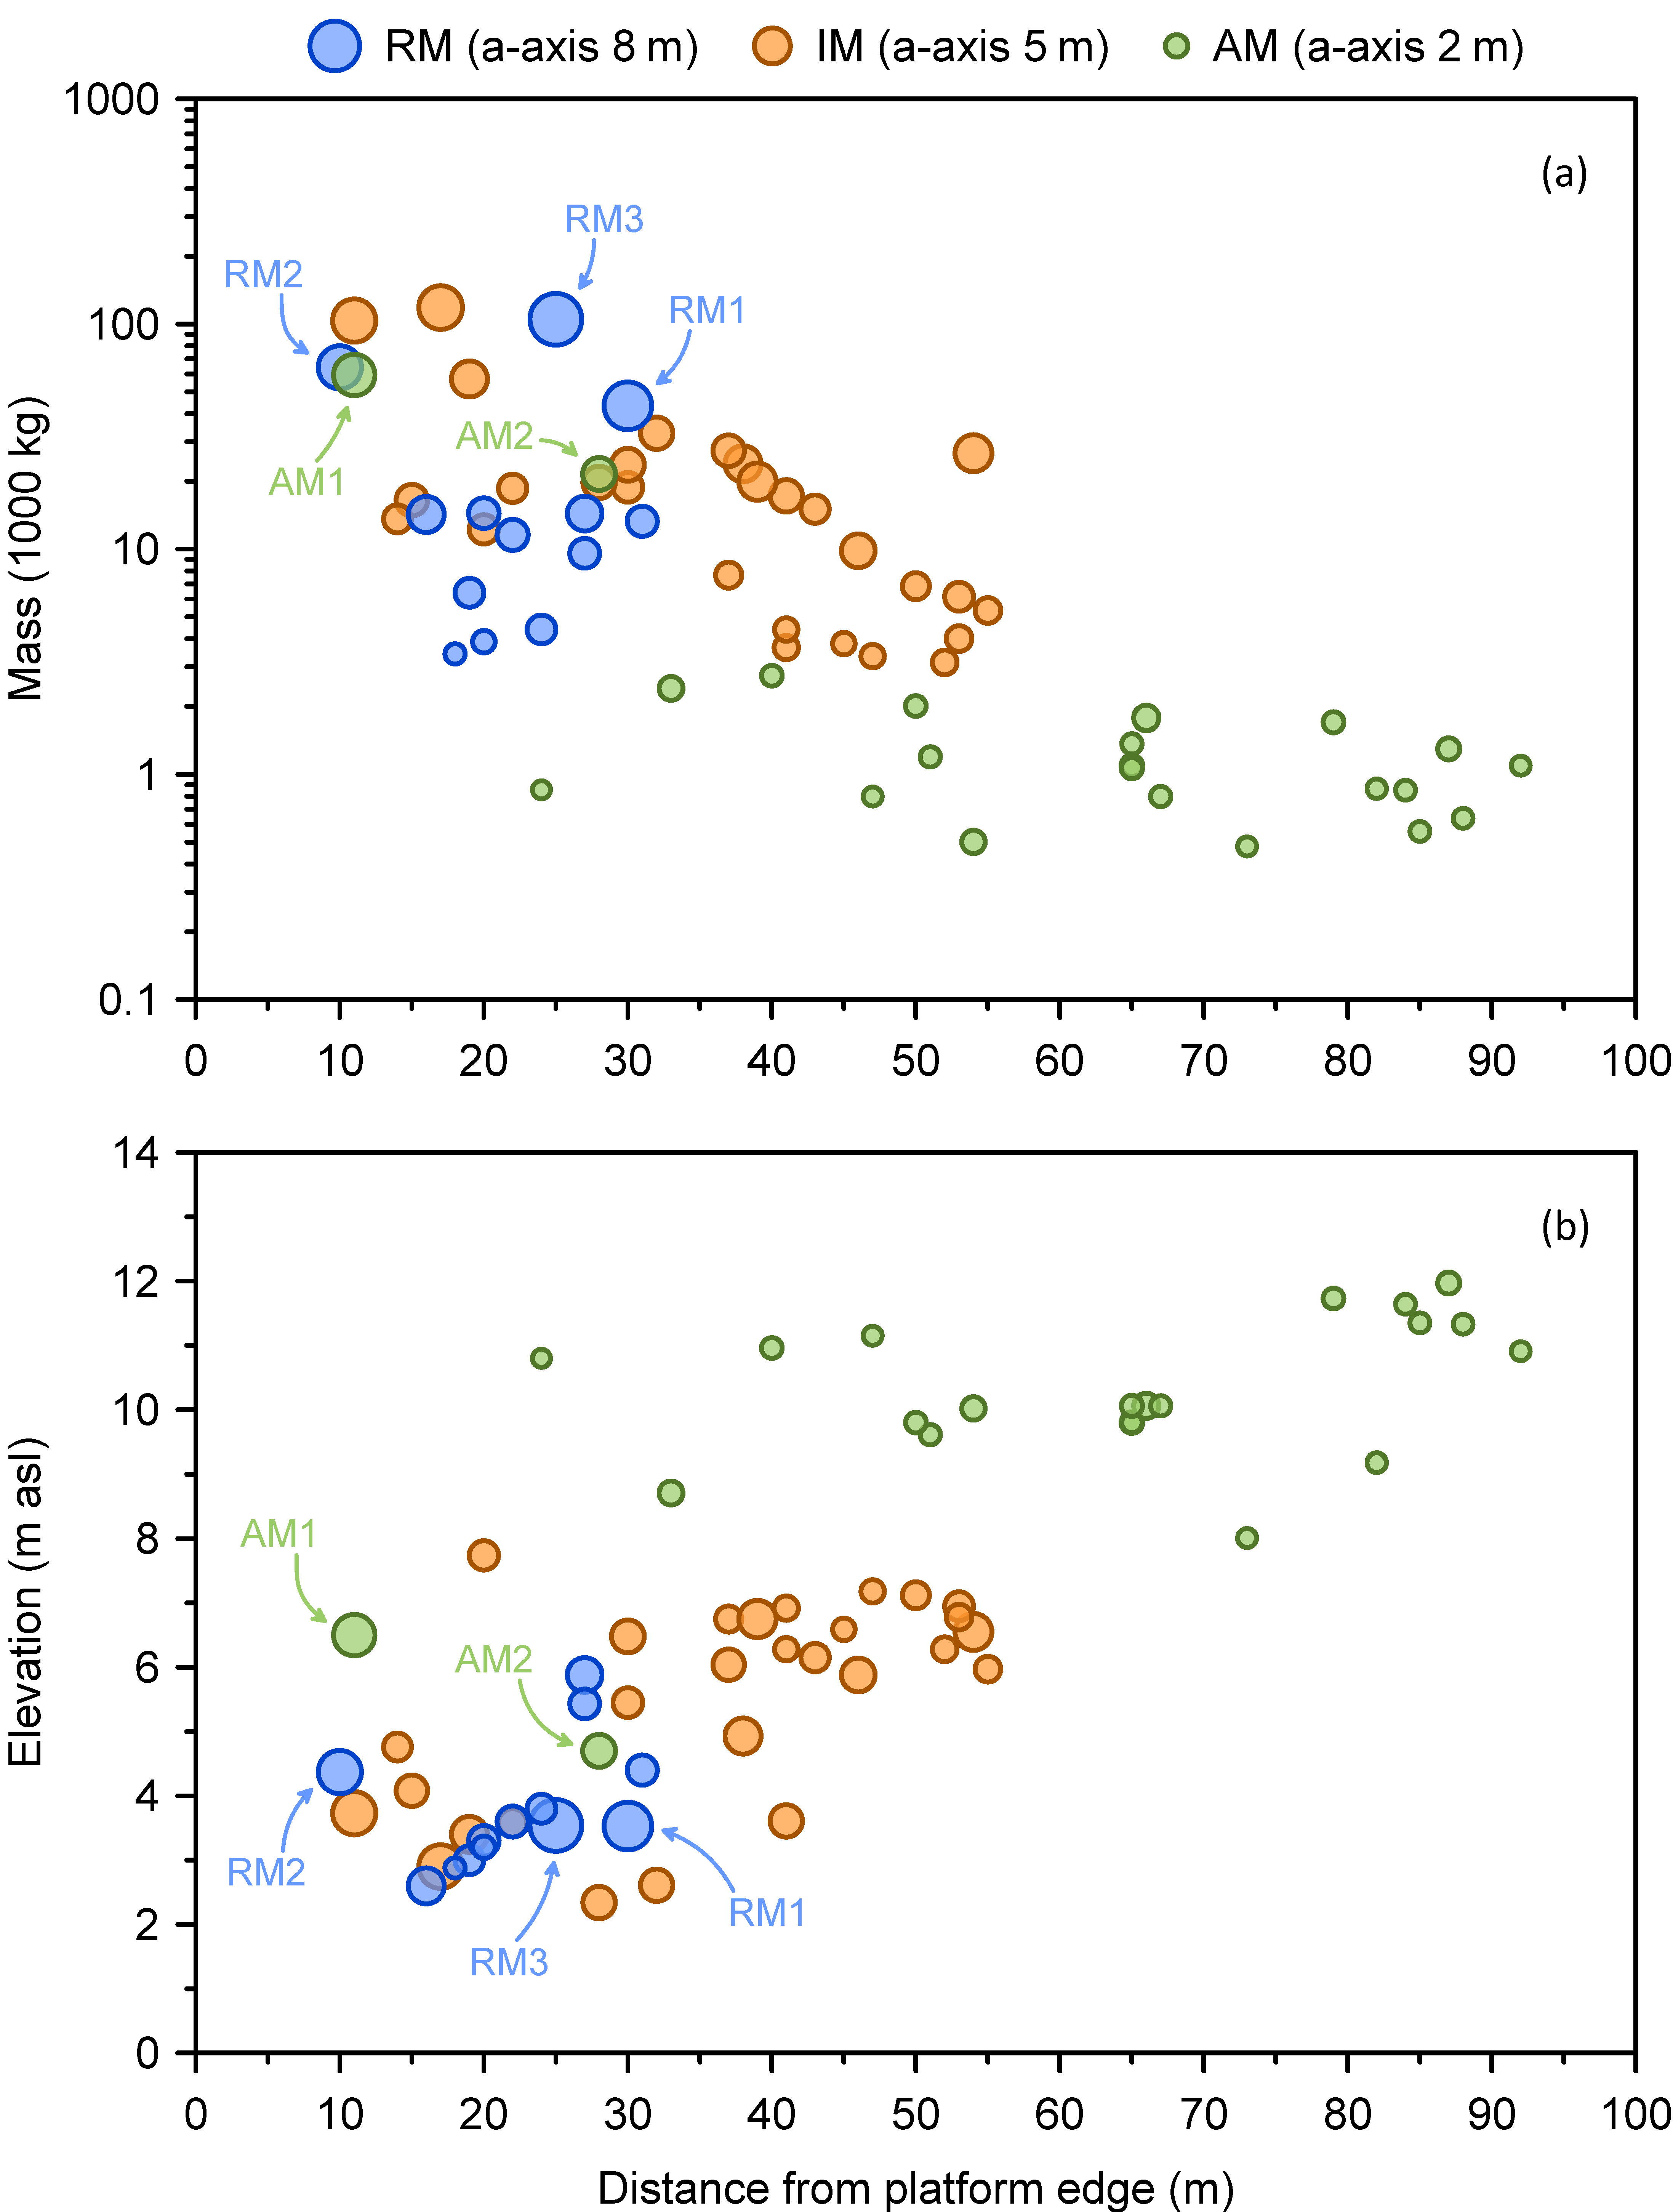
Figure 9.
Transport history of recent mover boulder RM1: (a) the distinctive socket from which boulder RM1 was detached and the slipway up which it subsequently moved. The boulder now rests at the top of the slope just out of shot to the left; (b) the transport pathway taken by the boulder, showing three changes of position in the intervals offered by the serial aerial photography.
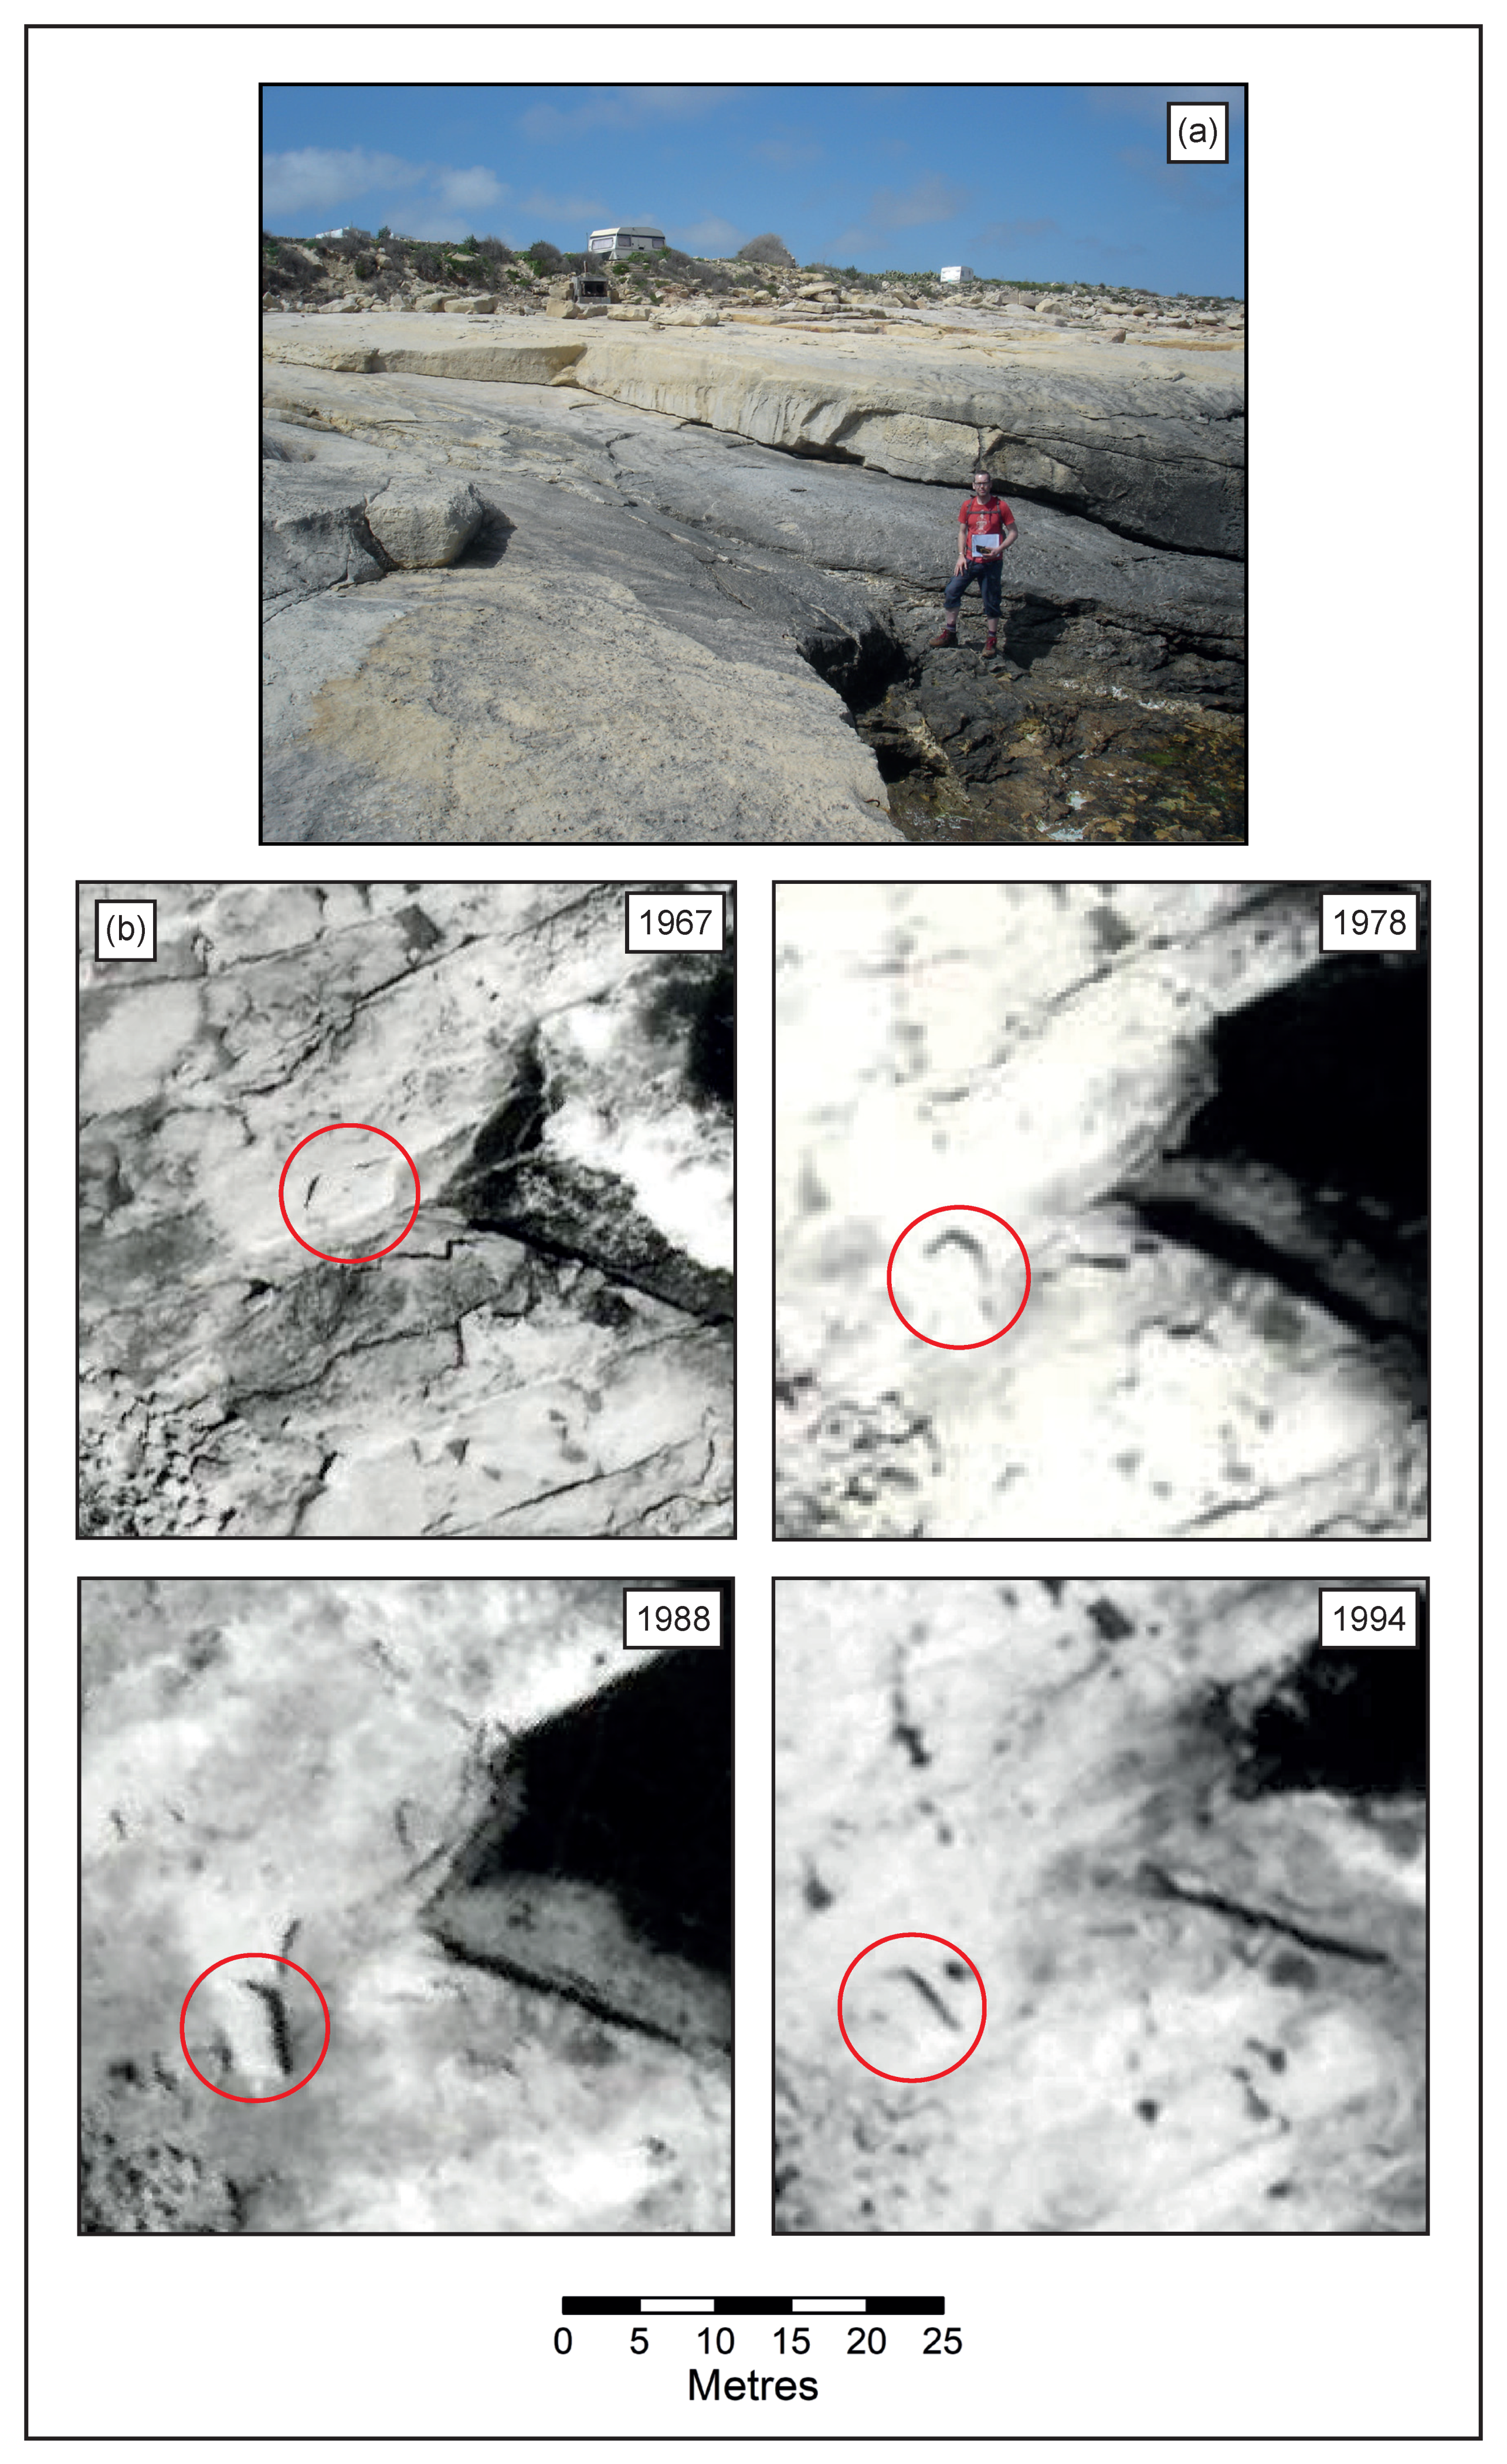
Figure 10.
Transport history of recent mover boulder RM2: (a) boulder in its current position; (b) the transport pathway taken by the boulder, showing two changes of position in the intervals offered by the serial aerial photography. Note the remnant PCB stratum on both boulder and scarp and the wave-excavated cavity at the base of the latter.
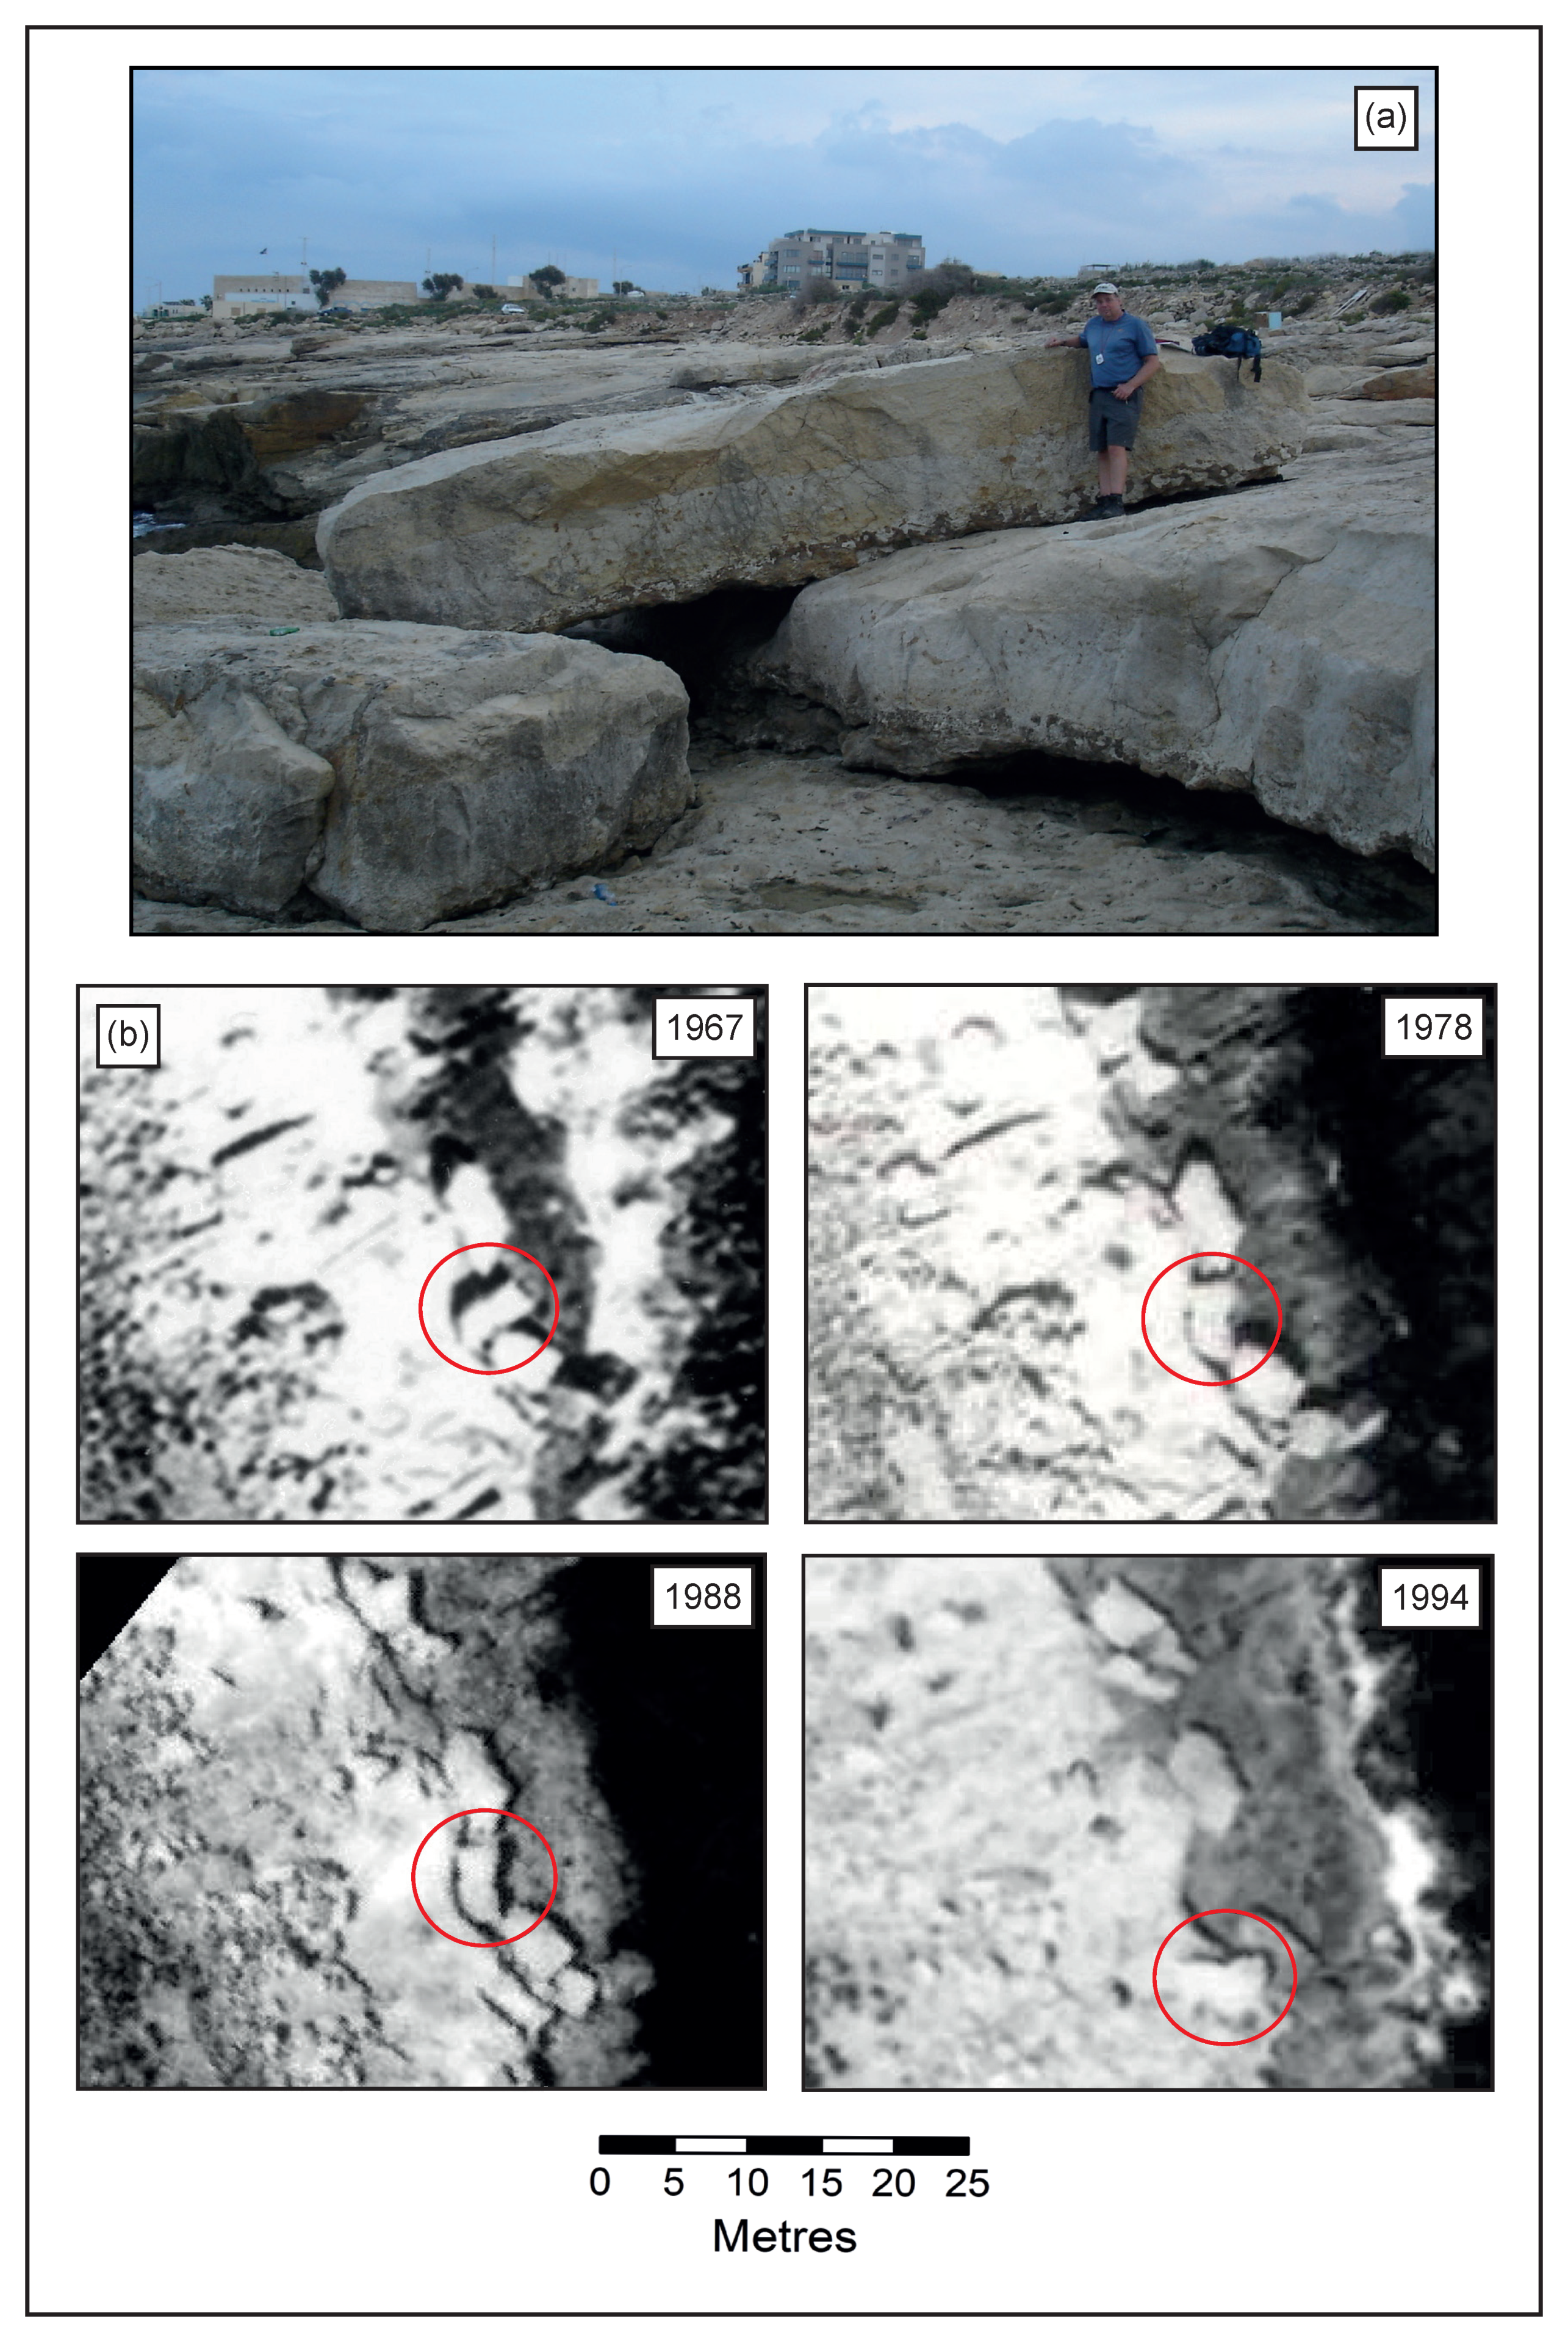
Figure 11.
Boulder deposits at an elevation of 10–12 m asl, showing landward-facing imbrication and thus indicative of a seaward direction of the flow responsible for their imbricate organization: (a) north field; (b) south field. In both cases the shoreline is to the left.
Figure 11.
Boulder deposits at an elevation of 10–12 m asl, showing landward-facing imbrication and thus indicative of a seaward direction of the flow responsible for their imbricate organization: (a) north field; (b) south field. In both cases the shoreline is to the left.
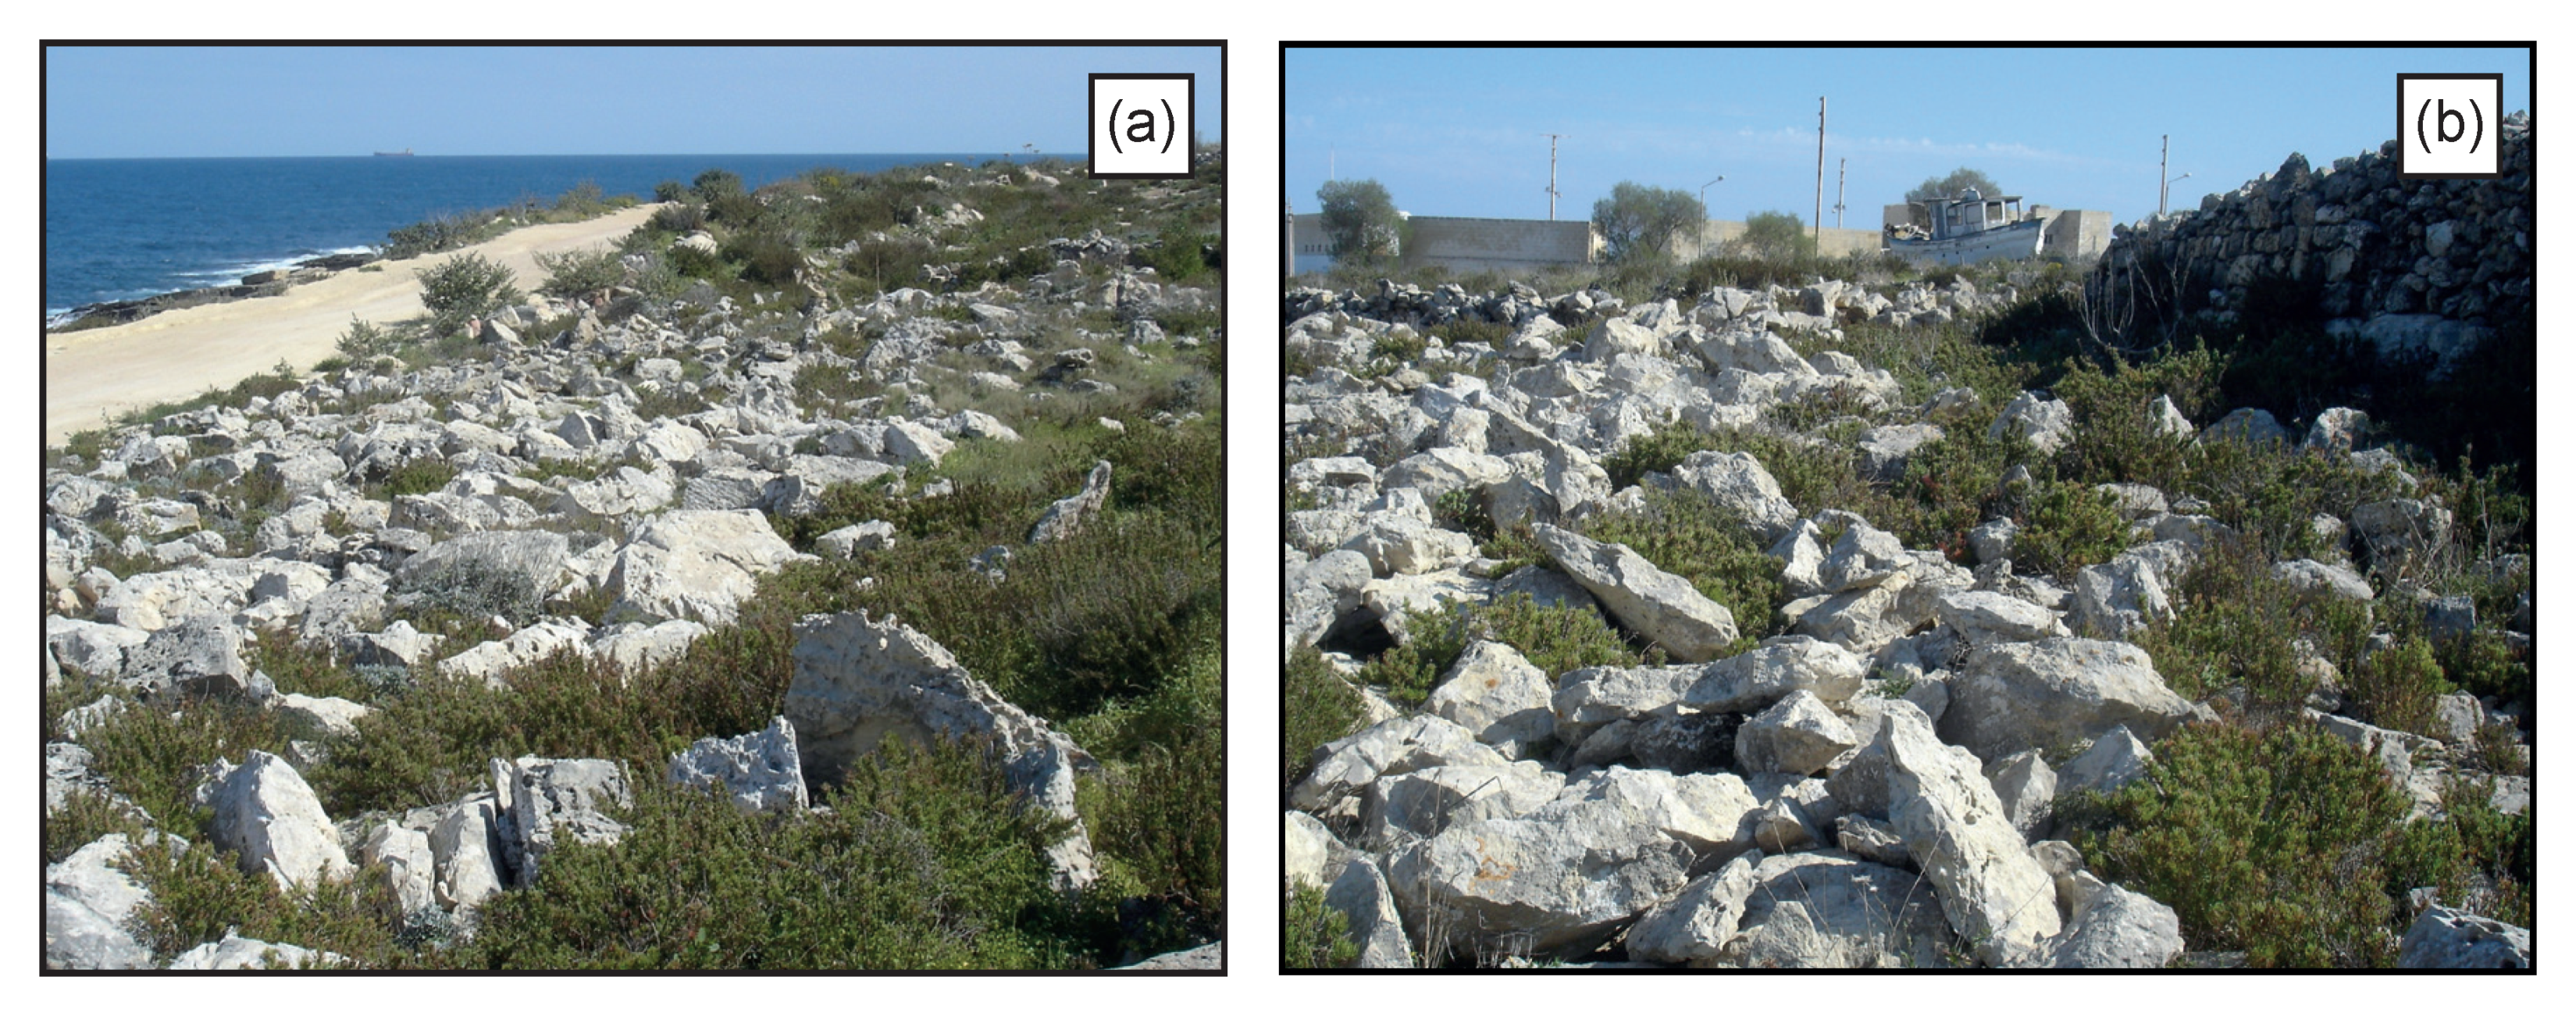
Figure 12.
Rose diagrams illustrating contrasting directions of flow responsible for the deposition of boulders at two closely placed sites. The seaward site lies on the main boulder berm and shows that imbricated boulders there were emplaced by an onshore flow. In contrast the landward site at an elevation of 10–12 m asl indicates boulders there became imbricated as a result of a flow in the downshore direction.
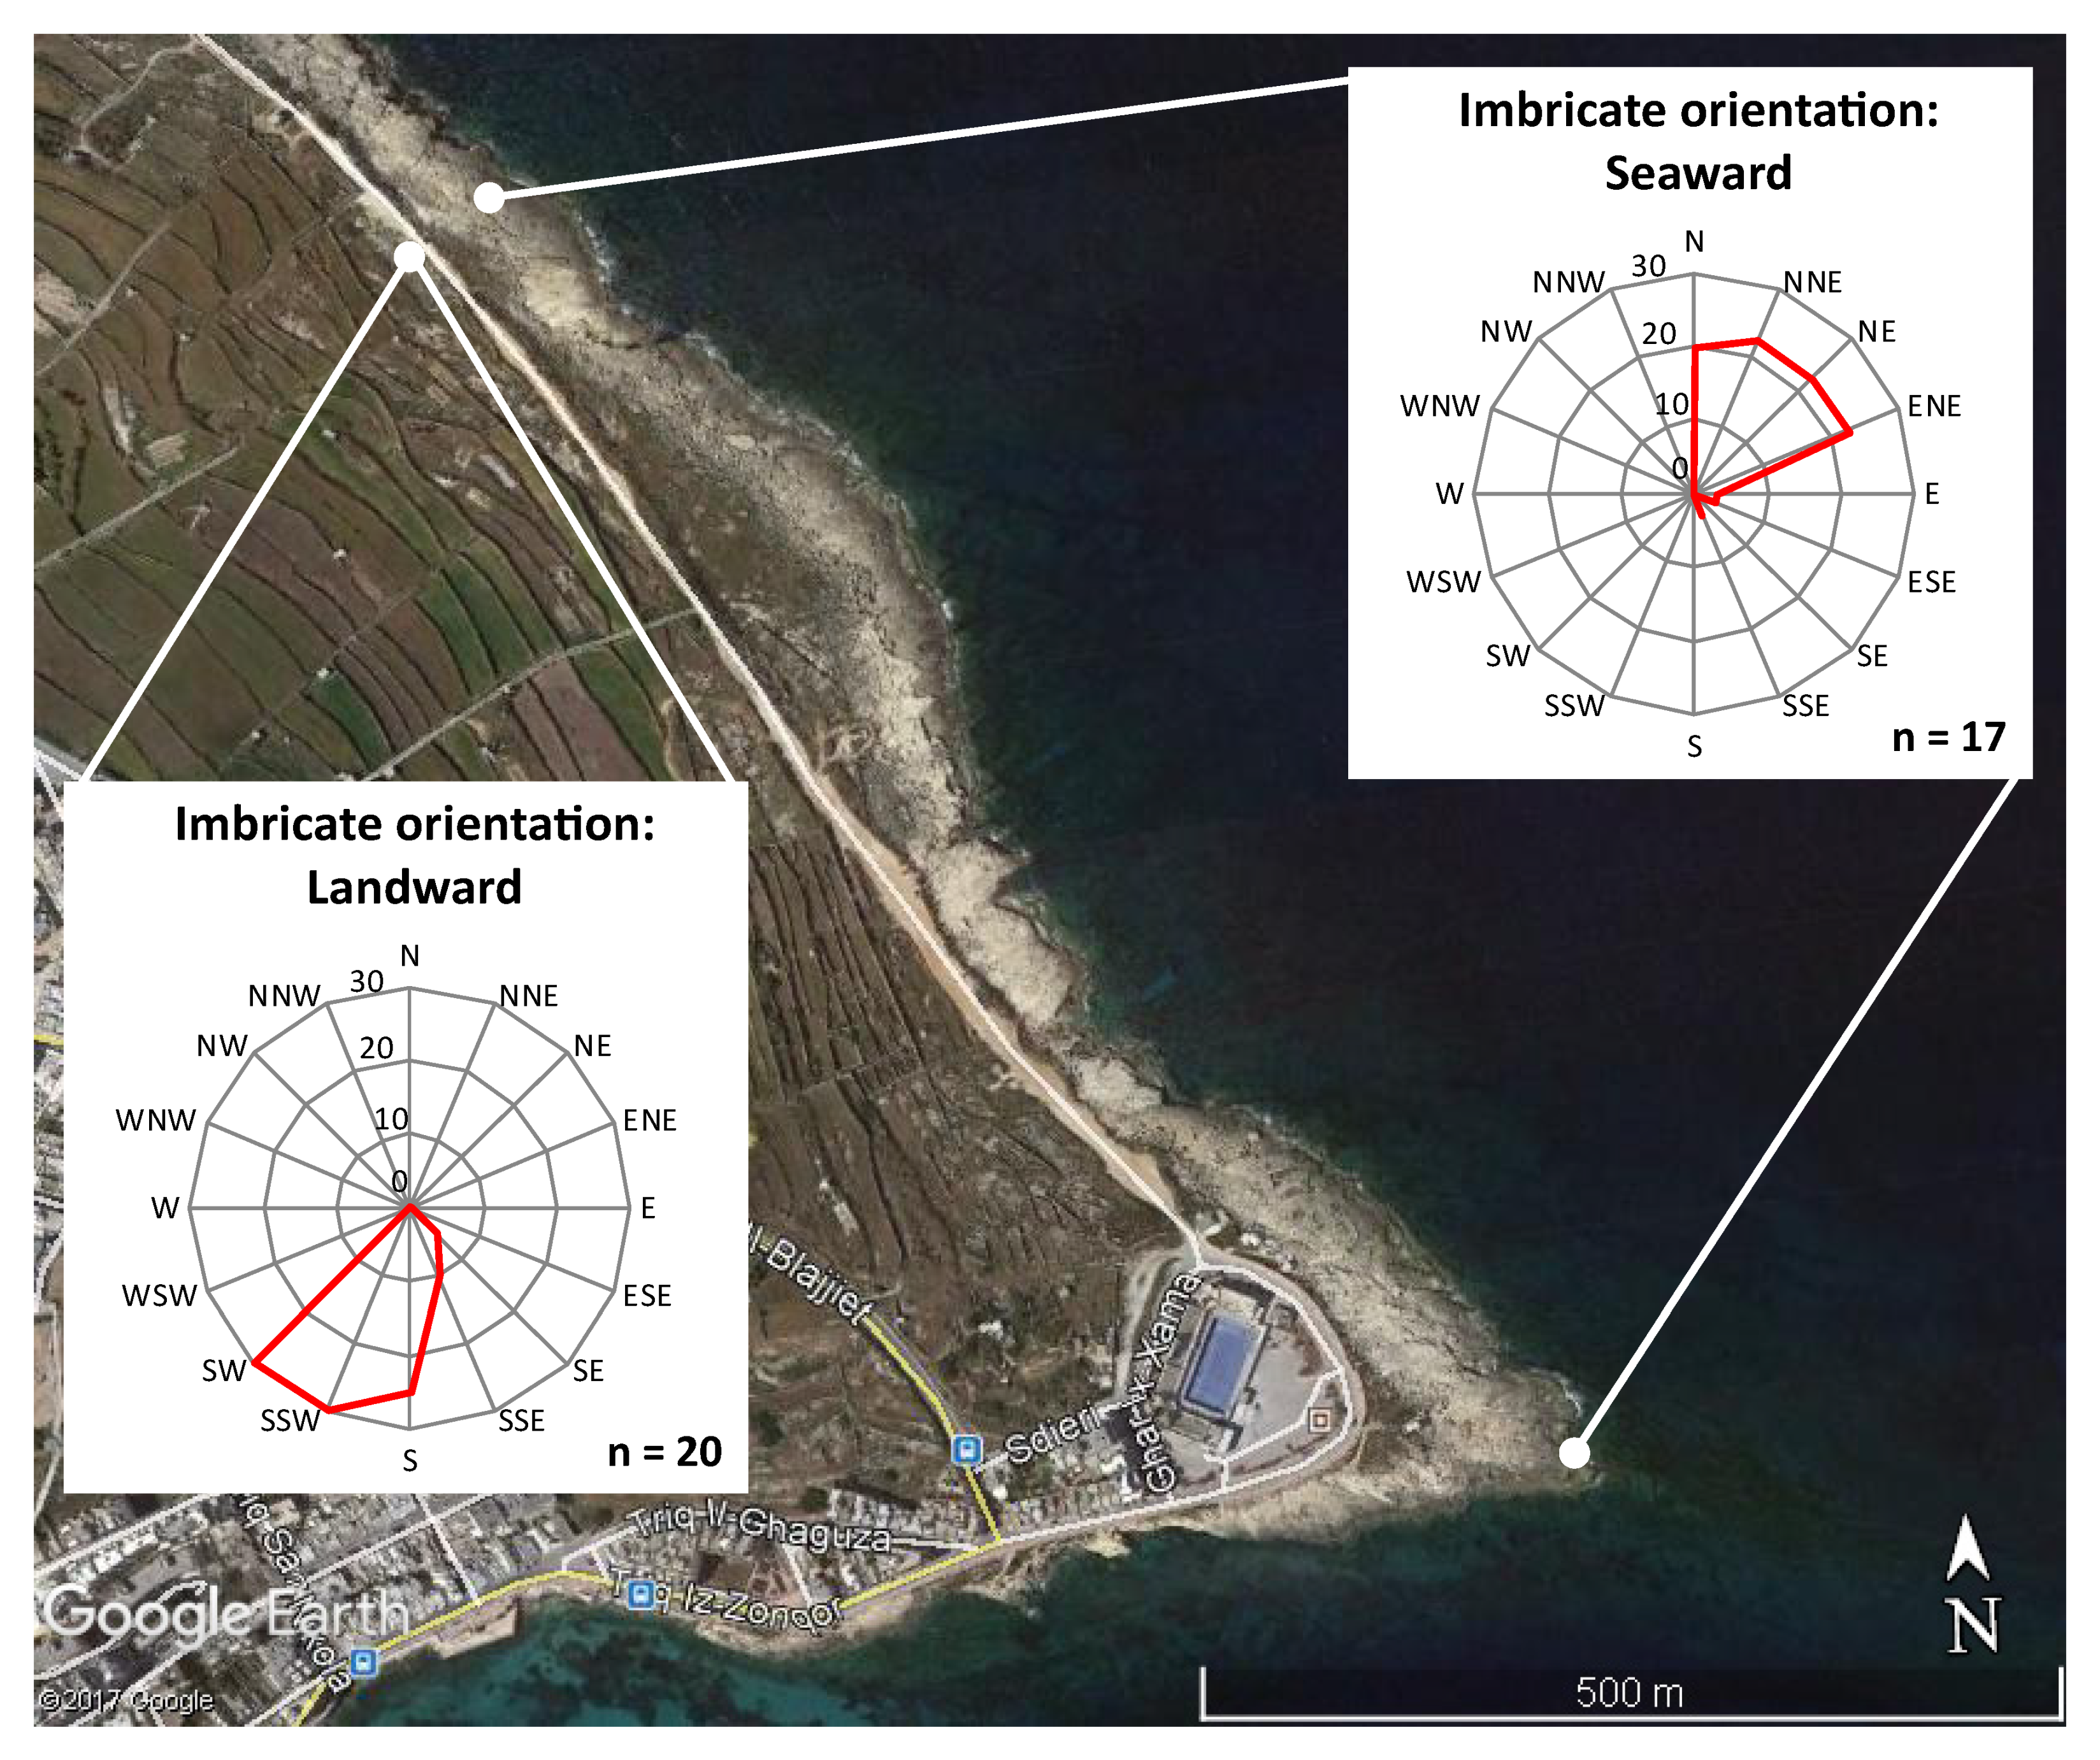
Figure 13.
Examples of significant weathering features in the high boulder fields: (a) severely weathered boulder with an indurated surface forming a carapace undercut by face weathering to a depth of 170 mm; (b) a further form of weathering in which the indurated surface of a large boulder has been widely undermined by the formation of tafoni and their lateral development (the scale object is 70 mm in length).
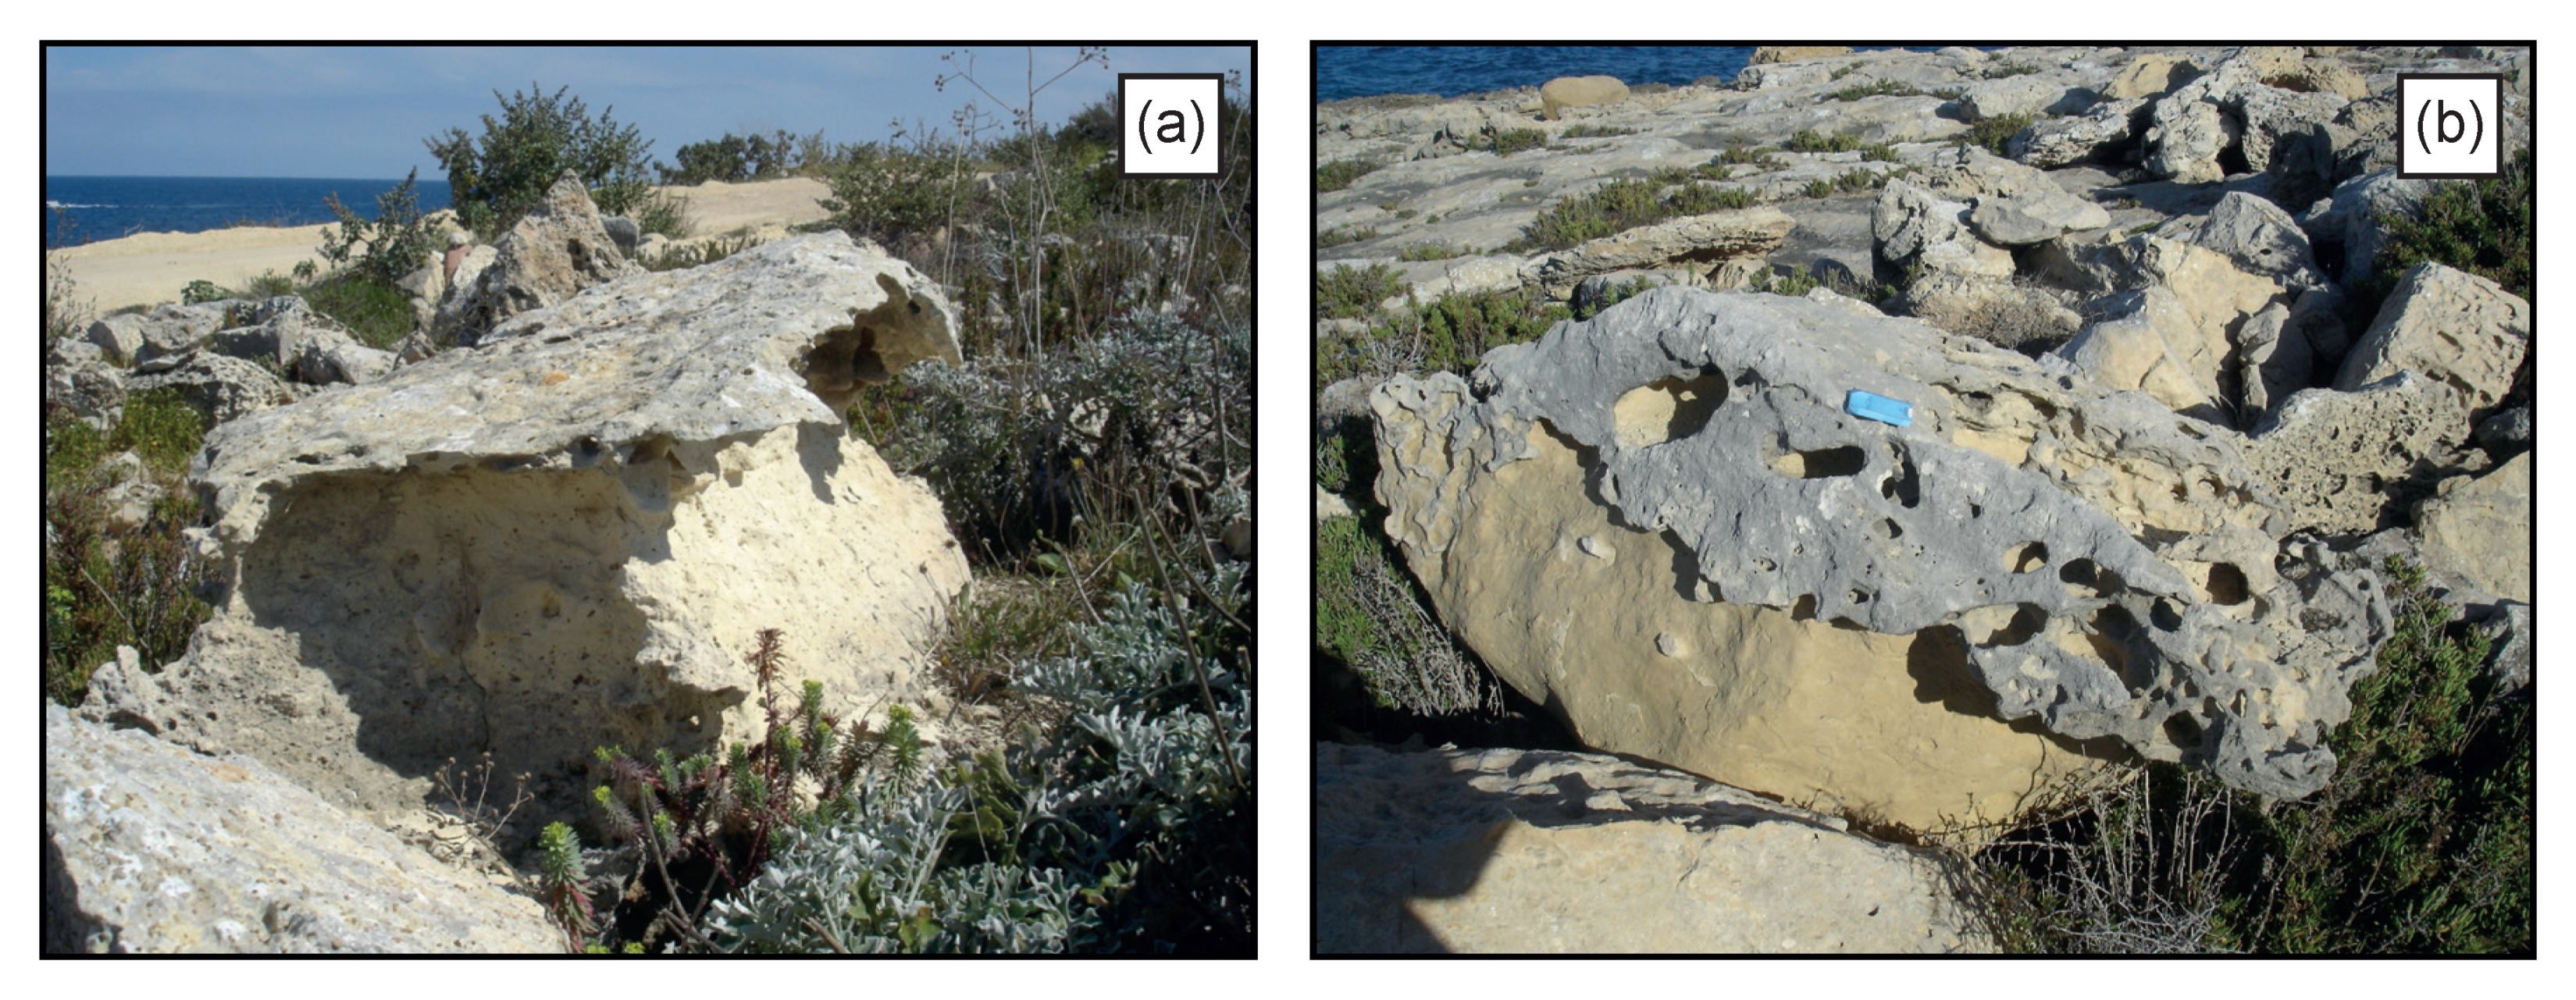
Figure 14.
Inverted boulder AM1 that has pivoted over the LGL scarp: (a) the composite LGL/PCB boulder over 6 m long, resting atop the LGL scarp at an elevation of 6.5 m. Its inverted attitude is evidenced by the inversion of the two stratigraphic units; (b) this lateral view highlights the morphological aspects, which defines the basal shelf of the flipped boulder and the receding scarp on its right-hand margin. These forms are identifiable also on the clifftop platform to the right. The similarity of morphologies of boulder and platform facilitates the interpretation that it originated parallel to the cliffline, with the recessed mini scarp parallel to the shoreline.
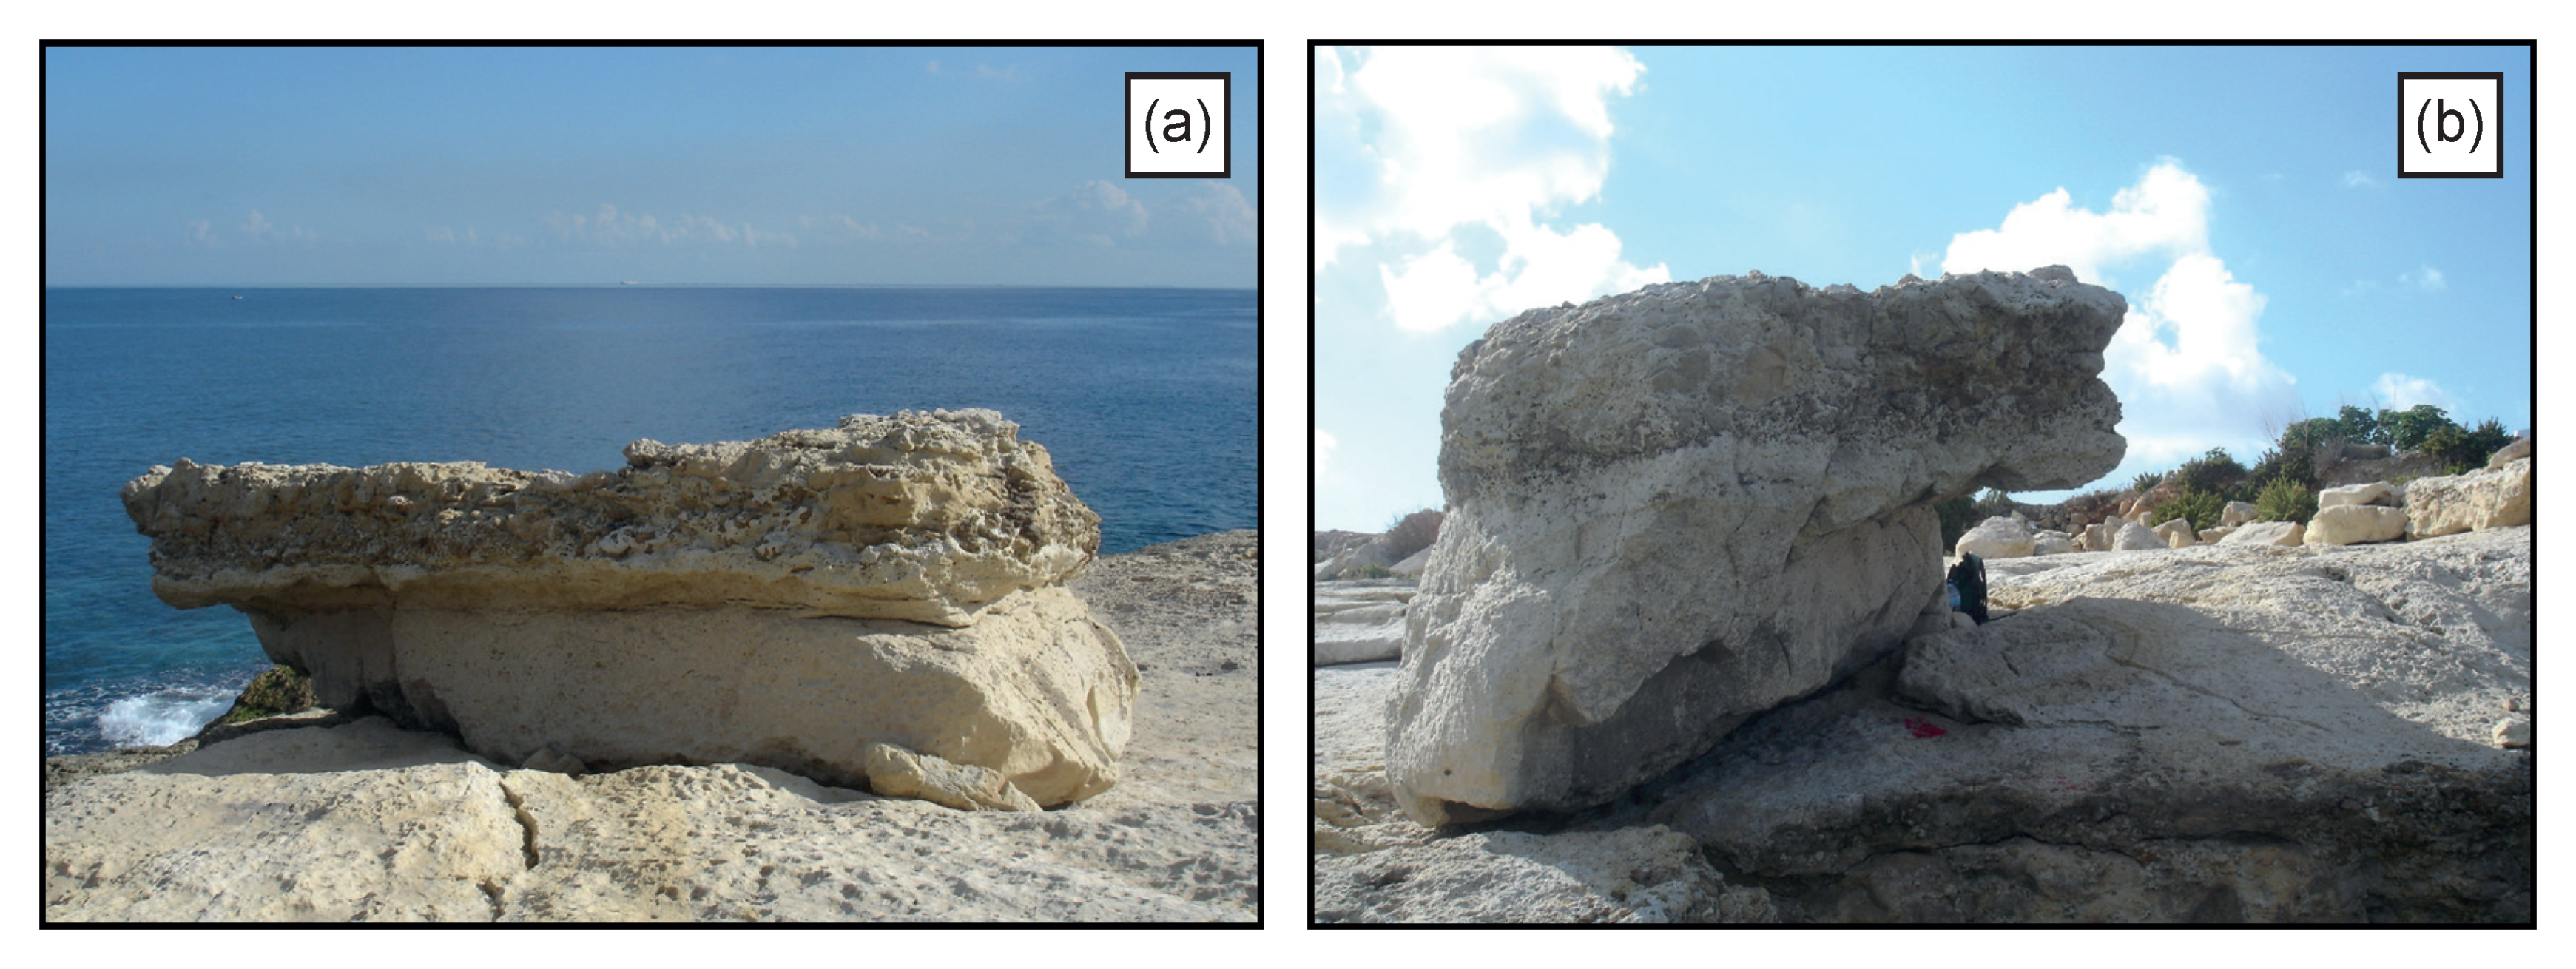
Figure 15.
Inverted boulder AM2 that has pivoted over the LGL scarp and then slid up the scarp-top ramp to its current resting place. The boulder reveals on its underside an upturned shelf backed by a mini scarp.
Figure 15.
Inverted boulder AM2 that has pivoted over the LGL scarp and then slid up the scarp-top ramp to its current resting place. The boulder reveals on its underside an upturned shelf backed by a mini scarp.
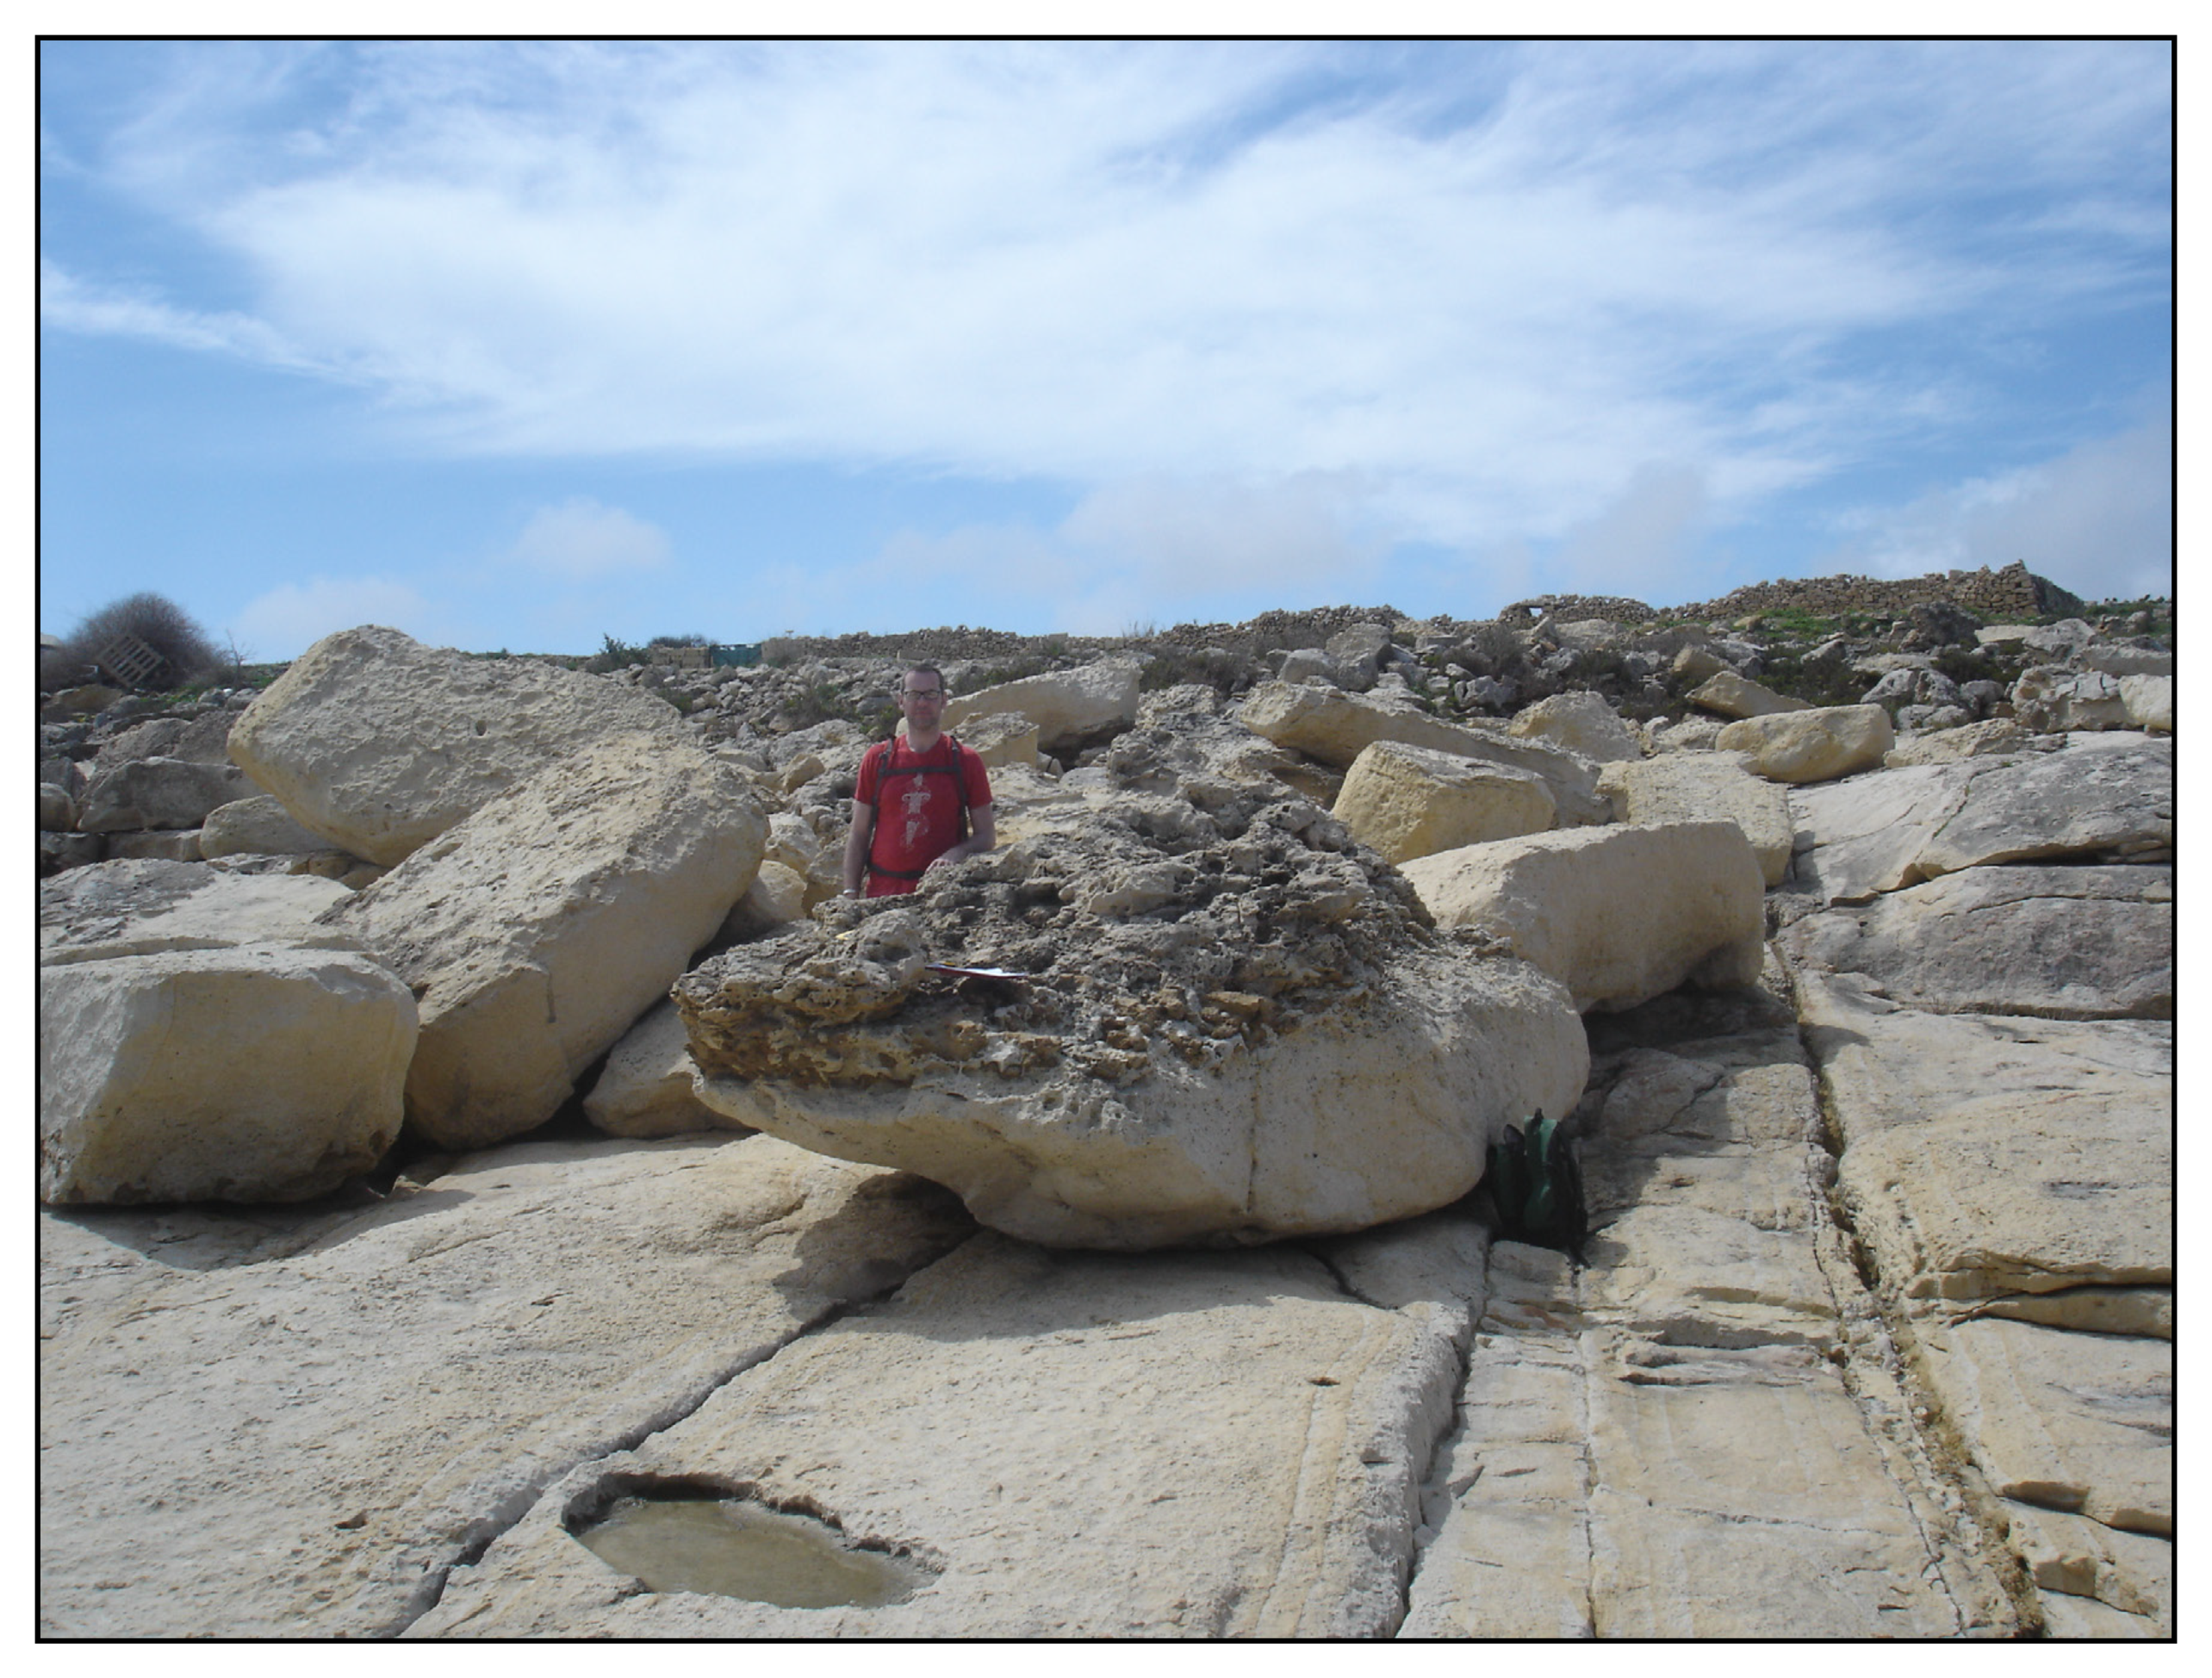
Figure 16.
Box plots illustrating the minimum velocities (after [19]) required to emplace boulders at their inland positions by: (a) sliding (Equations (1a) and (1b)); (b) rolling (Equations (2a) and (2b)), and; (c) lifting/saltating (Equation (3)). The boulders of interest are separated into recent movers (RM), indeterminate movers (IM) and ancient movers (AM), with movement differentiated between flow-normal (left) and flow-parallel (right) orientations of the boulders.
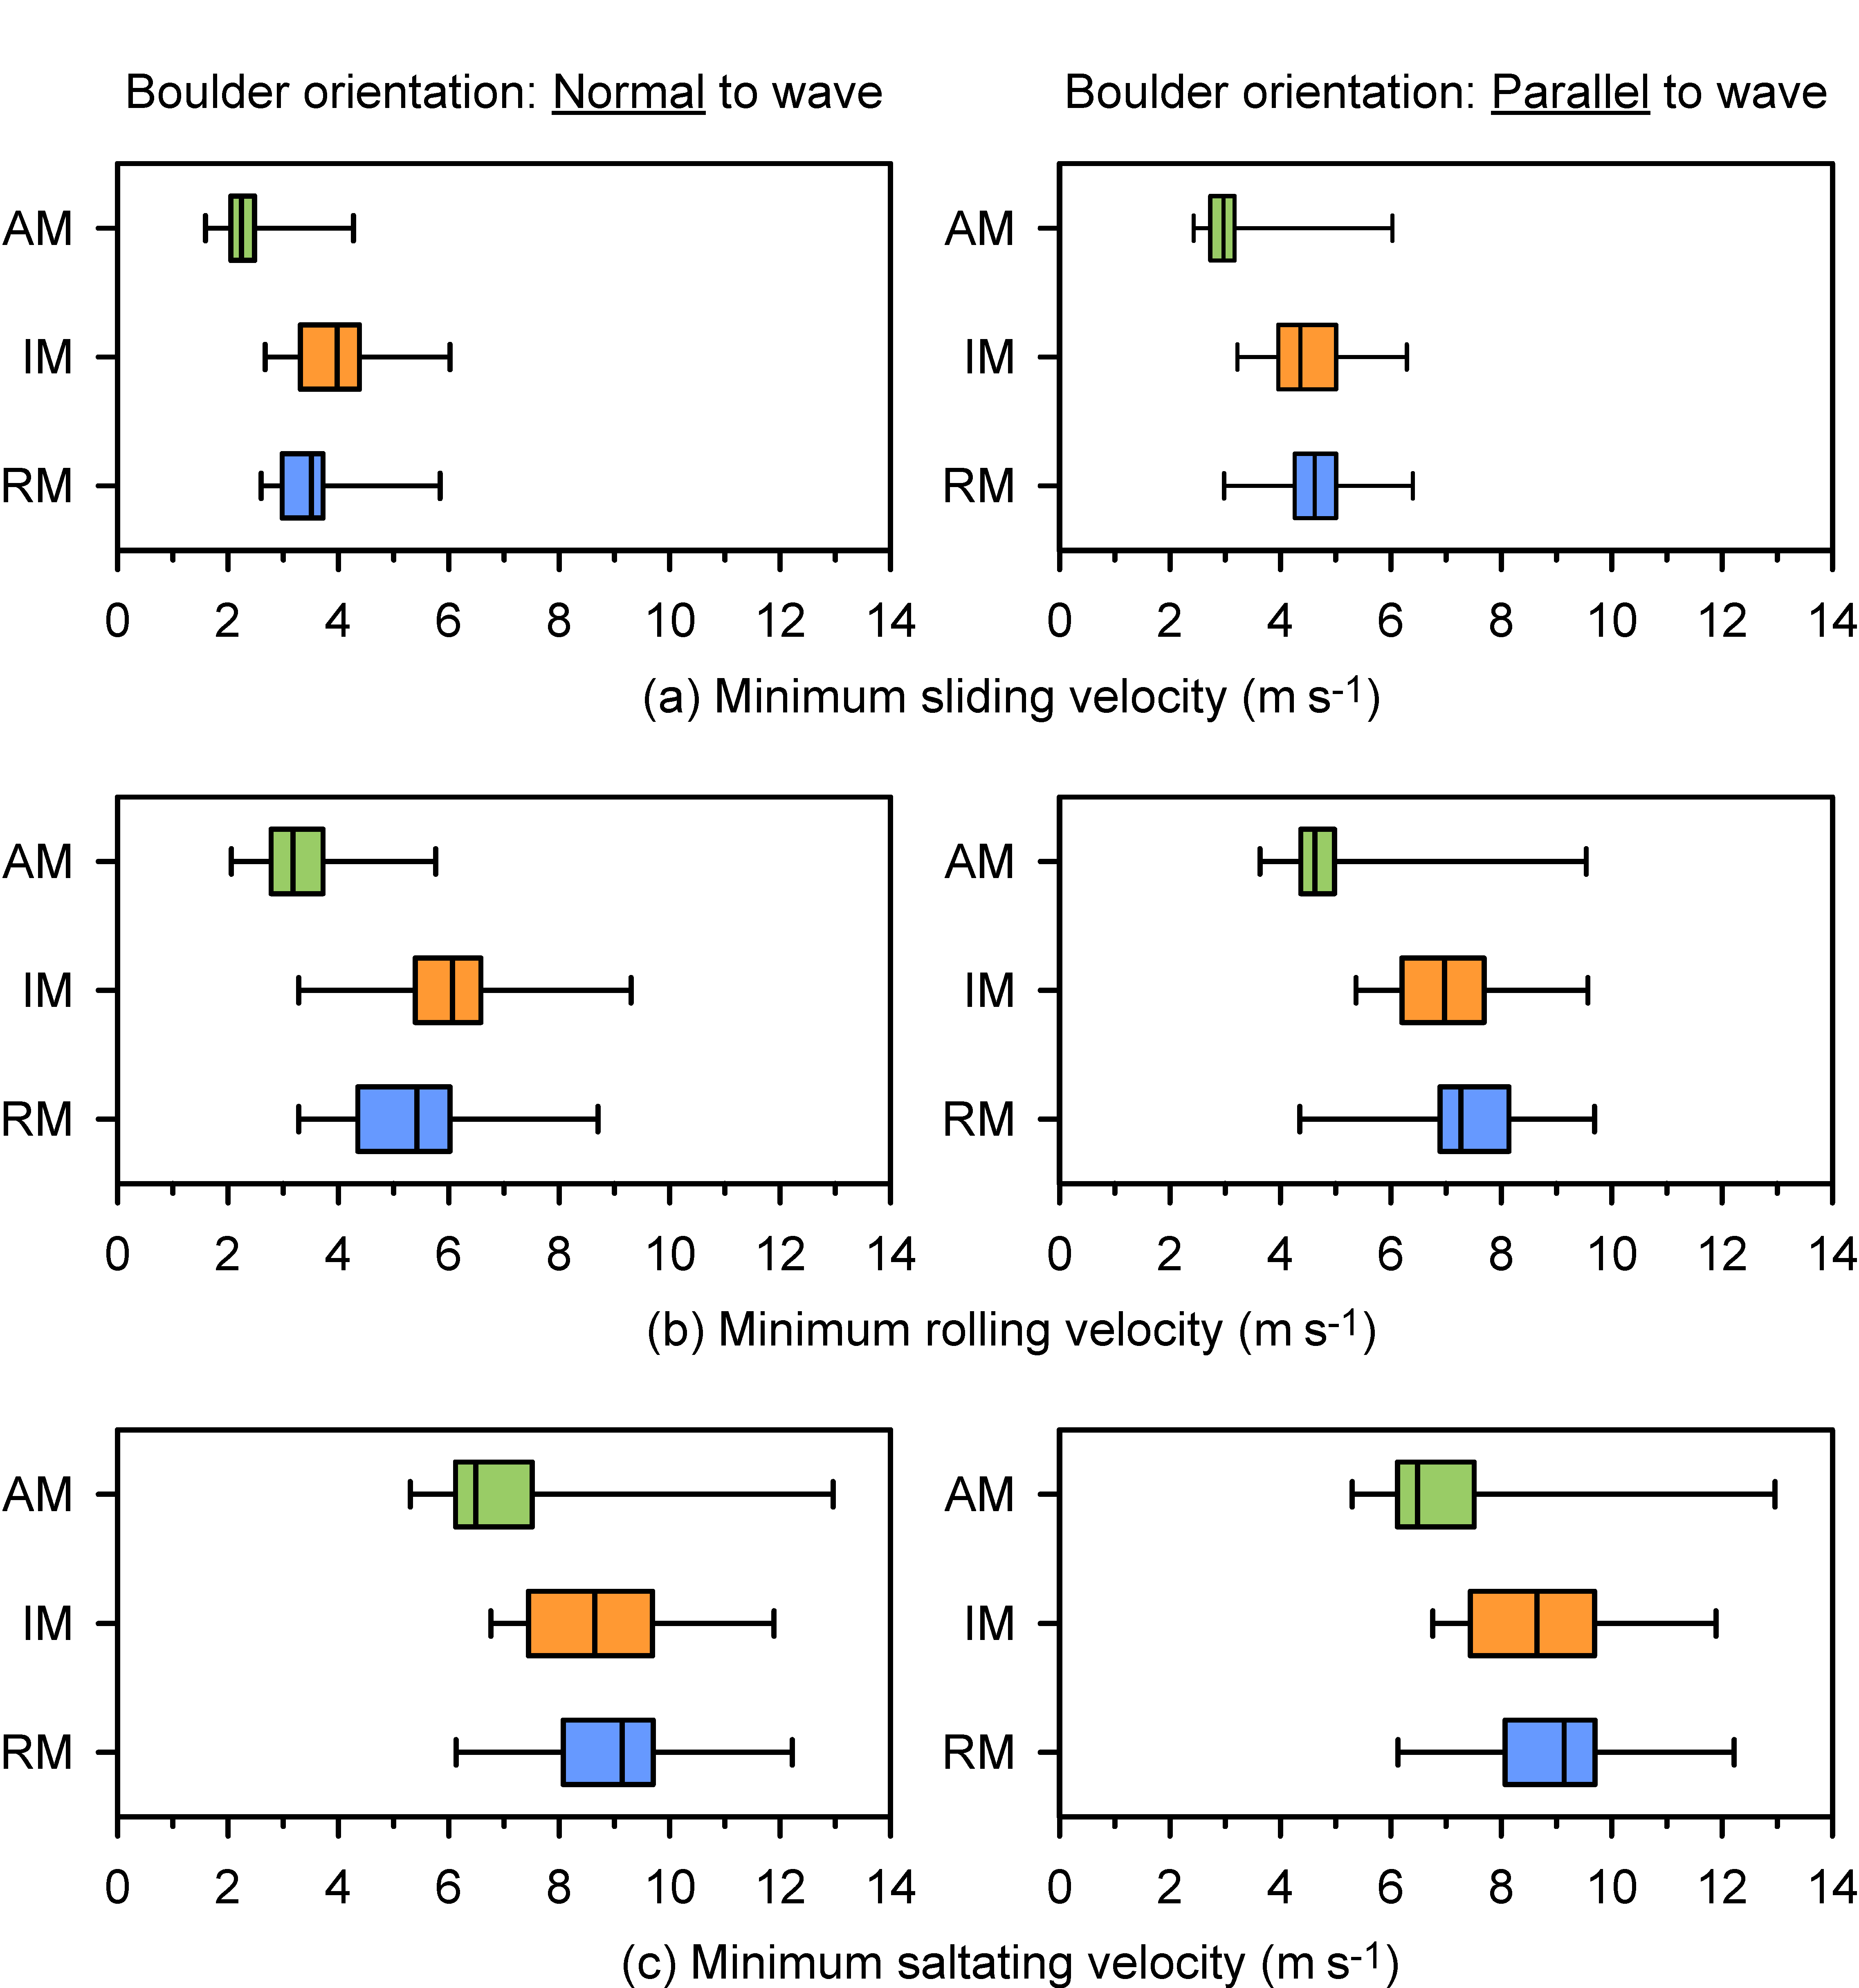
Figure 17.
Wave velocity decay profiles for two hypothetical storm waves and one hypothetical tsunami (Equation (6)), denoted by their wave period, T (s). The profiles are compared against the minimum velocities (after [19]) required to emplace boulders at their inland positions by: (a) sliding (Equations (1a) and (1b)); (b) rolling (Equations (2a) and (2b)), and; (c) lifting/saltating (Equation (3)). The boulders of interest are classified as recent movers (RM), indeterminate movers (IM) and ancient movers (AM), with prominent labelled boulders discussed in the text. For sliding and rolling, vertical lines differentiate between flow-normal orientation of boulders (bottom of line) and flow-parallel orientation (top of line). The lifting of recent mover RM2 to deposit atop the Globigerina scarp is used as the calibration movement for setting the magnitude of the decay profiles.
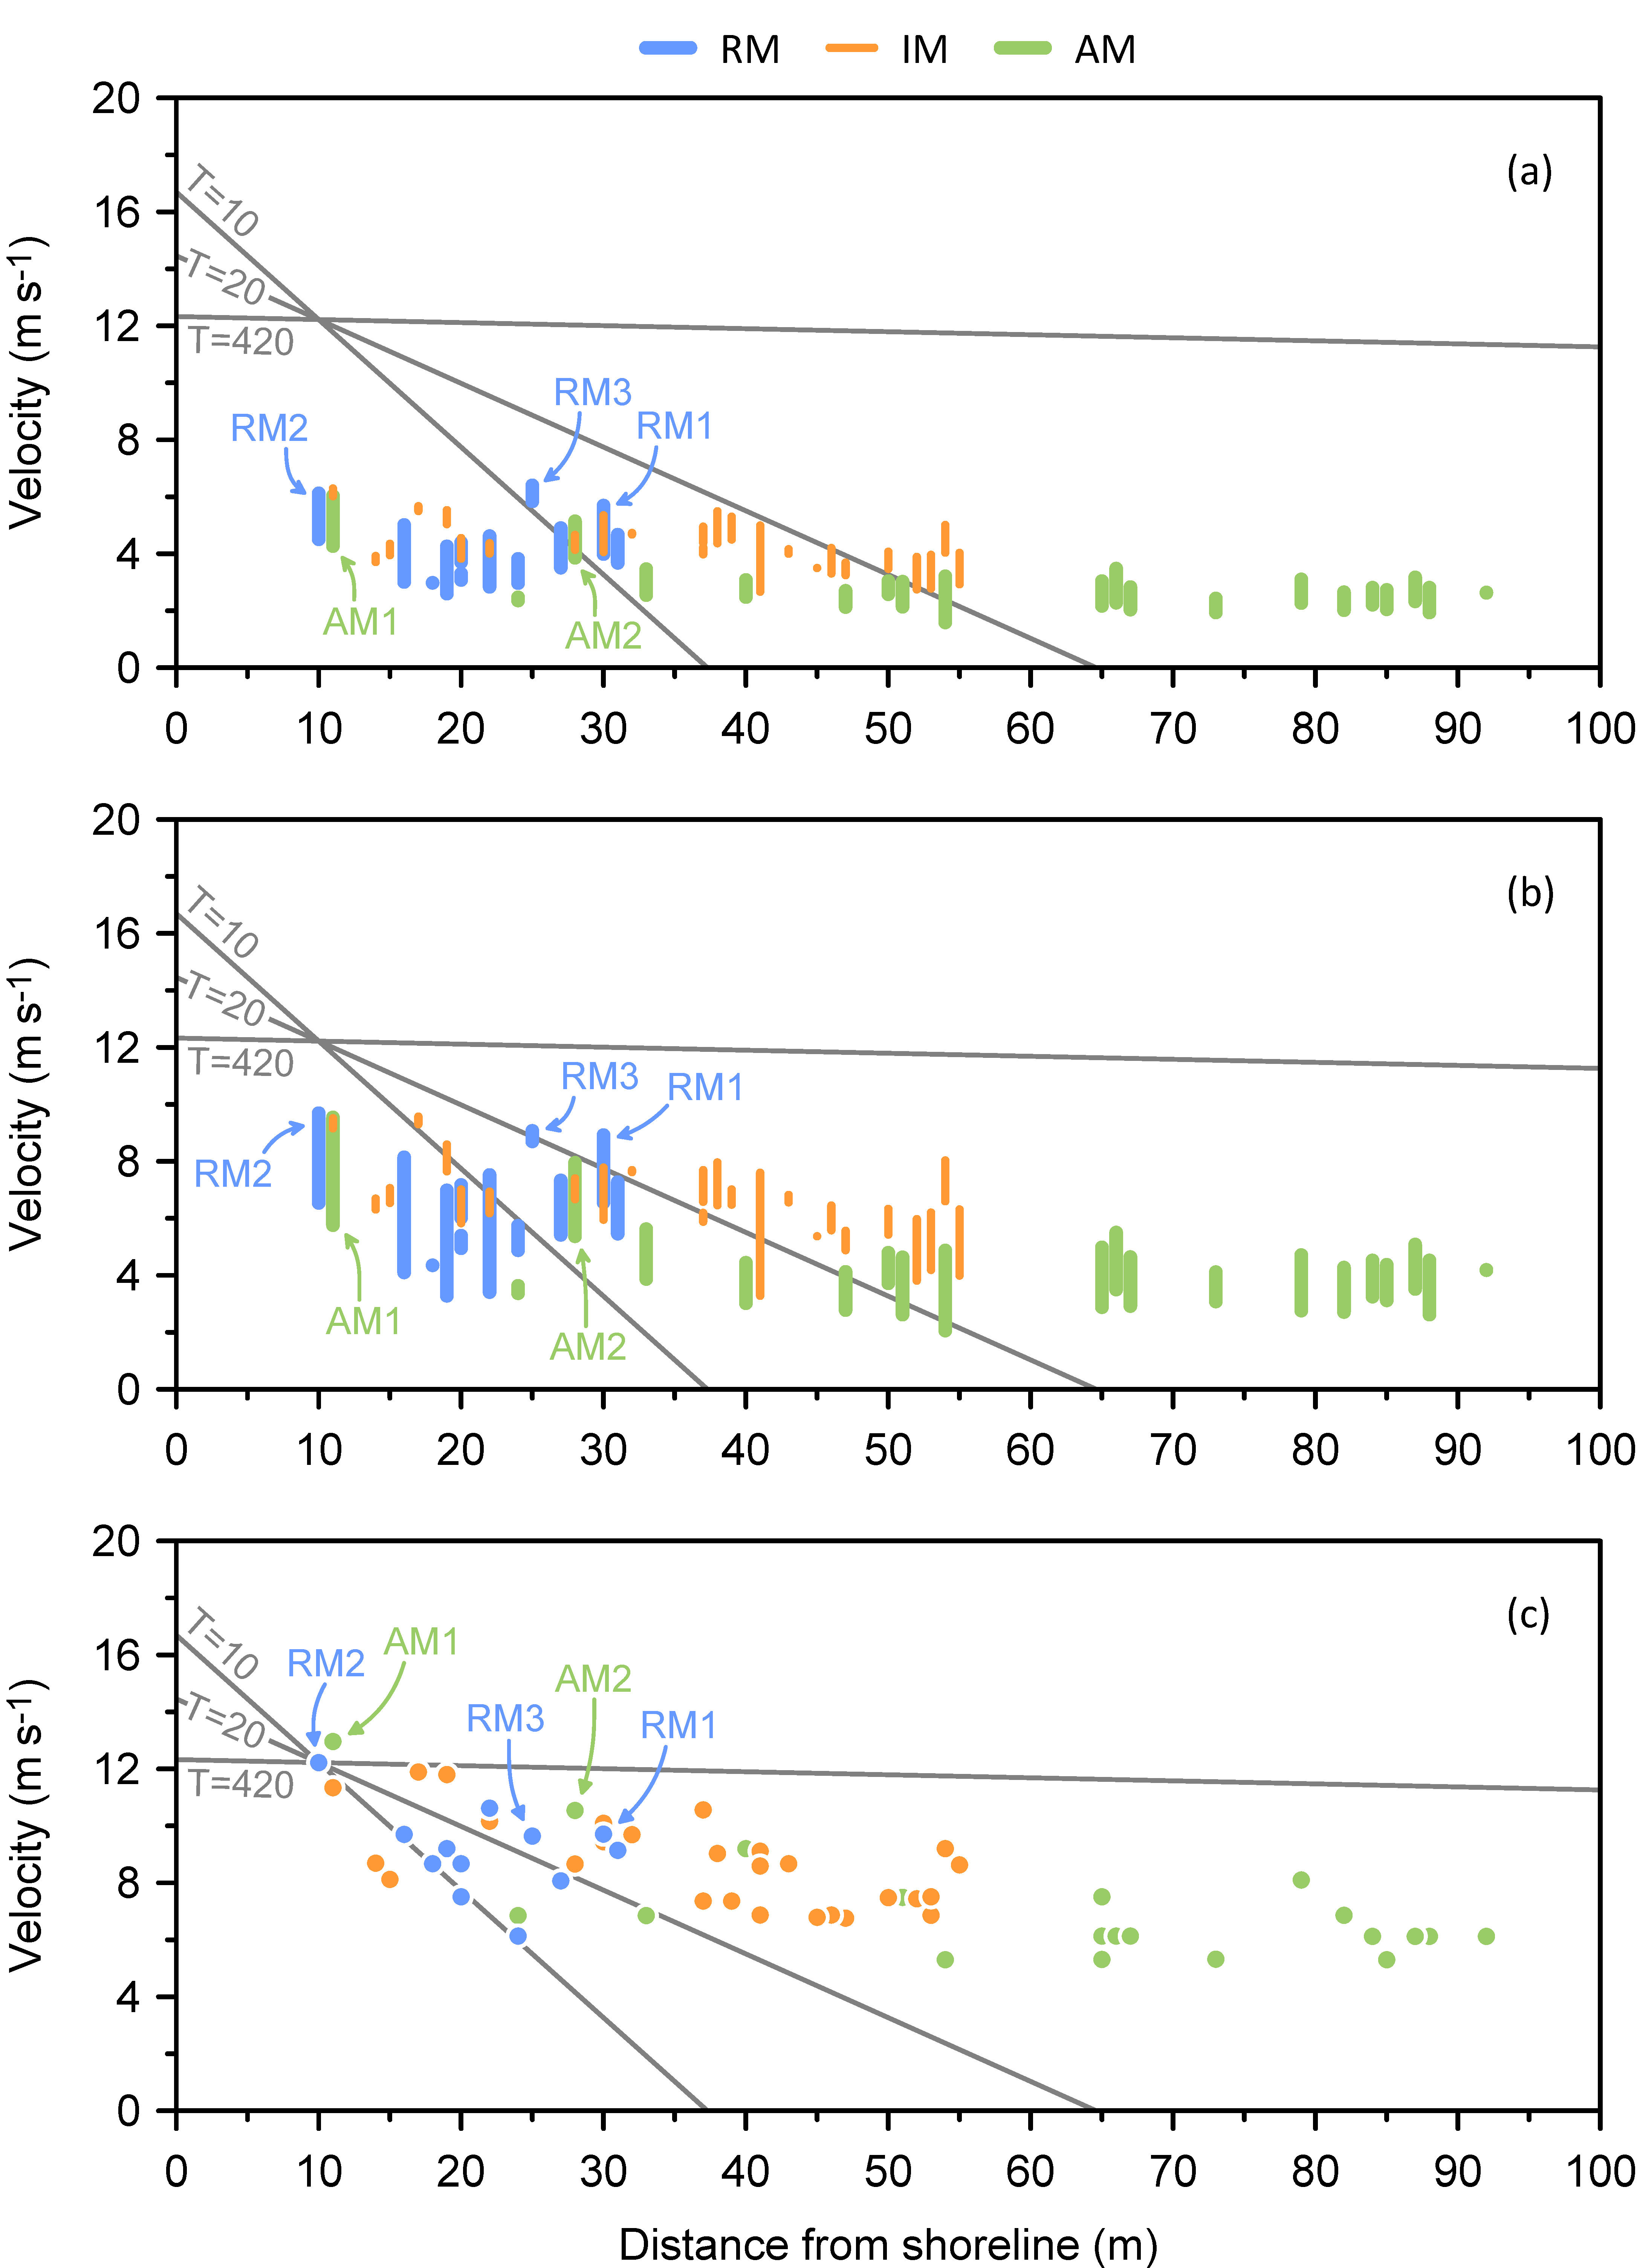
Figure 18.
Minimum velocities required to pivot over the Lower Globigerina scarp (Equations (4a) and (4b)) for the two inverted boulders AM1 and AM2 (after [39]). The boulders are positioned at the scarp face where the movement took place. The velocities are set against the three hypothetical wave velocity decay profiles and the minimum velocities required for lifting/saltation of the remaining boulders of interest (greyed out). Vertical lines differentiate between flow-parallel orientation of boulders (bottom of line) and flow-normal orientation (top of line). Note that boulder AM1 has an undefined upper velocity as the flow-normal case is unfeasible according to the equation.
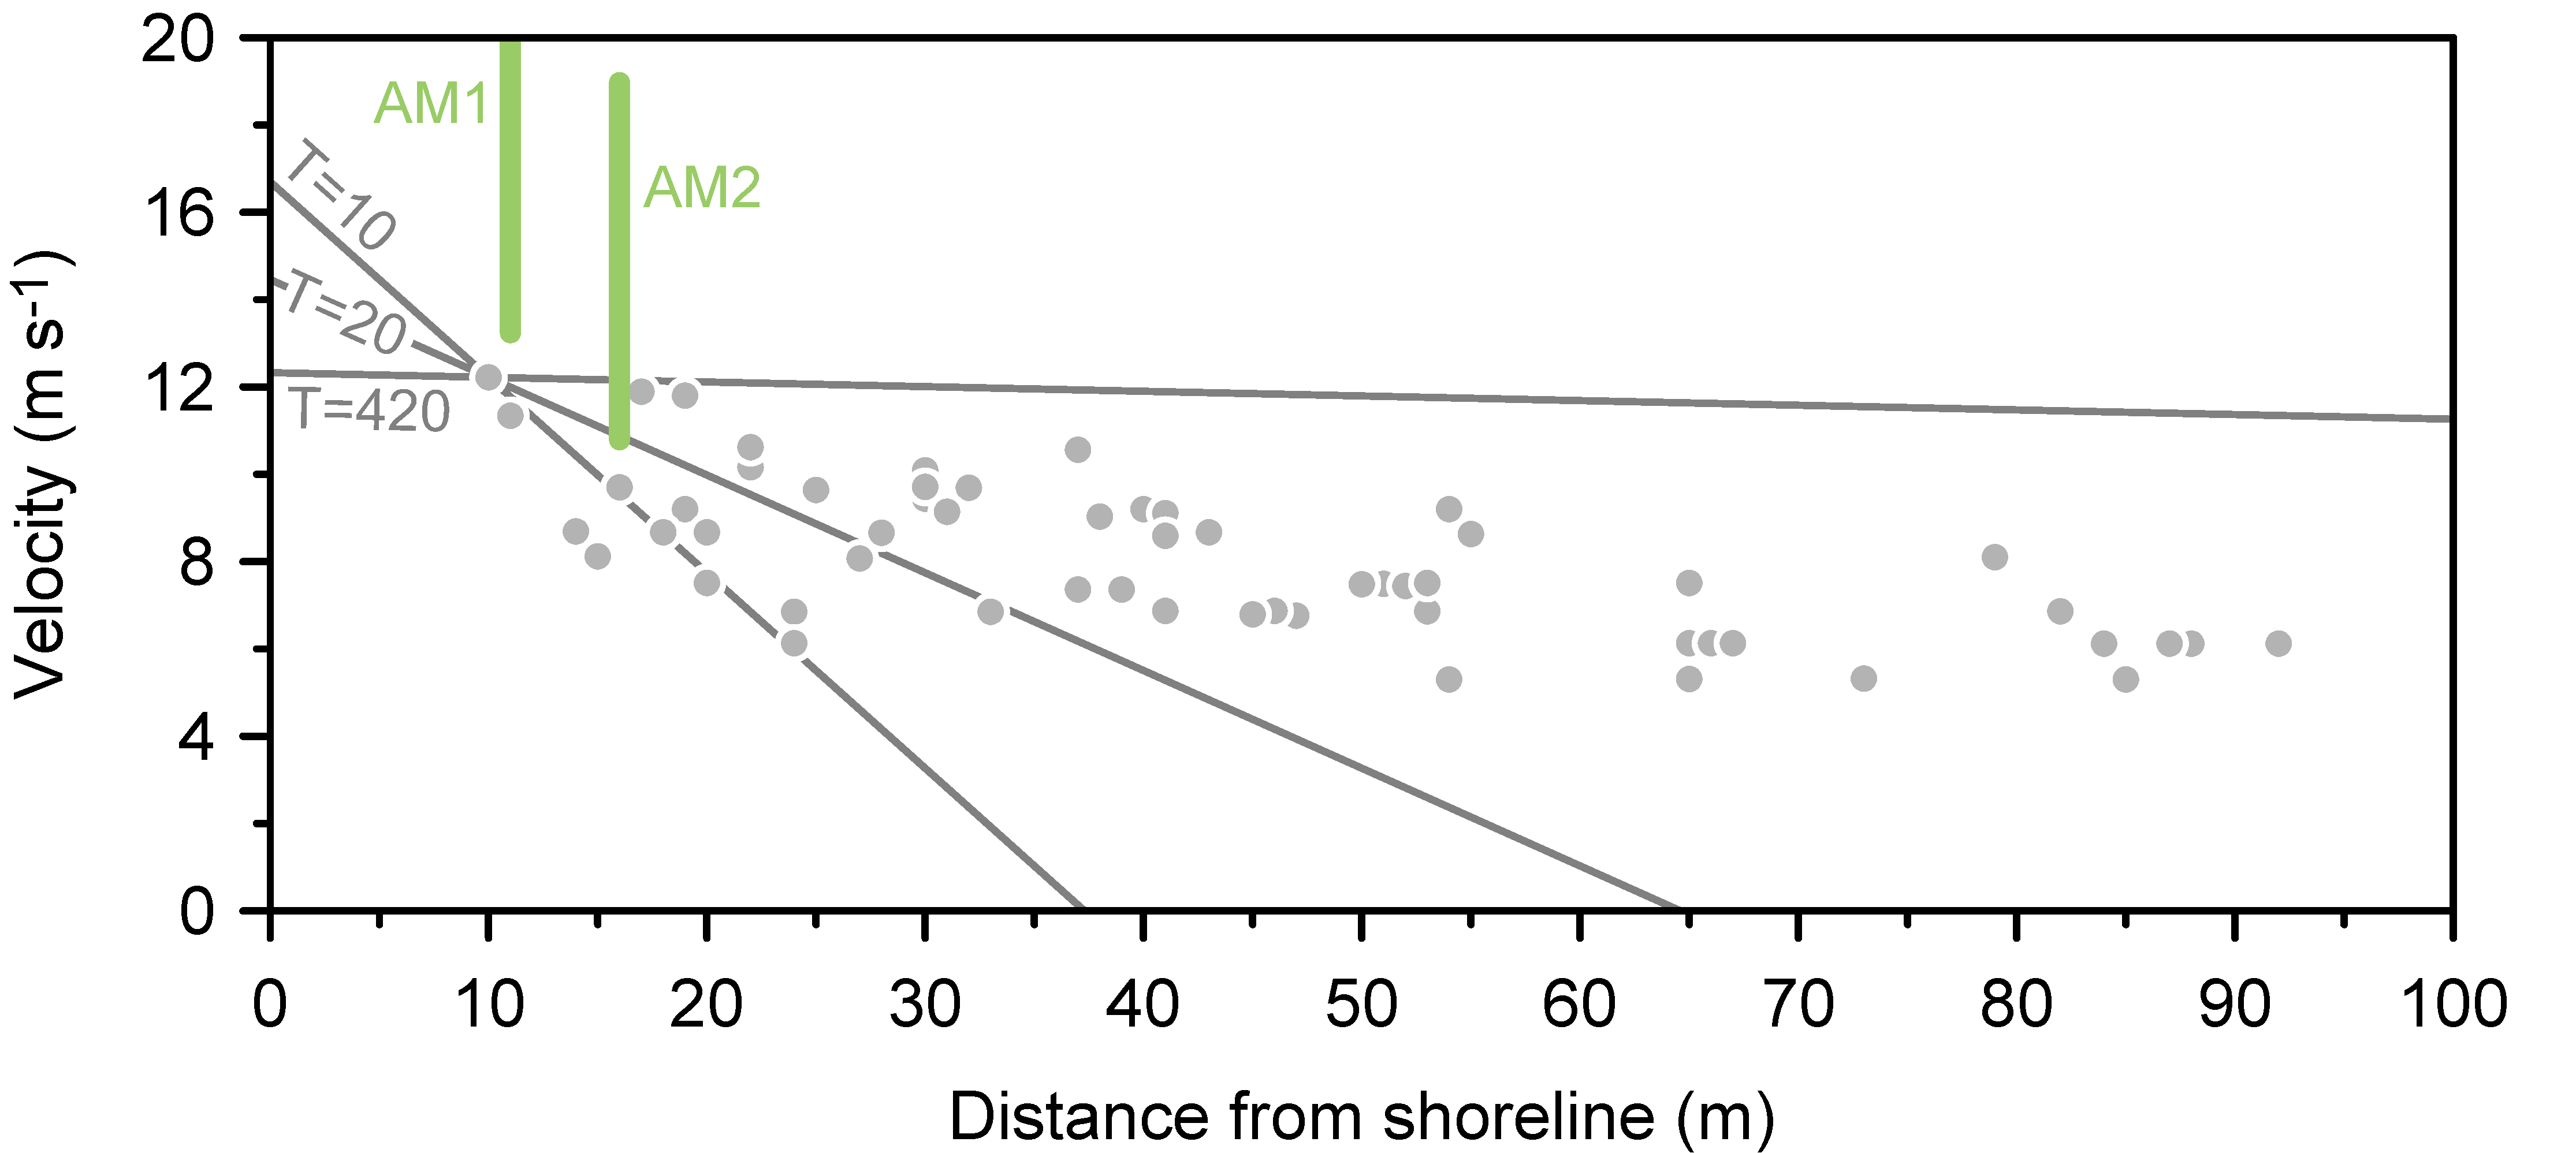
Figure 19.
Newly detached rock masses trapped against their scarp of origin: (a) a line of three scarp foot boulders, separated from the adjacent scarp and confined in their current position until the occurrence of some major event with sufficient power to displace them; (b) contact between the base of a large detached scarp foot LGL boulder (shown in Figure 4) and the subjacent surface of the LCL shore platform. The pale, freshly fractured rock surface above is the boulder’s b-c facet and the darker colonised surface beneath is the irregular surface of the shore platform. The mutual grinding of the two surfaces has developed a perfect congruence where the two are in direct contact with each other.
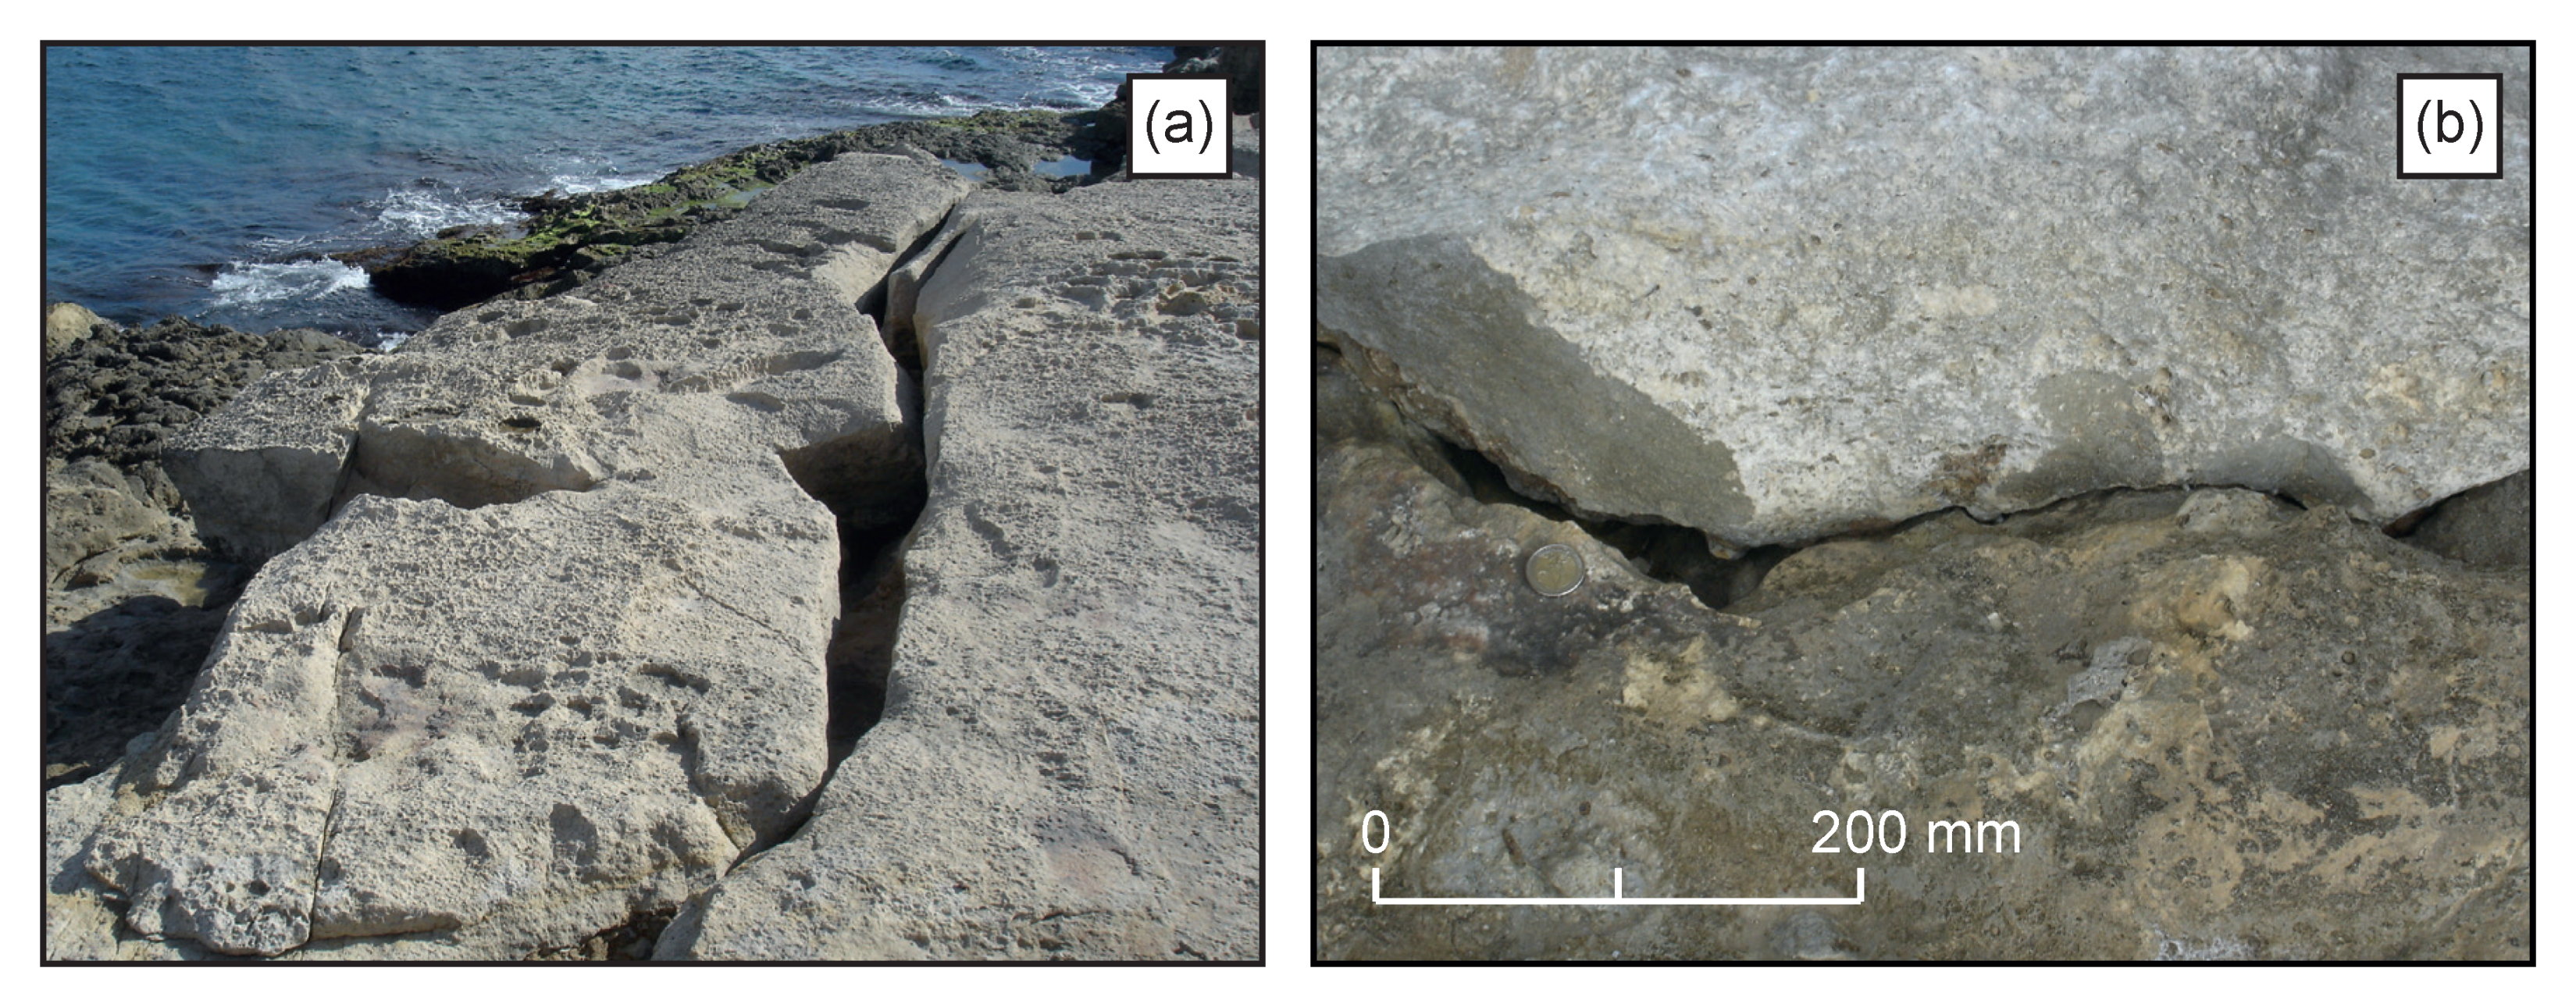
Figure 20.
Weathering by tafoni of the exposed face of a cubic block of rock in a field boundary wall upslope from the Żonqor shore. The wall is estimated to be c. 400 years old [62]. The face of the block has been eroded by tafoni to a depth of 150 mm, and serves as a first approximation benchmark of the weathering and erosion rate of boulders in the local environment (pen is 150 mm long).
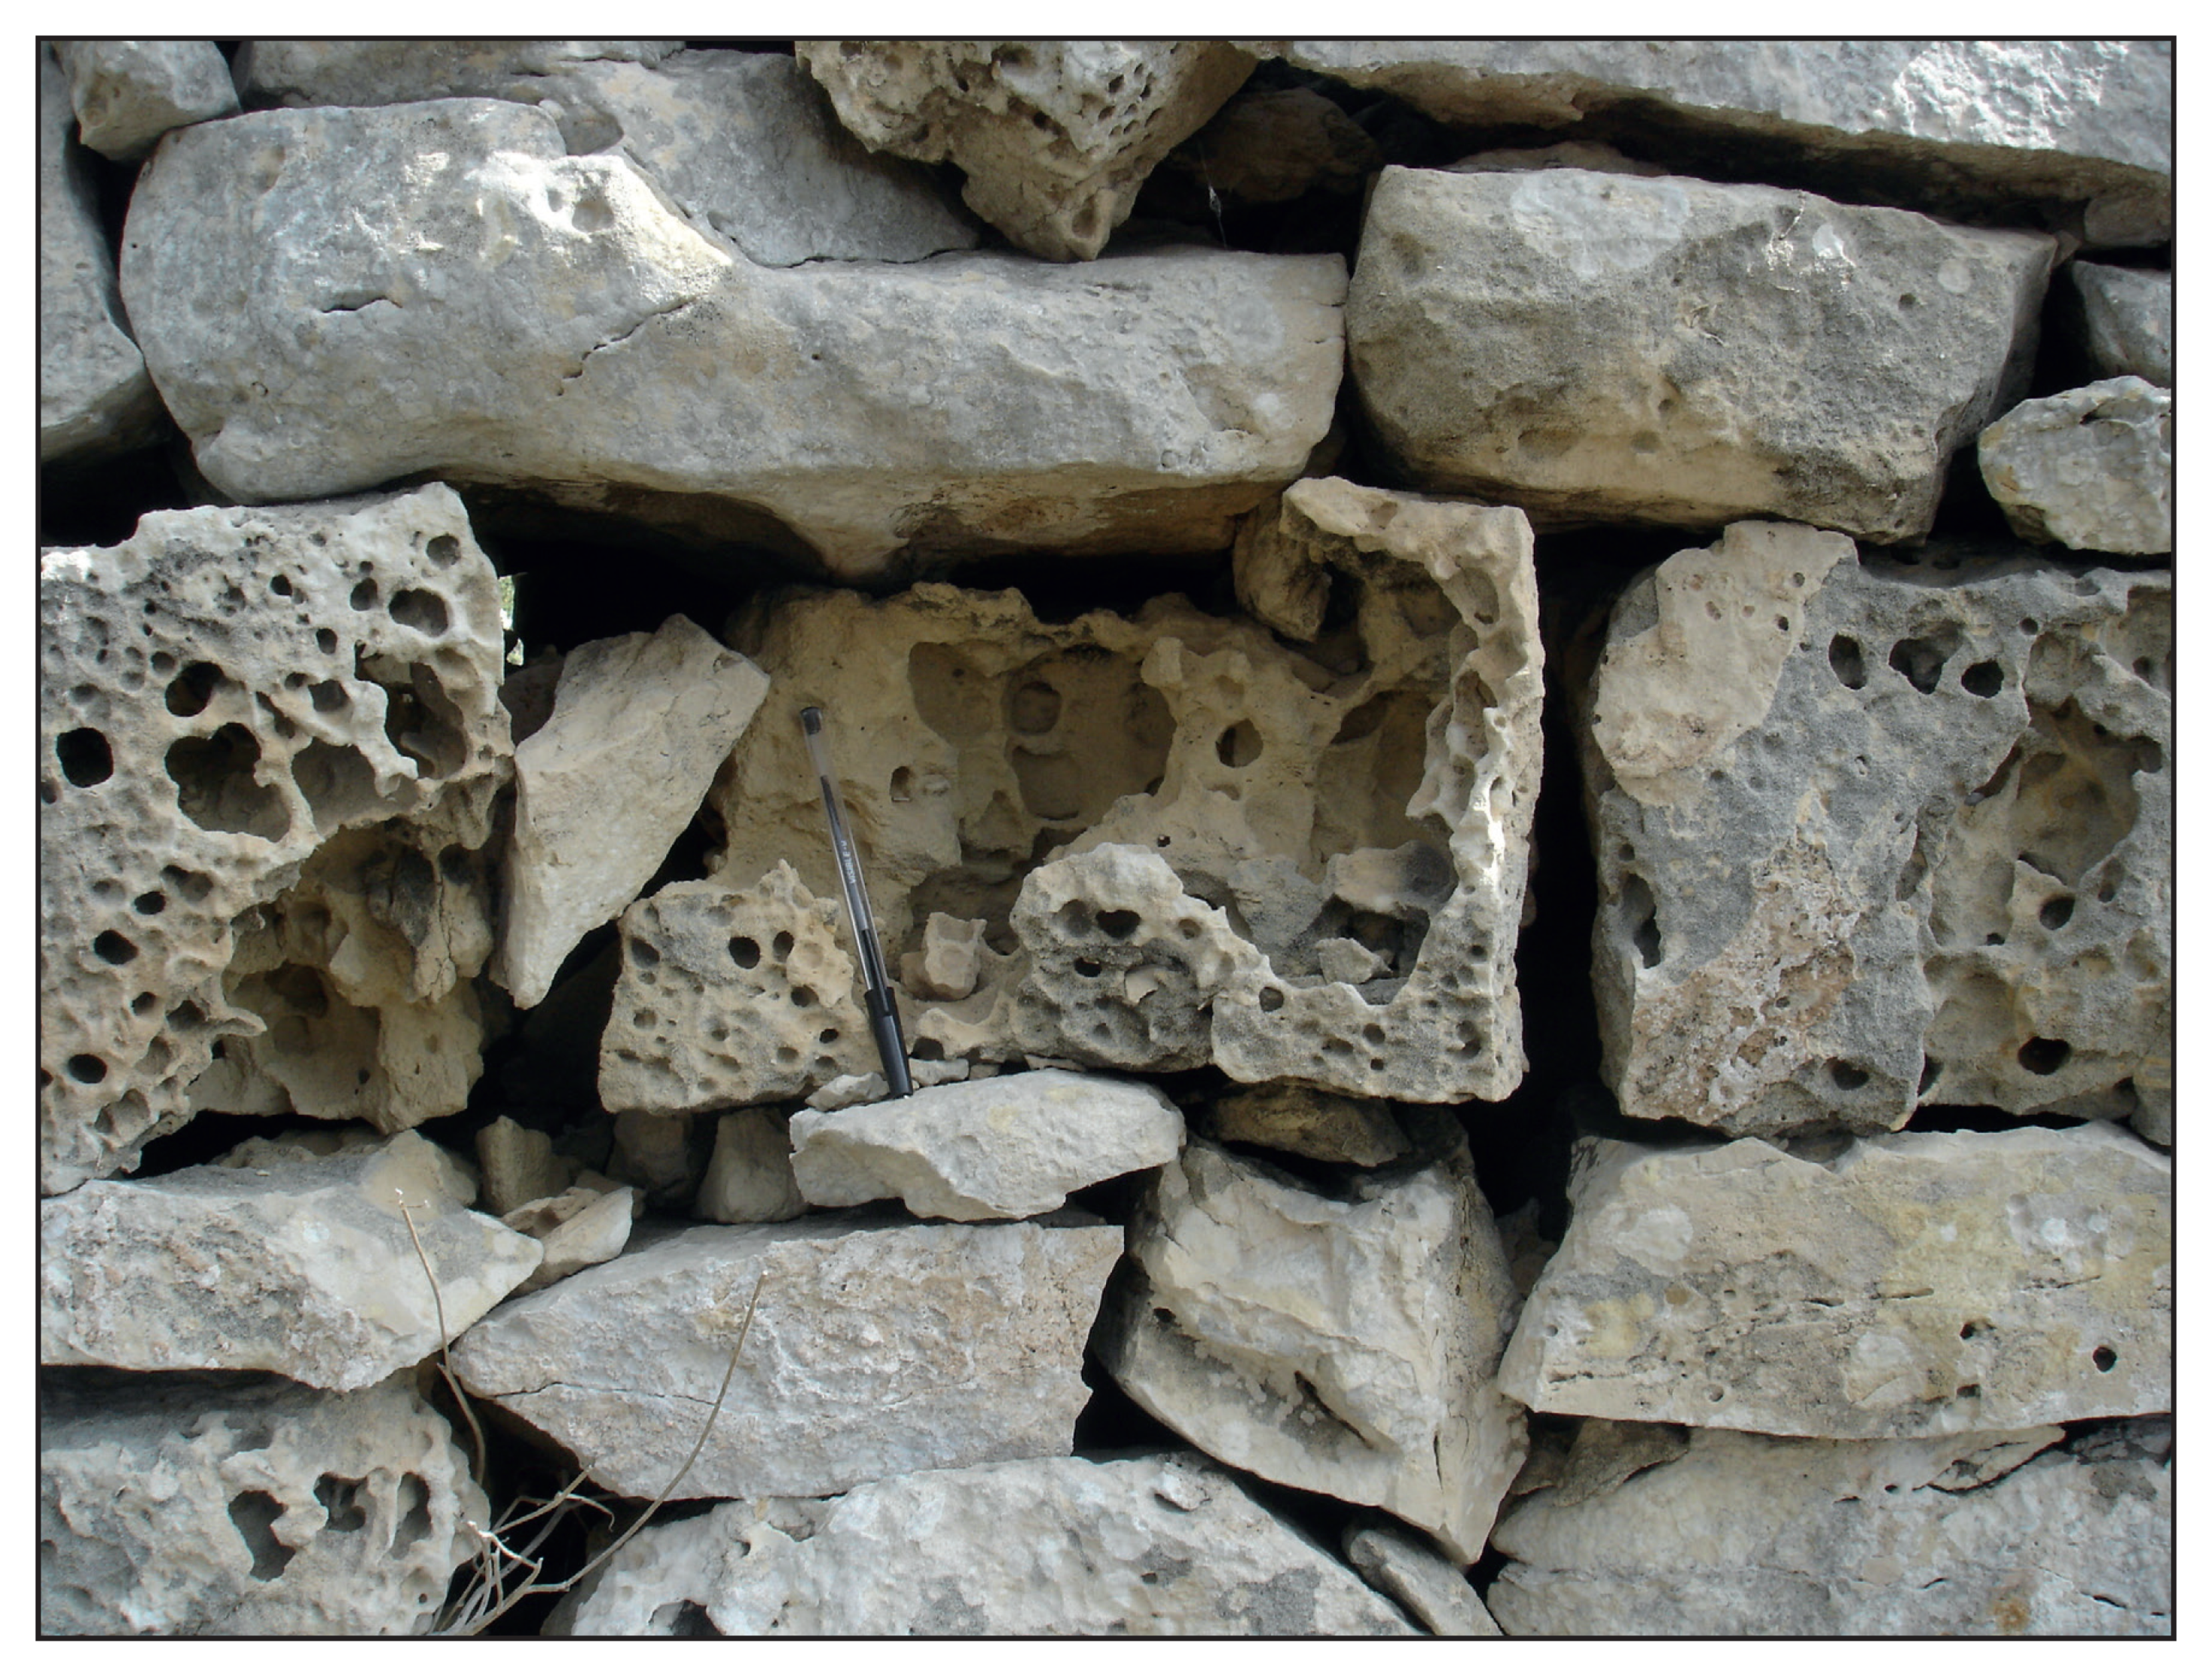
Table 1.
Summary of parameters employed and their derivation.
| Factor | Parameters | Derivation |
|---|---|---|
| Location | Distance from shoreline | Field measurement, Google Earth |
| Elevation | Elevation above shoreline | Field survey, LiDAR contours |
| Magnitude | Principal axes | Field measurement |
| Volume | Field axial measurement | |
| Mass | Field axial measurements, density observation in laboratory, supported by literature | |
| Attitude | Normal/transverse to shoreline, inverted, stacked, imbricate | Direct field observation |
| Age in situ | Weathering state | Direct field observation |
| Hydrodynamic implications | Flow velocity and wave height at deposition | Estimated via boulder transport modelling |
Table 2.
Frequency of recent boulder movements 1957–2013.
| Image Date | Type 2 | Recent Mover Boulder (RM) ID 1 | Moves per Interval 3 | ||||||||||
|---|---|---|---|---|---|---|---|---|---|---|---|---|---|
| RM 1 | RM 2 | RM 3 | RM 4 | RM 6 | RM 7 | RM 8 | RM 9 | RM 11 | RM 12 | RM 13 | |||
| 17/08/1957 | AP | ⊗ | ◯ | ⊗ | ⊗ | ⊗ | ⊗ | ⊗ | ⊗ | ⊗ | ⊗ | ⊗ | - |
| 10/11/1967 | AP | ❶ | ◯ | ⊗ | ❶ | ⊗ | ❶ | ⊗ | ⊗ | ⊗ | ⊗ | ⊗ | 3 |
| 10/12/1978 | AP | ❷ | ❶ | ⊗ | ❷ | ⊗ | ◯ | ⊗ | ⊗ | ⊗ | ⊗ | ⊗ | 3 |
| 31/08/1988 | AP | ❸ | ◯ | ❶ | ◯ | ❶ | ◯ | ❶ | ❶ | ❶ | ❶ | ❶ | 8 |
| 04/05/1994 | AP | ◯ | ❷ | ◯ | ❸ | ❷ | ❷ | ◯ | ◯ | ◯ | ◯ | ◯ | 4 |
| 18/02/2002 | GE | ◯ | ◯ | ◯ | ◯ | ◯ | ◯ | ◯ | ◯ | ◯ | ◯ | ◯ | 0 |
| 15/04/2013 | GE | ◯ | ◯ | ◯ | ◯ | ◯ | ◯ | ◯ | ◯ | ◯ | ◯ | ◯ | 0 |
| Total moves: | 3 | 2 | 1 | 3 | 2 | 2 | 1 | 1 | 1 | 1 | 1 | 18 | |
1 RM5 & RM10 are excluded. Movement is confirmed but movements between some image dates are unclear. 2 AP = Aerial photography; GE = Google Earth image. 3 ⊗ = Not present on image; ◯ = No movement; ❶❷❸ = Position after 1st, 2nd and 3rd movements. Number of moves includes arrival of the boulder if not present on 1957 image.
© 2020 by the authors. Licensee MDPI, Basel, Switzerland. This article is an open access article distributed under the terms and conditions of the Creative Commons Attribution (CC BY) license (http://creativecommons.org/licenses/by/4.0/).
Share and Cite
MDPI and ACS Style
Mottershead, D.N.; Soar, P.J.; Bray, M.J.; Hastewell, L.J. Reconstructing Boulder Deposition Histories: Extreme Wave Signatures on a Complex Rocky Shoreline of Malta. Geosciences 2020, 10, 400. https://doi.org/10.3390/geosciences10100400
AMA Style
Mottershead DN, Soar PJ, Bray MJ, Hastewell LJ. Reconstructing Boulder Deposition Histories: Extreme Wave Signatures on a Complex Rocky Shoreline of Malta. Geosciences. 2020; 10(10):400. https://doi.org/10.3390/geosciences10100400
Chicago/Turabian StyleMottershead, Derek. N., Philip J. Soar, Malcolm J. Bray, and Linley J. Hastewell. 2020. "Reconstructing Boulder Deposition Histories: Extreme Wave Signatures on a Complex Rocky Shoreline of Malta" Geosciences 10, no. 10: 400. https://doi.org/10.3390/geosciences10100400
Note that from the first issue of 2016, this journal uses article numbers instead of page numbers. See further details here.