Review

Dreaming of Perfect Data: Characterizing Noise in Archaeo-Geophysical Measurements

1
GeodataWIZ, 53424 Remagen, Germany
2
AOROC, UMR 8546, CNRS-PSL, École Normale Supérieure, 75005 Paris, France
3
Department of History and Archaeology, University of Cyprus, Nicosia 1095, Cyprus
*
Author to whom correspondence should be addressed.
Geosciences 2020, 10(10), 382; https://doi.org/10.3390/geosciences10100382
Submission received: 30 June 2020 / Revised: 14 September 2020 / Accepted: 18 September 2020 / Published: 23 September 2020
(This article belongs to the Special Issue Selected papers from the SAGA Workshop 1)

Abstract

:
For the interpretation of archaeological geophysical data as archaeological features, it is essential that the recorded anomalies can be clearly delineated and analyzed, and therefore, care has been taken to obtain the best possible data. However, as with all measurements, data are degraded by unwanted components, or noise. This review clarifies the terminology, discusses the four major sources of noise (instrument, use of instrument, external, soil), and demonstrates how it can be characterized using geostatistical and wavenumber methods. It is important to recognize that even with improved instruments, some noise sources, like soil noise, may persist and that degraded data may be the result of unexpected sources, for example, global positioning system synchronization problems. Suggestions for the evaluation and recording of noise levels are provided to allow estimation of the limit of detection for archaeological geophysical anomalies.

1. Introduction

The ultimate aim of an archaeological geophysical survey is to detect and investigate features buried in the ground. However, such measurements contain many additional unwanted components that become embedded in the data, originating from the use of the instruments, the soil conditions, or from external disturbances. These unwanted components are usually referred to as ‘noise’. The challenge is to extract meaningful information from such composite data and differentiate between the sought-after ‘signal’ and the undesirable ‘noise’. This article provides an overview of the wide range of noise sources and highlights their different characteristics, thereby providing a conceptual framework for understanding the different contributions. This helps with the discussion of fundamental questions (e.g., even if instrument noise is minimized, soil noise may set a natural limit for the detectability of archaeological features) and with the selection of appropriate processing steps (e.g., low-pass filtering is not always suitable). However, this article will not provide a handbook of processing schemes for every possible situation, but instead refer to appropriate references.
A geophysical data map represents the spatial variations of a measured physical property, often recorded in the form of a digitally sampled electrical voltage. The underlying assumption is that the measured property and the measured voltage variations are related to buried features of interest. For the most frequently used methods in archaeological prospection (electrical resistivity imaging (ERI); earth resistance and magnetometer surveys; low-frequency electromagnetic (LFEM) investigations; and ground penetrating radar (GPR) surveys), the electrical voltage measured at the sensor is related to electromagnetic fields, whether natural or induced. In addition, gravity and heat fields are also sometimes used for investigations. The variations in these fields are related to differences in the physical properties of the ground, which consists of soils, sediments, bedrock, biological materials, and anthropogenic features, recent or ancient, embedded therein. While the intention is to investigate the properties of the ground, the recorded voltage is measured by sensors that have their own physical characteristics, which become imprinted into the data. Therefore, the detectability of buried features is related to the physical properties of the ground and its surroundings, to the workings of the sensors, and to the treatment of the measurements in the instrumentation, either analog or digitally. To understand and interpret a data map, the chain of these processes from the ground to the sensors and displayed pixels (usually referred to as a ‘transfer function’) has to be considered. It may even be worth including the human investigators with their eyes and brain in this chain of processes, adding an additional human transfer function. For example, a picture with a 256-step grayscale representation cannot be fully resolved by the human eye, nor an animated video sequence with a rate of 200 frames per second.
Beyond the technical choices related to instrumentation and data processing, which are not part of this paper’s analysis, lies the question as to which conditions are necessary to detect archaeological features. This leads to an analysis of absolute and relative measurement values and the linked notion of noise. Simply put, if the amplitude of absolute values measured by the instruments is too low, the archaeological features will not be detectable or their interpretation will be impossible. For example, this will be the case for features of small volume, at large depths, or whose physical parameters have a contrast against the surrounding soil matrix that is too low to be measured by the sensors. For this consideration, geophysical modeling (simulation) can help to define the criteria of detectability using a threshold in accordance with the known limitations of the sensors used. However, by way of the same argument, it should be possible to detect any feature, if the sensors’ output were amplified sufficiently to become measurable by the electronic readout unit.
However, such theoretical possibility is limited by noise and is best described by the notion of relative values as the measured absolute voltages should be compared to those voltages that could be measured in the absence of archaeological remains, a background noise level. If the ratio between the signal and the noise is too low, the buried archaeological remains will not be detectable.
Measurement noise usually has four components. The first is internal and relates to the instrumentation (e.g., no sensor is perfect and each one has its own limitations); the second is due to variations in the use of the instruments (e.g., while walking with a magnetometer); the third is related to external signals entering the measurements (e.g., magnetic storms); and the fourth is the ground’s spatial variability, usually referred to as ‘soil noise’. While it is often possible to characterize the noise of a sensor (e.g., by describing by the frequency dependence of the signal-to-noise ratio), the other sources are either poorly controlled (e.g., walking), not controllable (e.g., magnetic storms), or simply poorly understood (soil noise). Thus, the detectability of the underlying archaeological features becomes uncertain.
It is the main aim of this text to consider some of the relevant properties of noise such that a better analysis of archaeological geophysical data becomes possible. Understanding soil as a matrix in which archaeological features are embedded becomes similarly important as characterizing the archaeological features themselves. This may provide criteria for the detection of archaeological remains.

2. What Is Noise?

The term ‘noise’ is most commonly used in everyday language to describe loud, and unwanted, acoustic signals, for example, from road traffic. More generally, in the English language, it refers to any unwanted components in measurements or data. The Oxford Learners Dictionary defines it as:
“Information that is not wanted and that can make it difficult for the important or useful information to be seen clearly” [1].
For the purpose of the following discussion, it will be this definition of noise that shall be used. Scales and Snieder [2] framed this concept more colloquially as “[the] part of the data that we choose not to explain”. A specific type of noise can be indicated by an additional adjective, for example, ‘random noise’. This terminology is similar in several languages (e.g., ‘θόρυβος’ in Greek, ’bruit’ in French), but slightly different in others. In German, for example, acoustic noise from roads is usually referred to as ‘Lärm’, while ‘Rauschen’ implies random and uncorrelated variations in data. There is no commonly used unifying word in the German language encompassing all of these unwanted elements (although Graham and Scollar [3] translated soil noise as “Bodenrauschen” in their German abstract).
As discussed in Section 1, geophysical measurements usually involve sensors that output a voltage for processing and recording. There may be instances where only certain aspects of the voltage variations are actually recorded (e.g., the envelope curve of a rapidly oscillating signal), but it is useful for the subsequent discussion to consider everything that could, in theory, be measured or visualized in some way (e.g., as oscillations on an oscilloscope screen) as the geophysical data. The terms ‘data’ and ‘measurements’ shall, therefore, be used interchangeably.
Geophysical measurements contain several data components and, in archaeological geophysics, these can usually be separated into the sought-after anomalies, which are the ‘signal’, and the ‘background’ where there are no anomalies. The term anomaly identifies those measurements that deviate from the background, and this can either be defined loosely as the area without significant anomalies or mathematically as a regional field [4], depending on the specific requirements. Buried archaeological features are defined by a contrast of their soil or material properties against the surrounding ground (this is how they can be identified during excavation) and this soil contrast may also lead to anomalies in the geophysical measurements. It is the role of data analysis and interpretation to deduce what archaeological features may have caused these measured anomalies.
As anomalies can only be identified against a defined background, both components contain useful ‘information.’ Exactly which part of the data is considered to be the background may depend on the specific situation and is often related to scale. For mineral exploration studies, the background may be continental-size broad variations against which ore bodies of hundreds of meters in width might create anomalies of interest. However, these latter anomalies would be considered the background in archaeological investigations where anomalies on the order of meters would be the relevant signal.
The third component of geophysical measurements is noise: Unwanted data that are possibly present in signals and background alike and, therefore, considered ‘noninformation’. To quantify the amount of noise in data, the ‘signal-to-noise’ ratio (SNR) is often used and expressed logarithmically in decibels as
SNRdB = 10 × log10 PS/PN = 20 × log10 VS/VN
where PS/PN and VS/VN are the ratios of power and voltage, respectively, for typical signal and noise measurements.
Importantly, what exactly is unwanted, and hence noise, often depends on the specific circumstances of an investigation. For example, at a site where survey nails were left after an excavation, their ferrous anomalies in a subsequent magnetometer survey will be unwanted and are considered to be noise (Figure 1). By contrast, the anomalies produced by nails from past occupations could be important archaeological geophysical signals. They may be the ancient debris from a briefly occupied Roman marching camp or the nails that held together a wooden construction, for example, for the wall of the Celtic oppidum at Bibracte [5]. Similarly, the distribution of noise may reflect older field systems and mapping the noise may, hence, provide insights into past land use.
There is also an epistemological aspect to the distinction between signal and noise, as it is often made by human interpreters and is influenced by their past experiences. This also cautions against overzealous automated noise removal schemes; there should always be scope for site-specific tailoring and human supervision.
Noise can be classified in many different ways and the subsequent discussion is based on the sources of the unwanted data, as it helps with the task of avoiding them. Similarly, Linford et al. [6] listed some of these sources in their discussion of magnetometer data: Electronic noise from the sensors; quantization noise due to analog-to-digital (A/D) digitization; environmental noise influencing the electronic system; external noise from the micropulsation of the earth’s magnetic field; motion noise induced by moving the sensors; and noise from the magnetic response of underlying geology and soil. Some authors categorize unwanted data components as ‘errors’ that can be corrected and ‘noise’ that is unpredictable [4,7]. Others prefer to base their discussion on the spatial appearance of noise. For example, Graham and Scollar [3] and Scollar et al. [8] distinguished between correlated and uncorrelated noise. The former characterizes noise that is correlated from “point to point in space [during measurement]” and is mainly “due to natural irregularities in [the] superficial [magnetic] susceptibility distribution”, but also includes “surface scatters of small iron objects, long term changes or drift in instruments and … long term changes in the Earth’s magnetic field”. Uncorrelated noise-data for them “are usually of instrumental origin, or … come from rapid external electrical or magnetic disturbances … [or] from slight errors in the position of the measurement sonde”. In seismic geophysics a distinction is usually made between coherent and incoherent noise, where the former describes components in the data that can be “followed across at least a few traces” [9], or that show a consistent phase from trace to trace (e.g., ground roll, shallow refractions, and multiples) [10]. In contrast to the spatial definition of correlated noise, coherent noise also has a temporal aspect in the form of phase-coherence as it is mostly used for seismic data in the space–time domain. Sometimes, incoherent noise is referred to as ‘random noise’, but as Sheriff and Geldart [11] already noted, this can be a false perception caused by coarse sampling; closely spaced seismic geophones can show coherent noise where more widely spaced geophones may appear to record incoherent variations. The Shannon sampling theorem (see Section 3.2.1) explains that coarse sampling removes short-range components of a signal, which may have been those parts that would have shown coherence.
Hence, it is important to be careful when attributing ‘randomness’ to noisy data. Such a label is often assigned if no immediate cause for variations in the data can be established. Undersampling signals in space or time are typical examples where smooth underlying variations that might be part of the wanted signal appear to be unpredictable and might be called random. While true randomness indeed means that the variability in individual measurements cannot be predicted, it also requires a degree of statistical regularity such that a probability distribution compiled from many repeat measurements approaches a stable limit when the number of observations is increased [12]. The probability distribution of temporal noise, for example, tends to approach a normal distribution (according to the Central Limit Theorem), and geostatistical analysis of spatial variations can identify noise as a so-called ‘nugget effect’.

3. Sources of Noise

3.1. Instruments

3.1.1. Sensors and Electronics

The signals generated by geophysical sensors and their attached electronics show random variations, even if the measured underlying property were constant or varying very slowly. The reasons are varied and mostly related to statistical processes in semiconductors and other electric components (e.g., thermal noise, flicker noise). This noise can be evaluated by calculating the average of a signal’s deviation from the mean (the root-mean-square (RMS) error, or standard deviation) and its dependence on the measurements’ sampling frequency. This frequency dependence is characteristic for the different noise sources and can, hence, be used for their characterization. For example, thermal noise is nearly independent of frequency (its frequency spectrum is called ‘white’), while flicker noise is much smaller for higher frequencies (hence labeling the frequency response ‘pink’).
The sensor measurements are not taken instantaneously, but over a period of time, resulting in a limit to the frequency with which rapidly changing signals can be recorded—the system’s ‘bandwidth’ expressed in Hertz. To record fast changes, a high bandwidth is needed. In most instances, survey instruments use analog, digital, or numerical filters to process the sensor signals to reduce the electronic instrument noise, but the characteristics of these filters, therefore, limit the bandwidth. For example, filters for removing unwanted signals induced by mains power (at 50 or 60 Hz) are used in earth resistance meters and alkali vapor magnetometers. Synchronous detection is also a very effective filter for earth resistance meters whereby transmitted currents are modulated with a selectable frequency to which the receiving circuitry is tuned to remove all signals that are not in phase with the source. Specific filters are also used before digitization to avoid sampling-aliasing, which would otherwise manifest itself as noise. The tradeoffs for the achieved noise reduction will be a reduction in the instruments’ bandwidth. The exact quantification of these noise sources and their suppression is difficult to evaluate and the manufacturers’ specifications have to be relied upon.
If the raw output voltage of geophysical sensors can be accessed and recorded with high-specification data acquisition boards, it is possible to characterize directly the response of the devices. The best way to compare the performance of magnetometer systems is to place an instrument on a nonmagnetic stand and record the signal for a period of time, carefully excluding any records of external disturbances (see Section 3.3.3) when evaluating the results. Several such investigations have already been undertaken. Linford et al. [6] compared two fluxgate gradiometers (Geoscan FM36 and Bartington Grad 601) with a Scintrex SM4s Cesium gradiometer and found considerable differences in the RMS values (0.29, 0.06, and 0.01 nT, respectively). Manoli [13] tested a Foerster Ferex CON 650 array and the data showed an RMS of 0.21 nT. Similar tests were undertaken for the comparison between two different fluxgate gradiometers, a Foerster Ferex Con650 and a Bartington Grad-01-1000L using, for both, a custom-built acquisition device. The results showed RMS noise of 0.16 and 0.03 nT, respectively (Figure 2a,b). For comparison, data from a Cesium gradiometer (Geometrics G-858) were also recorded, but using the internal data logger of the instrument (Figure 2c), yielding an RMS noise of 0.02 nT (Table 1).
It can be seen that in these tests, the level of noise of the Bartington sensor is of the same order as from the optically pumped probe from Geometrics, and its peak-to-peak range is even better than the value quoted by the manufacturer (0.1 nT). It is likely that this is due to the low noise level of the acquisition device used in this experiment compared to the manufacturer-supplied acquisition systems that were used in the tests reported in the literature [6,13].
Using the same external data acquisition device, it was possible to measure the RMS noise of the Bartington sensor for different sampling frequencies and also using or removing an internal anti-aliasing filter in the acquisition module. It can be seen that the RMS noise is increasing with frequency (‘blue’ noise) and that using an anti-aliasing filter lowers the RMS noise by approximately 40% (Table 2). Assuming a weak signal strength of an archaeological anomaly of 1 nT, this would result in a SNR of 30–40 dB.
The histogram derived from the data by Manoli [13] shows an almost Gaussian distribution (Figure 3) and the noise can, hence, be considered random. As a consequence, it would be possible to reduce the noise by averaging several data values at each measurement position (‘stacking’).
Poorly calibrated sensors may also contribute to noise in measurement data. If a gradiometer has a noticeable offset, a nonlinear response, or saturation, this will limit the detection capabilities of the instrument or even prohibit the detection of specific targets. For example, using the Bartington Grad-01-1000L probe with a recording range of ±100 nT, the 4.2 nT offset noticed in Figure 4 will induce an asymmetric response for high-level anomalies, and saturation (over-range) will introduce ‘plateau’ responses in the data.
If this deviation is changing over time, it is called a drift. Figure 2b shows the effect on stationary measurements with the Bartington probe. Some drift has unknown origins like that registered in Figure 4 around 40 s. However, thermal drift is a well-known effect for magnetometers and LFEM instruments where both the electronic components and the mechanical arrangement of sensors may change over time, thereby introducing drift-noise that needs to be taken into account. Gebbers et al. [14] reported changes of about 2 mS/m as an EM38 heated up from 22 to 32 °C over a summer day and an even stronger drop during cooling in winter. The thermal drift problem can be minimized by allowing a warm-up period of the instrument when switching it on in the field and by avoiding direct exposure to the sun. Thermal drift will usually induce long-wavelength anomalies and a nonzero offset in the data, which may be detectable in subsequent data processing steps.

3.1.2. Digitization Noise

The digitization of the voltage produced by the sensors may introduce additional noise in the digitally recorded data, both from the electronics of the analog-to-digital (A/D) converter and from the number of available digital steps, usually characterized by the bit count. The SNR of a particular bit count can be calculated as
SNRdB = 20 × log10 2n = n × 6.02
where n is the number of bits. For every additional bit in the A/D converter, 6.02 dB is added to the SNR so that a 16-bit converter has 96 dB and a 32-bit converter has 193 dB. To put these numbers into perspective: A/D converters would also have to deal with large signals, and if, for example, the sensors tested in Table 2 were to also measure signals up to 1000 nT, the SNR of the A/D converter would have to be 100 dB to recover the full range of data values, corresponding to approximately 16 bits.
For weak anomalies, the digitization noise may become noticeable. In their test, Linford et al. [6] found digital steps in the data for the Geoscan FM36 and Bartington Grad 601 of 0.05 and 0.10 nT, respectively. The external data acquisition device connected to the Bartington Grad-01-1000L showed greatly reduced steps of only 0.007 nT (an improvement by 23 dB), demonstrating the influence of the A/D system on this digitization noise. Using the manufacturer-supplied data logger for the Foerster Ferex Con650, the data of Manoli [13] show steps of 0.13 nT, which the external data acquisition device only reduced by 2 dB to 0.10 nT (Figure 2a). Hence, it can be concluded that this level is the electronic sensor noise.

3.1.3. Contact Resistance

Scollar et al. [8] provided an extensive review of the factors influencing earth resistance surveying including those related to the instrument and configuration used. Of particular concern is the transition of currents from the metallic electrodes into the soil, leading to a ‘contact resistance’ that depends on the quality of inserting electrodes into different types of soils with different water content and soil particle sizes. The use of four-electrode arrays together with earth resistance meters of high internal resistance (high impedance) helps to minimize this effect [15], but a slight noise level remains, especially if there is a large difference between the contact resistances at the two current electrodes. If this contact resistance were measured, it would be possible to correct for it using the theoretical calibration curves from the manufacturer. However, this is not usually done and, in electrical resistivity imaging (ERI), measurements that show a contact resistance above a specified threshold, are usually simply discarded.
Another unwanted effect of the electrolytic current flow in the ground (i.e., carried by ions) is the influence of polarization and self-potential on the measured voltages. This can be mostly avoided using polarity-switching DC current sources [15], but in highly polarizable soils, a small noise contribution may remain.

3.2. Use of Instruments

3.2.1. Spatial Resolution

Insufficient spatial sampling makes it more difficult to define the shape of anomalies and, thus, to interpret the causative archaeological features; therefore, it is a form of noise. The Shannon–Nyquist sampling theorem [16] states that the maximum distance between measurements should be less than half of the minimum wavelength of those anomalies that are to be investigated, the so-called Nyquist sampling rate. In addition, high spatial sampling intervals may also mitigate some instrument noise. Linford et al. [6] demonstrated with a synthetic example how the shape of a weak anomaly can be inferred from sensor data with random noise if the sampling density is increased. This can be explained with the increased spatial bandwidth of the denser sampling that allows (visual) low-pass filtering for the reduction in sensor noise. This is a spatial equivalent to the reduction in noise in stationary measurements through the averaging of individual readings (see Section 3.1.1). As fast data collection (e.g., with motorized systems) prevents such stationary averaging, spatial averaging of densely sampled data can help to reduce instrument noise. Collecting all data at high spatial resolution and then processing them in two dimensions (2D) to reduce the noise is preferable over averaging the same readings while sensors are moving (1D averaging), as the two-dimensional spatial averaging after data acquisition can incorporate 2D information in the process and delivers better results.

3.2.2. Orientation of Instrument

Slight changes in the orientation of instruments together with the direction of the acquisition profiles can lead to noise in the data. This is usually referred to as ‘heading error’ and is well-known in magnetometer surveys. This problem describes the change in the readout when the orientation of a sensor is changed in a constant magnetic field. It is either inherent in the physics of the sensors used (for example, the ‘dead-zones’ of optically pumped, and, to a lesser extent, of proton-free, precession and Overhauser magnetometers) or is caused by the magnetic permeability of materials within the instruments and alignment of sensors when using fluxgate gradiometers [17]. This type of noise is often characterized by a peak-to-peak envelope value or by a plot provided by the manufacturer showing the variation in readout as a function of direction. Unfortunately, there are also external factors influencing this behavior (e.g., the position of batteries), so these idealized plots are of limited use for field surveys.
Figure 5 shows the results of magnetometer measurements at a fixed position where the same instruments investigated in Figure 2 were rotated about their vertical axis. It can be seen that this noise is of the order of 5 nT and, thus, very high compared to the noise without rotating the sensor (displayed as the trace that is centered on 0 nT). The ratio is of the order of 1:100, or 40 dB.
Some manufacturers have devised a process for minimizing the heading error at the beginning of a survey by calibrating the instrument with measurement in three orthogonal directions over a fixed position [18]. To minimize the heading error, it is advisable to retain a single direction of acquisition in the field, possibly even keeping the magnetometer probe pointing in the same orientation whatever the profiles’ directions. Compared to manual data acquisition, calibration of sensors and single orientation profiles is much more difficult with mobile platforms where the direction of profiles is constrained by the maneuverability within the field.
A source of orientation noise that can be minimized by conscientious survey practice is due to sensors swinging back and forth while being carried or mounted on a cart. Although often periodic, this effect is more difficult to isolate than periodic height variations (see Section 3.2.3) and should be minimized by holding instruments very steadily during manual surveys or, when using a sensor platform, either mounting them rigidly or using a dampened pendulum system [19].
Noise that is linked to the orientation of sensors or profiles can also be found in LFEM surveys (e.g., when using coils with specific orientations) [20,21,22,23] or in earth resistance surveys (e.g., with specific electrode array configurations). Compared to the magnetic case, however, it is not the sensor itself that causes the noise but the anisotropic response of buried features relative to the geometry of the sensors. There are no simple methods to correct for these effects.

3.2.3. Height Variations of Instrument during Survey

Height changes of the sensors created by the walking of the operator or by the roughness of the field when moving a mobile platform can induce noise that has several components: Variations in the primary field strength sent into the ground (LFEM), variations in the measured resultant field (magnetometer and LFEM), changing of time-zero (GPR), or variation in the electromagnetic coupling (for ground-coupled GPR). Correcting for this noise is sometimes possible in postprocessing, if ancillary information about the sensors’ height and their movement exists.
Linford et al. [6] evaluated the effect of a fluxgate magnetometer’s height variations during a survey with a field test. A single profile in an area with little magnetic variation was measured with different methodologies: With the instrument held stationary at each measurement position, manually carrying the instrument, and mounting it on a cart. Using the instrument on a cart resulted in the same noise level as found in the stationary data, but when the instrument was carried by hand, the noise increased by 0.08 nT. This change would be bigger for a higher magnetic susceptibility of the topsoil and also depends on the nature of the height variations. The most common form of height variation in manually carried instruments is due to the operator’s gait and, therefore, exhibits a periodicity commensurate with the step-size (ca. 0.8 m), especially for very consistent walking. Less systematic height variations are induced by the roughness of the ground and, especially on recently plowed fields, the plow lines may have an imprint on the data due to these height changes. The latter effect can also be observed in data from sensor platforms. There, vibrations or periodic movement caused by resonance of the cart may be observed, and this noise is difficult to remove [24].

3.2.4. Positional Noise

In order to analyze geophysical anomalies, the exact position of each measurement has to be known. ‘Positional noise’ is introduced if the recorded position of a measurement is different from its actual position and can have many different origins. In surveys with manually carried instruments the operator may walk with slightly varying speed, they may deviate from a straight line, or the instrument may be consistently offset from the intended recording position (e.g., by aligning the operator, not the sensor, with the relevant markers). The latter would show in the data as staggering or shearing of anomalies from one survey transect to the next. Some of these problems can be overcome by using a survey-wheel (odometer) that is carefully calibrated and for which the offset between sensors and the whole survey system is determined well. The latter information is also necessary for systems that record automatically the position of the survey system at regular intervals, either using satellite navigation (GNSS) devices or robotic Total Stations. These devices may suffer from poor time synchronization between the geophysical data acquisition and the positioning system, especially on fast mobile platforms where the data acquisition rate can be considerably higher than the positional recording rate. Other delays may be due to telephone links for network real-time kinematic (RTK) measurements, or time lags due to the time needed to process and send positional information to the recording device [25,26]. For archaeological prospecting, these positioning issues limit the spatial coherence of anomalies and introduce blurring or shearing that is particularly pronounced for small anomalies (0.1–0.2 m in one dimension). This may hamper their interpretation or even make some archaeological anomalies unrecognizable. For example, Figure 6 shows the earth resistance survey of a Gallo-Roman temple recorded with the ARP® device and differential global positioning (dGPS) [27]. The dGPS errors are indicated with circles in Figure 6a, while Figure 6b shows the earth resistance data when processing the dGPS corrections using only the code signal. If code-with-phase are taken into account (Figure 6c) the data are improved markedly (see for example the outlines of the room in the north-eastern corner). Figure 7 demonstrates the pronounced effect that synchronization issues can have on data collected at high speed.

3.3. External Disturbances

The most obvious unwanted components in a data set, and hence noise, are those originating from features that are not relevant to a particular site’s archaeological investigation. They can manifest directly in the data as feature-anomalies (e.g., clay pipes that were buried for drainage or metal fences above ground) or they may have an indirect and adverse effect on the geophysical measurements through their presence (e.g., reflecting GPR air waves).

3.3.1. Nonarchaeological Features

In order to characterize the signature in the geophysical data of anomalies from unwanted features, it is useful to distinguish them in terms of their size: Very small features embedded in the soil (e.g., iron bolts from agricultural machinery), features of similar size and shape as the archaeological features of interest (e.g., clay pipes), and very large structures (e.g., large blocks of igneous geology). While the first and third category can sometimes be ignored based on their size when analyzing the geophysical data, features of archaeological sizes are usually more difficult to exclude. However, as discussed in Section 2, the distinction between signal and noise has to be made individually for each site. Some small features (e.g., nails, see Figure 1) may be archaeologically relevant, and even large features, like palaeochannels, may have archaeological significance, for example, if they formed the natural settings for ephemeral settlements.
In magnetic and LFEM surveys, ferrous artifacts are often encountered that are incorporated into the ground. In arable fields, these can be metal parts that have fallen off agricultural machinery, like bolts, rusty parts of body work, or similar small components. As these tend to be sparsely distributed, they are often only an inconvenience. Far more problematic is the increasing use of ‘green waste’ in agriculture, which is the industrially composted residue from household waste that is spread as fertilizer over large areas. As it can contain a considerable proportion of small ferrous remains, its negative impact on archaeological magnetometer surveys has been shown to be considerable [28]. Green waste may degrade the signal-to-noise ratio or even mask completely the signals below the topsoil horizon.
Modern structural features such as clay or iron pipes for irrigation and drainage, pipelines, or fence foundations can be found frequently in the ground producing unwanted noise in the geophysical measurements (Figure 8). Upstanding features, such as metal fences and even overhead telegraph and power lines, can pose similar problems. For the latter, the ferrous wires that are added for strengthening the free-hanging cables can be a problem, especially where the mechanical tension in such a cable is so low that its lowest hanging part may create spurious anomalies.
Intense geological trends, especially when originating from variations in highly magnetic bedrock, are often seen in magnetic measurements. Even outcrops of magnetized bodies, enriched in maghemite or hematite that are close to archaeological sites, can obscure weak archaeological signals (Figure 9). Especially if small archaeological anomalies are superimposed over broad geological trends, postprocessing can sometimes help to suppress the latter.

3.3.2. External Features Affecting the Data

Overhead power lines may impact sensitive equipment, like optically pumped magnetometers [32] or frequency-domain electromagnetic devices (LFEM and sometimes GPR), through the currents that flow in them. Hence, it can be useful to record the location of these power lines when undertaking geophysical surveys.
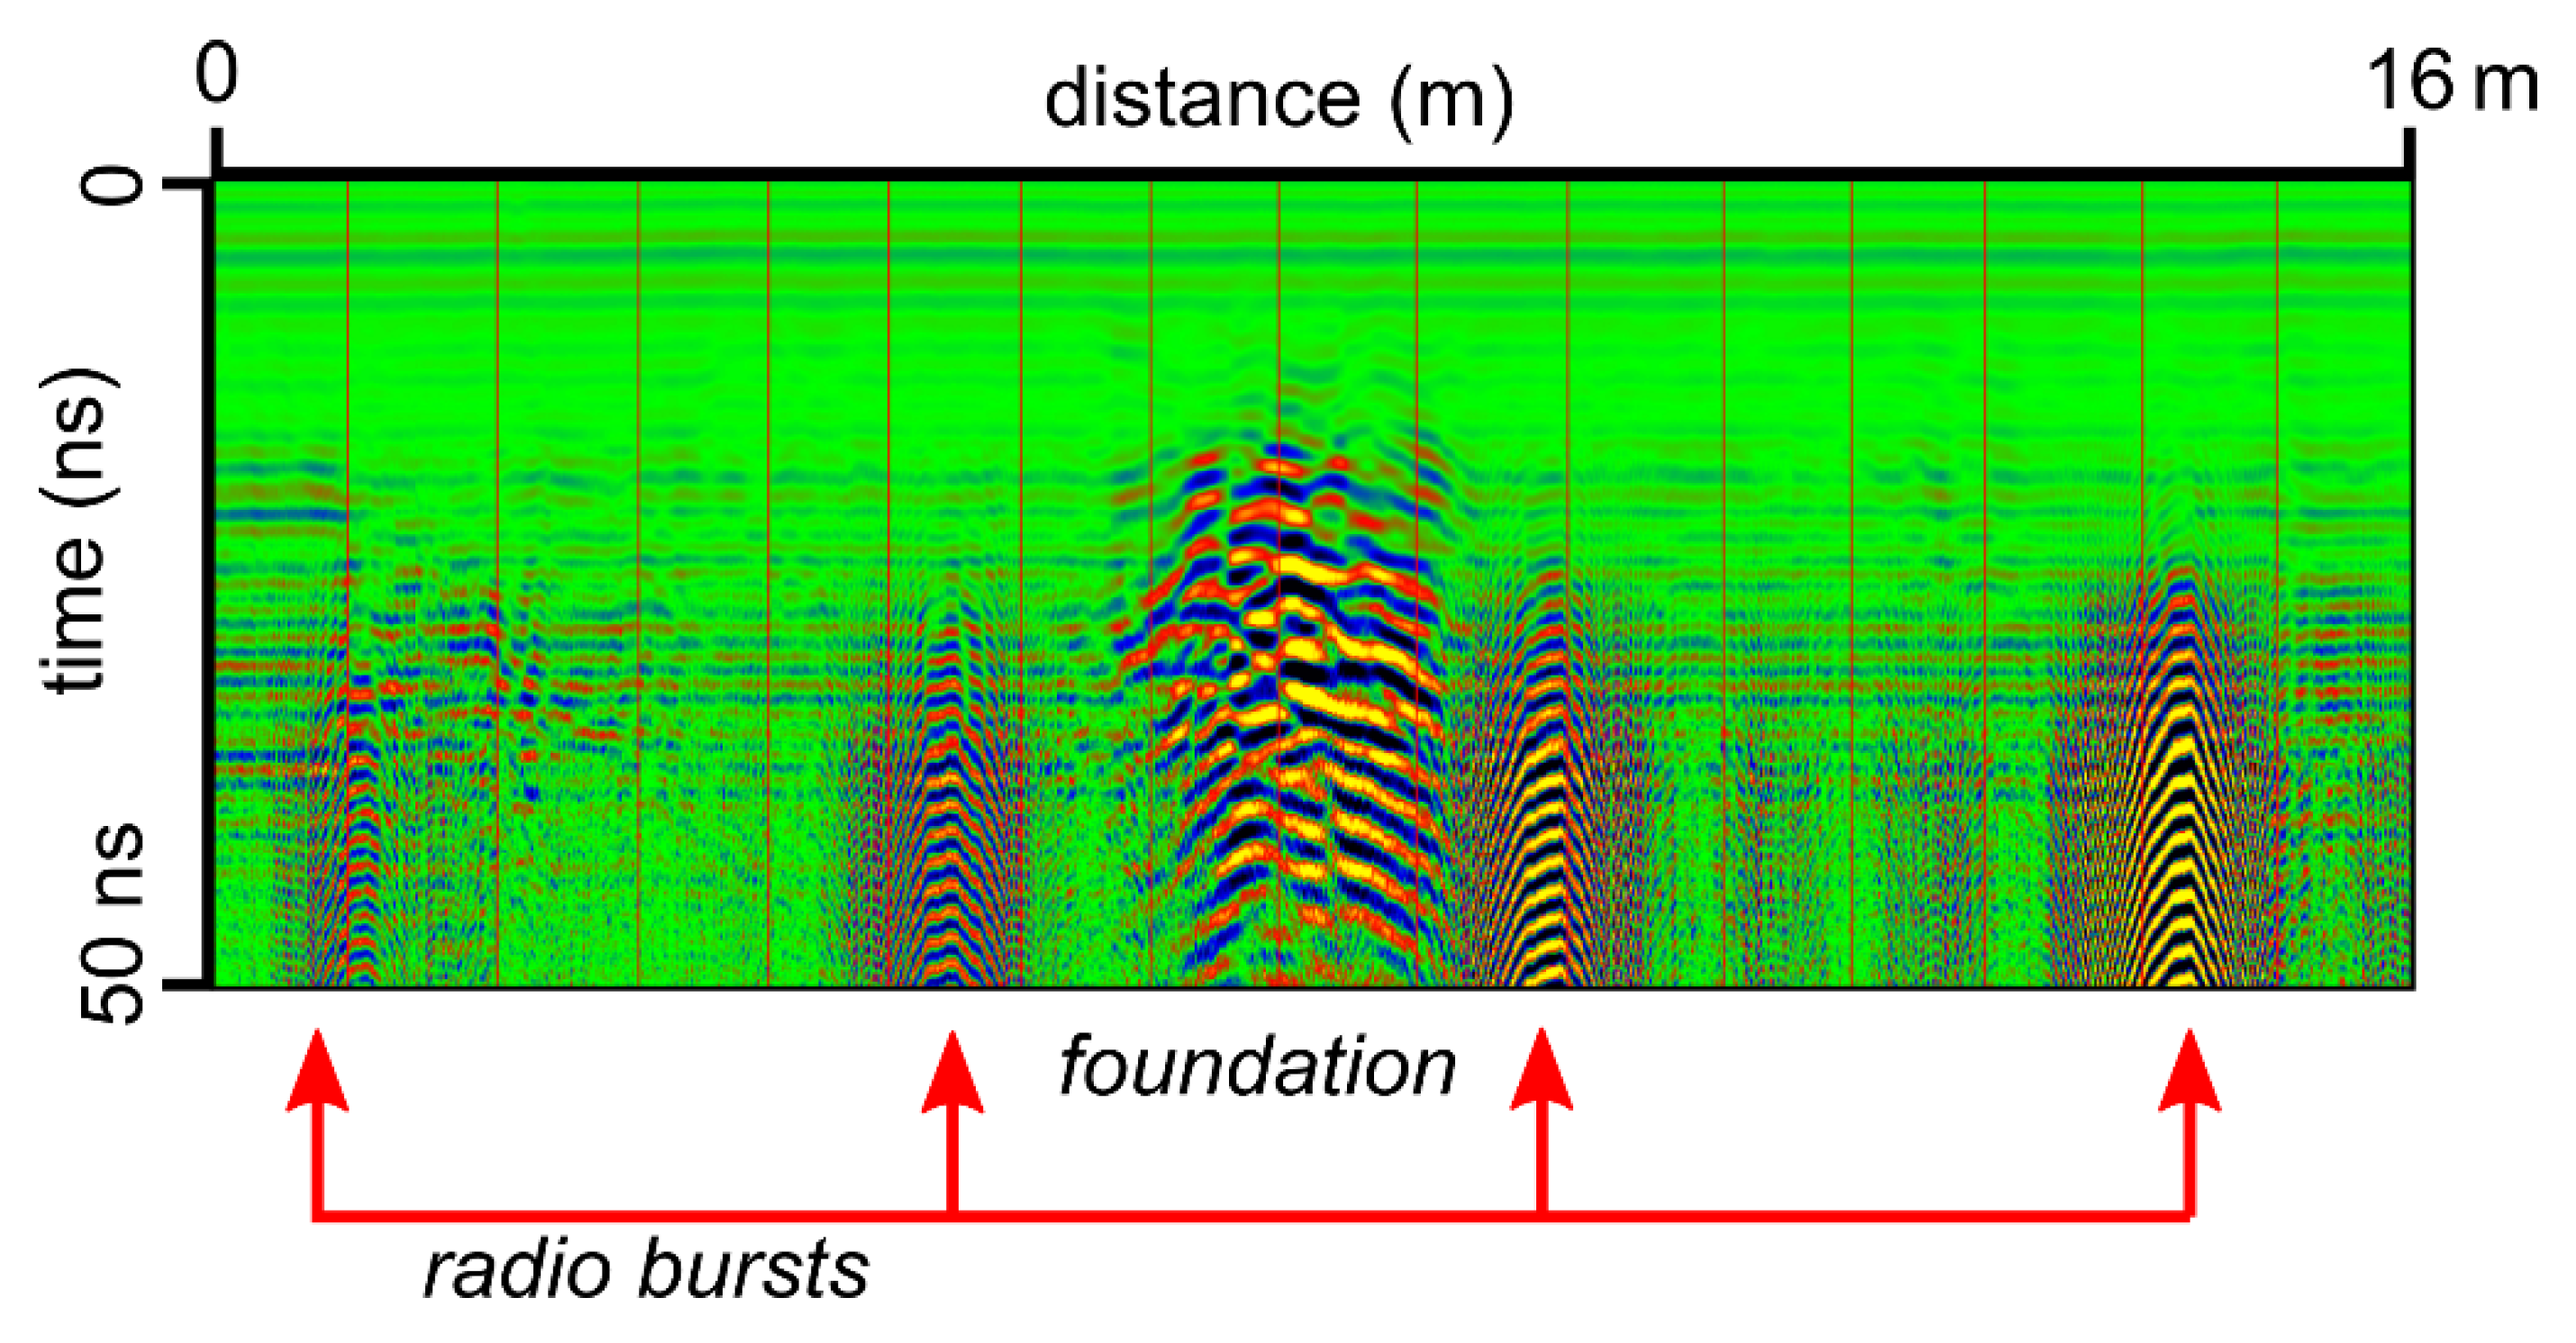
Modern infrastructure, overhead cables, corrugated iron roofs, walls, trees, and cars can all interfere with GPR measurements. As the electromagnetic radiation generated by the transmitter antennas also partly propagates into the air, close-by features on the surface can generate secondary reflections that register in the receiver antennas (‘air-waves’). The effect is worst if unshielded antennas are used [33], but can even be seen for well-shielded antennas, if the external reflectors are strong enough, for example, from a corrugated iron roof that acts as a reflector (Figure 10).
In GPR surveys, initial tests have shown that the effect of air waves can be greatly reduced if multi-offset measurements were to be made [33]. For commercially available systems, this would require several individual measurements at each survey location and, hence, a considerably increased survey time. However, it is possible to design antenna arrays that allow not only spatially dense surveys, but also the recording of multi-offset data, and such systems could reduce these noise levels considerably.

3.3.3. Other External Sources

In addition to these unwanted features, there are other external influences that can affect the measured data in undesired ways. Eppelbaum [35] classified a variety of these sources with an emphasis on geophysical potential-field methods.
Magnetic data can be influenced considerably by natural causes. The time variations in the geomagnetic field constitute the most severe perturbations that can introduce various distortions to magnetic measurements. These temporal fluctuations are either slow (secular variations) caused by changes in the circulation patterns within the earth’s core, daily varying (diurnal) due to the relative orientation between the earth and sun, or abrupt and of short duration when they are caused by magnetic storms emanating from the sun. At mid-latitudes, diurnal variations lie within the range of ±1–50 nT, reaching a maximum during noon and a minimum around midnight. By contrast, magnetic storms are associated with sunspot activity (usually with a 27 day cycle) and show random and unpredictable behavior that may last for a few seconds or up to a few hours. According to Macmillan and Reay [36], magnetic storms can have a very high intensity (over hundreds of nT) within a period of minutes. Based on an analysis of 34 magnetic storms, Carrier et al. [37] concluded that about 90–100% of them having a Kp index (planetarische Kennziffer) ≥ 5 will produce such signatures that will jeopardize the interpretation of the signals and could be mistakenly identified as archaeological features. To compensate for these effects, magnetometers are usually employed in a gradiometer configuration with at least two sensors, because these external signals affect all sensors equally and only the shallow archaeological features will produce different signal strengths in the sensors. However, it is possible that an abrupt gradient change due to a magnetic storm can also register in a gradiometer, either due to the nonlinearity of the signal-to-voltage conversion or due to the inhomogeneous saturation of the sensor cores in a fluxgate gradiometer.
Another unpredictable source of noise in underwater magnetic surveys is due to the so-called ‘ocean effect’, namely the generation of electromagnetic induction and associated magnetic fields by the movement of sea currents and waves [37,38].
Earth resistance and LFEM measurements are susceptible to underground earth currents, mainly originating from modern power utilities or in the form of geomagnetically induced ground currents (GICs) caused by magnetospheric and ionospheric currents usually during extreme magnetic storms [39]. For electrical surveys, four electrodes are required for the measurement of the earth resistance [15], and the magnitude of the noise due to underground currents increases with the separation of the potential electrodes and the associated volume of soil that is being sampled. It has been found that the twin probe array, which has a large separation between the potential electrodes, can be affected severely by ground currents that may be induced by high-voltage underground AC cables or by strong radio or radar transmitters from nearby signal masts or airports. By contrast, electrode arrays that have a small separation between the potential electrodes, such as Wenner, square, and Schlumberger, experience negligible interference. Figure 11 shows the comparison of data acquired with a twin-probe and a Wenner array from the site of the vicus at the Roman Fort at Slack, UK. The former is severely affected by a nearby radio transmitter, whereas the latter has a far lower noise level and shows some of the underlying roads (east–west).
In a recent study, Aye et al. [40] indicated that overhead cables with electrical charge or radio wave frequencies from nearby broadcasting antennas can be easily registered by shielded GPR antennas and even mask the hyperbolas originating from features at shallow depth. In addition, serious interference has been reported by the use of mobile phones (both in standby mode and while talking) that operate close to the frequency range in which GPR antennas are sensitive, and by HDTV broadcasting at frequencies close to the 500 MHz range [41,42]. Similar conclusions have been drawn by Conyers [43], who proposed a number of filtering techniques for removing the particular high-frequency noise from these sources. The time-varying nature of such signals and from remote power masts can introduce unwanted artifacts in the data that initially may resemble reflection hyperbolas, but on closer inspection, their different signature can usually be established [44] (Figure 12).

3.4. Soil Noise

While on a meter to decameter scale, soil may appear to be fairly homogenous, for example, due to long-time agricultural activity, on a submeter or decimeter level, it is usually highly variable, containing inclusions (e.g., small pebbles), areas of compacted clods interspersed with loose soil [46], and stratigraphic layers that can be distinguished through geoarchaeological methods (e.g., soil micromorphology [47]). This variability in soil creates corresponding variations in its geophysical soil parameters (e.g., magnetic susceptibility) and, therefore, also small changes in geophysical surface measurements (e.g., in magnetometer surveys). Such variations in the ground are of considerable interest to soil scientists who have, therefore, used densely sampled geophysical surveys for their study [48]. For such investigations, the changes created by archaeological features would be considered long-wavelength noise, in the same way that geological anomalies may be undesirable in archaeological geophysical surveys. For archaeological investigations, soil noise is an additional contribution that may initially appear to be similar to the random noise from instruments. When examining geophysical data at distances larger than typical soil variations (e.g., at geophysical recording positions of the order of 0.1–0.2 m), the slight variations in the measured data may appear unpredictable. However, if data from very closely spaced positions could be examined (e.g., 0.01 m), they would show considerable similarity. Using the terminology discussed in Section 2, soil noise can, therefore, be considered to be correlated [3] or coherent and not random. As the temporal variations in soil characteristics are considerably slower (e.g., variations in soil mineralogy and effect on soil magnetic susceptibility) than the times needed for a geophysical investigation (some time-varying effects are discussed in Section 3.4.5), repeat measurements would theoretically result in the same geophysical data, if all other noise components could be avoided.
The distance below which changes in the data can be recognized as a result of continuous soil variations rather than unpredictable noise depends on the underlying ground. Soil that is well-mixed by plowing and pedogenic processes will appear homogeneous over a wide range of distances, and abrupt changes would only be noticeable at the boundaries between individual soil particles. Stone inclusions would show consistent data over the size of such stones and an abrupt change would appear at their edges. Soil clods would result in similarly consistent data over a range of about 0.1–0.3 m, with a gradual change in the looser soil in between them. Using geostatistical methods, it may be possible to estimate these characteristic distances (see Section 4).

3.4.1. Magnetic Surveys

For magnetometer surveys, two different types of soil variations will lead to small changes in the geophysical measurements, namely small-scale variations of magnetic parameters (induced and remanent magnetization) and small changes in a soil’s topographic surface (its interface with air). Graham and Scollar estimated that in a soil mixed by repeated plowing, the variability in magnetic susceptibility is 10% [3]. Even these small variations will produce magnetic anomalies, albeit with small amplitude variations. While on a decimeter scale, these changes would still be detectable as anomalies attributable to individual areas of soil, at coarser sampling intervals, they would appear to be unpredictable variations as their short-distance coherence would not be visible. The clods that are found in agricultural ground consist of strongly compacted soil and, therefore, have a higher volume-specific magnetic susceptibility than the surrounding looser soil, even if the soil particles may incorporate exactly the same magnetic minerals. Separately, if the magnetic properties of a soil were completely homogeneous and isotropic, small changes in surface topography (e.g., after plowing) would create weak anomalies as the interface between the magnetic soil and air forms small ridges and valleys. The strength of these small-scale anomalies increases with higher soil magnetic susceptibility. These two effects (soil variability and changes in the small-scale topography) usually occur simultaneously and are, hence, difficult to disentangle.
Raising the magnetometer to a higher distance above ground may help to attenuate the noise due to topographic surface variations. Even though Scollar [49] suggested that the sensor height should be about half the stepping interval (0.3–1.0 m) above the surface, this is not usually the case for most modern surveys, especially not those using sensor platforms. Hence, soil noise may be noticeable in magnetometer surveys.

3.4.2. Contact Resistance

Similar to the magnetic case, any change in the soil’s texture and porosity has direct consequences for the moisture retained and, therefore, also for the measured earth resistance, introducing soil noise. In addition, such soil changes may also result in additional contributions to high and variable contact resistance (see also the instrument-related effects discussed in Section 3.1.3). Dry, sandy, or porous soils, together with rocky terrain, are responsible for creating high contact resistances. This effect can be experienced close to coastal beach areas, where the gradual change in soils toward sandier textures creates a shift toward higher values of resistance. However, contact resistance can also be used as the actual signal from which to derive archaeological information. Tetegan et al. [50] used contact resistance noise to analyze the volume proportion of the stony phase in a heterogeneous soil. They based this study on the hypothesis that the noise in earth resistance data increases as the proportion of rock fragments increases. A model was developed that uses the standard deviation of apparent electrical resistivity measurements over a small area as an indicator of rock fragment contents. In their study, the estimation of this content proved to be accurate to about 6%.

3.4.3. Meter-Scale Topography

The vertical gradient of the geomagnetic field is only about −0.02 nT/m and, thus, the altitude effect of the geomagnetic field is negligible [51]. However, Linington [52] presented some special cases requiring elevation corrections, especially due to the abrupt changes in slope in the terrain within an archaeological site, and provided a summary of the corresponding correction techniques. In its simplest case, he suggested that repeating the measurements having the sensor at different heights above the ground can compensate for the sloping effects of the terrain, as the anomaly created by the slope decreases more slowly with distance than that due to a shallow feature [53]. Topography may also affect the distance between magnetometer sensors and underlying archaeological features, for example, where fluvial or colluvial material has covered parts of a site and recorded magnetic anomalies, appearing weaker in that area.
The effect of topographic changes on the performance of various earth resistance electrode configurations can be derived from first principles [54]. Similar problems are encountered in ERI measurements, especially when the ground surface changes along the electrode transects, as the distances between the electrodes will not be exactly identical, so the flow of the electrical current below the ground will be distorted [55,56]. Usually though, having good knowledge of the exact location of the electrodes is sufficient to correct for these topographic effects as the inverse modeling algorithms take this information into account. Fox et al. [55] suggested the use of a topographic correction factor (CF), whereas Tong and Yang [57] proposed a method based on the finite-element method, which is also used by Loke and Barker [58]. Giao et al. [59] compared the different topographic correction options offered by the RES2DINV software [60], indicating their importance in improving the interpretation of the ERI measurements.
Small variations in the surface topography of the terrain can also affect the propagation of EM waves in a GPR survey, as the transmitted EM waves usually travel perpendicular to the local ground surface, and if this is not taken into account, calculated depth slices could show a distorted image of the ground. This is most obvious in rough, rocky terrains or in surveys of abrupt or even smoothly sloping (>10%) geomorphological features [25,61], such as tumuli and mounds [62]. For smooth topographic variations, a static-shift correction may be sufficient, similar to seismic surveys [11]. In other cases, the mapping of the topographic terrain through GNSS or a robotic Total Station can be used to associate each GPR measurement with the correct 3D terrain coordinates. This is the most direct method to account for the slope corrections of the ground and was suggested by Prokhorenko et al. [63] using an odometer and an inclinometer based on a 3-axis analog accelerometer. A 3D topographic correction after migration and time-to-depth conversion has also been developed by Leckebusch and Rychener [64] to deal with the antenna tilt and elevation differentiations. This has been an upgrade to the 3D topographic Kirchhoff migration algorithm [61] and the tilt correction along the direction of the GPR transect. In cases where an elevated antenna is used, Feng et al. [65] proposed a topographic correction to the data based on a velocity model that is estimated through the elevated common midpoint (CMP). In general, post-acquisition processing is capable of correcting some of these issues.

3.4.4. Unwanted Features in the Soil

Small ferrous items may have become embedded in the soil (e.g., agricultural debris) and produce their own geophysical anomalies; these were discussed in Section 3.3.1 as external disturbances. By contrast, some remnants of past human habitation may eventually form part of the soil matrix, for example, the remains of unfired clay bricks or collapsed buildings made from wattle and daub, with a thatched roof. These anthropogenic features are part of the archaeological record, so they may be of interest, but they may also be masking underlying remains and, hence, be undesirable soil noise.
Linford et al. [6] investigated a suspected Roman building that was obscured by areas of magnetic noise. This noise manifested itself through very weak data correlation between adjacent positions. Applying a modified version of convolution masks [66], it became possible to highlight areas in the constructed ‘noise maps’ that could be interpreted as unstratified ceramic Roman building materials in the plow soil. Based on this identification, a subsequent earth resistance survey revealed the foundations of Roman buildings in this area that were hidden by the magnetic noise from the scattered material.
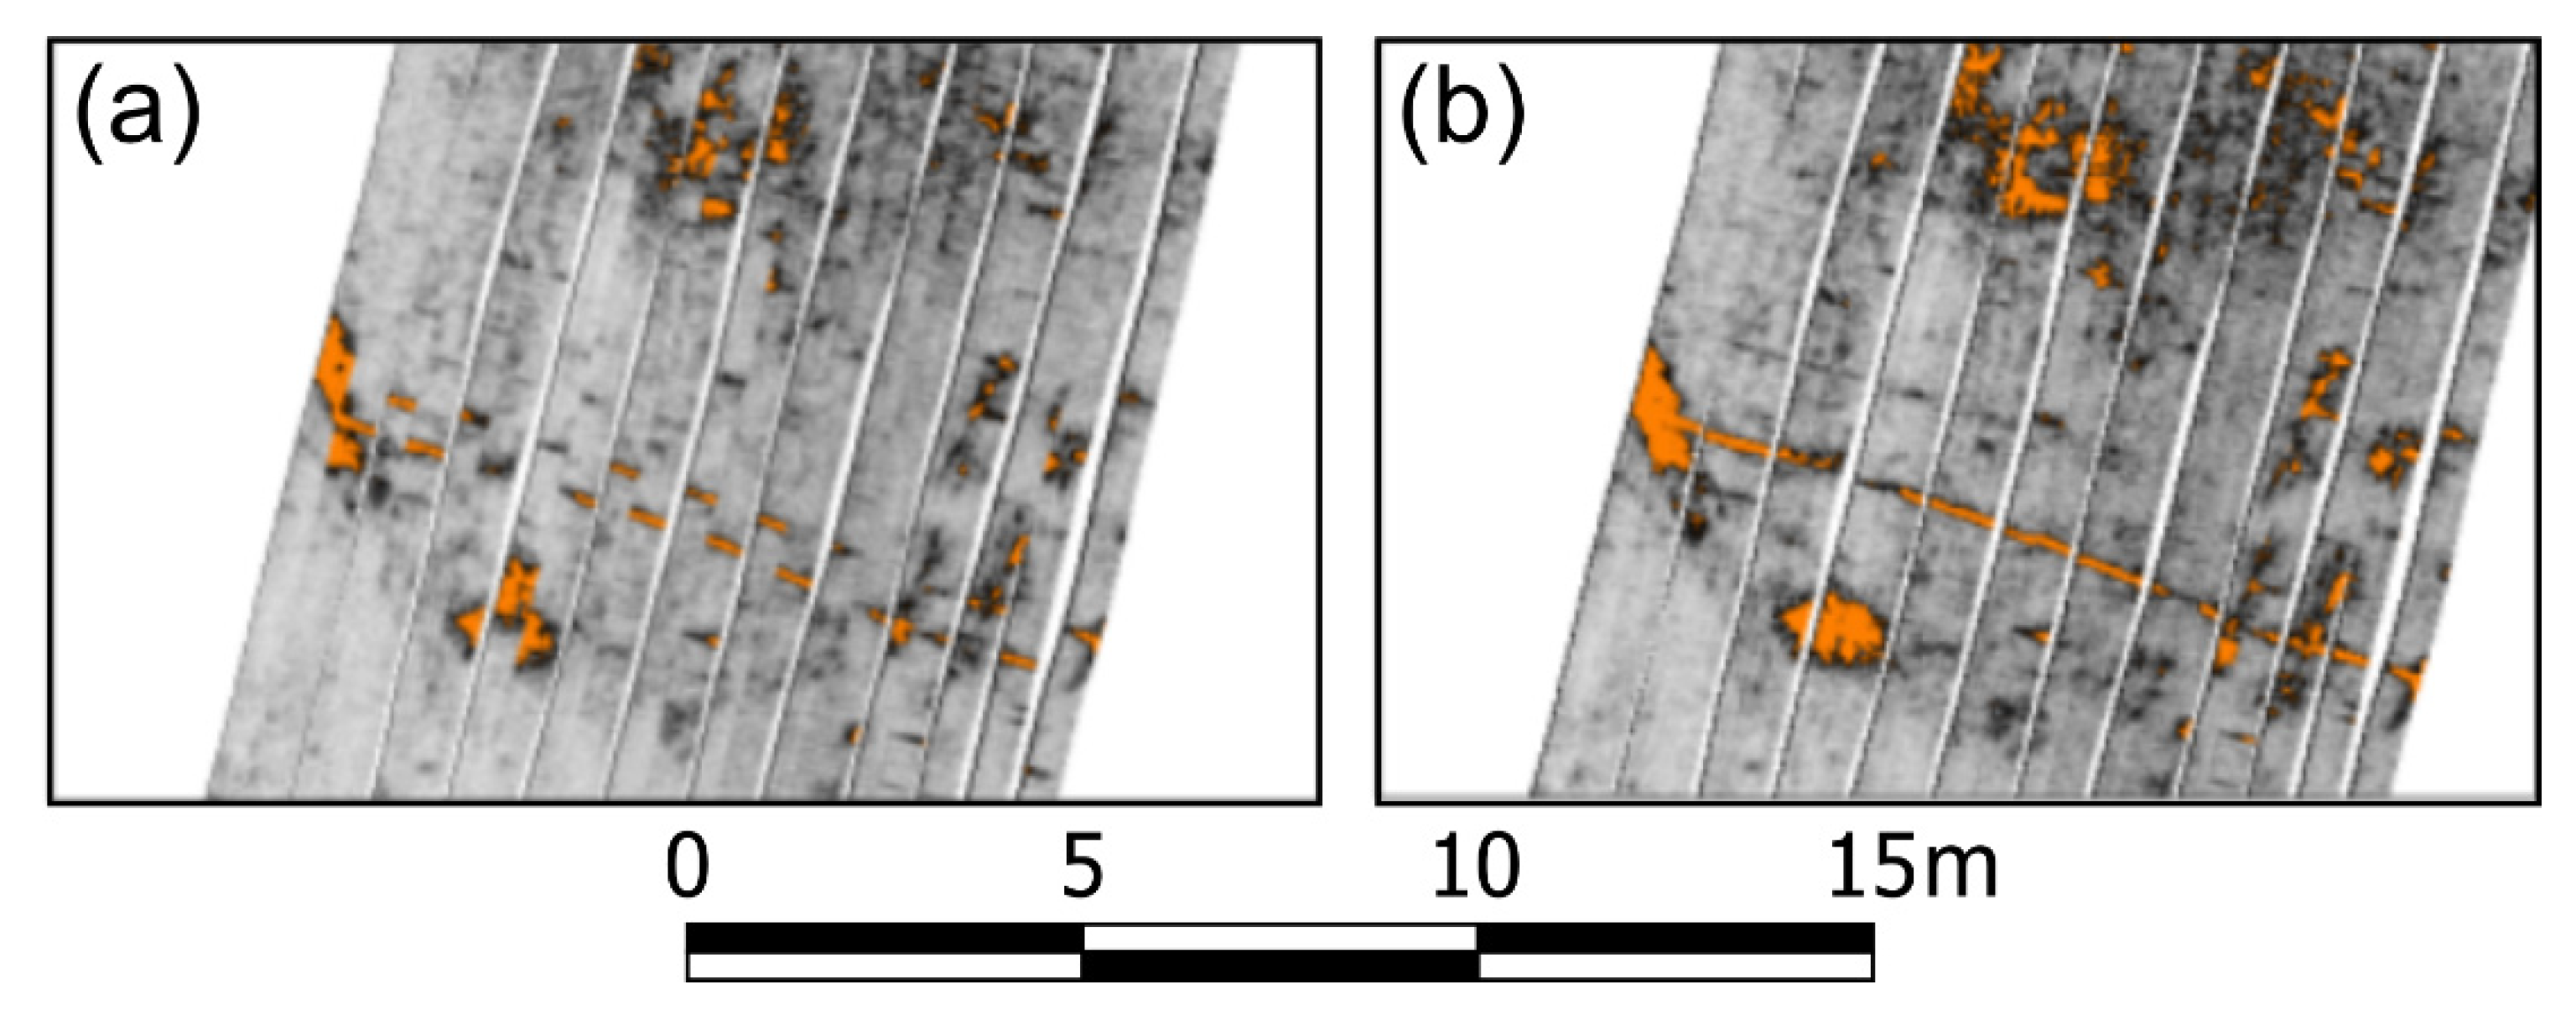
A similar situation was found at Eidomeni in northern Greece where a dense scatter of cultural material (daub and tile) was gradually becoming part of the topsoil through natural processes (e.g., dissolution by rainwater). It was creating a lens that obscured the geophysical detection of features (Figure 13) below this upper soil horizon [67].
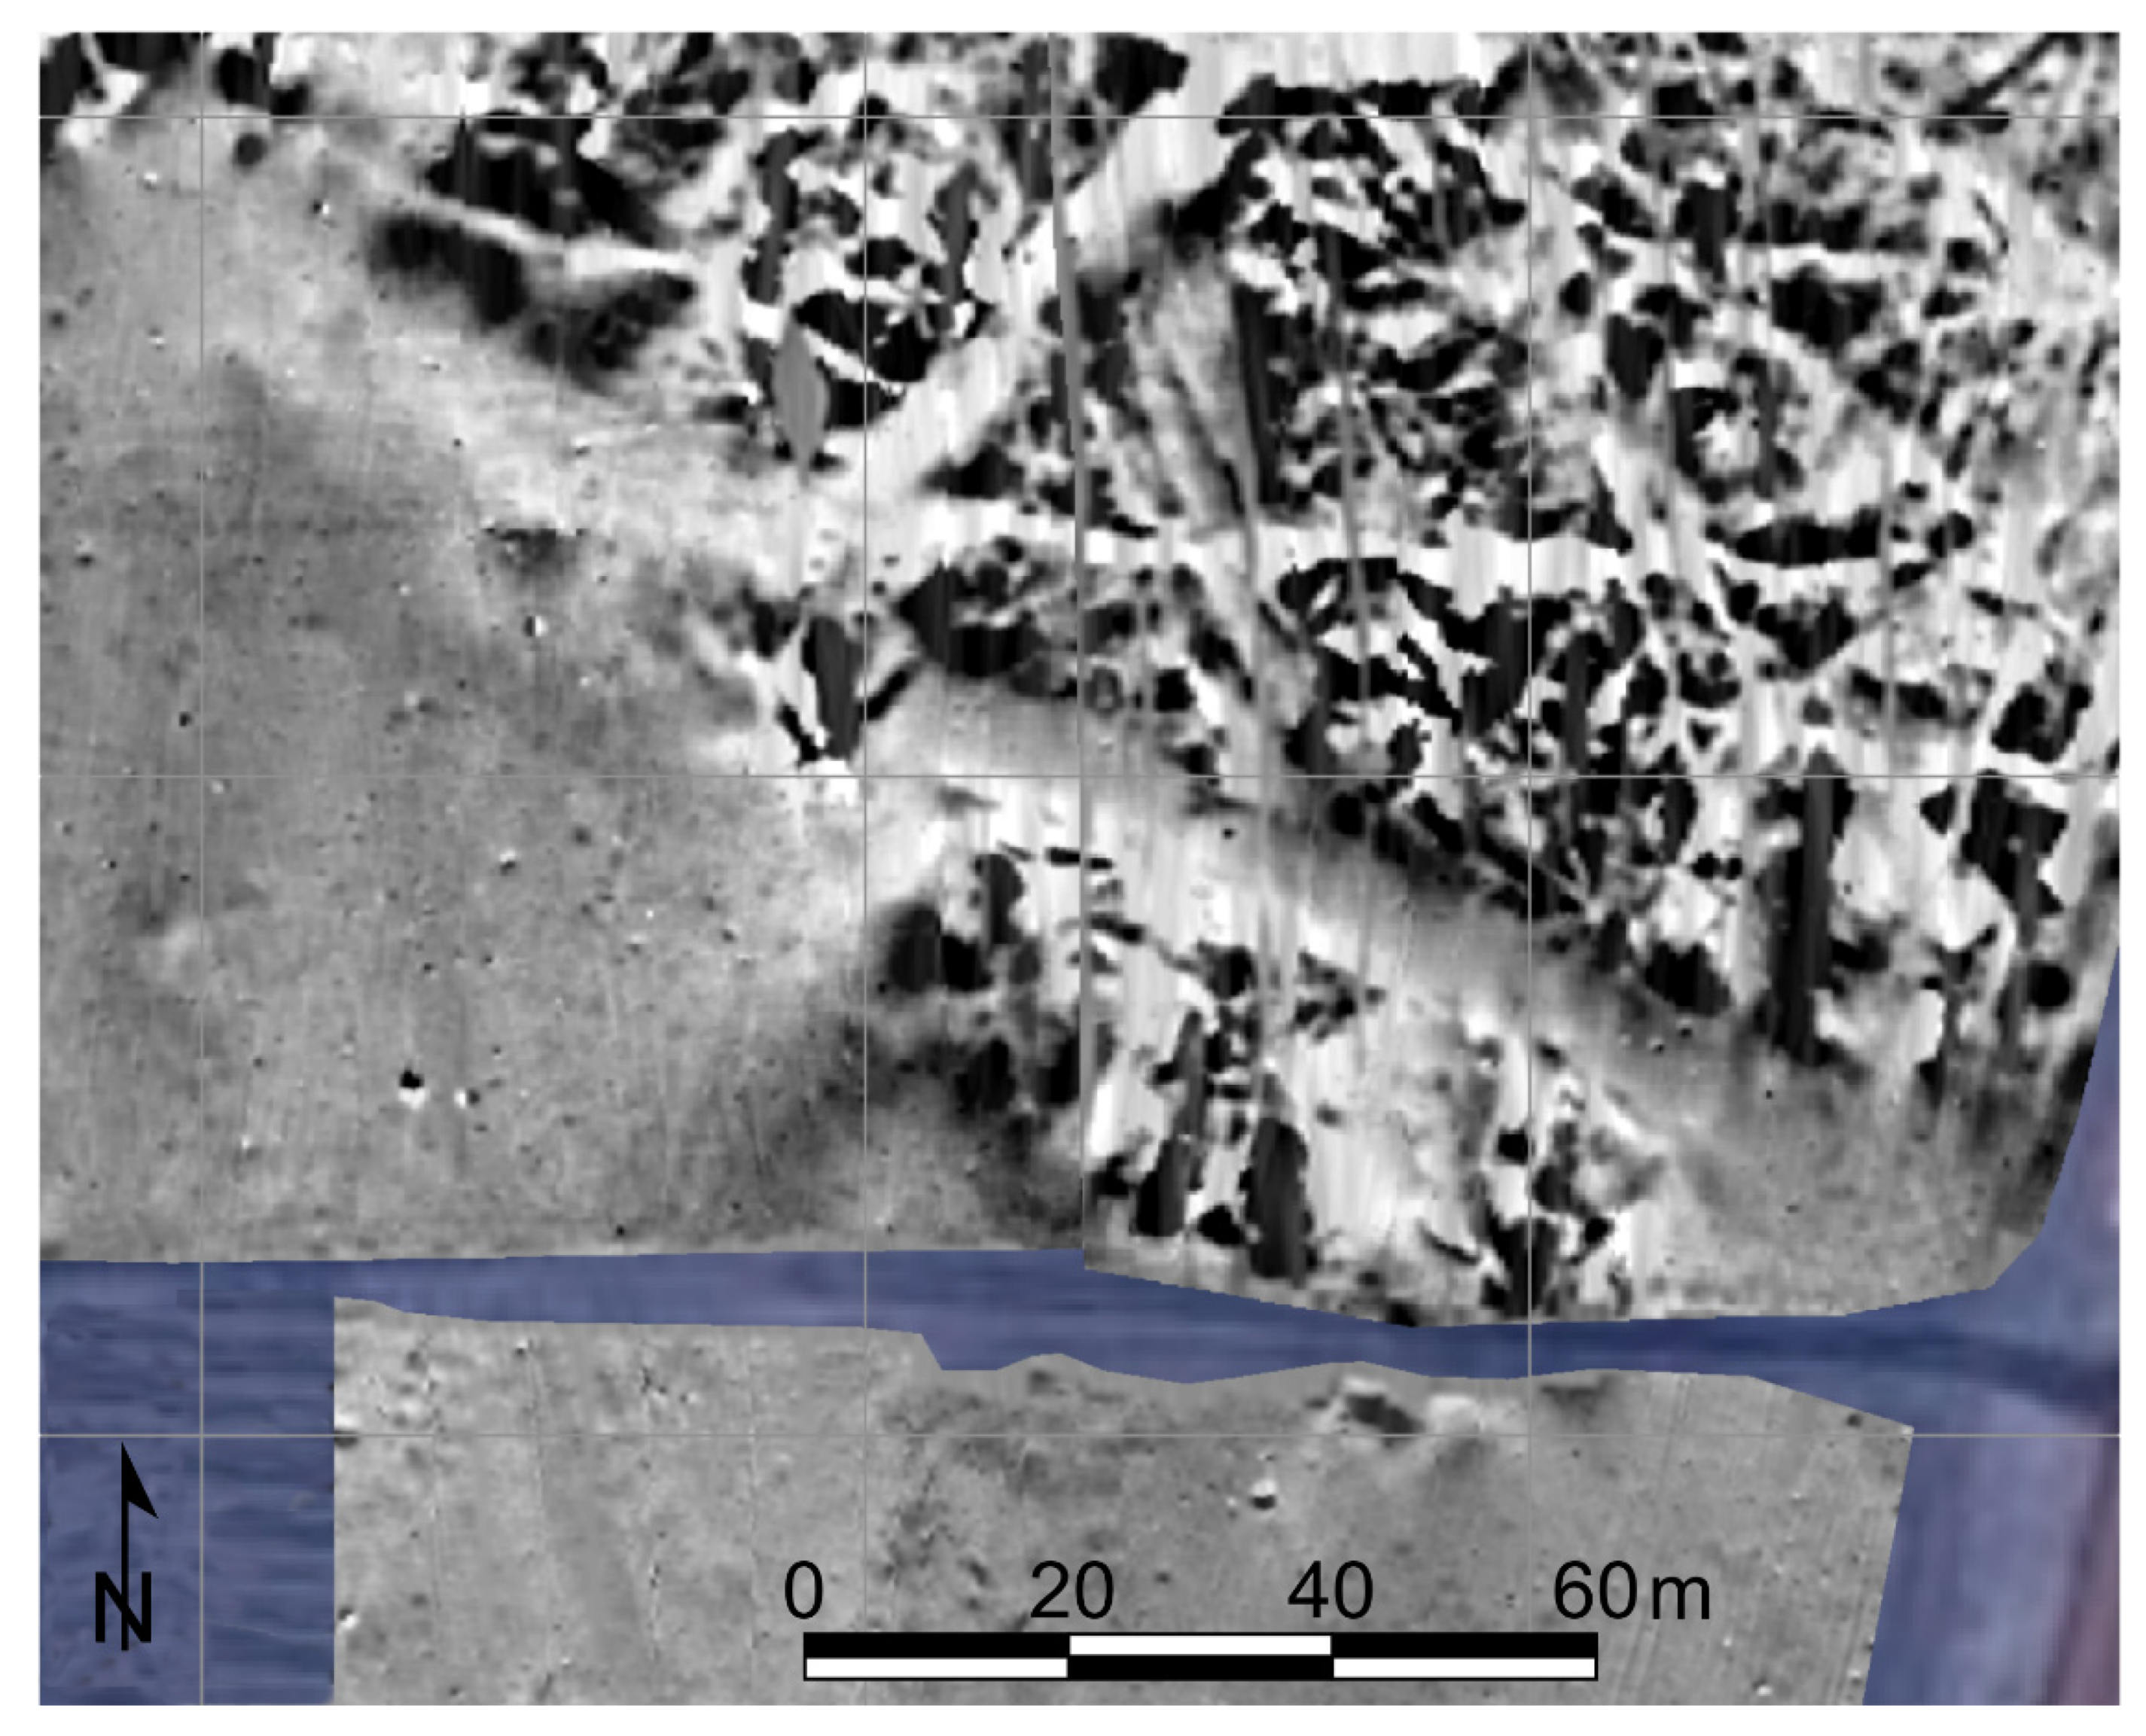
Other prominent unwanted data in soils are lightning induced magnetic anomalies. Lightning strikes can generate electrical currents as a result of the discharge of positively charged clouds towards the negatively charged earth’s surface [68]. As a result the soil may acquire lightning-induced remanent magnetization (LIRM) creating magnetic anomalies of a characteristic shape, described as stars, spiders or sea urchin (see Figure 14). The ‘branches’ of these anomalies emanate from the position of a lightning strike with the characteristic signature of a longitudinally magnetized feature [69]. Such magnetic anomalies have been detected by various authors [70,71,72,73,74] and their intensity can reach several thousand nT. Figure 14 also shows anomalies created by palaeochannels in the survey area. Whether these, or other anomalies caused by ancient landforms, are considered archaeologically relevant or unwanted and hence noise will depend on the specific survey objectives. For example, if the main focus of an investigation is the detection of architectural remains, or if the geomorphological features are meanders of a still-active river bed that may have eroded all settlement traces.
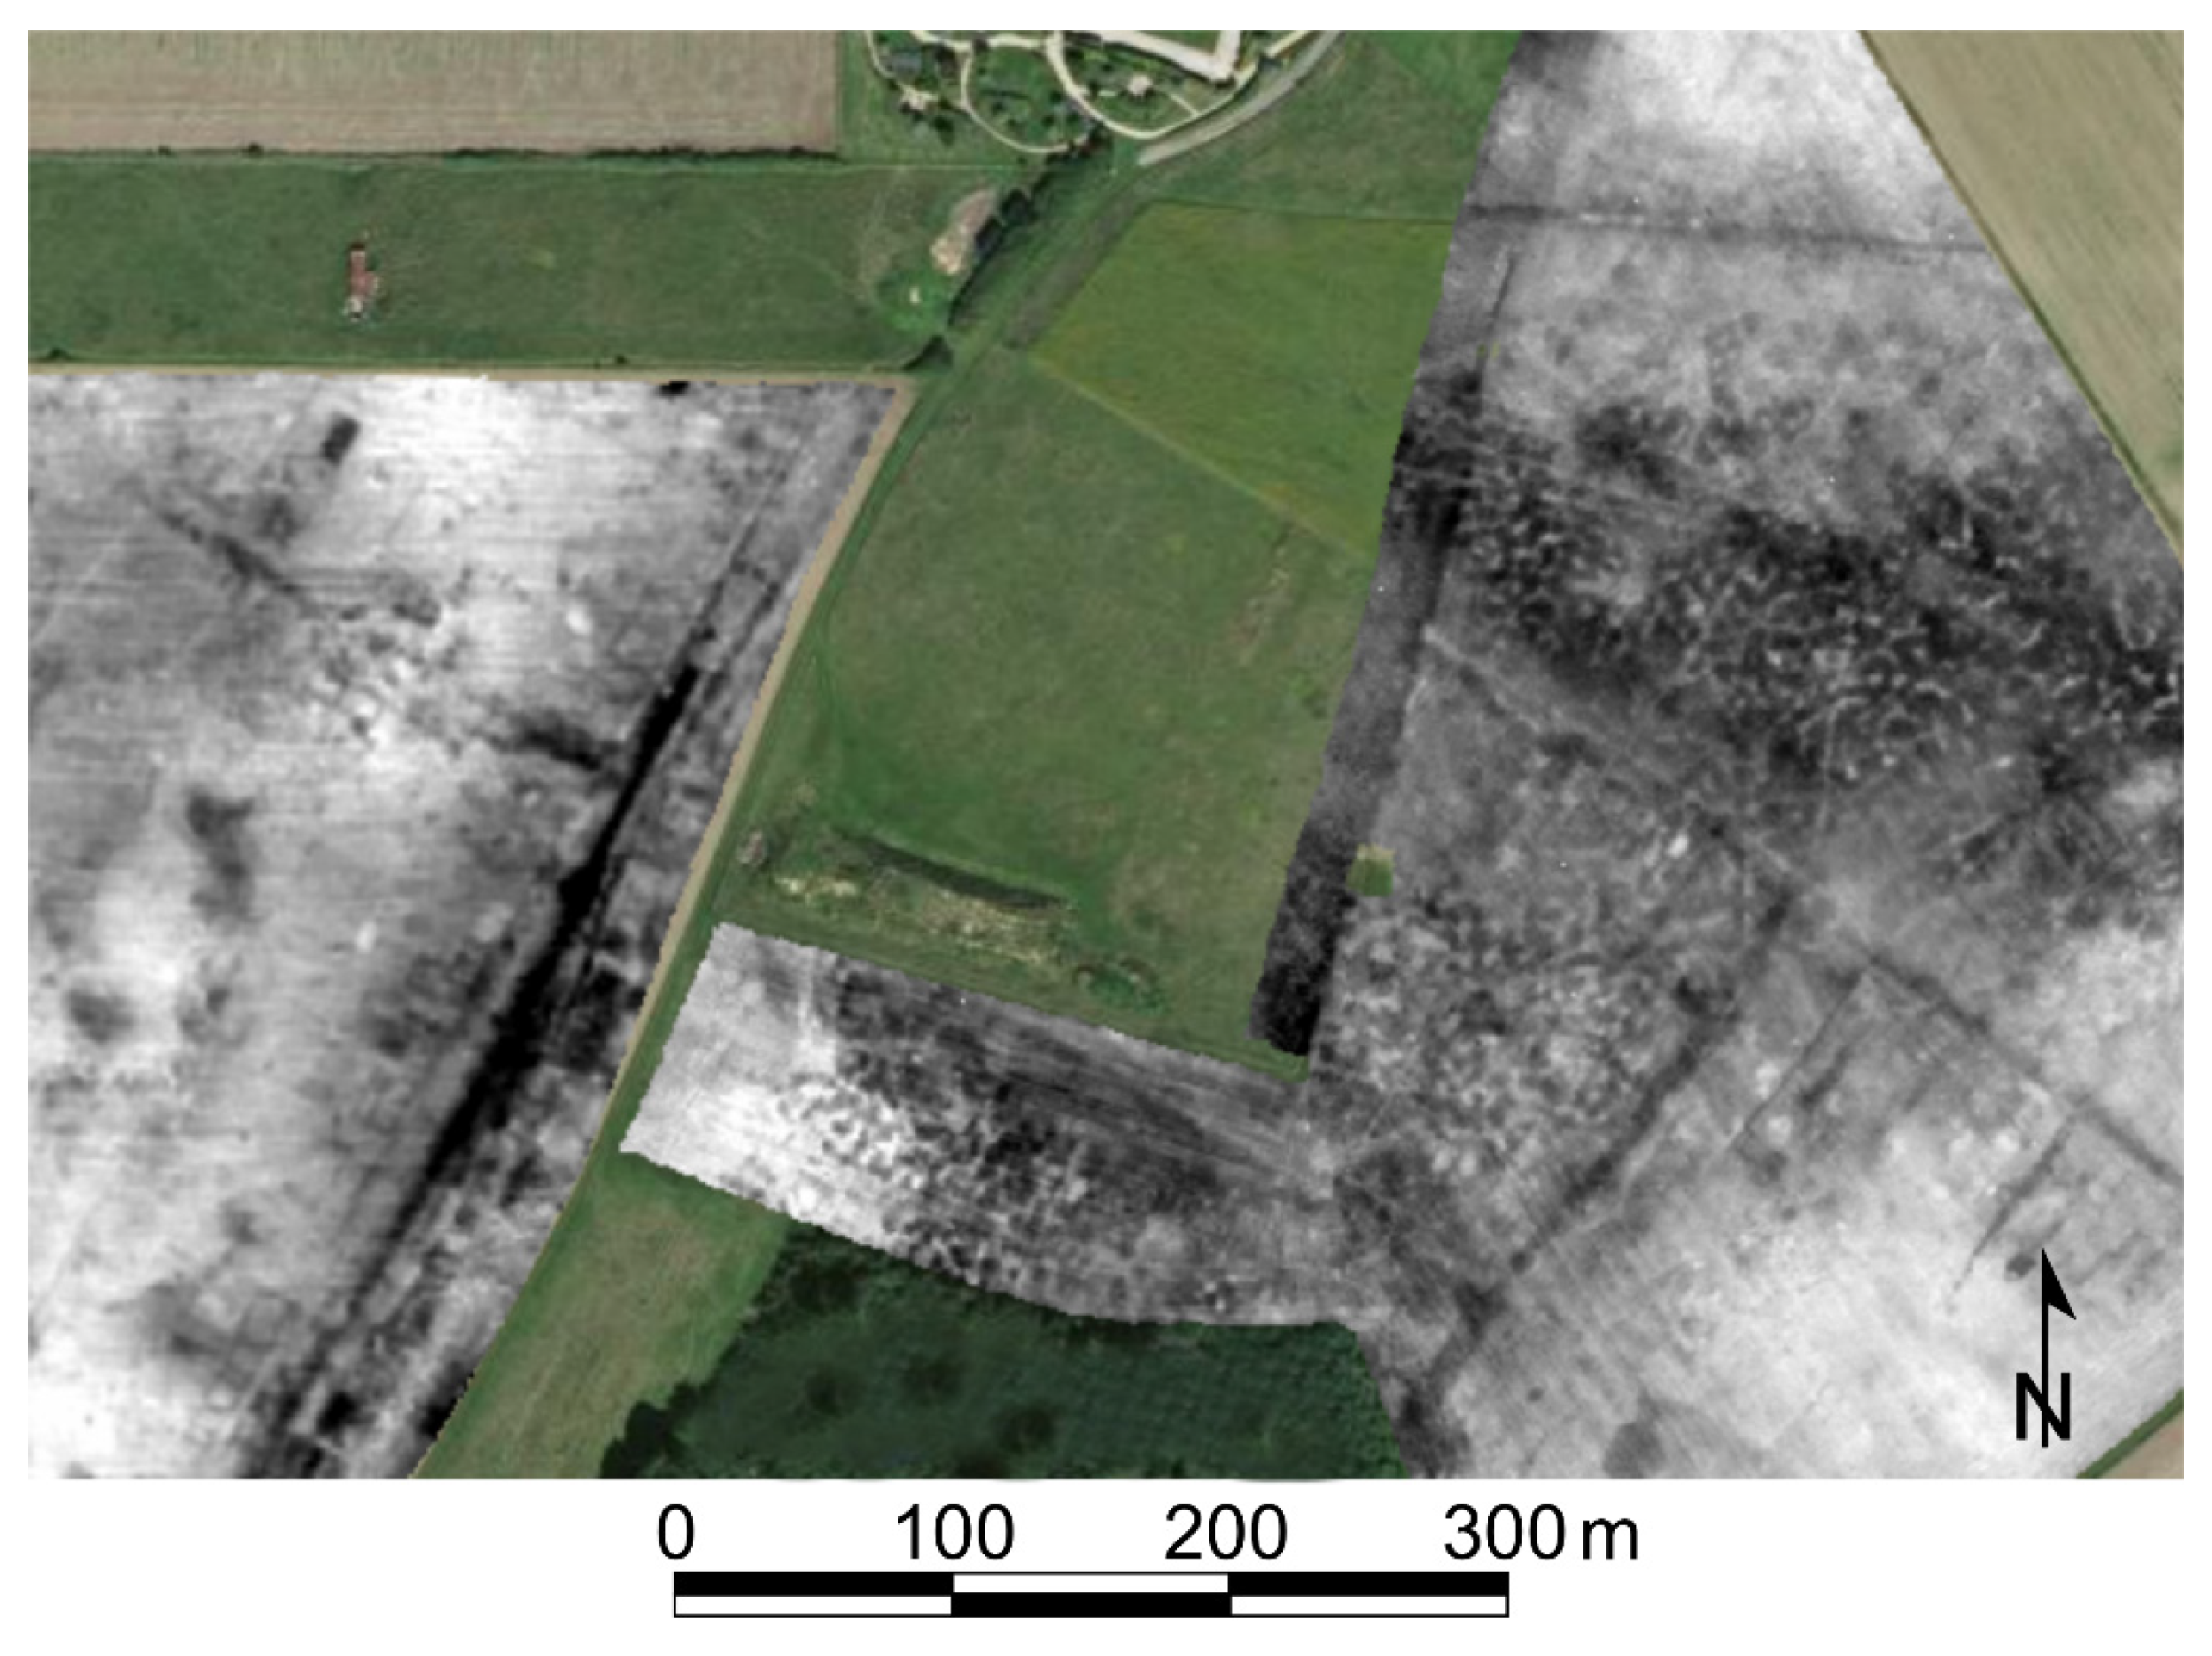
Similarly, unwanted features in the soil may be caused by periglacial effects where repeated cycles of freezing and thawing have created geomorphological changes to the soils. This is most prominent in far northern latitudes, and magnetometer surveys in Iceland have encountered anomalies created by frost hummocks and stone polygons [53]. Similar anomalies were encountered in a magnetometer survey in France where they obscured underlying archaeological anomalies (Figure 15). The effect is limited to certain parts of a large survey area, presumably reflecting changes in the superficial geology.

3.4.5. Time-Varied (Nonstationary) Soil Noise

The humidity of soil can change very rapidly during a day, especially in sandy materials, exposed soils with poor vegetation cover, and in hot climates. This is of particular concern in electrical resistivity tomography (ERT) surveys where a single investigation may require hundreds of individual earth resistance measurements from a fixed electrode layout [15] over a period of more than one hour. If, during that time, some of the electrodes start to exceed the permitted contact resistance due to a loss of soil humidity, noise may be introduced in the data. In very arid conditions, some operators have resorted to watering electrodes to reduce contact resistance to acceptable levels, but rapid evaporation may lead to a recurrence of the problem during the course of a single ERT investigation. In certain instances, the reduction in contact resistance after rainfall may enable earth resistance surveys that were otherwise impossible. Figure 16 presents data from an earth resistance survey using the ARP® array before and after rain. The initial survey was severely impacted by high contact resistance and only data from the smallest array (0.5 m) could be collected—no relevant archaeological features are visible. After rain, the contact resistance was reduced considerably and the data revealed the underlying structural remains, best visible in data from the 1.0 m electrode separation.
Even in area investigations with earth resistances, LFEM or GPR, changes in soil humidity and, hence, ground resistivity may make it more difficult to jointly interpret all data from a site collected on different days or even during different times of the day. This problem is even more noticeable in time lapse investigations where changes between repeat-measurements are numerically evaluated, but where diurnal variations could mask the information of interest.
The way that weather and climatic conditions influence earth resistance measurements has been a topic of discussion from the early application of the method [78,79,80,81]. Changes of rainfall and evapotranspiration that alter the levels of moisture in the ground are mainly responsible for changes in electrical measurements [82]. Soil moisture also influences the dielectric constant thereby affecting the GPR signal velocity. Increased moisture therefore attenuates GPR waves through the reduced soil resistivity, but may simultaneously create better contrast between dry features (e.g., stone foundations) and soil due to a higher soil dielectric constant. Which of the two effects is beneficial or adverse depends strongly on the site conditions. Figure 17 illustrates the results of a comparison from a Neolithic long house (S8) at the settlement of Szeghalom-Kovácshalom in eastern Hungary. The GPR depth slices cover the south eastern edge of the building and correspond to a depth of 0.8–0.9 m below the surface. Figure 17a represents measurements carried out in a dry season, whereas Figure 17b was created from measurements acquired after sporadic, but intense rainfall that lasted for about a day. The outline of the structure is better defined in the dry-season measurements, as the moisture retained in the ground after the rainfall event attenuated the GPR signals considerably.
In addition, ground resistivity is also temperature-dependent and, in a dry climate, daily variations in ambient temperature may influence earth resistance measurements. The diurnal variation in soil resistivity has been reported to give a minimum in the middle of the day with a decrease of 5–10% [8,80]. In general, a decrease of 2% in resistivity is expected per 1 °C increase in temperature [83,84]. The same holds when measuring with down-hole instruments due to temperature differences between the surface and deeper strata.
Climatic conditions also influence soil processes that are related to magnetic susceptibility [85]. Repeated reduction–oxidation cycles during different climatic or pedogenic conditions enhance the in situ conversion of iron oxides and hydroxides to maghemite or magnetite [86], and marine environments may have a considerable impact on magnetic properties [87]. These magnetic changes are, however, fairly slow and will only be noticeable as unwanted effects in studies that extend over very long time frames.
Finally, different agricultural regimes in different survey seasons (e.g., plowing, seeding, harvesting) may also introduce unwanted discrepancies between data blocks collected at different times (e.g., plow lines in some and not in others) and might, hence, contribute to temporal soil noise.

4. How to Characterize Noise

The two most useful methods for analyzing noise in archaeo-geophysical data are geostatistical investigations and frequency analysis in the spatial and time domain. Geostatistics is based on the theory of ‘regionalized variables’ that was developed by Matheron and Krige for prediction of ore concentrations [88]. A variable is regionalized if its values are dependent on the spatial position of their measurement. In this theory, it is accepted that a relationship exists between two closely spaced samples, which determines correlations between values measured in certain areas. This indicates that there exists a structure within the area explored. The assumption is that values of a regionalized variable are a particular realization of a stationary random function F(x) at all positions x, and endowed with a covariance function C(x). In this theory, the analysis tool is the semivariogram γ(h), defined for any distance h between two points (often called the lag distance) as half the mean E[ ] of the squared difference between all values that are separated from a point x by a distance h: γ(h) = 0.5 × E[ (F(x+h) − F(x))2 ]. Semivariogram and covariance are related as γ(h) = C(0) − C(h). At great distance, the correlation between points disappears and the semivariogram approaches the variance C(0), which is referred to as the ‘sill’, reached at the ‘range’ distance. This range can be thought of as the maximum distance up to which values of the regionalized variable influence each other (Figure 18).
For pure random noise, where no correlation exists, this range is zero and the semivariogram is completely flat, whatever the distance between points; nothing is predictable. In the general case, where some correlation exists between points, the semivariogram can be decomposed into a superposition of different simple models (linear, exponential, spherical, etc.). The shape and range of these models help to explore the different types of correlations between measurement points in geophysical data, for example, to differentiate between local correlations due to the presence of archaeological features and long-wavelength phenomena due to background geology.
The value toward which the semivariogram appears to tend for a lag distance of zero γ(0) is called the ‘nugget effect’. If the random function were continuous and noise-free, the difference of its values between very closely spaced sample points would decrease to zero. However, there are several effects that can result in a finite variogram offset as the lag approaches zero. If the semivariogram describes a parameter that has many discontinuous boundaries at the small scale, for example, in an assemblage of many stone inclusions on an archaeological site (or of gold ‘nuggets’ in the initial research), the averaging of the semivariogram over points that lie on both sides of such boundaries would record a nonzero nugget effect. For well-mixed soils, as in plowed fields, this contribution will be small. A second contribution comes from random variations at close distance, for example, due to instrument noise, as adjacent data values that would normally be the same are instead randomly different. Therefore, the nugget effect (or, better, the percentage ratio relative to the sill) describes the component of the random function that is not predictable and is linked to uncorrelated noise. The exact nature of this random noise cannot easily be derived from the semivariogram.
The nugget effect also depends on the spatial sampling of the data. In order to approximate the random function using actual measurements, an ‘empirical variogram’ is constructed. For this, all data pairs are sorted into bins of equal width, the so-called ‘lag tolerance’, and the squared differences of corresponding measurement values are averaged for each bin (Figure 18). The lag tolerance of the empirical variogram is chosen based on the data’s sampling density. For grid-based data, this can, for example, be the effective grid resolution [90,91]. The nugget effect is then determined by extrapolating the empirical variogram to a lag of zero.
In order to be able to calculate a nugget effect for noise estimations from field measurements, a sampling protocol should be introduced that uses dense sampling in several areas. While this is often done for soil testing, its use in archaeological geophysical surveys is less common, but could certainly be introduced for magnetic susceptibility surveys. The recent advances in instrumentation and survey methodologies from point measurements over a grid to quasi-continuous measurement along profiles will allow better estimation of the nugget effect, at least along the direction(s) of the profiles where the in-line spacing can be as low as a few centimeters. With multisensor arrays for magnetometers and GPR antenna arrays, even the across-line sampling distances are becoming low enough to calculate empirical variograms with short lag tolerance.
For example, during a wide-mesh electromagnetic survey in 1995 for the investigation of Roman iron slag deposits in a dense wood [89], seven longitudinal profiles were acquired over an area of 300 m × 1000 m, with an in-line spacing of 10 m and across-line spacing of 50 m, aligned with a road corridor. In a second step, 25 perpendicular profiles were acquired with the same acquisition parameters. The empirical variogram of the magnetic susceptibility in-phase data was fitted with a spherical model that showed different parameters depending on the selection of the profiles used for its calculation (parallel or perpendicular). The nugget effects were respectively 352 and 602, the sills 1582 and 1952 (all in units of (10−5 [SI])2), and the range in all cases was 139 m (Figure 18). Careful tests of the used LFEM system (EM15, Geonics) at a stationary point during the survey showed a standard deviation of the measurements (instrument noise) of 33 × 10−5 [SI], which explains the nugget effect along the parallel profile direction. The higher nugget effect along the perpendicular direction may be a result of the soil noise away from the road corridor.
The fitted semivariogram model was then used for an interpolation test of the data. For this, each data point was individually removed and an interpolation calculated with a kriging process. The standard deviation of all these estimation errors was found to be 80 × 10−5 [SI] and, hence, greater than the instrument noise; the prediction errors were largest at the edges of anomalies. This is in accordance with the fact that these areas where the strongest changes were encountered corresponded to the most undersampled areas. This example shows how it is possible to separate the instrument noise, soil noise, and the noise generated by undersampling using geostatistical methods.
Another method for the characterization of noise is spatial frequency analysis. For this, the measurement data are approximated by a superposition of sinusoidal signals of different spatial frequencies (‘wavenumbers’), expressed as the number of cycles per unit distance. The collection of all amplitudes used in this superposition then forms the spatial frequency representation of the data. Using the mathematical process of a Fourier transformation allows switching between the two different representations without loss of information. The inverse of the wavenumber is called the wavelength of an individual sinusoidal component and characterizes the size of the respective changes.
The spatial frequency representation of a dataset can often be divided into three sections: Long wavelengths (i.e., small wavenumbers), which represent large and broad anomalies, possibly of geological origin; the midrange wavelengths that mostly represent the sought-after archaeological features; and the short-wavelength variations (i.e., with large wavenumbers) that are often associated with small-scale spatial noise [92]. By analyzing short and long wavelengths, the contribution of these noise sources can be evaluated. However, whether all small-scale anomalies are noise and all broad anomalies are unwanted needs to be established first. This method is particularly suited for the characterization of noise based on its spatial extent in the data, even though this does not necessarily provide information about its origin. For example, short wavelengths may reflect either small features in the ground (e.g., small ferrous artifacts in magnetometer surveys) or random measurement changes from one position to the next as a result of instrument noise. A very detailed analysis of the wavenumber data may provide further insights as the smooth variation of geophysical anomalies is represented by a very narrow range of wavenumbers, while the sharp changes due to random instrument noise involves a much wider range of wavenumbers. If the burial range of archaeological features across a site is fairly consistent, a depth estimate may be derived from the spatial frequency spectrum using the method by Spector and Grant [4,93].
Noise that has a pronounced and consistent spatial periodicity is particularly well-suited to frequency analysis. This includes variations in instrument height introduced by the gait of an operator (e.g., with a periodicity of 0.3–1.0 m) and aligned exactly with the profile direction; the shearing of anomalies due to consistently misaligned start and stop positions of the instrument and showing as periodicity perpendicular to the profile direction with a wavelength of exactly the profile separation; or plow lines with a specific periodicity and direction, usually not aligned with the profile directions.
For GPR data, spatial frequency analysis related to the two-dimensional survey layout is usually complemented by frequency analysis in the time domain related to the propagation of the EM waves into the ground. This allows identification of low- and high-frequency components in the GPR signals that are unwanted, for example, slow changes to the signal offset and interference from high-frequency sources such as mobile phones.
Some additional methods have been devised to characterize very specific forms of noise. Shearing of anomalies can also be detected through the calculation of data correlation between adjacent survey profiles. If extended anomalies are shifted between lines, the calculated cross-correlation will show a peak at the shift distance to help with its identification and removal [94]. Similar to the use of convolution masks for the creation of noise maps [6] is the calculation of standard deviations in small areas surrounding every data point, which are then plotted as ‘windowed variance’ to represent local variability (Plate 4, [95]). The windowed variance is an estimator for the nugget effect in the windowed area and the plot is, therefore, similar to a two-dimensional map of the local nugget effect.

5. Removal of Noise

As discussed in Section 3, some of the sources of noise can be reduced by taking appropriate actions during instrument design and data acquisition. However, where this is not possible (or not done), the methods for noise characterization discussed in Section 4 can often be used for some suppression or removal. However, in nearly all cases, the distinction between signal and noise is not clear-cut and removal of selected measurement components will nearly always remove parts of the sought-after signal. Obtaining good-quality data with as little noise as possible is always the best options.
Once a wavenumber representation of the geophysical data has been calculated, it is possible to remove small and large wavenumbers through a bandpass filter that only permits midsized components to be retained. This filtered frequency representation can then be transformed back into the spatial domain, resulting in the removal of both small and large anomalies. In certain circumstances and by choosing the filter-wavenumbers carefully, both geological and small-scale noise may be suppressed by this method. High-pass and low-pass filters can be employed to isolate anomalies of interest and smooth out regional trends. Low-pass filtering is similar to local averaging and can, therefore, reduce random noise if data are sampled at a sufficiently high resolution (see Section 3.2.1). Filters tuned to noise with specific periodicity and direction (e.g., related to an operator’s gait or to plow lines [96], see Section 3.2.3) can suppress the unwanted effects, if they are sufficiently consistent. As these filters alter the data’s spatial characteristics, they should only be applied after all processing and modeling steps have been applied.
Applying filters in the time domain can improve GPR data considerably, removing both low-frequency noise due to low-frequency energy near the transmitter, associated with electrostatic and inductive fields (dewow removal or signal saturation correction) [97], as well as high-frequency noise from external sources. Some GPR data processing techniques are derived from seismic methods. For example, random noise is often suppressed through the application of time-variant bandpass filters (e.g., f-x deconvolution [98]), while systematic noise, usually exhibited in terms of multiple reflections or reverberations, is attenuated through the application of filters in the frequency–wavenumber (f–k) [99] or time–frequency domain [100]. Many more filtering methods have been reported in the literature and some of them can be found in Hu and Zheng [101].
Related to spatial frequency filtering are wavelet approaches that were used in the past for the removal of noise from geophysical signals to achieve a better definition of the anomalies. For example, Eppelbaum [102] applied a wavelet approach together with diffusion clustering on magnetic and gravity data to distinguish between areas containing archaeological features from those without. Tsivouraki and Tsokas [103] used a wavelet-based shift-invariant cyclospinning algorithm aiming toward the denoising of both systematic and random noise from magnetic signals. Processes that are even more sophisticated have been recently introduced to suppress random noise or the effect of ground clutter in the magnetic data. These include, for example, the application of singular value decomposition (SVD) filtering [104,105], the wavelet transform for signal–noise separation [106,107], spectral analysis, and target resonances [108,109].
Various methods for the correction of the effects created by diurnal variations of the earth’s magnetic field have been summarized by Weymouth and Lessard [110], Lessard [111], and Dobrin [112]. In most cases, the use of a second magnetometer sensor can compensate for these variations, either used as a base station monitoring the diurnal variations or with the two sensors arranged as a gradiometer. Alternatively, a tie-line method can be used in which measurements are repeated along a traverse running perpendicular to the direction of the survey traverses to correct the initial measurements. Other techniques use mathematical approximations to remove the majority of these effects [8,113]. In general, corrections for the temporal variations in the earth’s magnetic field are necessary for achieving a high measurement precision (<1 nT) [110]. Instead of high-pass filtering in the spatial frequency domain, a simple trend analysis and the removal of a least squares fitted surface are often sufficient to suppress large-amplitude trends and regional patterns due to the small extent of typical survey areas.
In areas of intense cultivation, noise in earth resistance data from disturbed soil horizons can be reduced by applying the Barnes Layer method, according to which different data sets recorded with increasing electrode spacing can generate data from greater soil depths, which can be used to reduce the contributions from specific layers and enhance the resistivity contrast from cultural layers [114,115].
In more conventional approaches, the manual identification of surface anthropogenic features through aerial, satellite, or even conventional maps can be used to correlate the findings with geophysical measurements. This allows the identification or elimination of specific anomalies. Christiansen et al. [116] used this technique to remove from LFEM data noise that was associated with modern anthropogenic structures.

6. Conclusions

This article reviewed the different sources and types of noise in archaeological geophysical data, originating from the instrumentation, the usage of the instruments, from external sources, and the soil medium itself. There are two main reasons why this noise may be problematic. It can mask relevant archaeological anomalies (detection) and it may distort the data so that they become more difficult to interpret as archaeological features (identification).
Modern instruments have a very high sensitivity and even weak signals can be recorded. For example, an earth resistance anomaly of only 20 ohms against a background of 10 ohm has a symmetric resistivity contrast [82] of 0.33, exactly the same as a high 200 ohms anomaly against a 100 ohms background. However, with noise of, for example, 1 ohm, the low anomaly only has a signal-to-noise ratio of 26 dB, while the high anomaly has 46 dB. Whether features and their anomalies can be detected depends on the level of noise, and it is, therefore, important to estimate noise amplitudes in order to know the threshold of what anomalies may not have been detected.
Despite the great advances in speed and coverage that have come with modern sensor platforms [117,118,119], archaeological geophysics still often has to cope with undersampled data due to the small size of many archaeological features. Hence, it is important that the available data are of the best possible quality as their interpretation can otherwise be very difficult [120]. Many sources of noise cannot be reduced (e.g., inherent electronic instrument noise, soil noise) and it is important to minimize those contributions to noise that can be controlled, for example, due to the careful operation of instruments and best possible positioning. As was shown, there are some methods for reducing noise in the postprocessing stage, but these can only be applied in well-defined situations and are no substitution for data of the highest possible quality.
Not all data variability is bad, and this article has provided several examples where archaeological insights were gained from careful inspection of small changes. Even soil variations may not always be noise, as they can carry information about formation processes relevant for the archaeological interpretation of geophysical anomalies [121]. In the early phases of archaeological geophysics, several soil studies were undertaken to establish the relationship between geophysical anomalies and buried features [3,80,122,123]. The increasing importance of soil properties, especially due to modern cultivation practices, and the possibility of very-high-resolution archaeological geophysical surveys make the study of soil noise an important subject.
Designing methods for the estimation of noise may be aided by the detailed discussion of sources in Section 3. Linford et al. [6] demonstrated how some carefully designed experiments and repeat measurements can be used to evaluate noise. While this is time-consuming and often not feasible, there are other possibilities that are more practical. Electronic instrument noise and drift can be assessed by recording a time series of measurements at a single reference position in the survey area for a few minutes at the start and end of a day. To estimate noise related to the movement of sensors, the instrument can then be moved systematically around the reference point in several directions while data are recorded. Finally, a small number of tie-lines can be measured in different directions, and differences at the intersections with previous survey transects evaluated.
In a second step, soil noise can be estimated by using wavenumber analysis and geostatistical methods. For the latter, it is useful to collect data with a high sampling density over a small area so that the nugget effect can be estimated. If this information is of particular interest, small tests can be undertaken following sampling practices in soil science. The creation of noise maps, either using convolution masks [66] or by calculating the windowed variance, can be a useful supplement to plots of survey data and can help to assign local confidence levels for the detection of geophysical anomalies.
Currently, the sources and levels of noise that are found in geophysical surveys are hardly ever reported. Only when the results show obvious signatures, some general comments or vague hypotheses are presented. This article stresses the need to record the different types of noise from the early stages of data acquisition through to the whole sequence of postprocessing. It is intended that this article will lead to the creation of a protocol for reporting the different sources and types of noise that are encountered in archaeological geophysical data and how they have entered the measurements. This can then become a tool for all practitioners to help with the final interpretation of results.

Author Contributions

Conceptualization, A.S. (Armin Schmidt) and M.D.; methodology, all; validation, all; resources, all; data curation, all; writing—original draft preparation, all; writing—review and editing, all; visualization, all; project administration, A.S. (Armin Schmidt); funding acquisition, all. The authors have contributed overall in the following proportions: 38%, 38%, 24% (A.S. (Armin Schmidt), M.D., A.S. (Apostolos Sarris)). All authors have read and agreed to the published version of the manuscript.

Funding

The APC was funded by COST Action SAGA: The Soil Science & Archaeo-Geophysics Alliance—CA17131 (www.saga-cost.eu), supported by COST (European Cooperation in Science and Technology, www.cost.eu).

Acknowledgments

The authors would like to thank the four anonymous reviewers whose comments and suggestions helped to improve and clarify this article. This article evolved from papers presented by A. Schmidt and M. Dabas at the 1st SAGA Workshop, 30 September–1 October 2019, and participants of the workshop who commented on these papers are thanked for their input. The topics were further explored during a Short Term Scientific Mission (STSM) supported by the COST Action SAGA: The Soil Science & Archaeo-Geophysics Alliance—CA17131 (www.saga-cost.eu), supported by COST (European Cooperation in Science and Technology).

Conflicts of Interest

The authors declare that they have no conflict of interest in relation to this article.

References

  1. Lea, D.; Bradbery, J. Oxford Advanced Learners Dictionary, 10th ed.; Oxford University Press: Oxford, UK, 2020. [Google Scholar]
  2. Scales, J.A.; Snieder, R. What is noise? Geophysics 1998, 63, 1122–1124. [Google Scholar] [CrossRef]
  3. Graham, I.D.G.; Scollar, I. Limitations on Magnetic Prospection in Archaeology Imposed by Soil Properties. Archaeo Phys. Tech. Nat. Beiträge Feldarchäologie 1976, 6, 1–124. [Google Scholar]
  4. Ghezzi, A.; Schettino, A.; Tassi, L.; Pierantoni, P.P. Magnetic modelling and error assessment in archaeological geophysics: The case study of Urbs Salvia, central Italy. Ann. Geophys. 2019, 62, GM451. [Google Scholar] [CrossRef]
  5. Buchsenschutz, O.; Coulon, G.; Gratier, M.; Hesse, A.; Holmgren, J.; Mills, N.; Orssaud, D.; Querrien, A.; Rialland, Y.; Soyer, C.; et al. L’évolution du Canton de Levroux d’après les Prospections et les Sondages Archéologiques—Levroux 1; Fédération pour l’édition de la Revue Archéologique du Centre de la France: Tours, France, 1988. [Google Scholar]
  6. Linford, N.; Linford, P.; Martin, L.; Payne, A. Recent results from the English Heritage caesium magnetometer system in comparison with recent fluxgate gradiometers. Archaeol. Prospect. 2007, 14, 151–166. [Google Scholar] [CrossRef]
  7. Schettino, A.; Ghezzi, A.; Pierantoni, P.P. Magnetic field modelling and analysis of uncertainty in archaeological geophysics. Archaeol. Prospect. 2019, 26, 137–153. [Google Scholar] [CrossRef]
  8. Scollar, I.; Tabbagh, A.; Hesse, A.; Herzog, I. Archaeological Prospecting and Remote Sensing; Cambridge University Press: Cambridge, NY, USA, 1990. [Google Scholar]
  9. Telford, W.M.; Geldart, L.P.; Sheriff, R.E. Applied Geophysics, 2nd ed.; Cambridge University Press: Cambridge, NY, USA, 1990. [Google Scholar]
  10. Sheriff, R. Encyclopedic Dictionary of Applied Geophysics; SEG: Tulsa, OK, USA, 2002. [Google Scholar]
  11. Sheriff, R.E.; Geldart, L.P. Exploration Seismology, 2nd ed.; Cambridge University Press: Cambridge, NY, USA, 1995. [Google Scholar]
  12. Parzen, E. Modern Probability Theory and Its Applications; John Wiley & Sons, Inc.: New York, NY, USA; London, UK; Sydney, Australia, 1960. [Google Scholar]
  13. Manoli, S. Fluxgate Magnetometer for Archaeological Prospection: Adaptation, Installation, Set-up and Comparative Measurements with Caesium Magnetometer on Archaeological Sites in Bavaria. Master's Thesis, Department of Earth and Environmental Sciences, Geophysics, Ludwig-Maximilians-Universität München, Munich, Germany, 2014. [Google Scholar]
  14. Gebbers, R.; Lück, E.; Dabas, M.; Domsch, H. Comparison of instruments for geoelectrical soil mapping at the field scale. Near Surf. Geophys. 2009, 7, 179–190. [Google Scholar] [CrossRef]
  15. Schmidt, A. Earth Resistance for Archaeologists; AltaMira Press: Lanham, MD, USA, 2013. [Google Scholar]
  16. Unser, M. Sampling-50 years after Shannon. Proc. IEEE 2000, 88, 569–587. [Google Scholar] [CrossRef] [Green Version]
  17. Geometrics. Total Field Magnetometer Performance, Published Specifications and What They Mean; Geometrics: San Jose, CA, USA, 2000. [Google Scholar]
  18. Bartington, G.; Chapman, C.E. A High-Stability Fluxgate Magnetic Gradiometer for Shallow surface Application. Archaeol. Prospect. 2004, 11, 19–34. [Google Scholar] [CrossRef]
  19. Neubauer, W. Magnetische Prospektion in der Archäologie; Austrian Academy of Sciences: Vienna, Austria, 2001; p. 238. [Google Scholar]
  20. Dabas, M.; Anest, A.; Thiesson, J.; Tabbagh, A. Slingram EMI Devices for Characterizing Resistive Features Using Apparent Conductivity Measurements: Check of the DualEM-421S Instrument and Field Tests. Archaeol. Prospect. 2016, 23, 165–180. [Google Scholar] [CrossRef] [Green Version]
  21. Tabbagh, A. What is the best coil orientation in the Slingram electromagnetic prospection method? Archaeometry 1986, 28, 185–196. [Google Scholar] [CrossRef]
  22. Nobes, D.C.; Wallace, L.R. Geophysical Imaging of an Early Nineteenth Century Colonial Defensive Blockhouse: Applications of EM Directionality and Multi-parameter Imaging. In Archaeogeophysics: State of the Art and Case Studies; El-Qady, G., Metwaly, M., Eds.; Springer International Publishing: Berlin/Heidelberg, Germany, 2019; pp. 219–232. [Google Scholar]
  23. Thiesson, J.; Tabbagh, A.; Dabas, M.; Chevalier, A. Characterization of buried cables and pipes using electromagnetic induction loop-loop frequency-domain devices. Geophysics 2017, 83, E1–E10. [Google Scholar] [CrossRef]
  24. Hinterleitner, A.; Trinks, I.; Löcker, K.; Kainz, J.; Totschnig, R.; Kucera, M.; Neubauer, W. Not-so good vibrations: Removing measurement induced noise from motorized multi-sensor magnetometry data. In Proceedings of the 12th International Conference of Archaeological Prospection, Bradford, UK, 16 September 2017; Jennings, B., Gaffney, C., Sparrow, T., Gaffney, S., Eds.; Archaeopress: Oxford, UK, 2017; pp. 110–111. [Google Scholar]
  25. Verdonck, L. High-Resolution Ground-Penetrating Radar Prospection with a Modular Configuration; Ghent University: Ghent, Belgium, 2012. [Google Scholar]
  26. Böniger, U.; Tronicke, J. On the Potential of Kinematic GPR Surveying Using a Self-Tracking Total Station: Evaluating System Crosstalk and Latency. IEEE Trans. Geosci. Remote Sens. 2010, 48, 3792–3798. [Google Scholar] [CrossRef]
  27. Dabas, M. Theory and practice of the new fast electrical imaging system ARP©. In Seeing the Unseen. Geophysics and Landscape Archaeology; Campana, S., Piro, S., Eds.; Taylor & Francis Group: London, UK, 2009; pp. 105–126. [Google Scholar]
  28. Gerrard, J.; Caldwell, L.; Kennedy, A. Green Waste and Archaeological Geophysics. Archaeol. Prospect. 2015, 22, 139–142. [Google Scholar] [CrossRef] [Green Version]
  29. Sarris, A.; Papadopoulos, N.; Dederix, S.; Driessen, J.; Dirix, T.; Merkouri, C. The Quest of the Grave of Andreas Vesalius in Zakynthos. In Spreading Excellence in Computer Applications for Archaeology and Cultural Heritage, Proceedings of the 3rd Conference on Computer Applications and Quantitative Methods in Archaeology, Limassol, Cyprus, 18 June 2018; Kyriakidis, P., Agapiou, A., Lysandrou, V., Eds.; Cyprus University of Technology: Limassol, Cyprus, 2019; pp. 11–18. [Google Scholar]
  30. Sarris, A.; Papadopoulos, N.; Cuenca-Garcia, C.; Alexakis, D.; Manataki, M.; Cantoro, G. Exposing the Urban Plan of the ancient city of Hyettos, Boeotia, Greece. Archaeol. Pol. 2015, 53, 364–367. [Google Scholar]
  31. Sarris, A.; Bintliff, J. Scourcing the Surface and Peering beneath it at the Ancient City of Hyettos, Boeotia, Greece. In Sensing the Past, Contributions from the ArcLand Conference on Remote Sensing for Archaeology; Posluschny, A., Ed.; Habelt-Verlag: Bonn, Germany, 2015; pp. 70–71. [Google Scholar]
  32. Doneus, M.; Neubauer, W. 2D combination of prospection data. Archaeol. Prospect. 1998, 5, 29–56. [Google Scholar] [CrossRef]
  33. Booth, A.D.; Clark, R.A.; Hamilton, K.; Murray, T. Multi-offset ground penetrating radar methods to image buried foundations of a medieval town wall, Great Yarmouth, UK. Archaeol. Prospect. 2010, 17, 103–116. [Google Scholar] [CrossRef]
  34. Schmidt, A.; Coningham, R.; Acharya, K.P.; Davis, C.; Kunwar, R.B. Seismic safety in Nepal: Authenticity, protection and historic tradition. In Proceedings of Recent Work in Archaeological Geophysics; Archprospection: London, UK, December 2018; pp. 16–18. Available online: http://www.archprospection.org/sites/archprospection.org/files/ArchGeo18_abstracts.pdf (accessed on 18 September 2020).
  35. Eppelbaum, L.V. Geophysical Observations at Archaeological Sites: Estimating Informational Content. Archaeol. Prospect. 2014, 21, 125–138. [Google Scholar] [CrossRef]
  36. Macmillan, S.; Reay, S. Should Archaeologists Be Concerned about Naturally Varying Magnetic Fields? In Proceedings of Recent Work in Archaeological Geophysics; Archprospection: London, UK, December 2012; pp. 77–78. [Google Scholar]
  37. Carrier, B.M.; Pulkkinen, A.; Heinz, M. Recognizing Geomagnetic Storms in Marine Magnetometer Data: Toward Improved Archaeological Resource Identification Practices. STAR Sci. Technol. Archaeol. Res. 2016, 2, 1–14. [Google Scholar] [CrossRef]
  38. Maus, S. Ocean, Electromagnetic Effects. In Encyclopedia of Geomagnetism and Paleomagnetism; Gubbins, D., Herrero-Bervera, E., Eds.; Springer: Berlin/Heidelberg, Germany; New York, NY, USA, 2007; pp. 740–742. [Google Scholar]
  39. Gannon, J.L.; Swidinsky, A.; Xu, Z. Geomagnetically Induced Currents from the Sun to the Power Grid; John Wiley and Sons, Inc.: Hoboken, NJ, USA, 2019. [Google Scholar]
  40. Aye, M.M.M.; Faize, A.; Alsharahi, G.; Louzazni, M.; Driouach, A. Effect of External Noise on Ground Penetrating Radar Ability to Detect Objects. Int. J. Microw. Opt. Technol. 2019, 14, 124–131. [Google Scholar]
  41. Olhoeft, G. Applications and Frustrations in Using Ground Penetrating Radar. IEEE AESS Syst. Mag. 2002, 17, 12–20. [Google Scholar] [CrossRef] [Green Version]
  42. Olhoeft, G. Maximizing the information return from ground penetrating radar. J. Appl. Geophys. 2000, 43, 175–187. [Google Scholar] [CrossRef]
  43. Conyers, L.B. Ground-Penetrating Radar for Archaeology, 3rd ed.; Altamira Press: Lanham, MD, USA, 2013. [Google Scholar]
  44. Schmidt, A. What shielding? How to pick up signals with a GPR antenna. In Proceedings of Recent Work in Archaeological Geophysics; Archprospection: London, UK, December 2010; pp. 28–29. [Google Scholar]
  45. Schmidt, A. Pessinus—Advanced GPR processing 2010–2011. Geophysical survey report. In Pessinus and Its Regional Setting. Volume 2: Work in 2009–2013; Tsetskhladze, G.R., Ed.; Peeters: Leuven, Belgium; Paris, France; Bristol (CT), UK, 2019; pp. 171–222. [Google Scholar]
  46. Souffaché, B.; Cosenza, P.; Flageul, S.; Pencolé, J.P.; Seladji, S.; Tabbagh, A. Electrostatic multipole for electrical resistivity measurements at the decimetric scale. J. Appl. Geophys. 2010, 71, 6–12. [Google Scholar] [CrossRef]
  47. Matthews, W.; French, C.A.I.; Lawrence, T.; Cutler, D.F.; Jones, M.K. Microstratigraphic traces of site formation processes and human activities. World Archaeol. 1997, 29, 281–308. [Google Scholar] [CrossRef]
  48. Mathe, V.; Leveque, F.; Mathe, P.-E.; Chevallier, C.; Pons, Y. Soil anomaly mapping using a caesium magnetometer: Limits in the low magnetic amplitude case. J. Appl. Geophys. 2006, 58, 202–217. [Google Scholar] [CrossRef]
  49. Scollar, I. A Contribution to Magnetic Prospecting in Archaeology. Archaeo Phys. Tech. Nat. Beiträge Feldarchäologie Beih. Bonn. Jahrbuecher 1965, 15, 21–93. [Google Scholar]
  50. Tetegan, M.; Pasquier, C.; Besson, A.; Nicoullaud, B.; Bouthier, A.; Bourennane, H.; Desbourdes, C.; King, D.; Cousin, I. Field-Scale Estimation of the Volume Percentage of Rock Fragments in Stony Soils by Electrical Resistivity. CATENA 2012, 92, 67–74. [Google Scholar] [CrossRef]
  51. Heathcote, C.; Aspinall, A. Some Aspects of the Use of Fluxgate Magnetometers (Gradiometers) in Geophysical Prospection in Archaeology. Revue D’ Archeom. 1981, 5, 61–70. [Google Scholar] [CrossRef]
  52. Linington, R.E. Topographical and Terrain Effects in Magnetic Prospecting. Prospez. Archeol. 1972, 7–8, 61–84. [Google Scholar]
  53. Horsley, T.; Schmidt, A.; Linford, P. The use of geophysical methods for the archaeological prospection of medieval kilns. In Archaeological Prospection 2001; Doneus, M., Eder-Hinterleitner, A., Neubauer, W., Eds.; Austrian Academy of Sciences: Vienna, Austria, 2001; pp. 116–117. [Google Scholar]
  54. Tsourlos, P.I.; Szymanski, J.E.; Tsokas, G.N. The effect of terrain topography on commonly used resistivity arrays. Geophysics 1999, 64, 1357–1363. [Google Scholar] [CrossRef]
  55. Fox, R.C.; Hohmann, G.W.; Killpack, T.J.; Rijo, L. Topographic effects in resistivity and induce-polarization surveys. Geophysics 1980, 45, 75–93. [Google Scholar] [CrossRef]
  56. Sutherland, T.L.; Schmidt, A.; Dockrill, S. Resistivity pseudosections and their topographic correction: A report on a case study at Scatness, Shetland. Archaeol. Prospect. 1998, 5, 229–237. [Google Scholar] [CrossRef]
  57. Tong, L.T.; Yang, C.H. Incorporation of topography into two-dimensional resistivity inversion. Geophysics 1990, 55, 354–361. [Google Scholar] [CrossRef]
  58. Loke, M.H.; Barker, R.D. Rapid least-squares inversion of apparent resistivity pseudosections by a quasi-Newton method. Geophys. Prospect. 1996, 44, 131–152. [Google Scholar] [CrossRef]
  59. Giao, P.H.; Weller, A.; Hien, D.H.; Adisornsupawat, K. An approach to construct the weathering profile in a hilly granitic terrain based on electrical imaging. J. Appl. Geophys. 2008, 65, 30–38. [Google Scholar] [CrossRef]
  60. Loke, M.H. Tutorial: 2-D and 3-D Electrical Imaging Surveys; Geotomo Software, Res2dinv 3.5 Software: Aarhus, Denmark, 2004. [Google Scholar]
  61. Lehmann, F.; Green, A.G. Topographic migration of georadar data: Implications for acquisition and processing. Geophysics 2000, 65, 836–848. [Google Scholar] [CrossRef]
  62. Wilken, D.; Wunderlich, T.; Zori, D.; Kalmring, S.; Rabbel, W.; Byock, J. Integrated GPR and archaeological investigations reveal internal structure of man-made Skiphóll mound in Leiruvogur, Iceland. J. Archaeol. Sci. Rep. 2016, 9, 64–72. [Google Scholar] [CrossRef]
  63. Prokhorenko, V.; Ivashchuk, V.; Korsun, S.; Musiyachenko, S.; Borodavka, V. Topographic correction of GPR profile based on odometer and inclinometer data. In Proceedings of the 14th International Conference on Ground Penetrating Radar (GPR), Shanghai, China, 5–8 June 2012; pp. 425–429. [Google Scholar]
  64. Leckebusch, J.; Rychener, J. Verification and topographic correction of GPR data in three dimensions. Near Surf. Geophys. 2007, 5, 395–403. [Google Scholar] [CrossRef]
  65. Feng, X.; Sato, M.; Liu, C.; Takahashi, K.; Zhang, Y. Topographic Correction of Elevated GPR. IEEE J. Sel. Top. Appl. Earth Obs. Remote Sens. 2014, 7, 799–804. [Google Scholar] [CrossRef]
  66. Frei, W.; Chen, C.-C. Fast Boundary Detection: A Generalization and a New Algorithm. IEEE Trans. Comput. 1977, C-26, 988–998. [Google Scholar] [CrossRef]
  67. Sarris, A.; Papadopoulos, N.; Argyriou, N.; Donati, J.; Manataki, M.; Trapero-Fernandez, P.; Chatzitoulousis, S.; Stefanidis, K.; Parcharidou, M.; Tsioumas, M. Underground Images from the Cultural Landscape of Eidomeni. In Proceedings of Spreading Excellence in Computer Applications for Archaeology and Cultural Heritage, Proceedings of the 3rd Conference on Computer Applications and Quantitative Methods in Archaeology, Limassol, Cyprus, 18 June 2018; Kyriakidis, P., Agapiou, A., Lysandrou, V., Eds.; Cyprus University of Technology: Limassol, Cyprus, 2019; pp. 2–10. [Google Scholar]
  68. Rakov, V.A.; Uman, M.A. Lightning: Physics and Effects; Cambridge University Press: Cambridge, NY, USA, 2003. [Google Scholar]
  69. Jones, G.; Maki, D.L. Lightning-induced magnetic anomalies on archaeological sites. Archaeol. Prospect. 2005, 12, 191–197. [Google Scholar] [CrossRef]
  70. Verrier, V.; Rochette, P. Estimating peak currents at ground lightning impacts using remanent magnetization. Geophys. Res. Lett. 2002, 29, 1867. [Google Scholar] [CrossRef]
  71. Trinks, I. Lightning-induced remanent magnetisation as plausible explanation for a geophysical anomaly at Gråborg. Fornvännen J. Swed. Antiqu. Res. 2011, 106, 350–354. [Google Scholar]
  72. Sarris, A.; Papadopoulos, N.; Salvi, M.C.; Seferou, E.; Agapiou, A. Mapping the Archaeological Landscape of Palaepaphos through Remote Sensing Techniques. In A Sense of the Past. Studies in Current Archaeological Applications of Remote Sensing and Non-Invasive Prospection Methods; Kamermans, H., Gojda, M., Posluschny, A.G., Eds.; Archaeopress: Oxford, UK, 2014; pp. 41–46. [Google Scholar]
  73. Maki, D. Lightning Induced Remanent Magnetization at the Buffalo Slough Burial Mound Complex. Minn. Archaeol. 2015, 74, 30–47. [Google Scholar]
  74. Bates, R.C.; Bates, M.; Gaffney, C.; Gaffney, V.; Raub, D.T. Geophysical Investigation of the Neolithic Calanais Landscape. Remote Sens. 2019, 11, 2975. [Google Scholar] [CrossRef] [Green Version]
  75. Campana, S.; Dabas, M. Archaeological Impact Assessment: The BREBEMI Project (Italy). Archaeol. Prospect. 2011, 18, 139–148. [Google Scholar] [CrossRef]
  76. Dabas, M.; Guyard, L.; Leppert, T. Gisacum revisité: Croisement géophysique et archéologie. Doss. l’Archéologie no Spécial “La Prospection Géophysique” 2005, 308, 52–61. [Google Scholar]
  77. Dabas, M. Sistemi di mesura della resistivita: Da manuale ad autotrainata (ARPs). In Groma2: In profondita Senza Scavare; Giorgi, E., Ed.; BraDypUS s.a.: Bologna, Italy, 2009; pp. 323–333. [Google Scholar]
  78. Al Chalabi, M.M.; Rees, A.I. An Experiment on the effect of rainfall on electrical resistivity anomalies in the near surface. Bonn. Jahrbücher 1962, 162, 266–271. [Google Scholar]
  79. Atkinson, R.J.C. Resistivity Surveying in Archaeology. In The Scientist and Archaeology; Pyddoke, E., Ed.; Phoenix House: London, UK, 1963; pp. 1–30. [Google Scholar]
  80. Hesse, A. Prospections Géophysiques a Faible Profondeur. Applications a L’archéologie; Dunod: Paris, France, 1966. [Google Scholar]
  81. Clark, A.J. Archaeological Detection by Resistivity; University of Southampton: Southampton, UK, 1980. [Google Scholar]
  82. Schmidt, A.; Fry, R.; Parkyn, A.; Bonsall, J.; Gaffney, C. When the Time is Right: The Impact of Weather Variations on the Contrast in Earth Resistance Data. In Proceedings of the 12th International Conference of Archaeological Prospection, Bradford, UK, September 2017; Jennings, B., Gaffney, C., Sparrow, T., Gaffney, S., Eds.; Archaeopress: Oxford, UK, 2017; pp. 218–219. [Google Scholar]
  83. Hesse, A. The importance of climatic observations in archaeological prospecting. Prospez. Archeol. 1966, 1, 11–13. [Google Scholar]
  84. Besson, A.; Cousin, I.; Dorigny, A.; Dabas, M.; King, D. The temperature correction for the electrical resistivity measurements in undisturbed soil samples: Analysis of the existing conversion models and proposal of a new model. Soil Sci. 2008, 173, 707–720. [Google Scholar] [CrossRef]
  85. Fassbinder, J.W.E. Seeing beneath the farmland, steppe and desert soil: Magnetic prospecting and soil magnetism. J. Archaeol. Sci. 2015, 56, 85–95. [Google Scholar] [CrossRef]
  86. Singer, M.J.; Fine, P. Pedogenic Factors Affecting Magnetic Susceptibility of Northern California Soils. J. Soil Sci. 1989, 53, 1119–1127. [Google Scholar] [CrossRef]
  87. Kattenberg, A.E.; Aalbersberg, G. Archaeological prospection of the Dutch perimarine landscape by means of magnetic methods. Archaeol. Prospect. 2004, 11, 227–235. [Google Scholar] [CrossRef] [Green Version]
  88. Matheron, G. Le Krigeage Universel; École Nationale Supérieure des Mines de Paris: Fontainebleau, France, 1969. [Google Scholar]
  89. Dabas, M. Contribution de la prospection géophysique a large maille et de la geostatistique a l’etude des tracés autoroutiers: Application aux ferriers de la Bussiére sur l’A77. Revue d’Archéométrie 1999, 23, 17–32. [Google Scholar] [CrossRef]
  90. Schmidt, A.; Linford, P.; Linford, N.; David, A.; Gaffney, C.; Sarris, A.; Fassbinder, J. Guidelines for the Use of Geophysics in Archaeology: Questions to Ask and Points to Consider; Europae Archaeologia Consilium (EAC): Namur, Belgium, 2015. [Google Scholar]
  91. Schmidt, A. Guidelines for the use of geophysics in archaeology: Should they be prescriptive? In The Use of Geophysical Prospection Methods in Archaeology; Meylemans, E., De Smedt, P., Eds.; Agentschap Onroerend Erfgoed: Brussels, Belgium, 2019; pp. 23–34. [Google Scholar]
  92. Mares, S. Introduction to Applied Geophysics; D. Reidel Publishing Company: Dordrecht, The Netherlands, 1984. [Google Scholar]
  93. Spector, A.; Grant, F.S. Statistical models for interpreting aeromagnetic data. Geophysics 1970, 35, 293–302. [Google Scholar] [CrossRef]
  94. Ciminale, M.; Loddo, M. Aspects of magnetic data processing. Archaeol. Prospect. 2001, 8, 239–246. [Google Scholar] [CrossRef]
  95. Aspinall, A.; Gaffney, C.F.; Schmidt, A. Magnetometry for Archaeologists; AltaMira Press: Lanham, MD, USA, 2008. [Google Scholar]
  96. Noviello, M.; Ciminale, M.; Del Gaudio, V.; Amoruso, L. Advances in Reconstructing Archaeological Magnetic Signals; an Algorithm for Filtering Noise due to the Ploughing Effect. Archaeol. Prospect. 2017, 24, 87–99. [Google Scholar] [CrossRef]
  97. Sarris, A. Processing and analyzing Geophysical Data. In Archaeological Spatial Analysis: A Methodological Guide; Gillings, M., Hacıgüzeller, P., Lock, G., Eds.; Routledge: Abingdon-on-Thames, UK, 2020; pp. 376–407. [Google Scholar]
  98. Bagheri, M.; Riahi, M.A. Using a Novel Method for Random Noise Reduction of Seismic Records. Iran. J. Oil Gas Sci. Technol. 2018, 7, 65–72. [Google Scholar]
  99. Yilmaz, Ö. Seismic Data Analysis: Processing, Inversion, and Interpretation of Seismic Data, 2nd ed.; Society of Exploration Geophysicists: Tulsa, OK, USA, 2001. [Google Scholar]
  100. Liu, Y. Local time-frequency transform and its application to ground-roll noise attenuation. In SEG Technical Program Expanded Abstracts 2010; Bevc, D., Nedorub, O., Eds.; Society of Exploration Geophysicists: Tulsa, OK, USA, 2010; pp. 3711–3716. [Google Scholar]
  101. Hu, H.; Zheng, Y. Data-driven dispersive surface-wave prediction and mode separation using high-resolution dispersion estimation. J. Appl. Geophys. 2019, 171, 103867. [Google Scholar] [CrossRef]
  102. Eppelbaum, L. Detecting Buried Archaeological Remains by the Use of Geophysical Data Processing with ‘Diffusion Maps’ Methodology. Geophys. Res. Abstr. 2015, 17, EGU2015-2793. [Google Scholar]
  103. Tsivouraki, B.; Tsokas, G.N. Wavelet transform in denoising magnetic archaeological prospecting data. Archaeol. Prospect. 2007, 14, 130–141. [Google Scholar] [CrossRef]
  104. Bi, W.; Zhao, Y.; An, C.; Hu, S. Clutter Elimination and Random-Noise Denoising of GPR Signals Using an SVD Method Based on the Hankel Matrix in the Local Frequency Domain. Sensors 2018, 18, 3422. [Google Scholar] [CrossRef] [PubMed] [Green Version]
  105. Xue, W.; Luo, Y.; Yang, Y.; Huang, Y. Noise Suppression for GPR Data Based on SVD of Window-Length-Optimized Hankel Matrix. Sensors 2019, 19, 3807. [Google Scholar] [CrossRef] [Green Version]
  106. Tronicke, J.; Allroggen, N.; Biermann, F.; Fanselow, F.; Guillemoteau, J.; Krauskopf, C.; Lück, E. Rapid multiscale analysis of near-surface geophysical anomaly maps: Application to an archaeogeophysical data set. Geophysics 2020, 85, B109–B118. [Google Scholar] [CrossRef]
  107. Zhu, J.; Xue, Y.; Zhang, N.; Li, Z.; Tao, Y.; Qiu, D. A noise reduction method for Ground Penetrating Radar signal based on wavelet transform and application in tunnel lining. IOP Conf. Ser. Earth Environ. Sci. 2017, 61, 012088. [Google Scholar] [CrossRef] [Green Version]
  108. Daniels, D.J. Ground Penetrating Radar, 2nd ed.; Institution of Electrical Engineers: London, UK, 2004. [Google Scholar]
  109. Vetterli, M.; Kovačević, J.; Goyal, V.K.A. Foundations of Signal Processing; Cambridge University Press: Cambridge, NY, USA, 2014. [Google Scholar]
  110. Weymouth, J.W.; Lessard, Y.A. Simulation Studies of Diurnal Corrections for Magnetic Prospection. Prospez. Archeol. 1986, 10, 37–47. [Google Scholar]
  111. Lessard, Y.A. Simulation of Magnetic Surveying Techniques to Study the Effects of Diurnal Variations; University of Nebraska-Lincoln: Lincoln, NE, USA, 1981. [Google Scholar]
  112. Dobrin, M.B. Introduction to Geophysical Prospecting, 2nd ed.; McGraw-Hill: New York, NY, USA, 1960. [Google Scholar]
  113. Tabbagh, J. Total field magnetic prospection: Are vertical gradiometer measurements preferable to single sensor survey? Archaeol. Prospect. 2003, 10, 75–81. [Google Scholar] [CrossRef]
  114. Barnes, H.E. Electrical Subsurface Exploration Simplified. Roads Str. 1954, 97, 81–84. [Google Scholar]
  115. Weymouth, J.W.; Huggins, R. Geophysical Surveying of Archaeological Sites. In Archaeological Geology; George Rapp, J., Gifford, J.A., Eds.; Yale University Press: New Haven, CT, USA, 1985; pp. 191–235. [Google Scholar]
  116. Christiansen, A.; Pedersen, J.; Auken, E.; Søe, N.; Holst, M.; Kristiansen, S. Improved Geoarchaeological Mapping with Electromagnetic Induction Instruments from Dedicated Processing and Inversion. Remote Sens. 2016, 8, 1022. [Google Scholar] [CrossRef] [Green Version]
  117. Trinks, I.; Hinterleitner, A.; Neubauer, W.; Nau, E.; Löcker, K.; Wallner, M.; Gabler, M.; Filzwieser, R.; Wilding, J.; Schiel, H.; et al. Large-area high-resolution ground-penetrating radar measurements for archaeological prospection. Archaeol. Prospect. 2018, 25, 171–195. [Google Scholar] [CrossRef]
  118. Dabas, M. Prospections archéologiques à grande échelle et géophysique pour les grands projets. Archéologies Numériques 2017, 2, 1–8. [Google Scholar] [CrossRef] [Green Version]
  119. Bénard, C.; Blin, O.; Dabas, M. Les nouvelles techniques de résistivité électrique employées dans la prospection de grandes surfaces en archéologie: Une expérience pilote en Île-de-France: Le plateau de Saclay. Les Nouvelles L’archéologie 2005, 101, 24–32. [Google Scholar]
  120. Verdonck, L.; De Smedt, P.; Verhegge, J. Making sense of anomalies: Practices and challenges in the archaeological interpretation of geophysical data. In Innovation in Near-Surface Geophysics; Persico, R., Piro, S., Linford, N., Eds.; Elsevier: Amsterdam, The Netherlands, 2019; pp. 151–194. [Google Scholar]
  121. Cuenca-Garcia, C.; Armstrong, K.; Aidona, E.; De Smedt, P.; Rosveare, A.; Rosveare, M.; Schneidhofer, P.; Wilson, C.; Faßbinder, J.; Moffat, I.; et al. The Soil Science & Archaeo-Geophysics Alliance (SAGA): Going beyond prospection. Res. Ideas Outcomes 2018, 4, e31648. [Google Scholar] [CrossRef]
  122. Mullins, C.E. The Magnetic Properties of the Soil and their Application to Archaeological Prospecting. In Technische und Naturwissenschaftliche Beitraege zur Feldarchaeologie; Wilkinson, E.M., Mullins, C.E., Tabbagh, A., Eds.; Rheinland-Verlag GmbH: Köln, Germany, 1974; pp. 143–347. [Google Scholar]
  123. Tite, M.S.; Mullins, C. Enhancement of the magnetic susceptibility of soils on archaeological sites. Archaeometry 1971, 13, 209–219. [Google Scholar] [CrossRef]
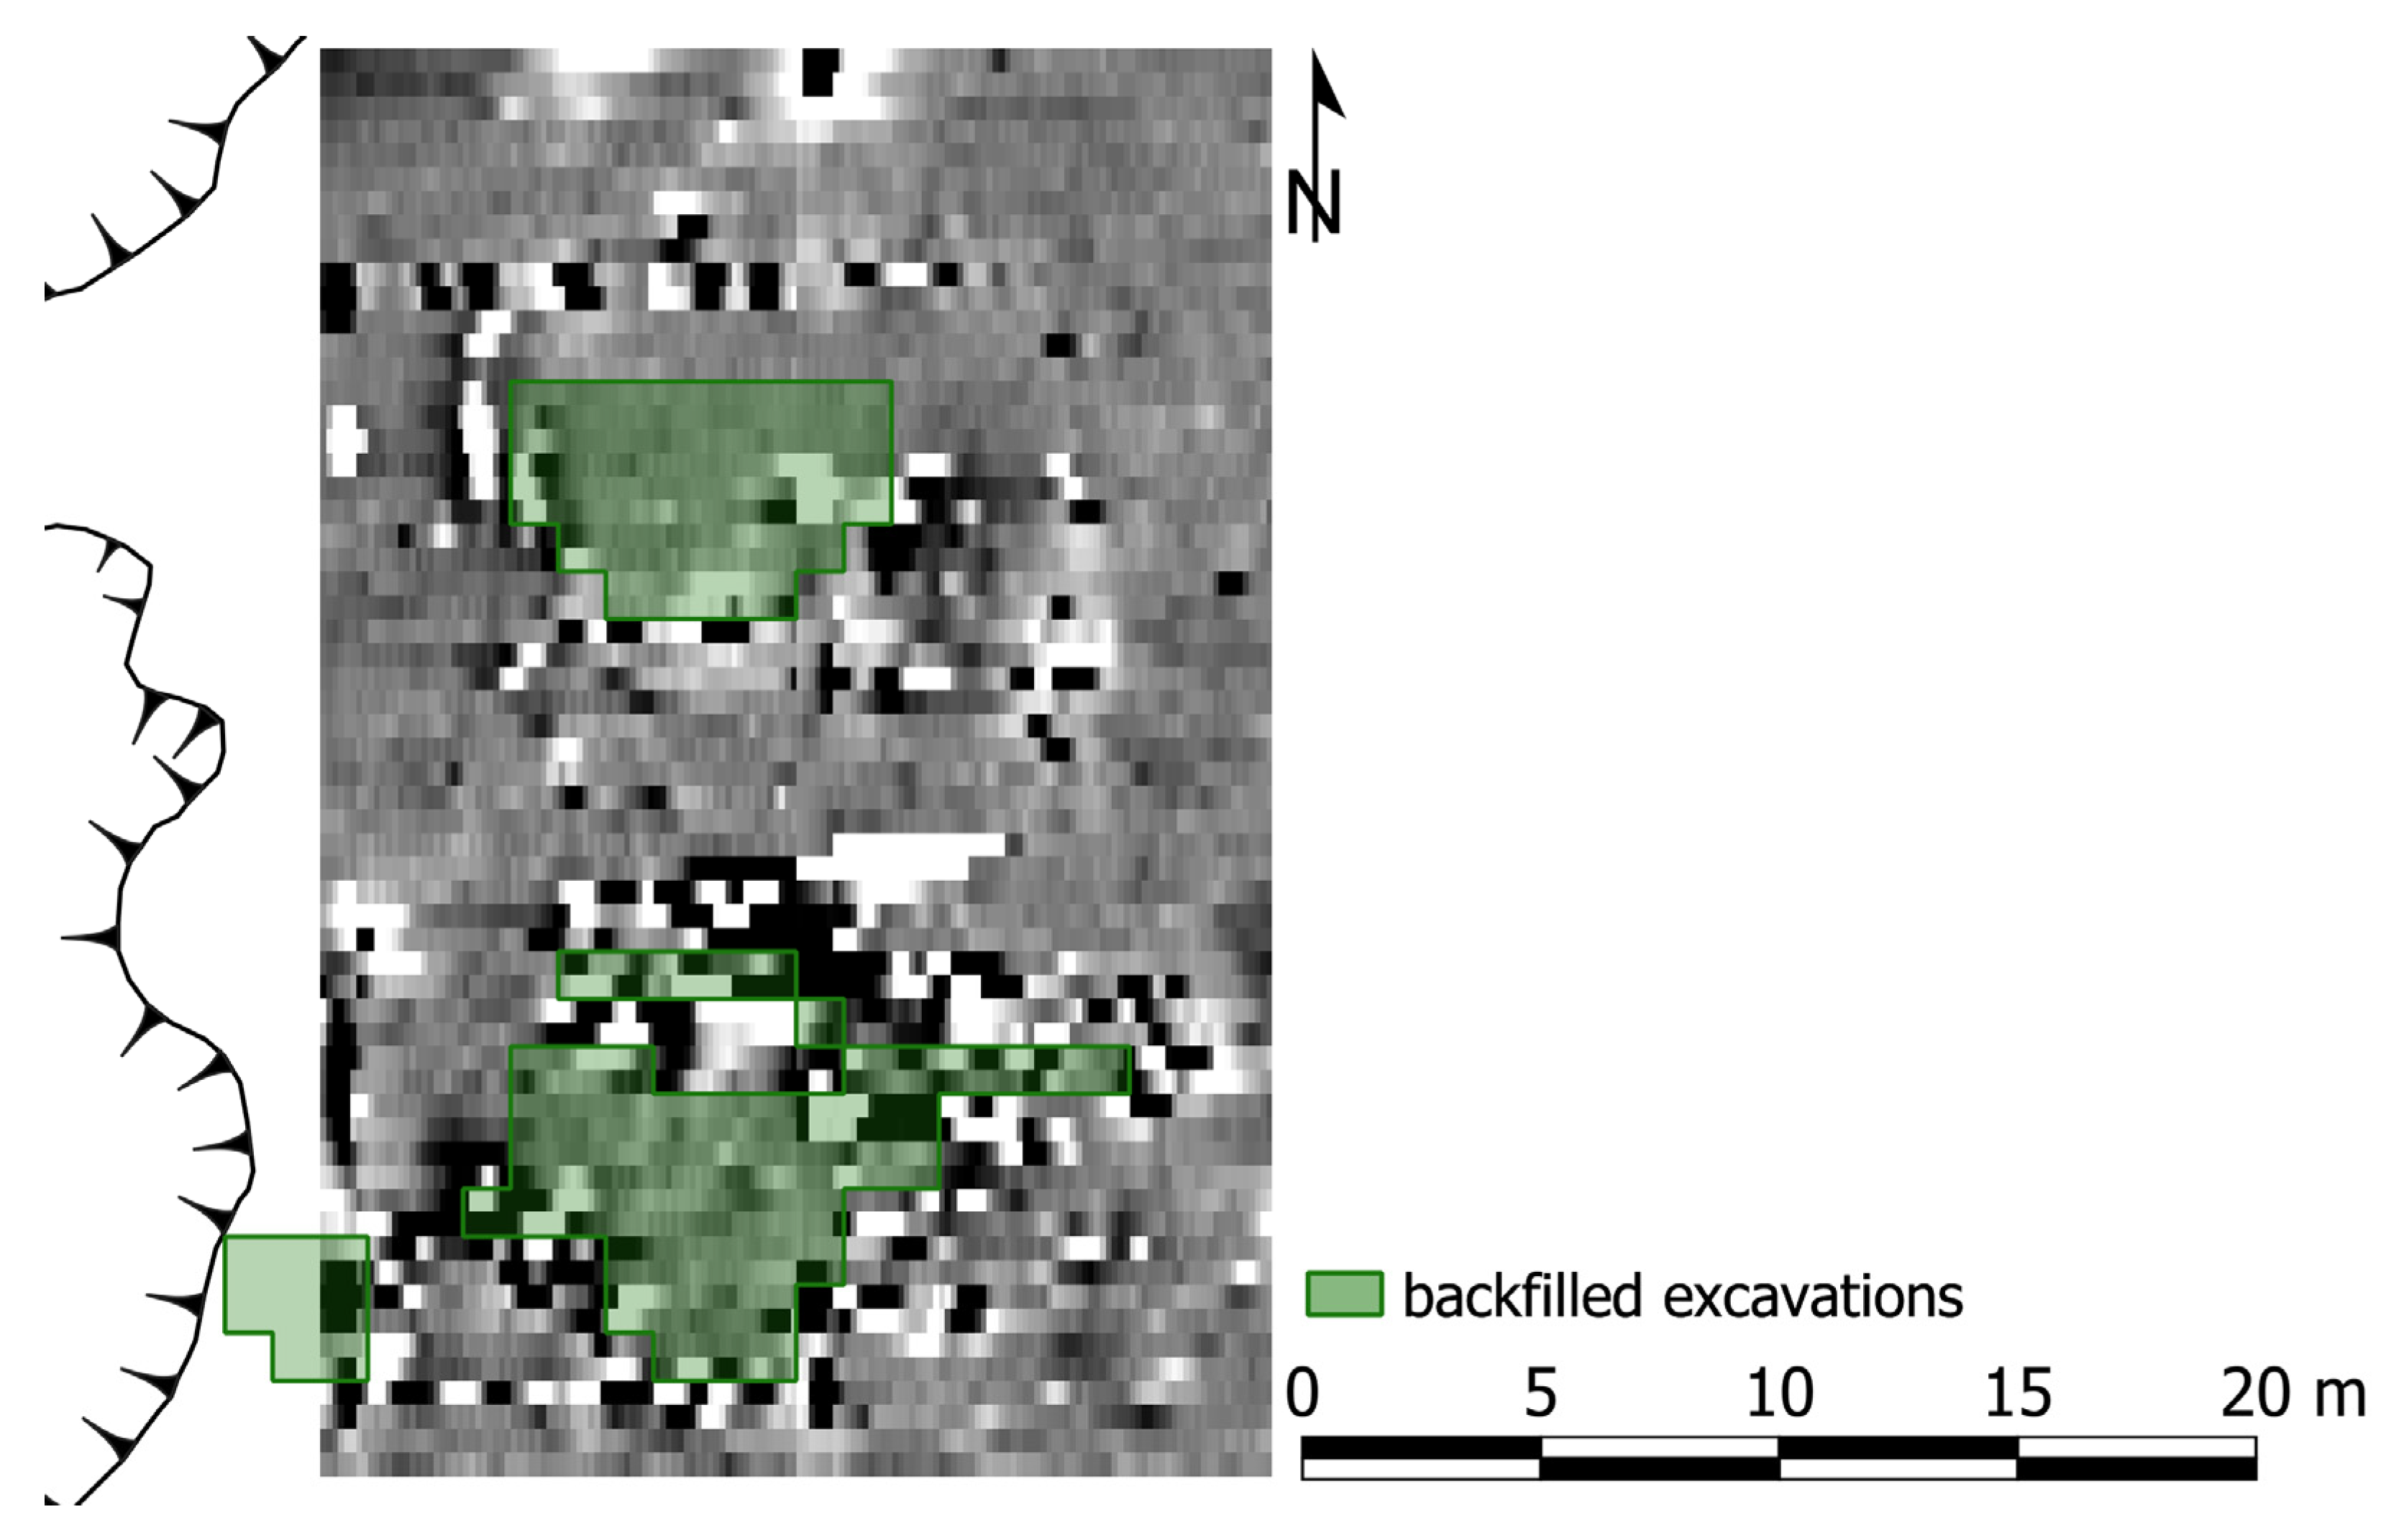
Figure 1. Nails in and around the backfilled excavation trenches at site ZAD2, Jordan, showing as noise in the magnetometer data and obscuring signals from a Neolithic settlement (−14 to +7 nT, white to black) (data courtesy of Phillip Edwards, La Trobe University, Bundoora, VIC, Australia).
Geosciences 10 00382 g001
Figure 2. Comparison of stationary measurements collected with three different magnetometer sensors over one minute: (a) Foerster Ferex Con650; (b) Bartington Grad-01-1000L; (c) Geometrics G-858 (data courtesy of Geocarta SAS, Paris, France).
Geosciences 10 00382 g002
Figure 3. Distribution of measurement values of a Foerster Ferex CON 650 sensor with manufacturer-supplied data logger during a stationary trial [derived from data from [13].
Geosciences 10 00382 g003
Figure 4. Example of nonstationary and offset noise from a Bartington Grad01-1000L (data courtesy of Geocarta SAS, Paris, France).
Geosciences 10 00382 g004
Figure 5. Heading error for three magnetometer sensors: (a) Foerster Ferex Con650; (b) Bartington Grad-01-1000L; (c) Geometrics G-858 (data courtesy of Geocarta SAS, Paris, France).
Geosciences 10 00382 g005
Figure 6. Influence of positioning errors on the clarity of an earth resistance survey. ARP® data over one hectare in the Gallo-Roman site of Vieil-Evreux, France (−1 to +1 standard deviation, white to black): (a) Tracks with dGPS error circles in inset; (b) earth resistance data after code signal correction; (c) earth resistance data after code-with-phase signal correction (data courtesy of Geocarta SAS, Paris, France).
Geosciences 10 00382 g006
Figure 7. Data from a multichannel ground penetrating radar (GPR) system (IDS Stream-C) (strong reflections in black and orange) from the Grand Place in Brussels. Spatial information was collected with a robotic Total Station and the time lag contributed to considerable distortions in detected features, most prominently for a pipe, running west to east, that was one of the targets of this investigation: (a) No correction for positioning latency; (b) after correction of positioning latency using a time lag of about 300 ms (data courtesy of G. Catanzariti, 3Dgeoimaging, Turin, Italy).
Geosciences 10 00382 g007
Figure 8. (a) Mosaic of GPR timeslices at about 0.8 m depth from the area around the assumed church of Santa Maria delle Grazie in Zakynthos, Greece. The upper layers of the radargrams are strongly affected by highly reflective anomalies that are caused by utility pipes; (b,c) the high-amplitude reflectors at greater depth (pink shading) are most likely related to the foundations of structures that were destroyed in the 1954 AD earthquake [29].
Geosciences 10 00382 g008
Figure 9. Fluxgate gradiometer survey (−100 to +100 nT) at Hyettos (Boeotia, central Greece). Several intense and extensive anomalies were encountered in the northern part of the site, which were linked to magnetic ores (inset) that were the reason for ferrous mining activities in the area during the past centuries. Electrical resistivity imaging (ERI) profiles in these areas measuring the induced polarization confirmed that the magnetic anomalies are caused by a highly magnetized feature with a chargeability of more than 20 mV/V. This is in agreement not only with the existence of surface ores, but also to what Pausanias mentions for the particular site, namely the existence of a temple of Heracles where the cult statue is a mere rock, which is taken as indication that a giant lump of the local iron, hematite, was the object of this cult. Even in Roman times, the Elder Pliny mentions Hyettos as one of the few sources of highest-quality iron, hematite, which would have been a significant source of income [30,31].
Geosciences 10 00382 g009
Figure 10. GPR survey in the yard of Shree Padma Secondary School, Bhaktapur, Nepal (strong signals in black) showing unwanted airwave reflections (outlined in red) from corrugated iron roofs (see inset). The measurements were undertaken with a shielded 500 MHz antenna, but the iron-roof airwaves are visible in this timeslice at 1.7 m depth where most other signals have disappeared. In addition, alternative lines are affected differently by the airwaves, depending on whether the operator walks between the roof and the antenna, or behind the antenna. This leads to stripes inside the outlined area of the airwave data [34].
Geosciences 10 00382 g010
Figure 11. Earth resistance surveys in the presumed vicus of Slack Roman Fort, UK: (a) Twin-probe data severely degraded by a nearby radio transmitter (0.5 m mobile electrode separation, ca. 25 m distance to remote electrodes, 35–47 ohms, white to black); (b) data from Wenner array (0.5 m separation between each of the four electrodes, 30–55 ohms, white to black).
Geosciences 10 00382 g011
Figure 12. GPR data from Pessinus, Turkey, recording noise from the radio bursts of a strong nearby electromagnetic transmitter (red arrows) that vaguely resemble reflection hyperbolas, on both sides of an archaeological wall foundation. The data were collected with a Zond 12e system, using a weakly shielded 900 MHz antenna [44,45].
Geosciences 10 00382 g012
Figure 13. Data from a magnetometer survey in the landscape of Eidomeni in northern Greece have clearly located an area of architectural remains, but individual buildings cannot easily be identified. Evidence of historical maps suggests that the magnetic signals can be related to historical villages consisting of daub-built houses, which were burnt down during the 1st World War and dissolved due to rainwater, creating a lens that obscured the detection of features below the upper soil horizon (−70 to +100 nT, white to black) [67].
Geosciences 10 00382 g013
Figure 14. Results of a large magnetometer survey in the Po Valley, Italy, showing over the same area several lightning-induced anomalies (some outlined in red, see also inset), a dense network of palaeochannels, an Iron-age necropolis (green outline), and modern disturbances (−15 to +15 nT, white to black) [75].
Geosciences 10 00382 g014
Figure 15. Results of an earth resistance ARP® survey showing freeze-thaw features that obscure anomalies from the Gallo-Roman site of Vieil-Evreux (France) (−1 to +1 standard deviation, white to black; data courtesy of Geocarta SAS, Paris, France) [76].
Geosciences 10 00382 g015
Figure 16. Earth resistance surveys undertaken before and after rain with the ARP® array: (a) 0.5 m electrode spacing—no data could be recorded in the other channels, due to the very high contact resistance; (b) 1.0 m electrode spacing showing structural remains just after the rainfall (−1 to +1 standard deviation, white to black) [77].
Geosciences 10 00382 g016
Figure 17. GPR time slices of a Neolithic long house in Szeghalom-Kovácshalom in eastern Hungary at 0.8–0.9 m depth: (a) Dry season; (b) after intense rainfall with strongly attenuated signals (high reflection amplitudes in yellow and red).
Geosciences 10 00382 g017
Figure 18. Example of a semivariogram fitted with a spherical model (lag tolerance 10 m, nugget effect 3700, sill 38,000, range 139 m, number of points 770) [89].
Geosciences 10 00382 g018
Table 1. Comparison of statistics of stationary measurements with different magnetometers (where not otherwise stated, data are from Figure 2, courtesy of Geocarta SAS, Paris, France).
Instrument/SensorRMS (nT)Range, Peak-to-Peak over 60 s (nT)
Geoscan FM36 [6]0.29
Bartington Grad 601 [6]0.06
Scintrex SM4s [6]0.01
Ferex CON 650 [13]0.21
Ferex CON 650, specialized acquisition board0.160.60
Bartington Grad-01-1000L, specialized acquisition board0.030.05
Geometrics G-8580.020.08
Table 2. Dependence of RMS noise on sampling frequency with and without anti-aliasing filter for a Bartington Grad-01-1000L sensor (data courtesy of Geocarta SAS, Paris, France).
Frequency (Hz)Without Filter (nT)With Filter (nT)
250.01320.0094
800.01710.0104
2000.01810.0125
10000.03240.0207