Evaluation of Shale Source Rocks and Clay Mineral Diagenesis in the Permian Basin, USA: Inferences on Basin Thermal Maturity and Source Rock Potential

 ,
,
Abstract
:1. Introduction
2. Geological Background
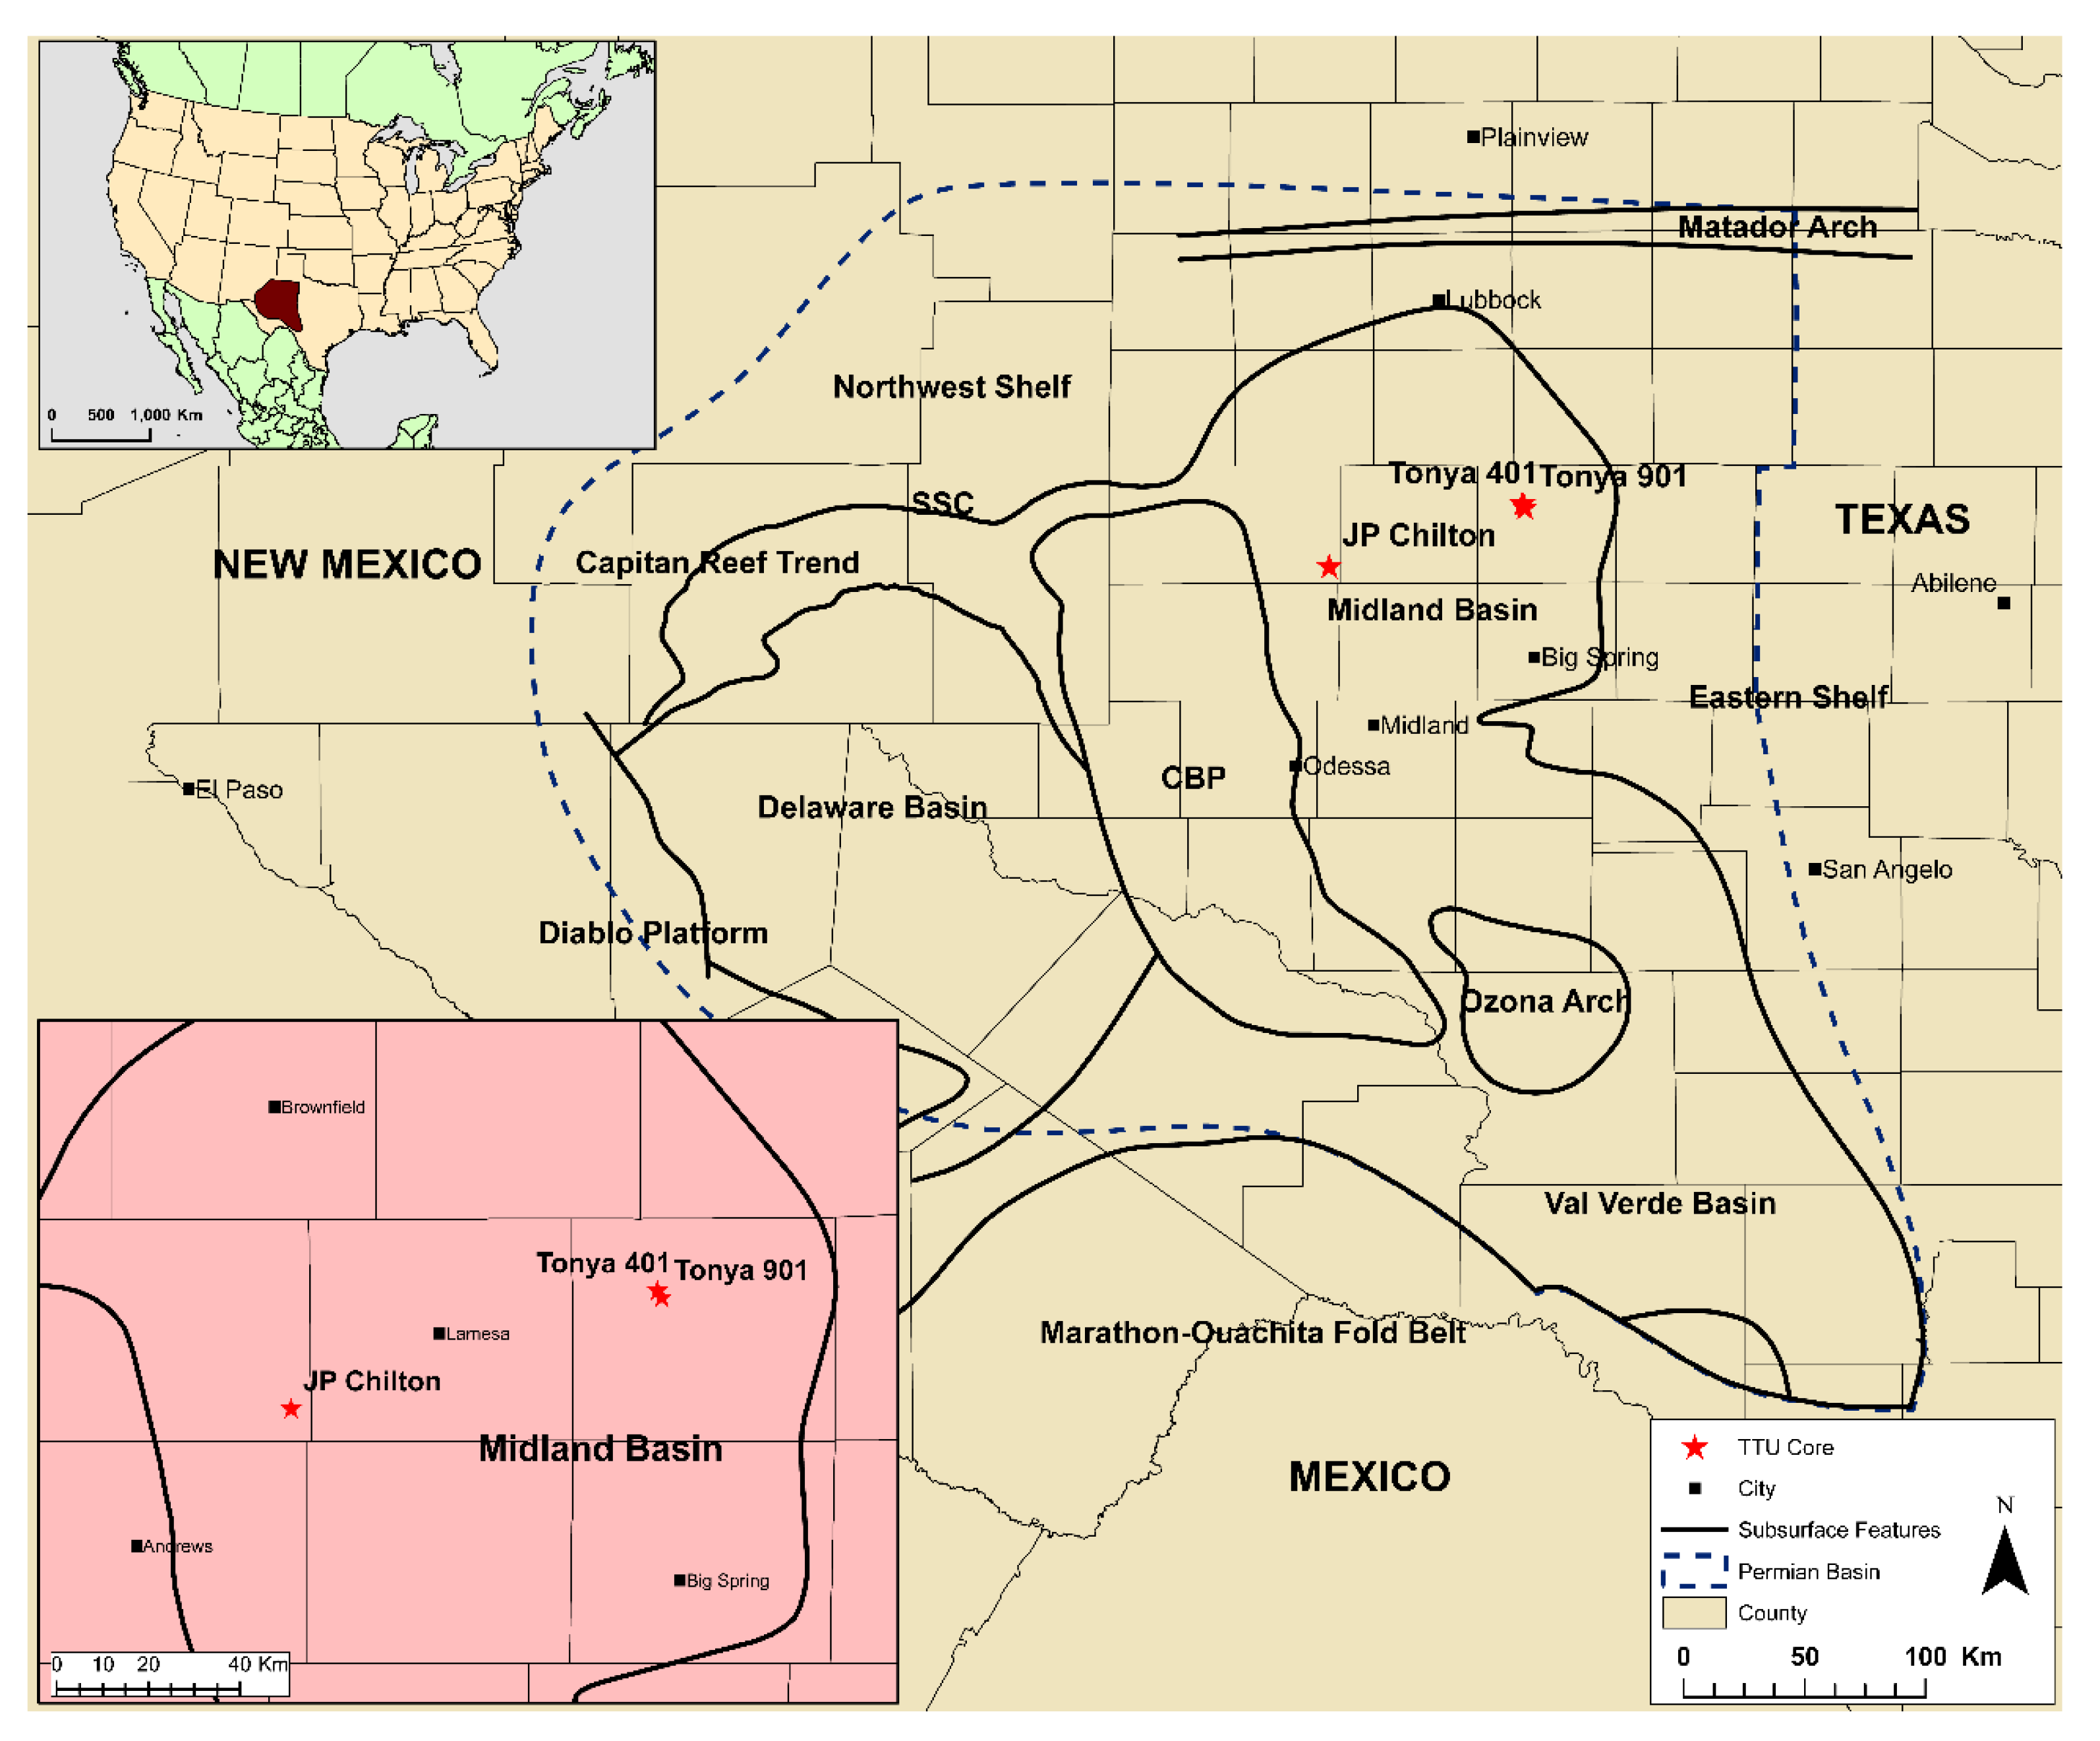
2.1. Paleogeography and Tectonics
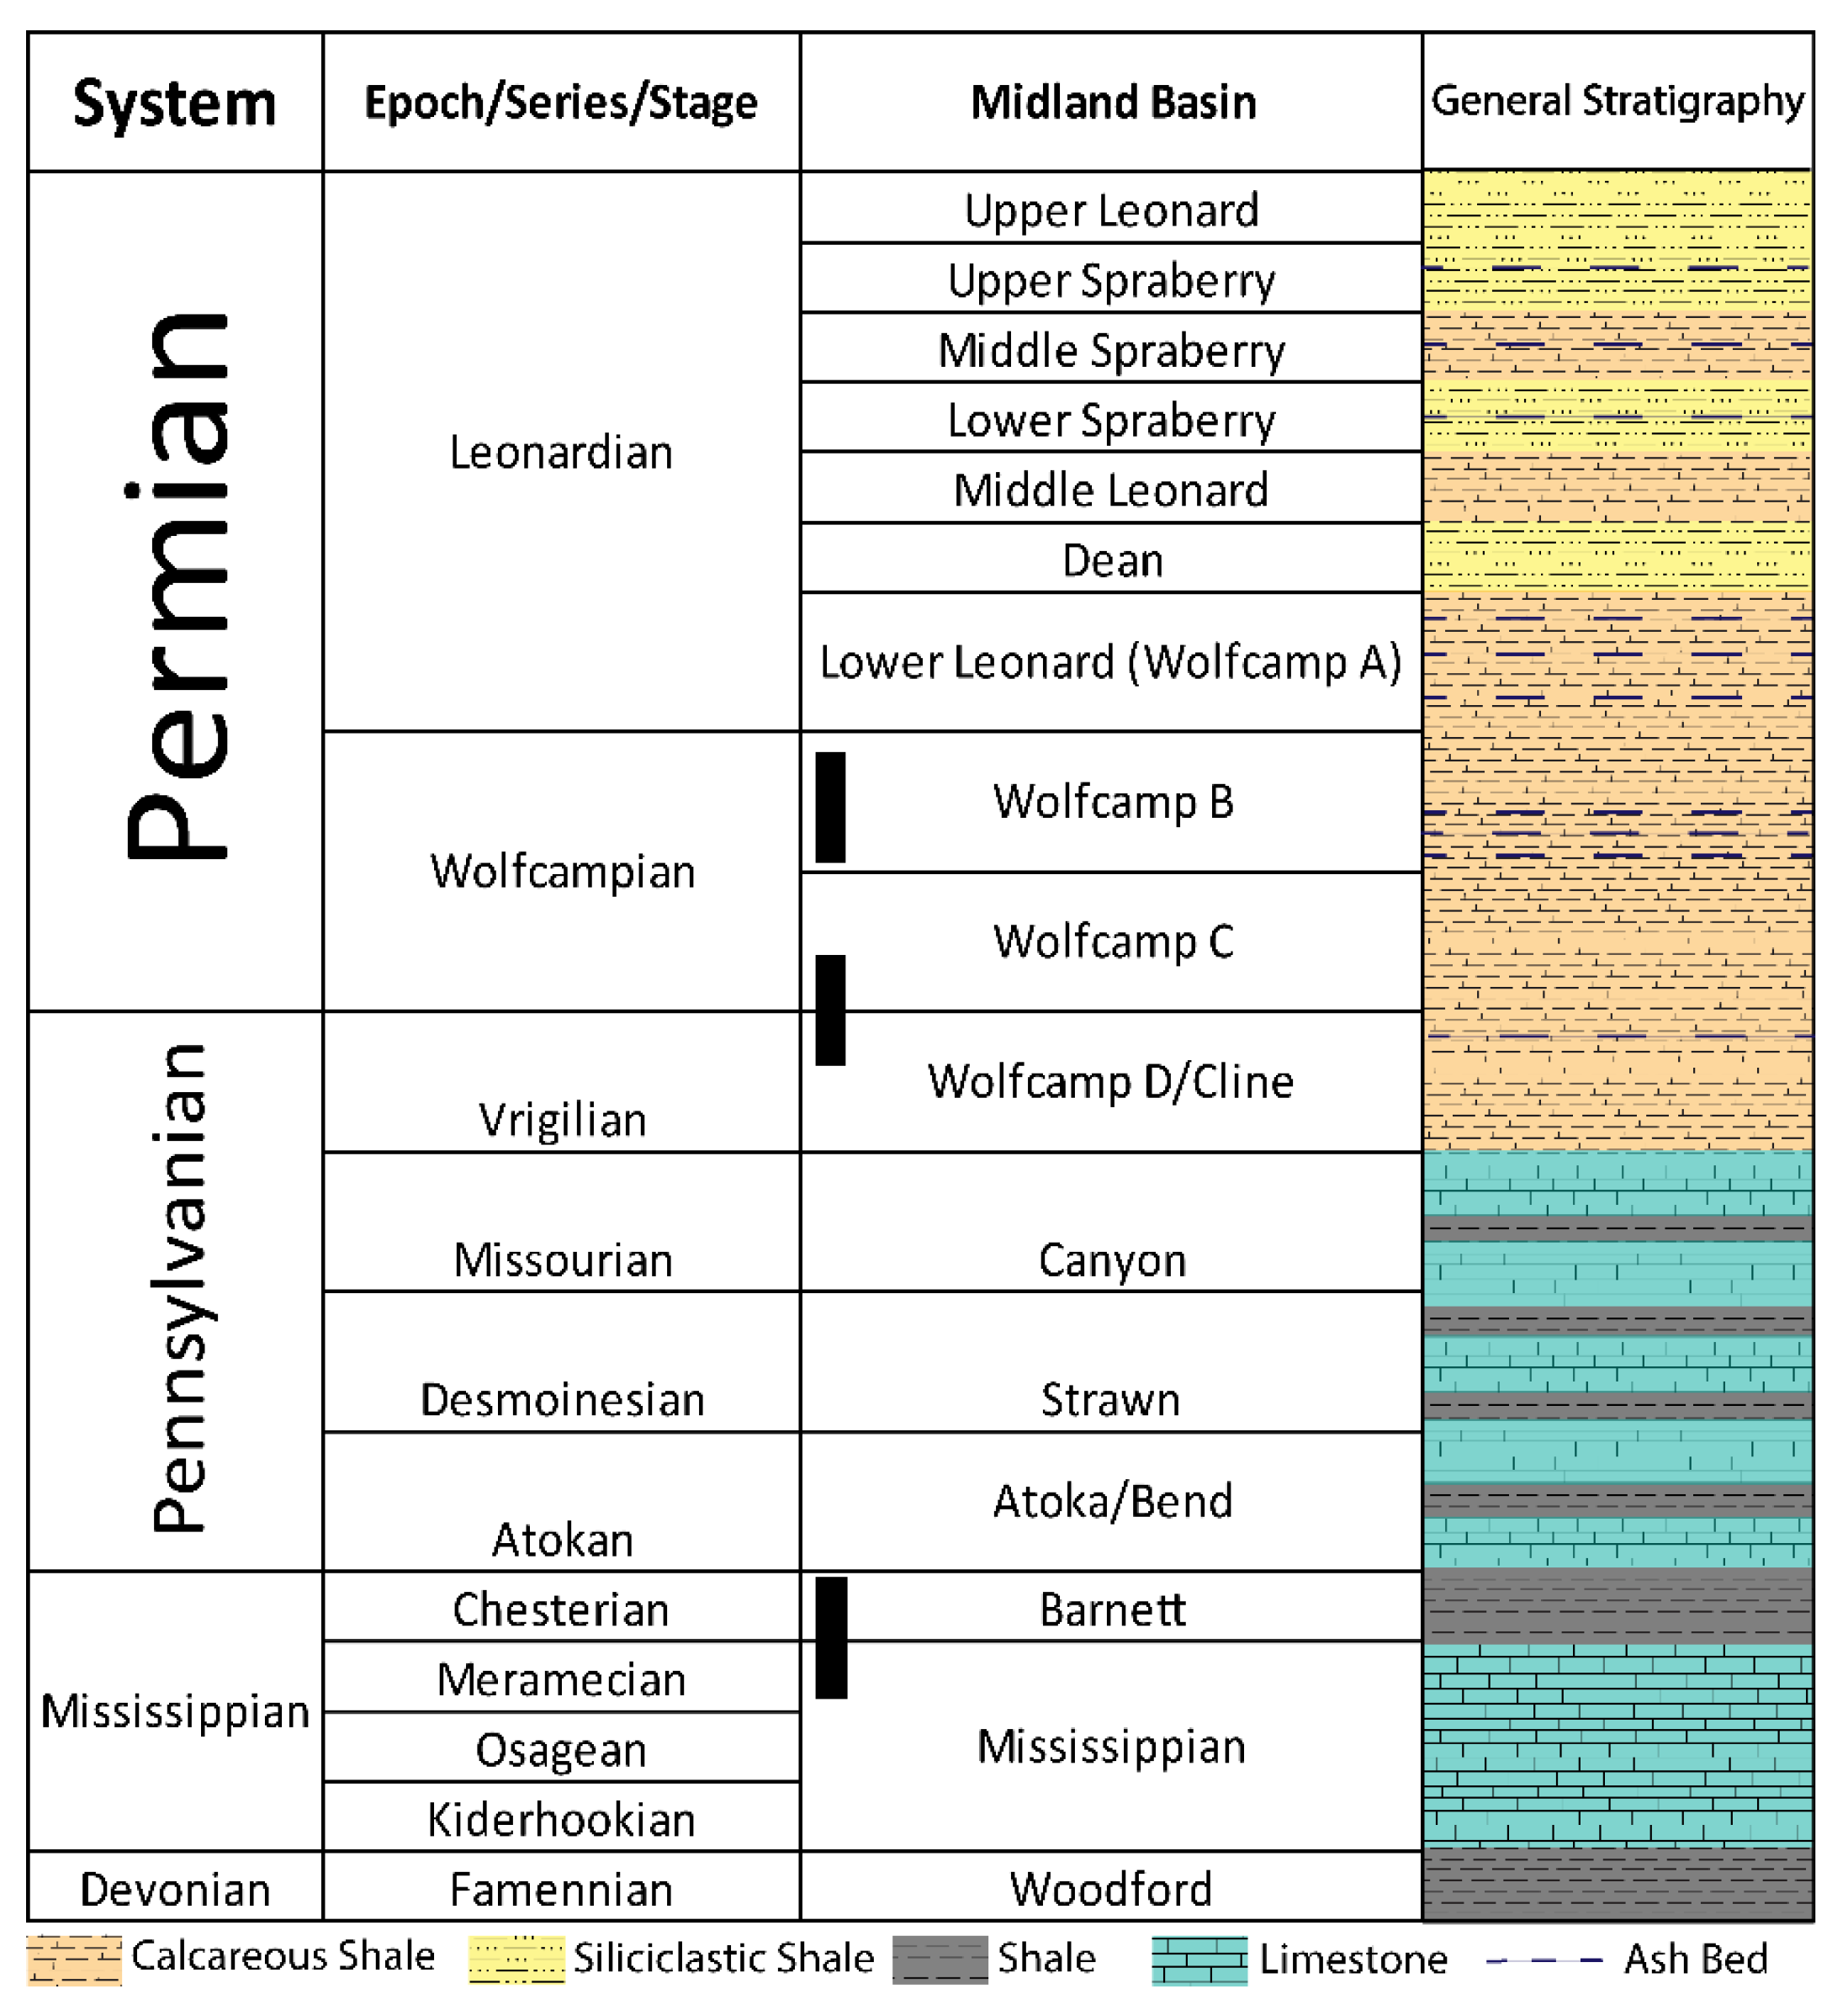
2.2. Deposition and Stratigraphy
3. Materials and Methods
3.1. Sample Materials
3.2. X-Ray Diffraction
3.3. Interpretation and Modeling of XRD Patterns
3.4. Rock-Eval pyrolysis
4. Results
4.1. Lithofacies
4.2. XRD Mineralogy
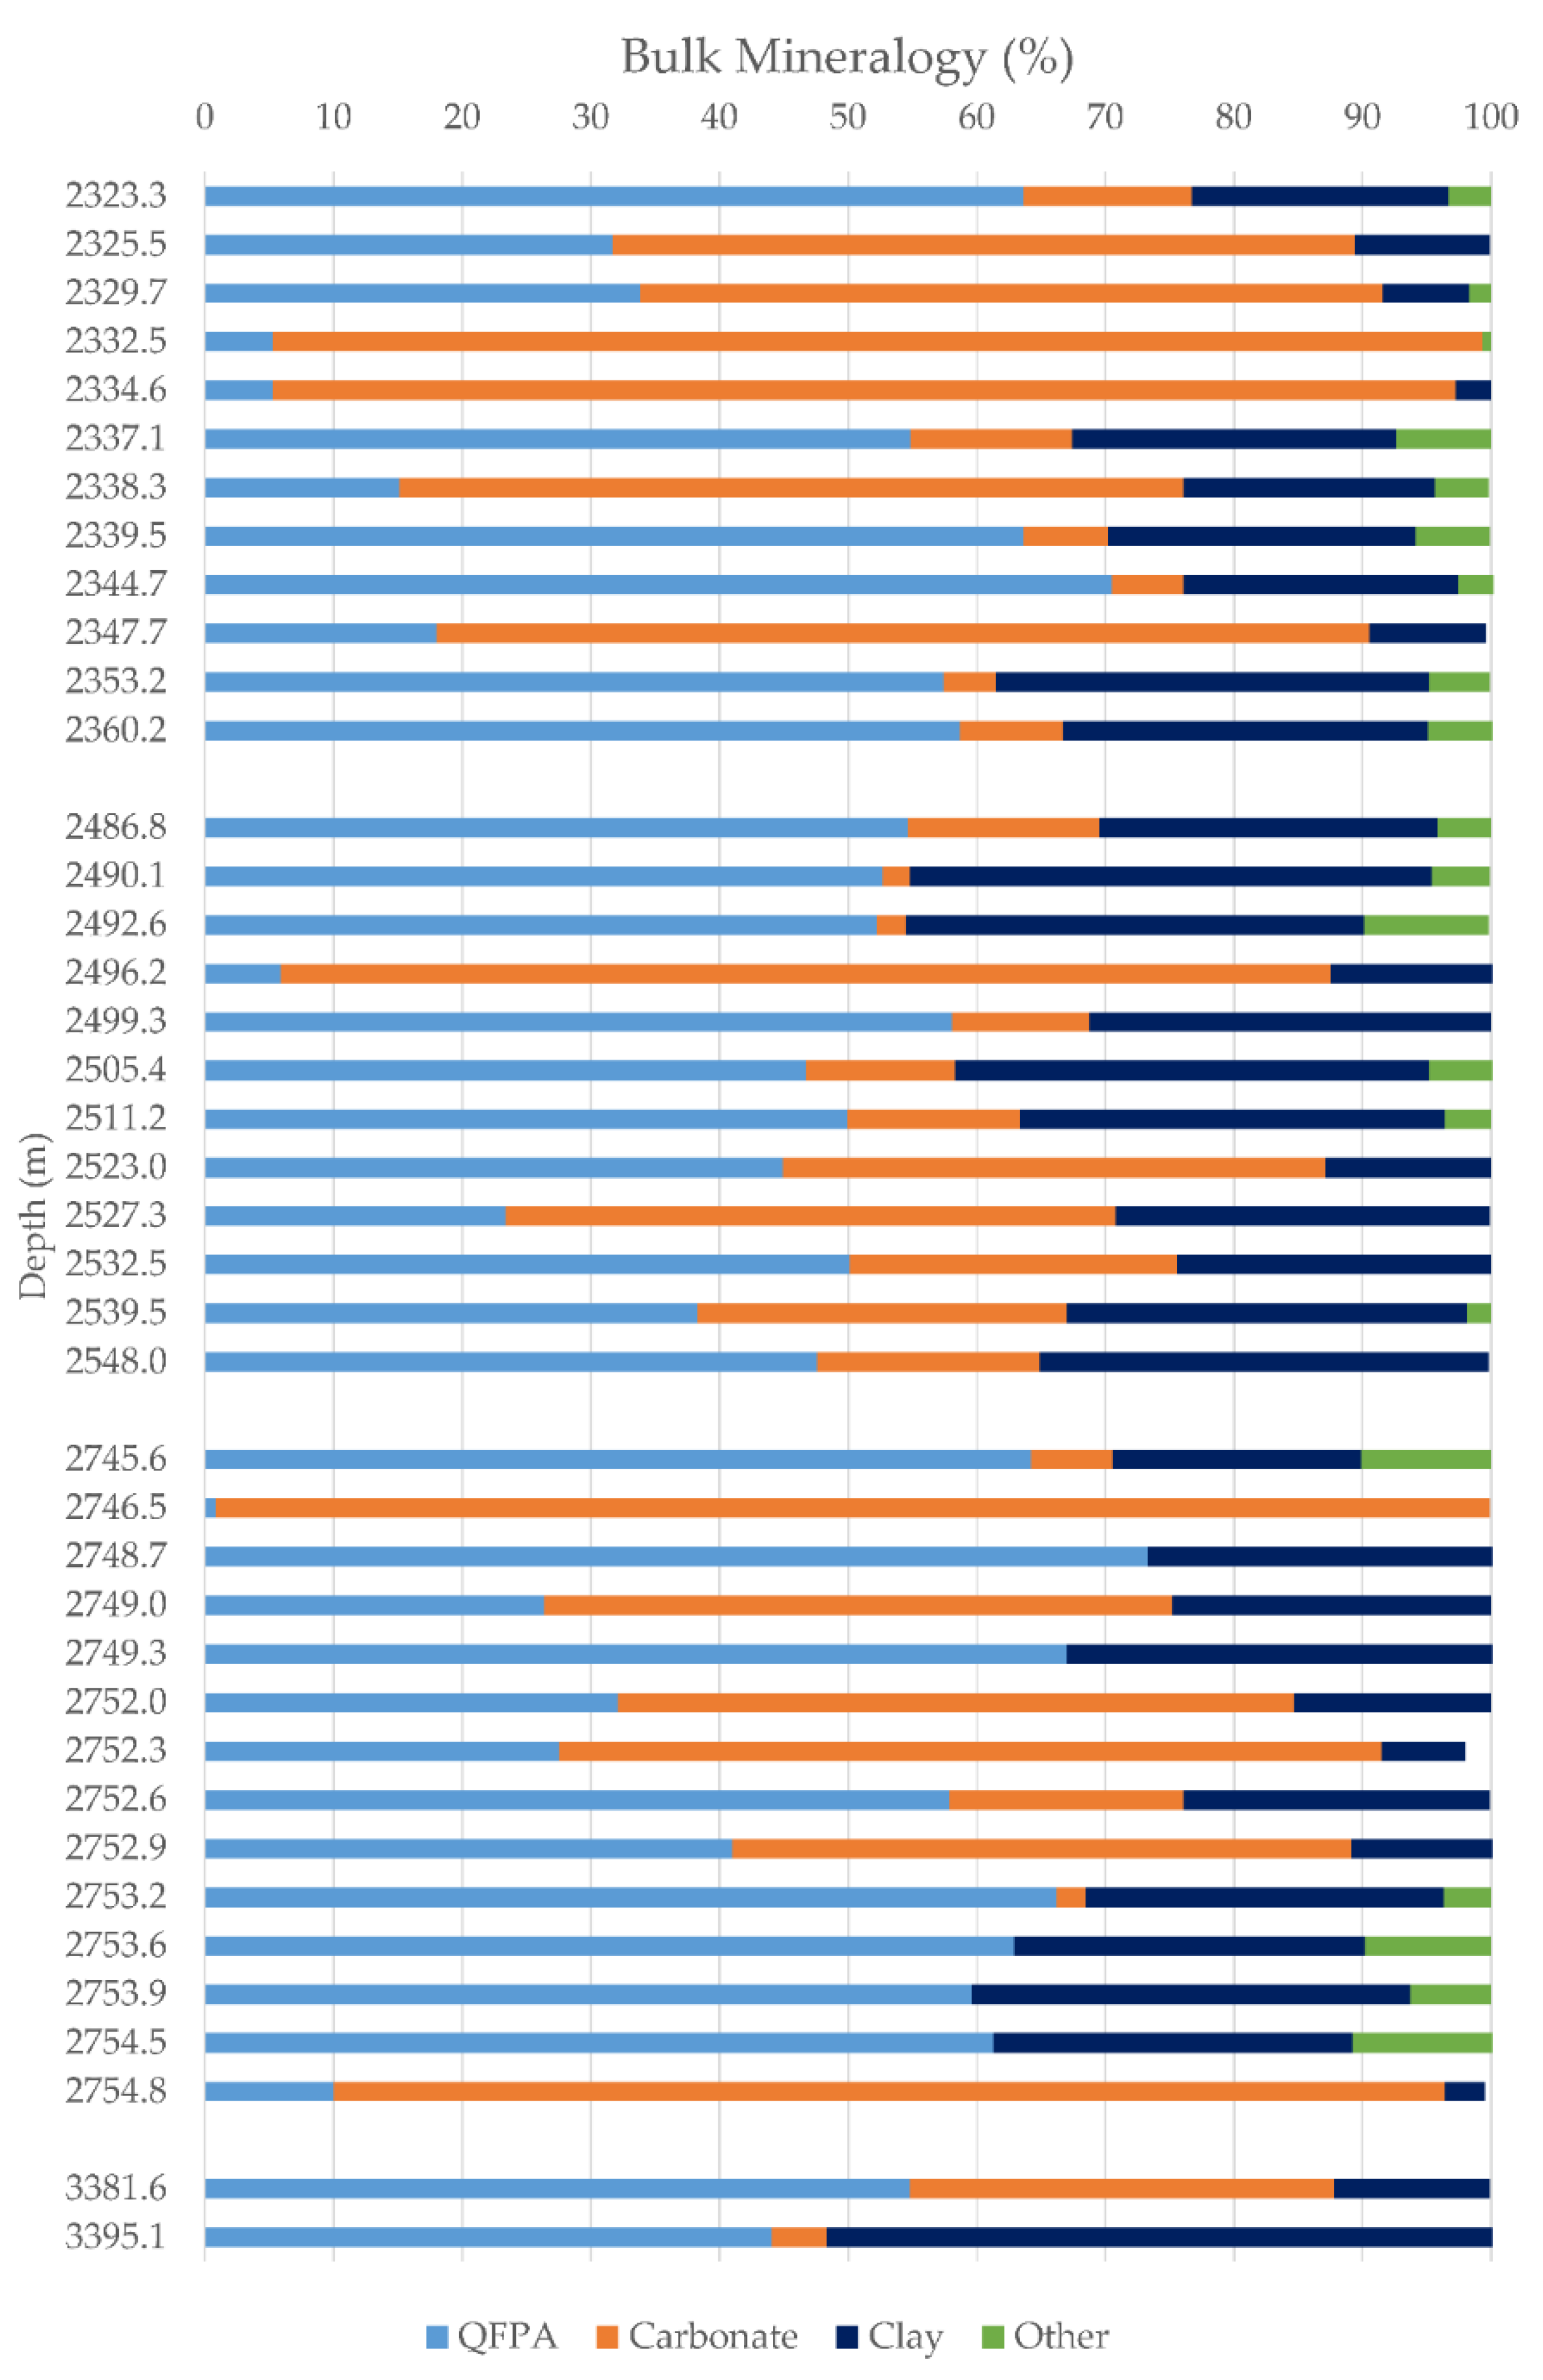
4.2.1. Whole-Rock Fraction
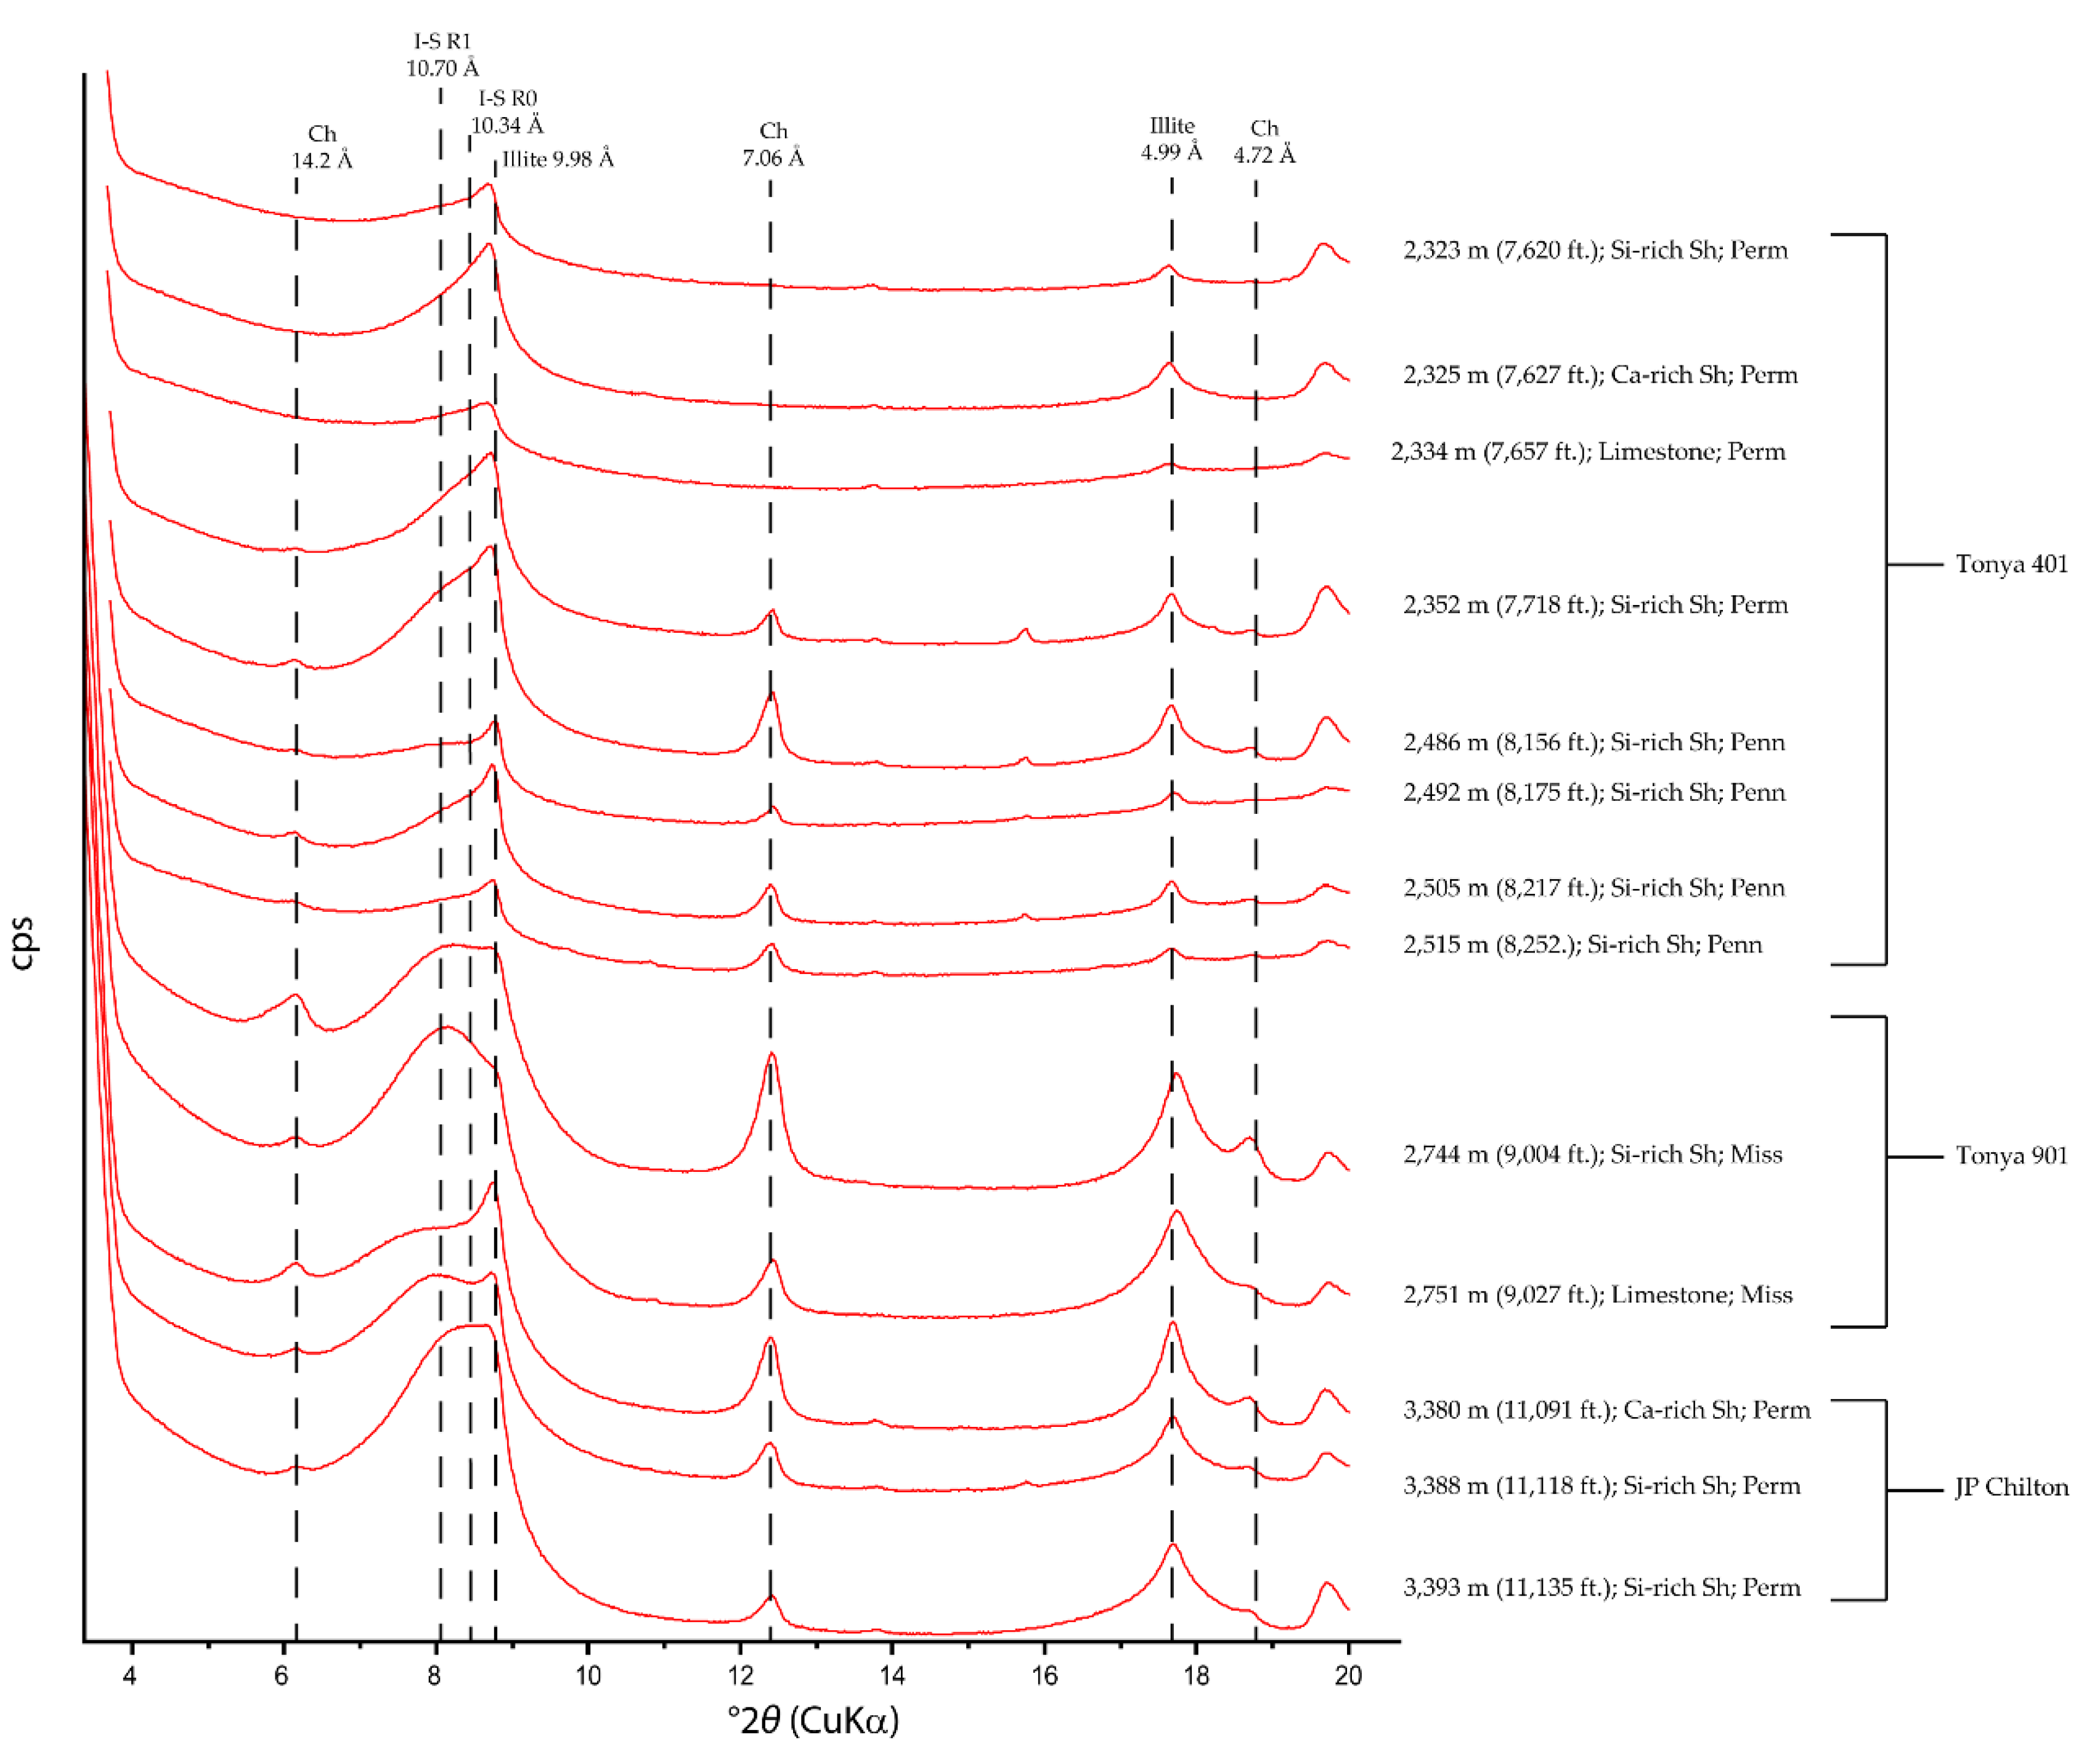
4.2.2. Clay Fraction
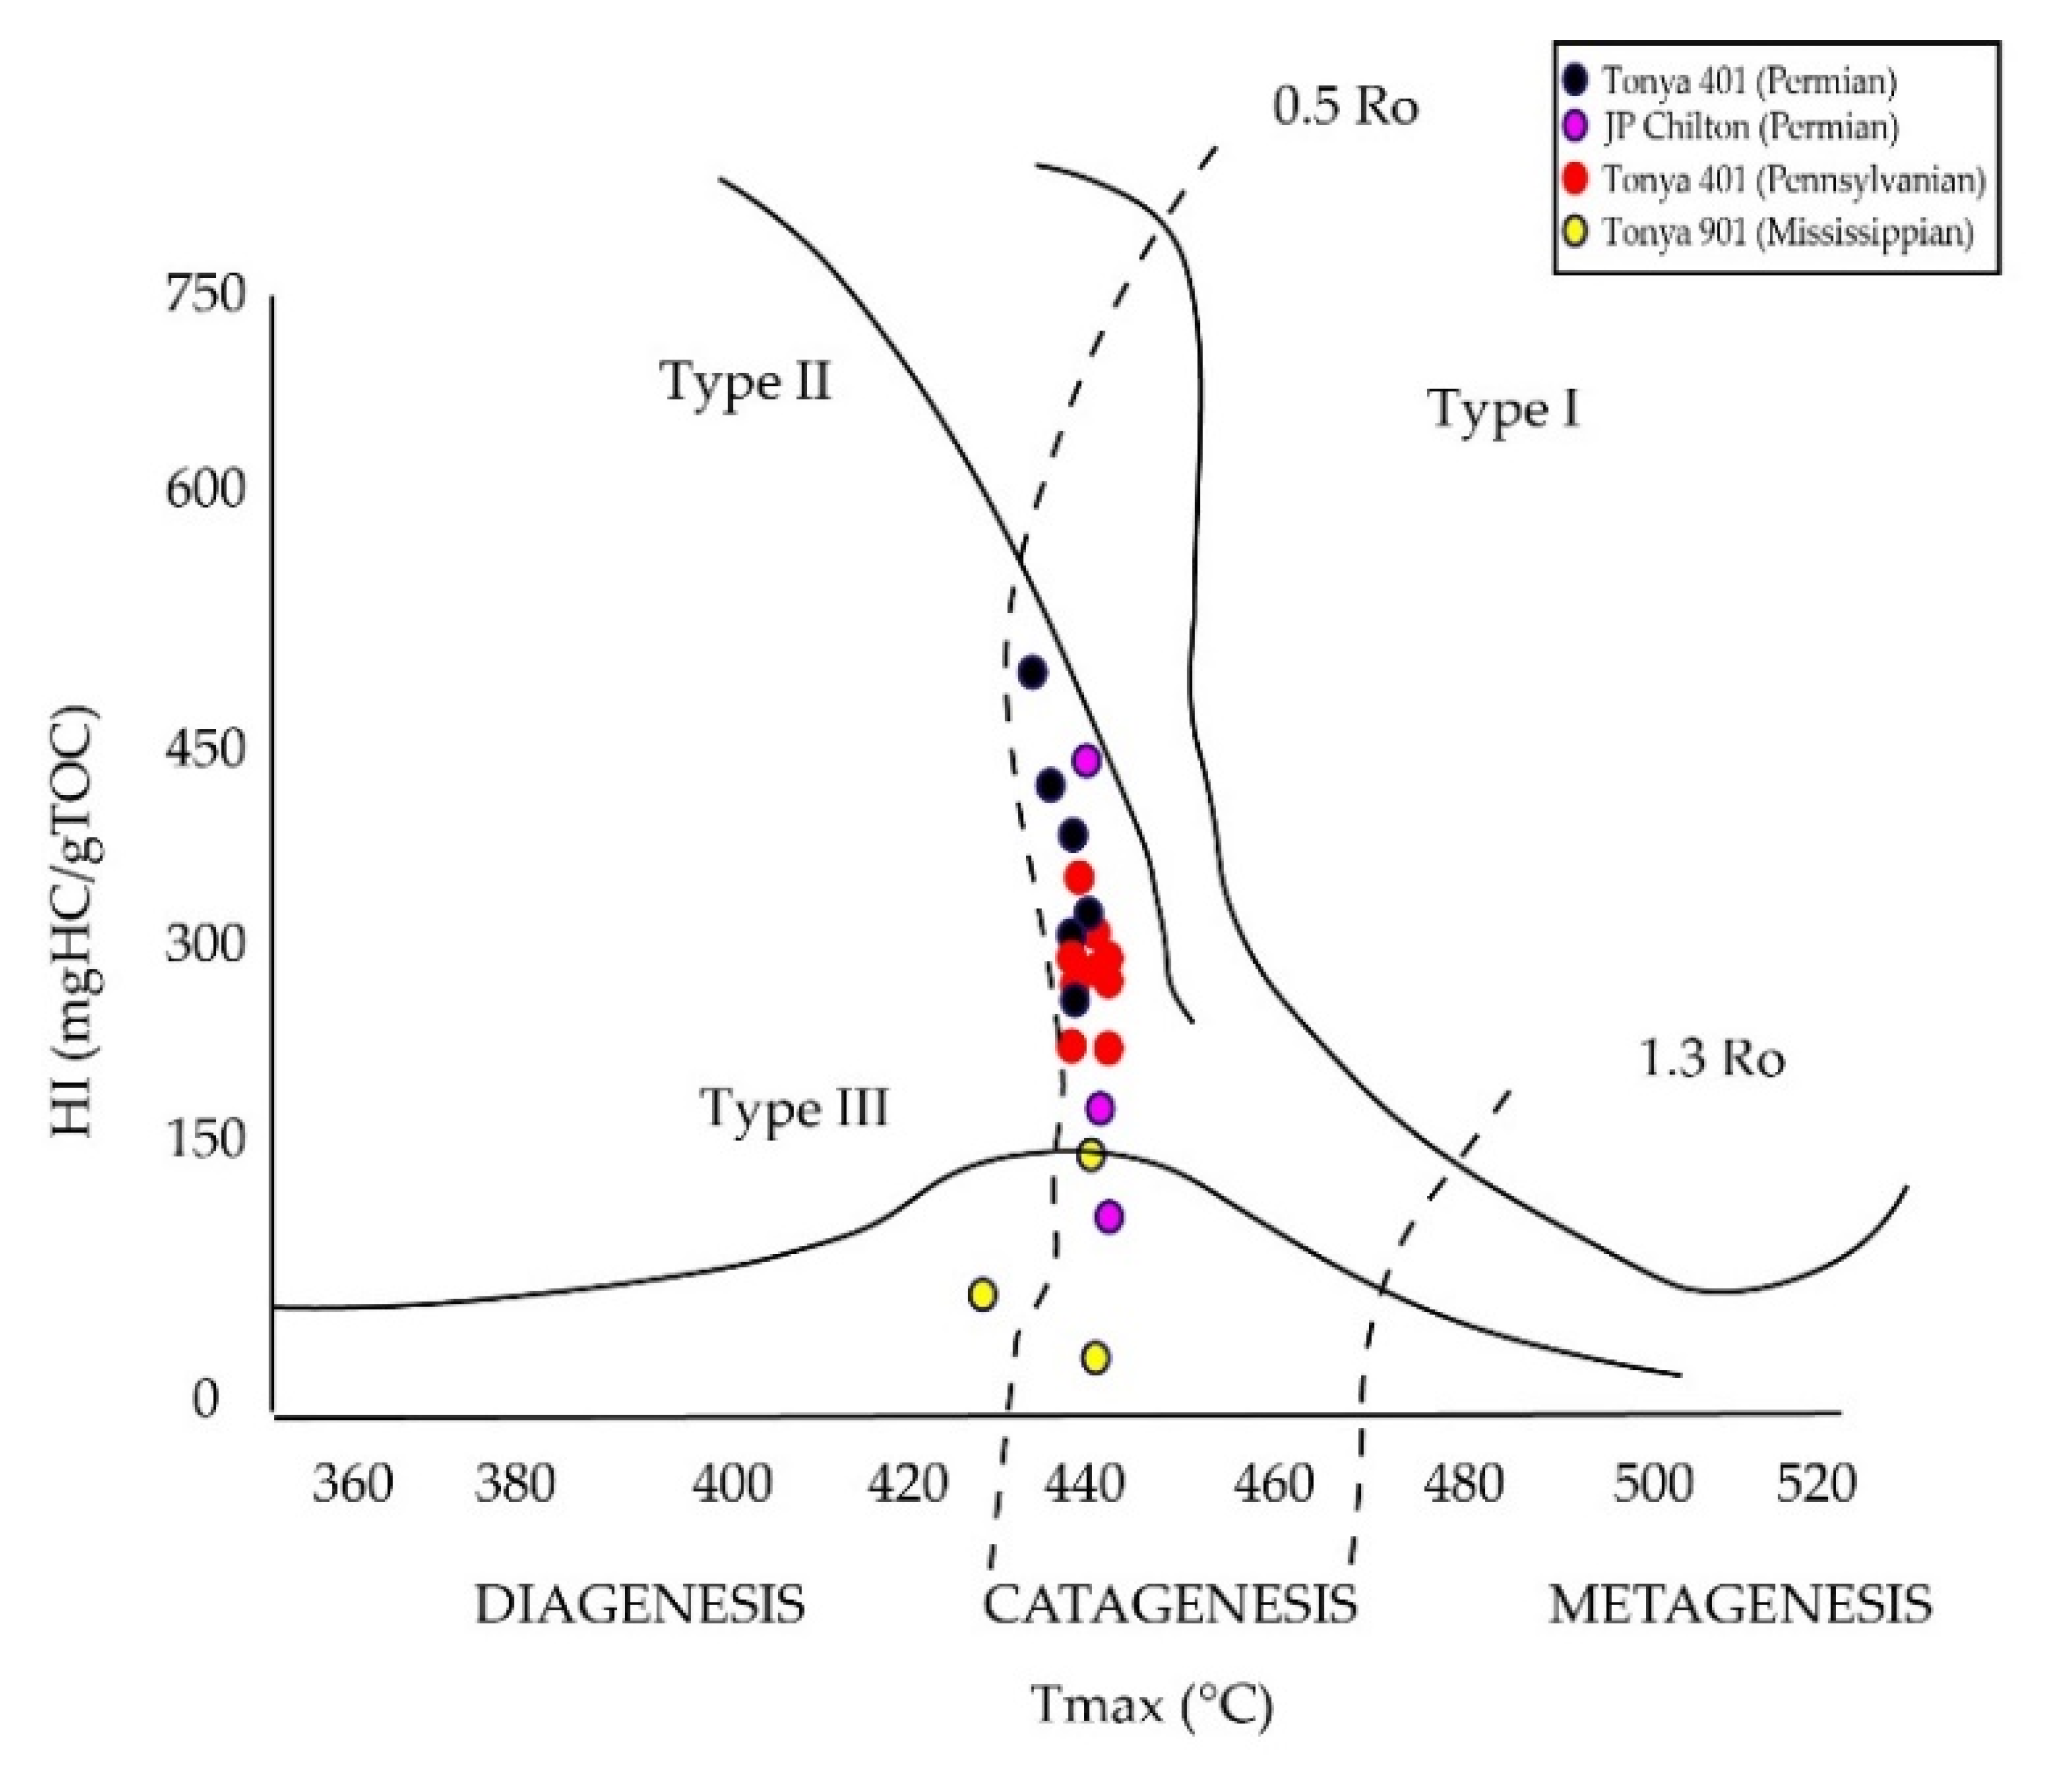
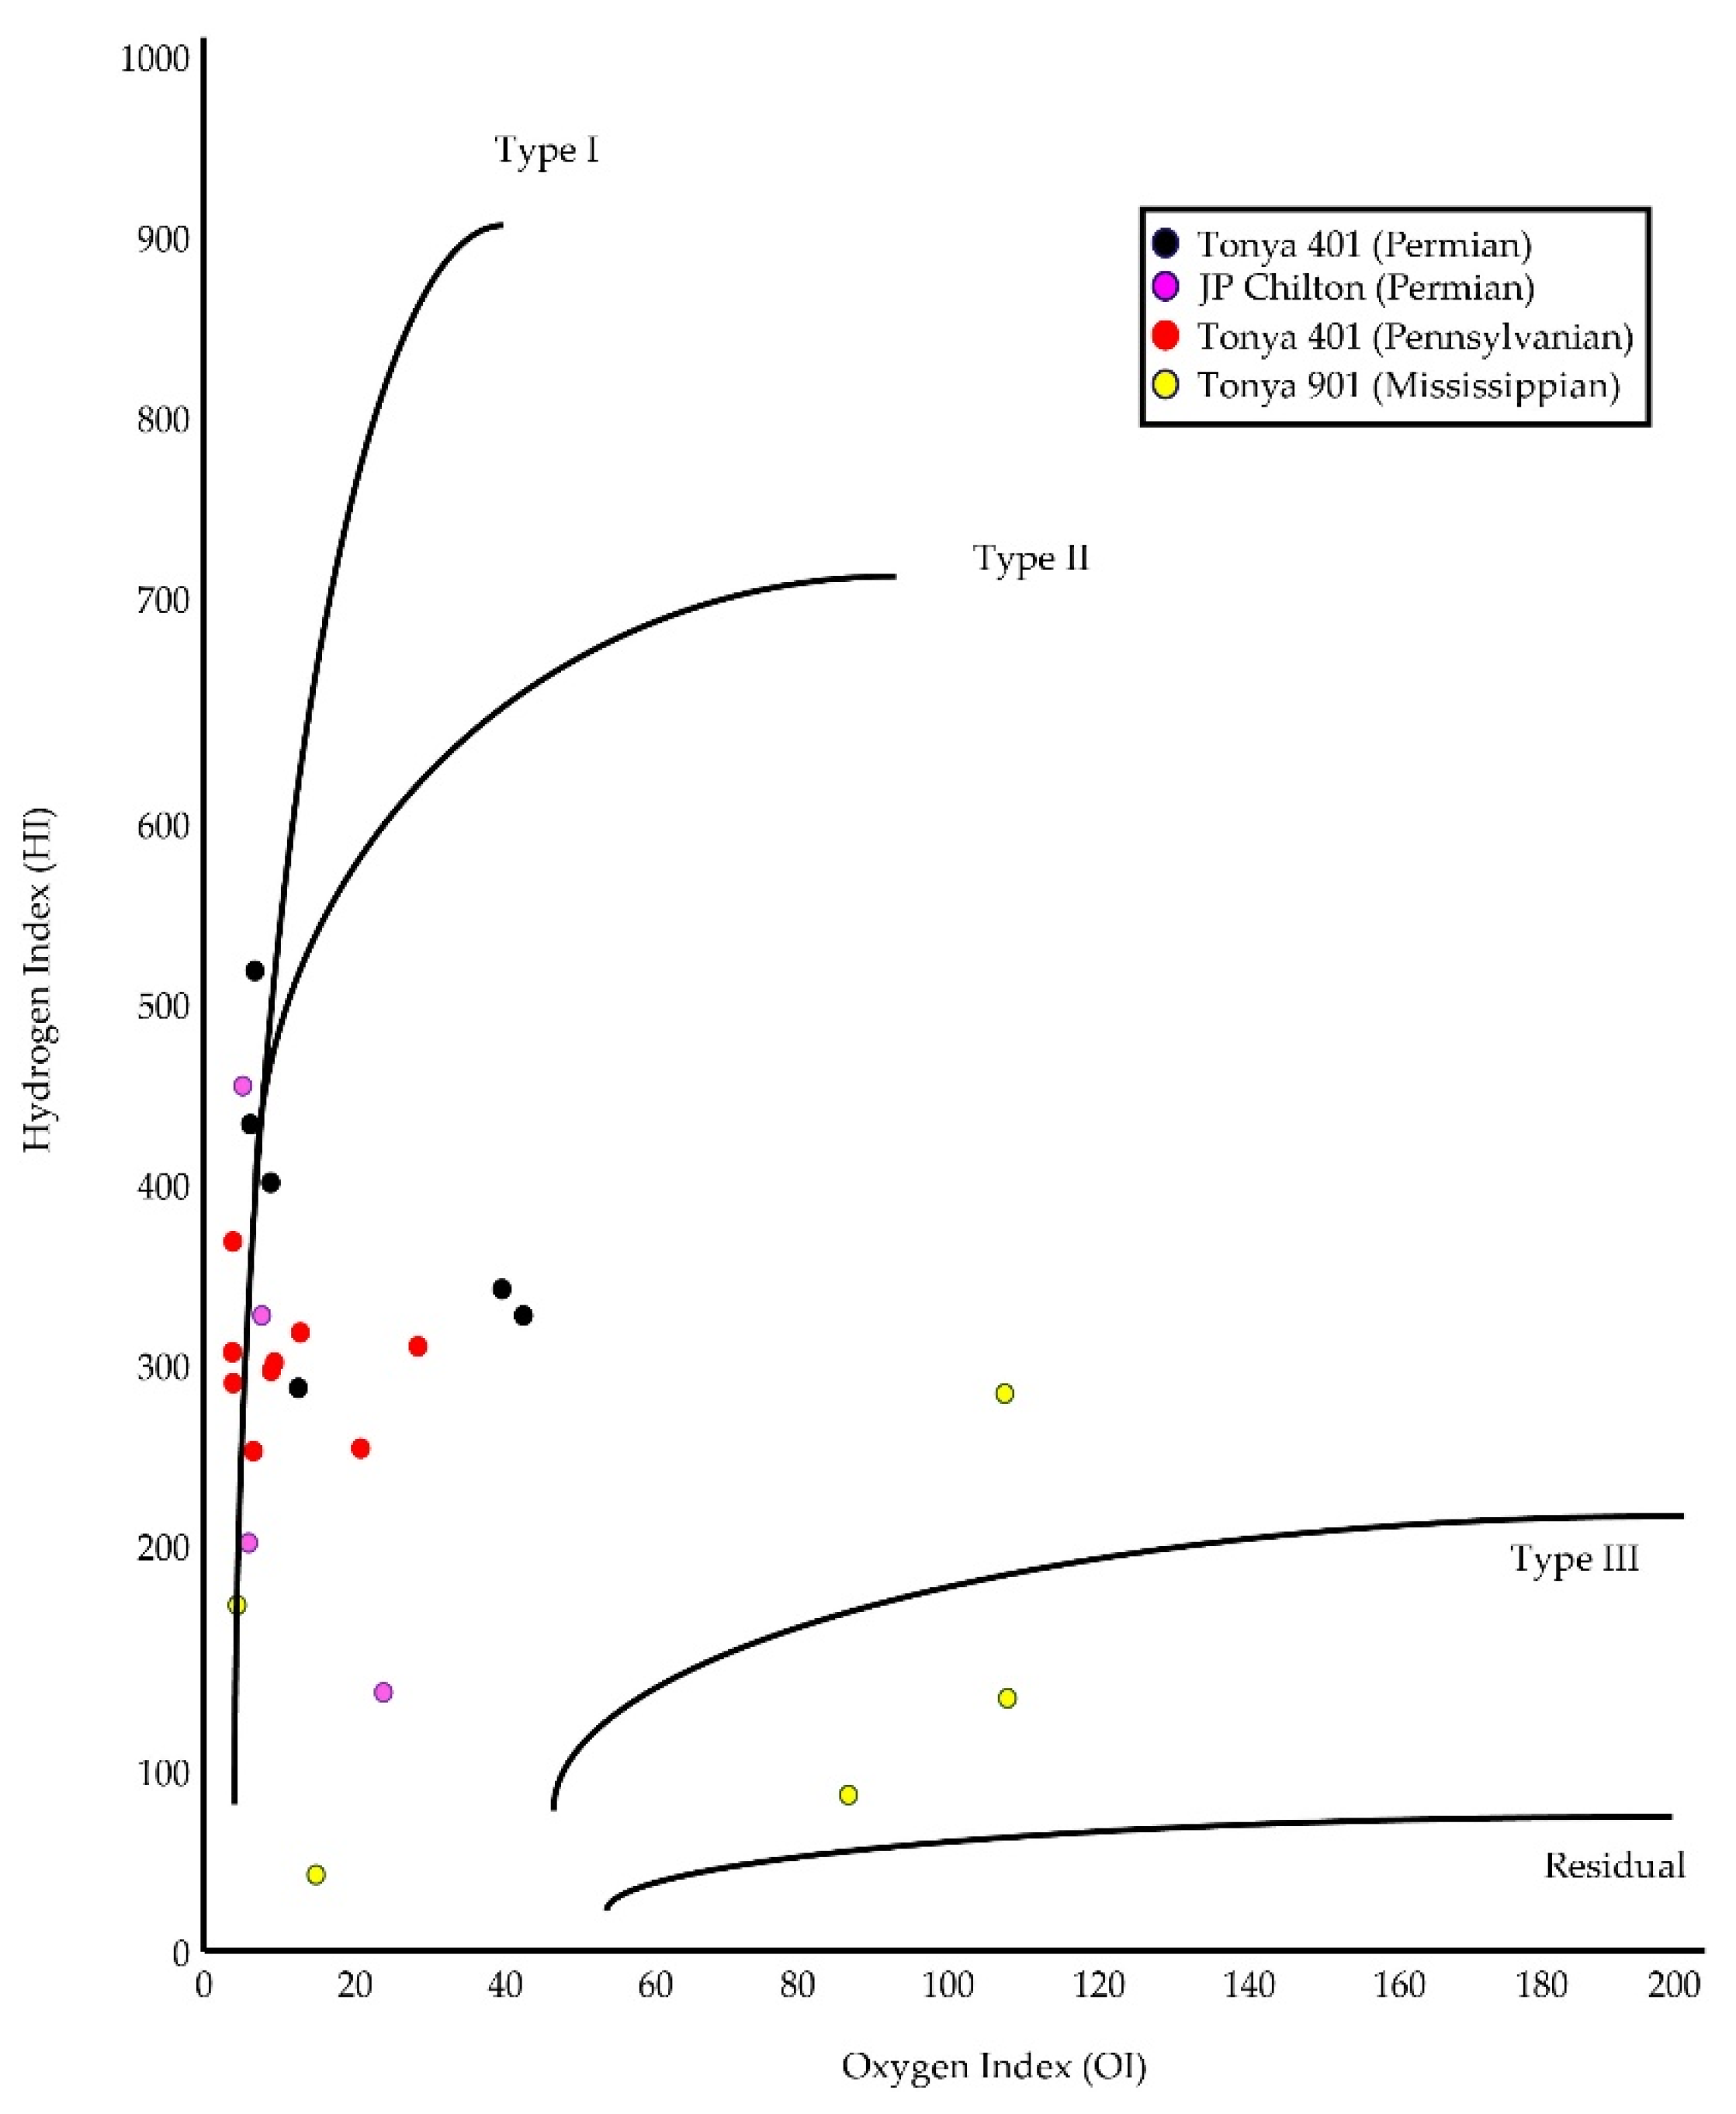
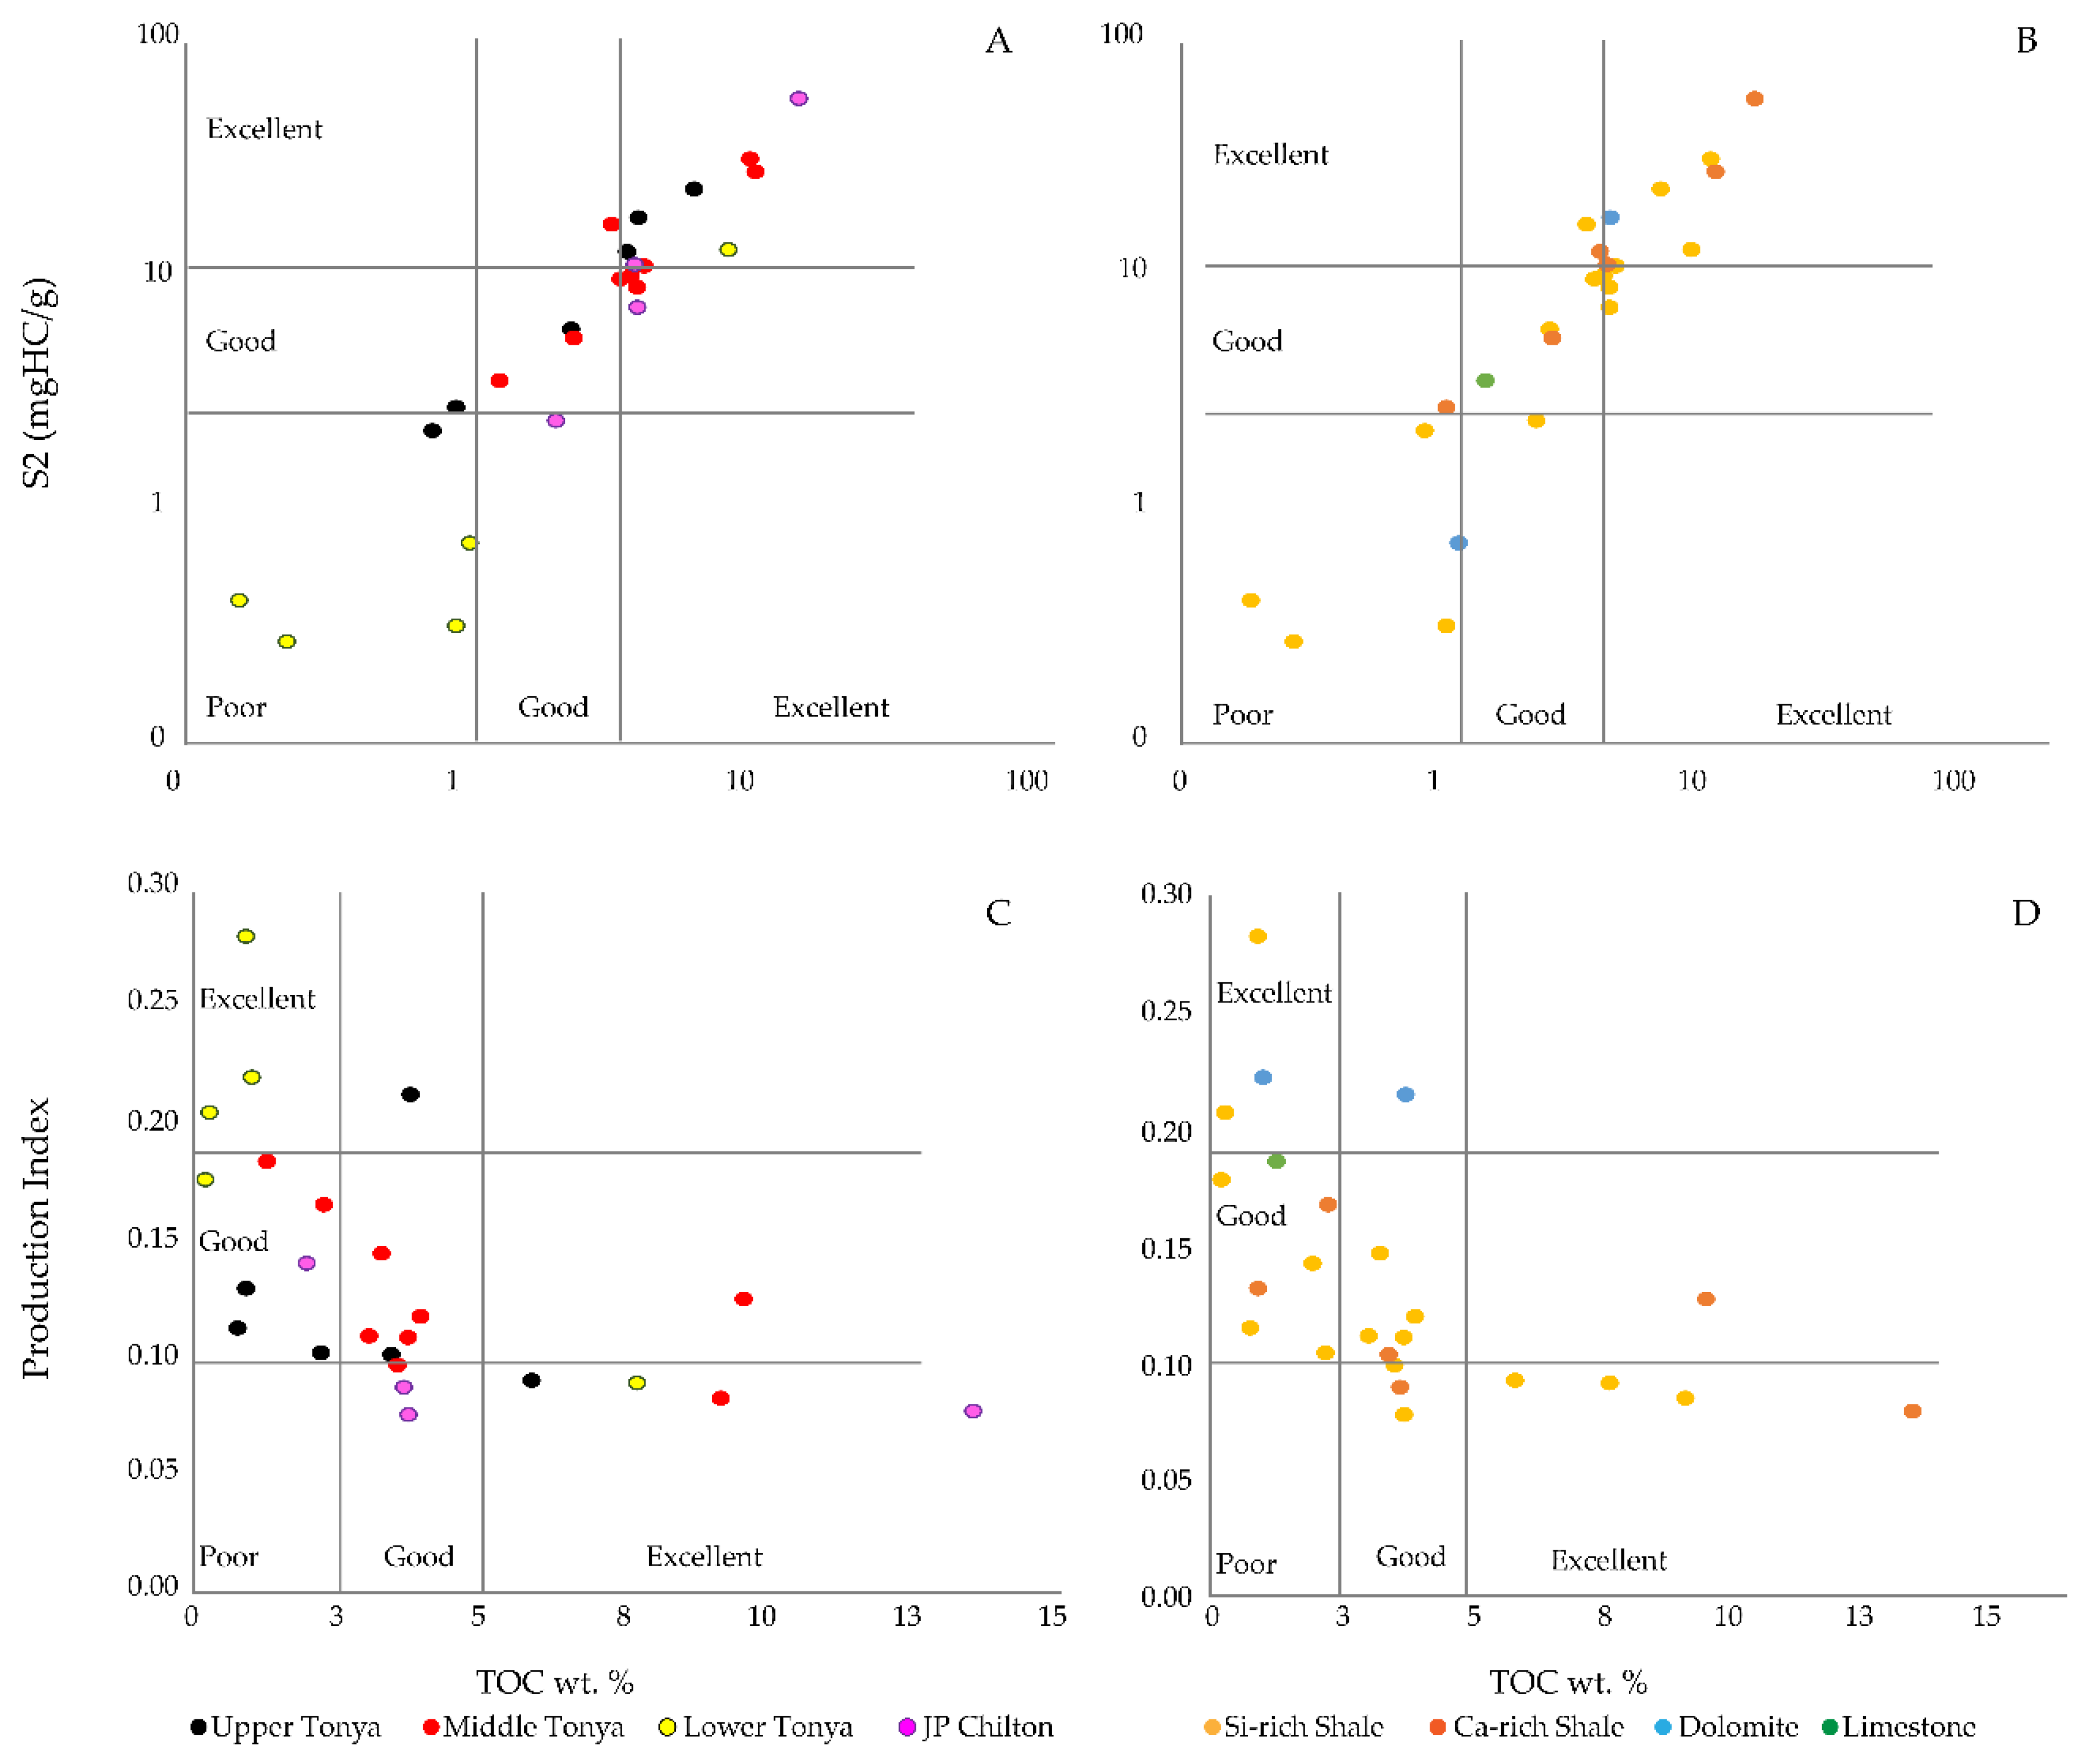
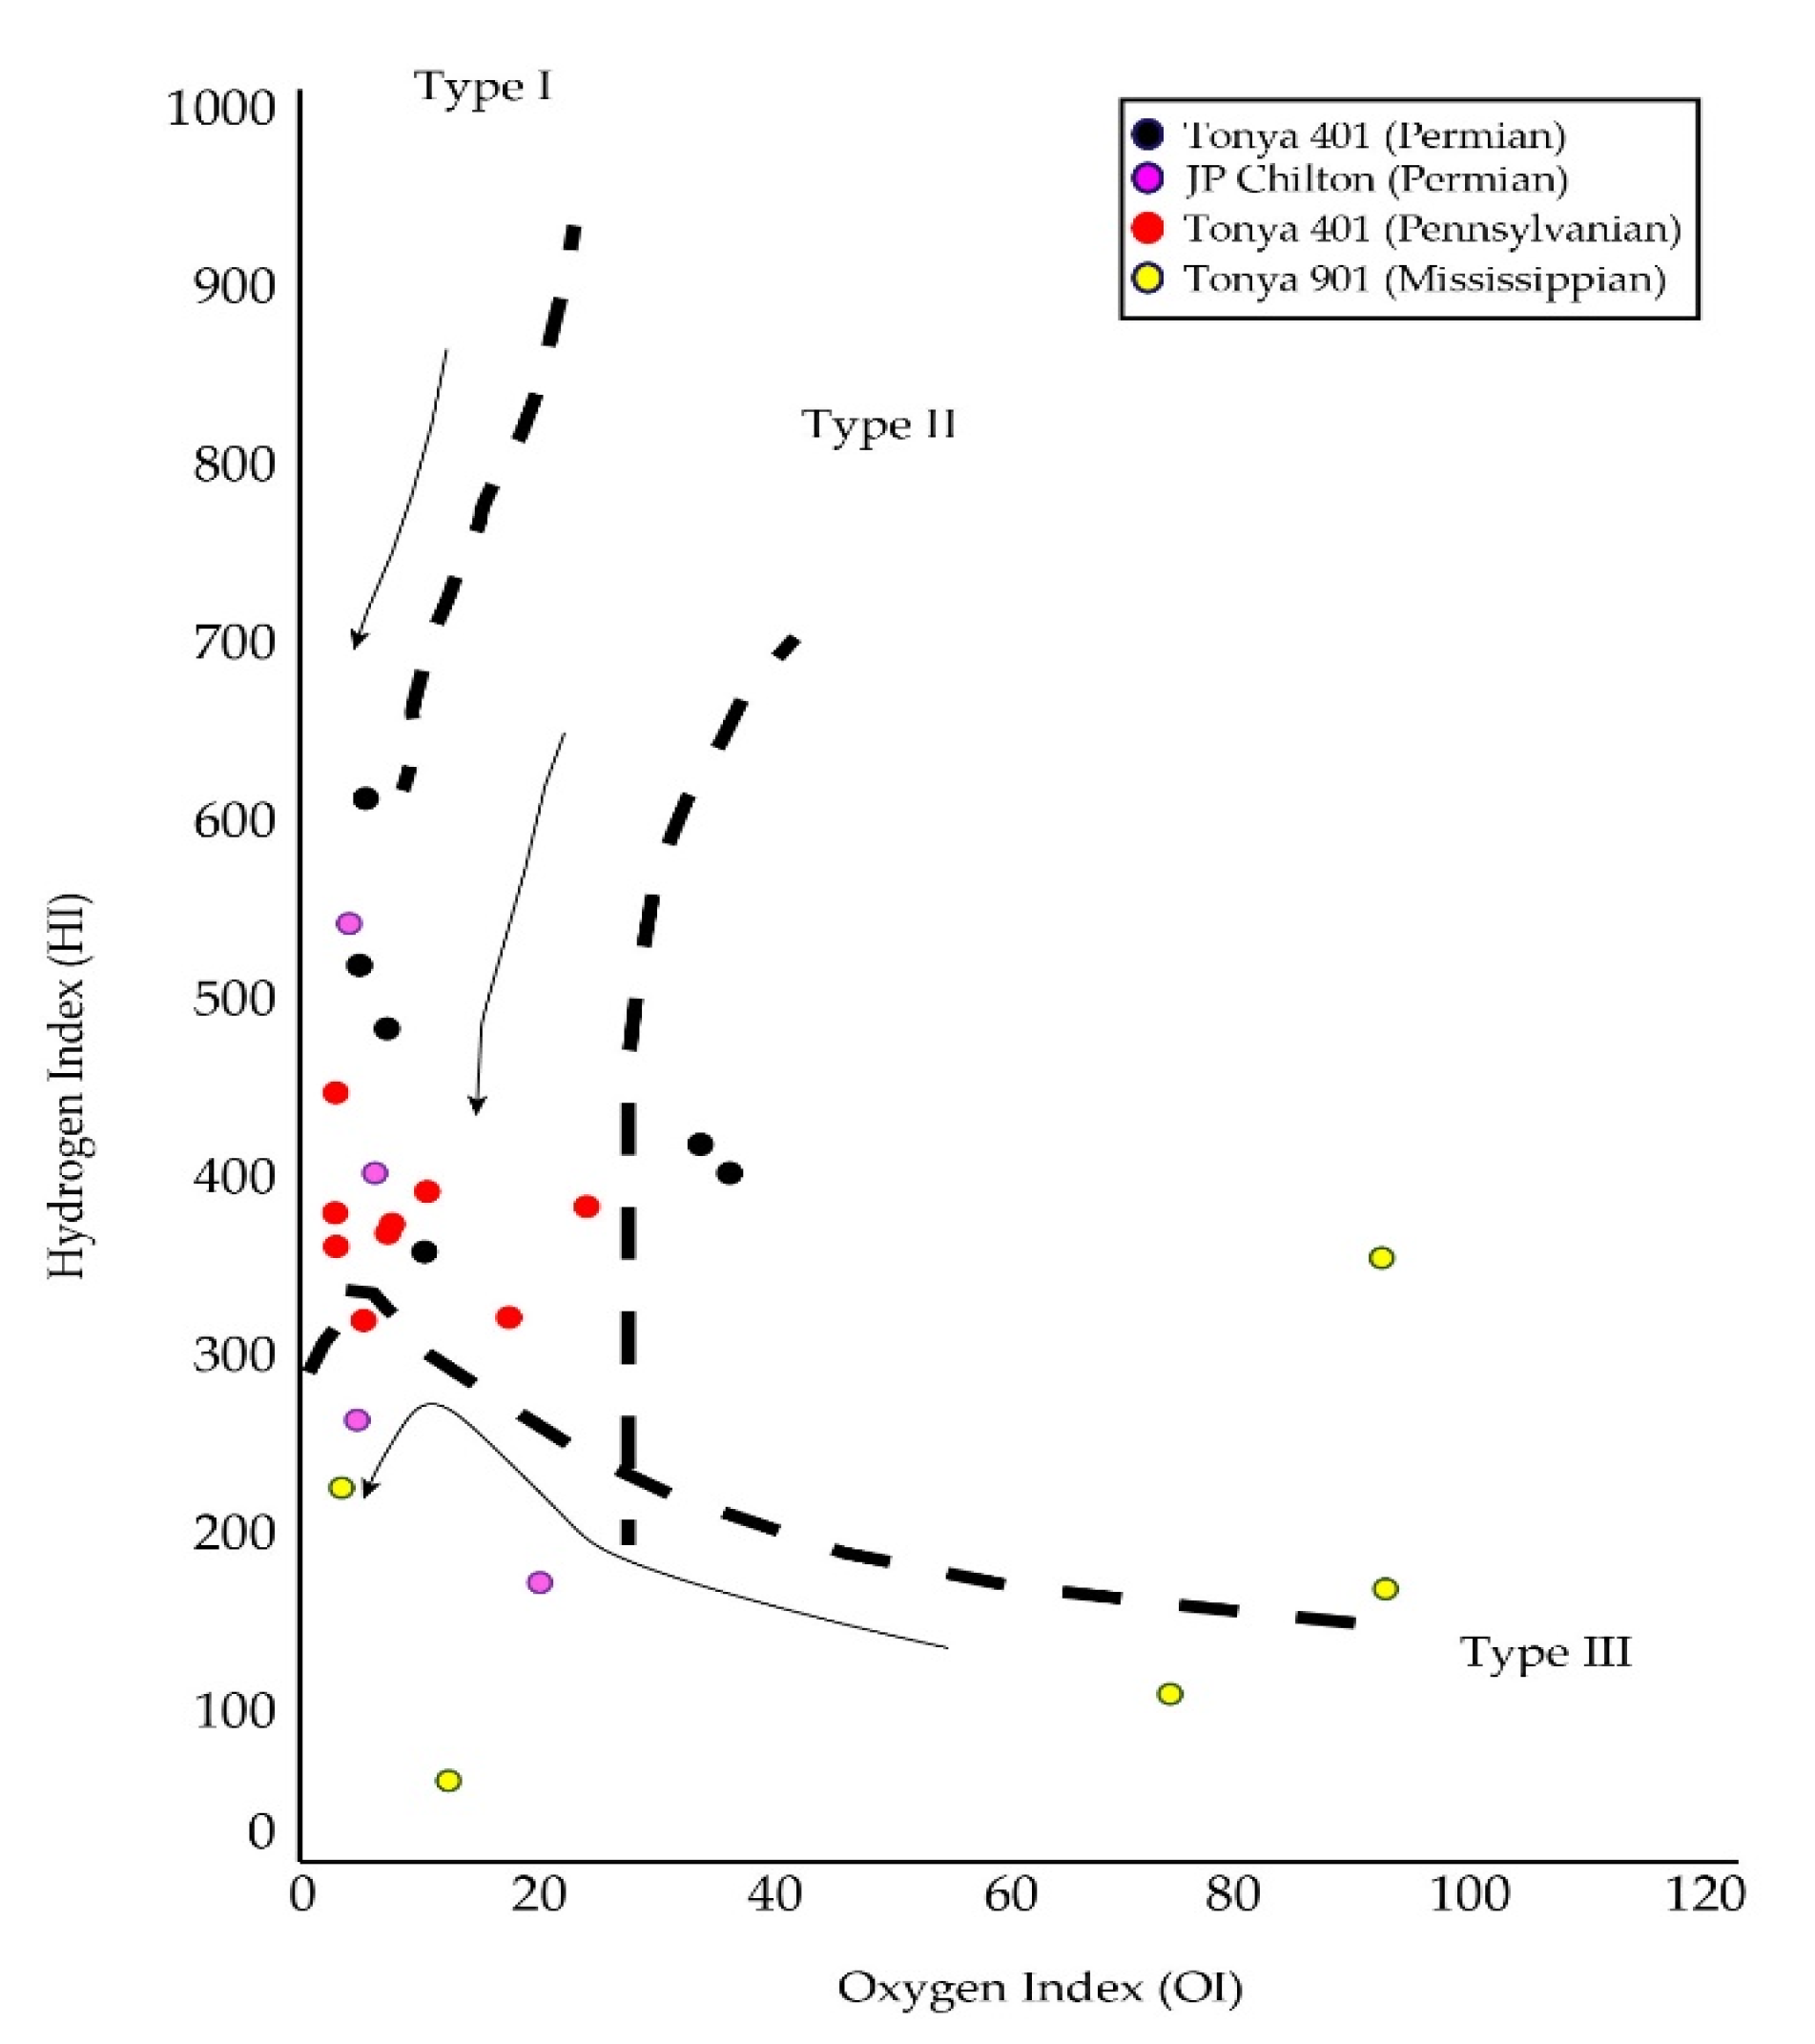
4.3. Rock-Eval Pyrolysis
5. Discussion
5.1. Clay Mineral Evolution
5.2. Source Rock Potential
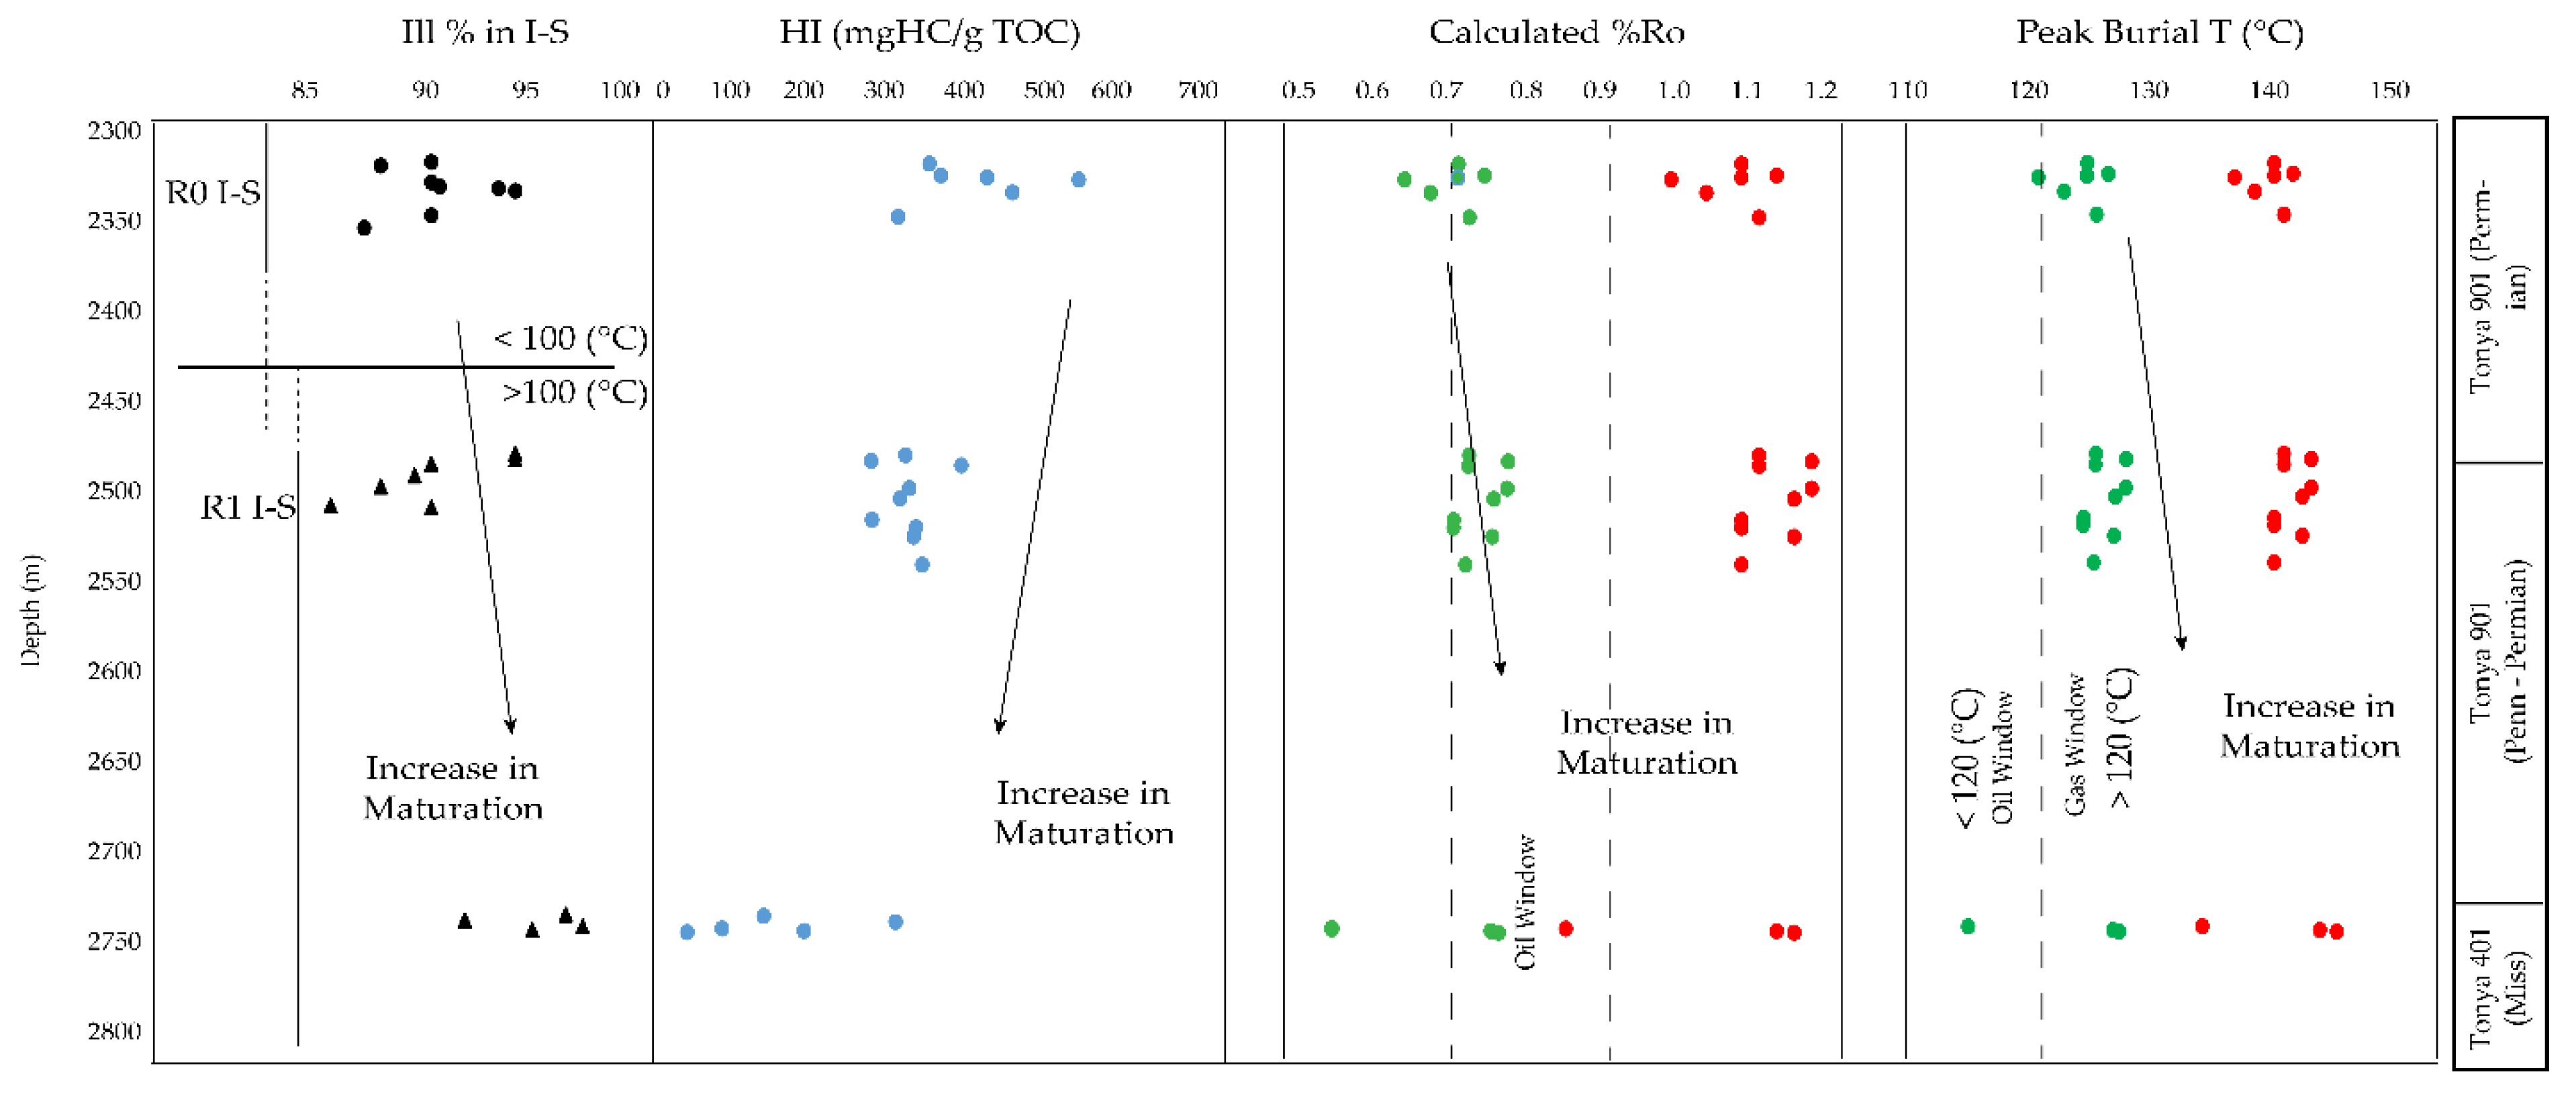
5.3. Correlation of Inorganic and Organic Indices
6. Conclusions
Author Contributions
Funding
Acknowledgments
Conflicts of Interest
Appendix A

| Sample | Depth (m) | Lithofacies | Qtz | Cal | Dol | Feldspar | Py | Mca | Chl | Gyp | Jar | Flu |
|---|---|---|---|---|---|---|---|---|---|---|---|---|
| T401-7620 | 2322.6 | Si-rich Sh | 51.4 | 10.6 | 2.4 | 4.7 | 7.6 | 16.5 | 3.5 | 0.0 | 0.0 | 0.0 |
| T401-7627 | 2324.7 | Ca-rich Sh | 23.1 | 53.3 | 4.4 | 1.7 | 6.9 | 10.5 | 0.0 | 0.0 | 0.0 | 0.0 |
| T401-7641 | 2328.9 | Ca-rich Sh | 29.1 | 56.0 | 1.7 | 2.3 | 2.5 | 6.7 | 0.0 | 0.0 | 0.0 | 0.0 |
| T401-7650 | 2331.7 | Limestone | 4.8 | 94.0 | 0.0 | 0.5 | 0.0 | 0.0 | 0.0 | 0.0 | 0.0 | 0.0 |
| T401-7657 | 2333.9 | Limestone | 3.2 | 91.4 | 0.5 | 0.8 | 1.3 | 2.8 | 0.0 | 0.0 | 0.0 | 0.0 |
| T401-7665 | 2336.3 | Si-rich Sh | 40.3 | 9.0 | 3.5 | 4.9 | 9.7 | 25.2 | 0.0 | 0.0 | 0.0 | 0.0 |
| T401-7669 | 2337.5 | Dolomite | 6.6 | 10.4 | 50.6 | 2.5 | 6.0 | 19.5 | 0.0 | 0.0 | 0.0 | 0.0 |
| T401-7673 | 2338.7 | Si-rich Sh | 50.2 | 4.0 | 2.5 | 5.3 | 8.2 | 17.7 | 6.2 | 0.0 | 0.0 | 0.0 |
| T401-7690 | 2343.9 | Si-rich Sh | 61.2 | 1.9 | 3.7 | 3.9 | 5.4 | 18.4 | 2.9 | 0.0 | 0.0 | 0.0 |
| T401-7700 | 2346.9 | Limestone | 12.0 | 65.9 | 6.6 | 2.9 | 3.1 | 9.1 | 0.0 | 0.0 | 0.0 | 0.0 |
| T401-7718 | 2352.4 | Si-rich Sh | 44.3 | 1.2 | 2.9 | 5.4 | 7.7 | 26.6 | 7.1 | 0.0 | 0.0 | 0.0 |
| T401-7741 | 2359.5 | Si-rich Sh | 44.3 | 5.5 | 2.5 | 5.6 | 8.8 | 19.4 | 9.0 | 0.0 | 0.0 | 0.0 |
| T401-8156 | 2485.9 | Si-rich Sh | 42.3 | 11.5 | 3.3 | 5.1 | 7.3 | 17.9 | 8.4 | 0.0 | 0.0 | 0.0 |
| T401-8167 | 2489.3 | Si-rich Sh | 41.3 | 0.0 | 2.1 | 5.3 | 6.1 | 30.4 | 10.2 | 0.0 | 0.0 | 0.0 |
| T401-8175 | 2491.7 | Si-rich Sh | 37.3 | 0.0 | 2.3 | 5.2 | 9.7 | 26.8 | 8.8 | 0.0 | 0.0 | 0.0 |
| T401-8187 | 2495.3 | Dolomite | 3.6 | 7.7 | 73.9 | 2.3 | 0.0 | 12.6 | 0.0 | 0.0 | 0.0 | 0.0 |
| T401-8197 | 2498.4 | Si-rich Sh | 45.2 | 7.6 | 3.1 | 6.0 | 6.9 | 22.4 | 8.8 | 0.0 | 0.0 | 0.0 |
| T401-8217 | 2504.5 | Si-rich Sh | 34.0 | 6.3 | 5.3 | 4.8 | 7.9 | 28.0 | 8.9 | 0.0 | 0.0 | 0.0 |
| T401-8236 | 2510.3 | Si-rich Sh | 34.9 | 10.2 | 3.3 | 5.8 | 9.2 | 24.4 | 8.6 | 0.0 | 0.0 | 0.0 |
| T401-8275 | 2522.2 | Ca-rich Sh | 32.7 | 39.8 | 2.4 | 2.5 | 9.7 | 12.9 | 0.0 | 0.0 | 0.0 | 0.0 |
| T401-8289 | 2526.4 | Dolomite | 12.8 | 11.6 | 35.8 | 3.4 | 7.2 | 20.9 | 8.2 | 0.0 | 0.0 | 0.0 |
| T401-8306 | 2449.3 | Ca-rich Sh | 39.5 | 22.6 | 2.9 | 5.5 | 5.1 | 17.3 | 7.1 | 0.0 | 0.0 | 0.0 |
| T401-8329 | 2538.6 | Ca-rich Sh | 28.1 | 25.5 | 3.2 | 3.8 | 6.4 | 22.1 | 9.0 | 0.0 | 0.0 | 0.0 |
| T401-8357 | 2547.2 | Si-rich Sh | 34.3 | 13.4 | 3.9 | 5.5 | 7.8 | 25.3 | 9.6 | 0.0 | 0.0 | 0.0 |
| T901-9005 | 2745.6 | Si-rich Sh | 53.6 | 6.4 | 0.0 | 8.1 | 2.5 | 19.3 | 0.0 | 0.0 | 0.0 | 10.1 |
| T901-9008 | 2746.5 | Limestone | 0.5 | 99.1 | 0.0 | 0.0 | 0.3 | 0.0 | 0.0 | 0.0 | 0.0 | 0.0 |
| T901-9015 | 2748.7 | Si-rich Sh | 57.0 | 0.0 | 0.0 | 13.5 | 2.8 | 26.8 | 0.0 | 0.0 | 0.0 | 0.0 |
| T901-9016 | 2749.0 | Ca-rich Sh | 18.5 | 48.8 | 0.0 | 6.3 | 1.6 | 24.8 | 0.0 | 0.0 | 0.0 | 0.0 |
| T901-9017 | 2749.3 | Si-rich Sh | 49.3 | 0.0 | 0.0 | 14.2 | 3.5 | 33.1 | 0.0 | 0.0 | 0.0 | 0.0 |
| T901-9026 | 2752.0 | Limestone | 22.1 | 52.6 | 0.0 | 5.5 | 4.5 | 11.3 | 4.0 | 0.0 | 0.0 | 0.0 |
| T901-9027 | 2752.3 | Limestone | 22.5 | 64.0 | 0.0 | 1.9 | 3.1 | 6.1 | 0.4 | 0.0 | 0.0 | 0.0 |
| T901-9028 | 2752.6 | Si-rich Sh | 43.8 | 18.2 | 0.0 | 7.5 | 6.6 | 21.6 | 2.2 | 0.0 | 0.0 | 0.0 |
| T901-9029 | 2752.9 | Limestone | 32.8 | 48.1 | 0.0 | 4.6 | 3.6 | 9.3 | 1.7 | 0.0 | 0.0 | 0.0 |
| T901-9030 | 2753.2 | Si-rich Sh | 42.6 | 0.0 | 2.3 | 5.4 | 14.5 | 23.9 | 0.0 | 3.7 | 3.7 | 0.0 |
| T901-9031 | 2753.6 | Si-rich Sh | 33.4 | 0.0 | 0.0 | 10.0 | 14.4 | 27.3 | 0.0 | 9.8 | 5.1 | 0.0 |
| T901-9032 | 2753.9 | Si-rich Sh | 36.3 | 0.0 | 0.0 | 13.4 | 4.3 | 34.1 | 0.0 | 6.3 | 5.6 | 0.0 |
| T901-9034 | 2754.5 | Si-rich Sh | 38.9 | 0.0 | 0.0 | 9.7 | 12.7 | 27.9 | 0.0 | 10.9 | 0.0 | 0.0 |
| T901-9035 | 2754.8 | Limestone | 9.6 | 86.4 | 0.0 | 0.0 | 0.4 | 2.6 | 0.5 | 0.0 | 0.0 | 0.0 |
| JP-11091 | 3380.5 | Ca-rich Sh | 37.4 | 22.7 | 10.3 | 14.9 | 2.5 | 8.7 | 3.4 | 0.0 | 0.0 | 0.0 |
| JP-11135 | 3393.9 | Si-rich Sh | 15.0 | 0.7 | 3.5 | 20.4 | 8.7 | 48.3 | 3.5 | 0.0 | 0.0 | 0.0 |
Appendix B
| Sample | Depth (m) | Lithofacies | Ill | R0 I-S | R0 I-SS | R0 I-SSS | R1 I-S | R3 I-S | Chl | R0 C-SS |
|---|---|---|---|---|---|---|---|---|---|---|
| T401-7620 | 2322.6 | Si-rich Sh | 7.3 | 31.9 | 19.0 | 41.7 | 0.0 | 0.0 | 0.0 | 0.0 |
| T401-7627 | 2324.7 | Ca-rich Sh | 7.5 | 82.5 | 0.0 | 10.0 | 0.0 | 0.0 | 0.0 | 0.0 |
| T401-7657 | 2333.9 | Limestone | 3.6 | 27.8 | 68.6 | 0.0 | 0.0 | 0.0 | 0.0 | 0.0 |
| T401-7665 | 2336.3 | Si-rich Sh | 2.8 | 53.3 | 43.9 | 0.0 | 0.0 | 0.0 | 0.0 | 0.0 |
| T401-7669 | 2337.5 | Dolomite | 4.0 | 56.4 | 39.6 | 0.0 | 0.0 | 0.0 | 0.0 | 0.0 |
| T401-7673 | 2338.7 | Si-rich Sh | 20.3 | 40.4 | 37.9 | 0.0 | 0.0 | 0.0 | 1.4 | 0.0 |
| T401-7718 | 2352.4 | Si-rich Sh | 15.4 | 82.1 | 0.0 | 0.0 | 0.0 | 0.0 | 2.5 | 0.0 |
| T401-7741 | 2359.5 | Si-rich Sh | 7.9 | 55.7 | 28.9 | 0.0 | 0.0 | 0.0 | 2.8 | 4.7 |
| T401-8156 | 2485.9 | Si-rich Sh | 24.8 | 0.0 | 25.8 | 0.0 | 45.2 | 0.0 | 0.9 | 3.4 |
| T401-8167 | 2489.3 | Si-rich Sh | 32.5 | 0.0 | 0.0 | 0.0 | 62.8 | 0.0 | 1.5 | 3.3 |
| T401-8175 | 2491.7 | Si-rich Sh | 19.8 | 0.0 | 10.0 | 0.0 | 65.7 | 0.0 | 1.2 | 3.3 |
| T401-8197 | 2498.4 | Si-rich Sh | 21.9 | 0.0 | 0.0 | 0.0 | 73.9 | 0.0 | 3.4 | 0.9 |
| T401-8217 | 2504.5 | Si-rich Sh | 19.8 | 0.0 | 0.0 | 0.0 | 75.9 | 0.0 | 2.6 | 1.7 |
| T401-8252 | 2515.2 | Si-rich Sh | 16.0 | 0.0 | 0.0 | 0.0 | 79.9 | 0.0 | 4.1 | 0.0 |
| T401-8256 | 2516.4 | Si-rich Sh | 21.4 | 0.0 | 0.0 | 0.0 | 73.8 | 0.0 | 4.8 | 0.0 |
| T901-9004 | 2744.4 | Si-rich Sh | 7.3 | 0.0 | 50.7 | 0.0 | 0.0 | 21.4 | 3.2 | 17.4 |
| T901-9005 | 2744.7 | Si-rich Sh | 2.6 | 0.0 | 0.0 | 0.0 | 48.0 | 38.4 | 0.0 | 11.0 |
| T901-9015 | 2747.8 | Si-rich Sh | 41.3 | 0.0 | 16.9 | 0.0 | 0.0 | 41.8 | 0.0 | 0.0 |
| T901-9027 | 2751.4 | Ca-rich Sh | 2.6 | 0.0 | 0.0 | 0.0 | 0.0 | 92.4 | 2.3 | 2.6 |
| T901-9033 | 2753.3 | Si-rich Sh | 0.0 | 0.0 | 69.7 | 0.0 | 0.0 | 30.3 | 0.0 | 0.0 |
| JP-11091 | 3380.5 | Ca-rich Sh | 16.7 | 37.5 | 0.0 | 0.0 | 40.7 | 0.0 | 5.0 | 0.0 |
| JP-11107 | 3385.4 | Ca-rich Sh | 18.8 | 18.7 | 0.0 | 0.0 | 57.0 | 0.0 | 5.5 | 0.0 |
| JP-11118 | 3388.8 | Si-rich Sh | 27.1 | 0.0 | 0.0 | 0.0 | 63.8 | 0.0 | 2.7 | 6.4 |
| JP-11135 | 3393.9 | Si-rich Sh | 8.4 | 0.0 | 30.5 | 0.0 | 58.3 | 0.0 | 1.1 | 1.7 |
Appendix C
| Phase/Mixed-layer Phase | Sample | σ* | CSDS | Ill (%) | Ch (%) | FeIV | ICC |
|---|---|---|---|---|---|---|---|
| Illite/Muscovite | T401-7620 | 12.00 | 21.67 | - | - | 1.52 | 1.50 |
| T401-7627 | 19.94 | 27.91 | - | - | 1.04 | 1.50 | |
| T401-7657 | 12.00 | 27.91 | - | - | 0.50 | 1.50 | |
| T401-7665 | 12.00 | 28.30 | - | - | 0.50 | 1.50 | |
| T401-7669 | 7.46 | 18.16 | - | - | 1.00 | 1.50 | |
| T401-7673 | 12.00 | 20.00 | - | - | 0.50 | 1.00 | |
| T401-7718 | 12.00 | 20.11 | - | - | 0.52 | 1.50 | |
| T401-7741 | 12.00 | 24.79 | - | - | 2.00 | 1.81 | |
| T401-8156 | 12.00 | 18.55 | - | - | 0.52 | 1.50 | |
| T401-8167 | 12.00 | 16.60 | - | - | 0.24 | 1.50 | |
| T401-8175 | 12.00 | 19.72 | - | - | 0.44 | 1.56 | |
| T401-8197 | 12.00 | 20.00 | - | - | 0.50 | 1.50 | |
| T401-8217 | 12.00 | 20.00 | - | - | 0.50 | 1.50 | |
| T401-8252 | 12.00 | 18.55 | - | - | 0.72 | 1.50 | |
| T401-8256 | 12.00 | 20.00 | - | - | 0.08 | 1.50 | |
| T901-9004 | 12.00 | 18.16 | - | - | 0.52 | 1.50 | |
| T901-9005 | 12.00 | 29.08 | - | - | 0.52 | 1.50 | |
| T901-9015 | 12.00 | 4.51 | - | - | 0.20 | 1.50 | |
| T901-9027 | 12.00 | 22.06 | - | - | 1.84 | 1.50 | |
| JP-11091 | 12.00 | 20.00 | - | - | 0.50 | 1.50 | |
| JP-11107 | 12.00 | 20.00 | - | - | 0.50 | 1.50 | |
| JP-11118 | 12.00 | 13.87 | - | - | 0.08 | 1.50 | |
| JP-11135 | 12.00 | 20.00 | - | - | 0.28 | 1.50 | |
| R0 I-S | T401-7620 | 12.00 | 16.08 | 90.00 | - | 1.96 | 1.50 |
| T401-7627 | 12.00 | 16.66 | 87.00 | - | 2.20 | 1.50 | |
| T401-7657 | 12.14 | 22.17 | 90.00 | - | 2.68 | 1.50 | |
| T401-7665 | 13.70–15.26 | 6.80-19.85 | 87.00–94.00 | - | 0.76–2.00 | 1.50 | |
| T401-7669 | 16.04 | 7.09 | 94.00 | - | 2.12 | 1.50 | |
| T401-7673 | 12.00 | 5.35 | 95.00 | - | 3.00 | 1.50 | |
| T401-7718 | 12.00 | 6.22 | 90.00 | - | 2.00 | 1.50 | |
| T401-7741 | 12.00 | 23.62 | 86.00 | - | 2.88 | 1.50 | |
| JP-11091 | 12.00 | 6.22 | 89.00 | - | 1.56 | 0.96 | |
| JP-11107 | 12.00 | 11.44 | 90.00 | - | 0.50 | 1.00 | |
| R0 I-SS | T401-7620 | 12.00 | 7.38 | 82.00 | - | 0.84 | 1.50 |
| T401-7627 | 54.26 | 10.86 | 72.00 | - | 0.50 | 1.50 | |
| T401-7657 | 12.00 | 8.25–12.02 | 73.00–90.00 | - | 0.64–1.16 | 1.50 | |
| T401-7665 | 13.70–16.04 | 6.22–20.43 | 80.00–81.00 | - | 0.52–2.52 | 1.50 | |
| T401-7669 | 12.00–16.82 | 15.50–15.79 | 65.00–84.00 | - | 0.50 | 1.50 | |
| T401-7673 | 12.00 | 6.22 | 70.00 | - | 0.50 | 1.50 | |
| T401-7741 | 12.00 | 12.02 | 80.00 | - | 0.50 | 1.50 | |
| T401-8156 | 9.02 | 6.22 | 80.00 | - | 1.60 | 1.50 | |
| T401-8175 | 12.00 | 3.32 | 62.00 | - | 0.50 | 1.50 | |
| T901-9004 | 12.00 | 4.77 | 83.00 | - | 3.08 | 1.50 | |
| T901-9015 | 15.26 | 14.05 | 10.00 | - | 1.00 | 1.50 | |
| T901-9033 | 12.00 | 24.20 | 75.00 | - | 0.84 | 1.50 | |
| JP-11135 | 12.00 | 8.25 | 69.00 | - | 3.00 | 1.51 | |
| R0 I-SSS | T401-7620 | 12.00 | 4.48 | 87.00 | - | 0.50 | 1.50 |
| T401-7627 | 12.00 | 1.29–2.74 | 11.00–53.00 | - | 0.50 | 1.50 | |
| R1 I-S | T401-8156 | 10.58 | 5.64 | 95.00 | - | 1.88 | 1.50 |
| T401-8167 | 10.58 | 4.77 | 95.00 | - | 1.88 | 1.51 | |
| T401-8175 | 12.00 | 5.64 | 90.00 | - | 1.20 | 1.50 | |
| T401-8197 | 12.00 | 5.93 | 89.00 | - | 1.88 | 1.50 | |
| T401-8217 | 12.00 | 6.51 | 87.00 | - | 2.00 | 1.50 | |
| T401-8252 | 12.00 | 5.64 | 84.00 | - | 1.52 | 1.50 | |
| T401-8256 | 12.00 | 5.64 | 90.00 | - | 2.56 | 1.50 | |
| T401-9005 | 12.00 | 4.19 | 88.00 | - | 0.52 | 1.50 | |
| JP-11091 | 12.00 | 13.18 | 75.00 | - | 1.80 | 1.50 | |
| JP-11107 | 12.00 | 3.61 | 90.00 | - | 2.72 | 1.29 | |
| JP-11118 | 12.00 | 11.15 | 77.00 | - | 3.80 | 1.50 | |
| JP-11135 | 12.00 | 7.09 | 93.00 | - | 1.88 | 1.50 | |
| Chlorite | T401-7673 | 12.00 | 20.00 | - | - | 1.80 | 1.00 |
| T401-7718 | 12.00 | 14.65 | - | - | 1.72 | 1.00 | |
| T401-7741 | 12.00 | 15.04 | - | - | 1.00 | 1.08 | |
| T401-8156 | 12.00 | 27.13 | - | - | 1.96 | 1.98 | |
| T401-8167 | 12.00 | 22.06 | - | - | 1.44 | 1.02 | |
| T401-8175 | 12.00 | 20.00 | - | - | 2.20 | 1.00 | |
| T401-8197 | 12.00 | 15.43 | - | - | 2.00 | 1.98 | |
| T401-8217 | 12.00 | 17.38 | - | - | 2.00 | 1.00 | |
| T401-8252 | 12.00 | 13.87 | - | - | 2.00 | 1.00 | |
| T401-8252 | 12.00 | 13.87 | - | - | 2.08 | 1.80 | |
| T901-9004 | 12.00 | 17.77 | - | - | 2.32 | 1.14 | |
| T901-9027 | 12.00 | 11.53 | - | - | 3.00 | 1.02 | |
| JP-11091 | 12.00 | 11.92 | - | - | 2.08 | 1.00 | |
| JP-11107 | 12.00 | 13.09 | - | - | 1.96 | 1.00 | |
| JP-11118 | 12.00 | 14.26 | - | - | 1.84 | 1.98 | |
| R0 Di C-SS | T401-7741 | 12.00 | 10.86 | - | 59.00 | 0.50 | 1.00 |
| T401-8197 | 12.00 | 5.64 | - | 37.00 | 0.50 | 1.00 | |
| T401-8217 | 12.00 | 5.64 | - | 38.00 | 0.50 | 1.00 | |
| T901-9005 | 12.00 | 8.54 | - | 25.00 | 3.32 | 2.04 | |
| JP-11118 | 12.00 | 13.18 | - | 76.00 | 1.44 | 2.04 | |
| R0 Tri C-SS | T401-8156 | 12.00 | 19.27 | - | 83.00 | 2.80 | 4.56 |
| T401-8167 | 12.00 | 9.99 | - | 81.00 | 2.88 | 4.92 | |
| T401-8175 | 12.00 | 3.90 | - | 36.00 | 2.00 | 1.00 | |
| T901-9004 | 12.00 | 5.35 | - | 68.00 | 1.36 | 1.98 | |
| T901-9027 | 12.00 | 3.03 | - | 50.00 | 0.50 | 1.00 | |
| JP-11135 | 12.00 | 6.51 | - | 85.00 | 1.76 | 1.02 |
References
- Tissot, B.; Welte, D.H. Petroleum Formation and Occurrence, 2nd ed.; Springer: Berlin, Germany, 1984. [Google Scholar]
- Hunt, J.M. Petroleum Geochemistry and Geology, 2nd ed.; W.H. Freeman and Company: New York, NY, USA, 1996. [Google Scholar]
- Killops, S.; Killops, V. Introduction to Organic Geochemistry, 2nd ed.; Blackwell Publishing: Malden, MA, USA, 2005. [Google Scholar]
- Gouze, P.; Coudrain-Ribstein, A. Chemical reactions and porosity changes during sedimentary diagenesis. Appl. Geochem. 2002, 17, 39–47. [Google Scholar] [CrossRef]
- Aplin, A.C.; Macquaker, J.H.S. Mudstone diversity: Origin and implications for source, seal, and reservoir properties in petroleum systems. AAPG Bull. 2011, 95, 2031–2059. [Google Scholar] [CrossRef]
- Ilgen, A.G.; Heath, J.E.; Akkutlu, I.Y.; Bryndzia, L.T. Shales at all scales: Exploring coupled processes in mudrocks. Earth Sci. Rev. 2017, 166, 132–152. [Google Scholar] [CrossRef] [Green Version]
- Sayed, M.A.; Al-Muntasheri, G.A.; Liang, F. Development of shales reservoirs: Knowledge gained from developments in North America. J. Pet. Sci. Eng. 2017, 157, 164–186. [Google Scholar] [CrossRef]
- Rahman, H.M.; Kennedy, M.; Lohr, S.; Dewhurst, D.N. Clay-organic association as a control on hydrocarbon generation in shale. Org. Geochem. 2017, 105, 42–55. [Google Scholar] [CrossRef]
- Rahman, H.M.; Kennedy, M.; Lohr, S.; Dewhurst, D.N. The influence of shale depositional fabric on the kinetics of hydrocarbon generation through control of mineral surface contact area on clay catalysis. Geochim. Cosmochim. Acta 2018, 220, 429–448. [Google Scholar] [CrossRef]
- Hillier, S. Origin, diagenesis, and mineralogy of chlorite minerals in Devonian lacustrine mudrocks, Orcadian basin, Scotland. Clays Clay Miner. 1993, 41, 240–259. [Google Scholar] [CrossRef]
- Pevear, D.R. Illite and hydrocarbon exploration. Proc. Natl. Acad. Sci. USA 1999, 96, 3440–3446. [Google Scholar] [CrossRef] [PubMed] [Green Version]
- Środoń, J. Nature of mixed-layer clays and mechanisms of their formation and alteration. Annu. Rev. Earth Planet. Sci. 1999, 27, 19–53. [Google Scholar] [CrossRef]
- Dellisanti, F.; Pini, G.A.; Baudin, F. Use of Tmax as a thermal indicator in organic successions and comparison with clay mineral evolution. Clay Miner. 2010, 45, 115–130. [Google Scholar] [CrossRef]
- Tissot, B.P.; Pelet, R.; Ungerer, P.H. Thermal History of Sedimentary Basins, Maturation Indices, and Kinetics of Oil and Gas Generation. AAPG Bull. 1987, 71, 1445–1466. [Google Scholar] [CrossRef]
- Landis, C.R.; Castano, J.R. Maturation and bulk chemical properties of a suite of solid hydrocarbons. Org. Geochem. 1995, 22, 137–149. [Google Scholar] [CrossRef]
- Rimmer, S.M.; Thompson, J.A.; Goodnight, S.A.; Robl, T.L. Multiple controls on the preservation of organic matter in Devonian—Mississippian marine black shales: Geochemical and petrographic evidence. Paleogeogr. Paleoclimatol. Paleoecol. 2004, 215, 125–154. [Google Scholar] [CrossRef]
- Bernard, S.; Wirth, R.; Schreiber, A.; Schulz, H.M.; Horsfield, B. Formation of nanoporous pyrobitumen residues during maturation of the Barnett Shale (Fort Worth Basin). Int. J. Coal Geol. 2012, 103, 3–11. [Google Scholar] [CrossRef]
- Curiale, J.A.; Curtis, J.B. Organic geochemical applications to the exploration for source-rock reservoirs—A review. J. Unconv. Oil Gas. Resour. 2016, 13, 1–31. [Google Scholar] [CrossRef]
- Pollastro, R.M.; Barker, C. Applications of clay-mineral, vitrinite reflectance, and fluid inclusion studies to the thermal and burial history of the Pindale Anticline, Green River Basin, Wyoming. In Organic Matter in Sediment Diagenesis; Gautier, D.L., Ed.; Society of Economic Paleontologists and Mineralogists Special Publication 38; Society for Sedimentary Geology: Tulsa, OK, USA, 1986; pp. 73–83. [Google Scholar]
- Ferreiro Mählmann, R.; Bozkaya, Ö.; Potel, S.; Bayon, R.L.; Šegvić, B.; Nieto, F. The pioneer work of Bernard Kübler and Martin Frey in very low-grade metamorphic terranes: Paleo-geothermal potential of variation in Kübler-Index/organic matter reflectance correlations. A review. Swiss J. Geosci. 2012, 105, 121–152. [Google Scholar] [CrossRef]
- Ola, P.S.; Aidi, A.K.; Bankole, O.M. Clay mineral diagenesis and source rock assessment in the Bornu Basin, Nigeria: Implications for the thermal maturity and source rock potential. Mar. Pet. Geol. 2018, 89, 653–664. [Google Scholar] [CrossRef]
- Wust, R.A.J.; Hackley, P.C.; Nassichuk, B.R. Vitrinite reflectance versus pyrolysis Tmax Data: Assessing thermal maturity in shale plays with special reference to the Duvernay shale play of the western Canadian sedimentary basin, Alberta, Canada. In Proceedings of the SPE Unconventional Resources Conference and Exhibition-Asia Pacific, Brisbane, Australia, 11–13 November 2013. SPE 167031. [Google Scholar]
- Hackley, P.C.; Guevara, E.H.; Hentz, T.F.; Hook, R.W. Thermal maturity and organic composition of Pennsylvanian coals and carbonaceous shales, north-central Texas: Implications of coalbed gas potential. Int. J. Coal Geol. 2009, 77, 294–309. [Google Scholar] [CrossRef]
- Merriman, R. Clay minerals and sedimentary basin history. Eur. J. Mineral. 2005, 17, 7–20. [Google Scholar] [CrossRef] [Green Version]
- Peters, K.E. Guidelines for Evaluating Petroleum Source Rock Using Programmed Pyrolysis. AAPG Bull. 1986, 70, 318–329. [Google Scholar] [CrossRef]
- Baludikay, B.K.; Francois, C.; Sforna, M.C.; Beghin, J.; Cornet, Y.; Strome, J.; Fagel, N.; Fontaine, F.; Littke, R.; Baudet, D.; et al. Raman microspectroscopy, bitumen reflectance and illite crystallinity scale: Comparison of different geothermetry methods on fossiliferous Proterozoic sedimentary basins (DR Congo, Mauritania and Australia). Int. J. Coal Geol. 2018, 191, 80–94. [Google Scholar] [CrossRef]
- Tobin, R.C.; Claxton, B.L. Multidisciplinary thermal maturity studies using vitrinite reflectance and fluid inclusion mirothermometry: A new calibration of old techniques. AAPG Bull. 2000, 84, 1647–1665. [Google Scholar] [CrossRef]
- Suarez-Ruiz, I.; Flores, D.; Graciano, J.G.M.; Hackley, P.C. Review and update of the applications of organic petrology: Part 1. Int. J. Coal Geol. 2012, 99, 54–112. [Google Scholar] [CrossRef]
- Hackley, P.C.; Cardott, B.J. Application of organic petrography in North American shale petroleum systems: A review. Int. J. Coal Geol. 2016, 163, 8–51. [Google Scholar] [CrossRef] [Green Version]
- Hackley, P.C.; Zhang, T.; Jubb, A.M.; Valentine, B.J.; Dulong, F.T.; Hatcherian, J.J. Organic petrography of Leonardian (Wolfcamp A) mudrocks and carbonates, Midland Basin, Texas: The fate of oil-prone sedimentary organic matter in the oil window. Mar. Pet. Geol. 2020, 112, 104086. [Google Scholar] [CrossRef]
- Hackley, P.C.; Araujo, C.V.; Borrego, A.G.; Bouzinos, A.; Cardott, B.; Cook, A.C.; Eble, C.; Flores, D.; Gentzis, T.; Gonҫalves, P.A.; et al. Standardization of reflectance measurements in dispersed organic matter: Results of an exercise to improve interlaboratory agreement. Mar. Pet. Geol. 2015, 59, 22–34. [Google Scholar] [CrossRef]
- Jarvie, D.M.; Claxton, B.L.; Henk, F.; Breyer, J.T. Oil and Shale Gas from the Barnett Shale, Ft. Worth Basin, Texas. In Proceedings of the AAPG National Convention, Denver, CO, USA, 3–6 June 2001. [Google Scholar]
- Matava, T.; Matt, V.; Flannery, J. New insights on measured and calculated vitrinite reflectance. Basin Res. 2019, 31, 213–227. [Google Scholar] [CrossRef]
- Caritat, P.; Hutcheon, I.; Walshe, J.L. Chlorite geothermometry: A review. Clays Clay Miner. 1993, 41, 219–239. [Google Scholar] [CrossRef]
- Pollastro, R.M. Considerations and applications of the illite/smectite geothermometer in hydrocarbon-bearing rocks of Miocene to Mississippian Age. Clays Clay Miner. 1993, 41, 119–133. [Google Scholar] [CrossRef]
- Beaufort, D.; Rigault, C.; Billon, S.; Billault, V.; Inoue, A.; Inoue, S.; Patrier, P. Chlorite and chloritization processes through mixed-layer mineral series in low-temperature geological systems—A review. Clay Miner. 2015, 50, 497–523. [Google Scholar] [CrossRef]
- Wilson, M.J.; Shaldybin, M.V.; Wilson, L. Clay mineralogy and unconventional hydrocarbon shale reservoirs in the USA. I. Occurrence and interpretation of mixed-layer R3 ordered illite/smectite. Earth-Sci. Rev. 2016, 158, 31–50. [Google Scholar] [CrossRef]
- Zanoni, G.; Šegvić, B.; Moscariello, A. Clay mineral diagenesis in Cretaceous clastic reservoirs from West African passive margins (the South Gabon Basin) and its impact on regional geology and basin evolution history. Appl. Clay Sci. 2016, 134, 186–209. [Google Scholar] [CrossRef]
- Perry, E.A.; Hower, J. Burial diagenesis in Gulf Coast pelitic sediments. Clays Clay Miner. 1970, 29, 165–177. [Google Scholar] [CrossRef]
- Dudek, T.; Środoń, J. Thickness distribution of illite crystals in shales. II: Origins of the distribution and the mechanism of smectte illiization in shales. Clay Clay Miner. 2003, 51, 529–542. [Google Scholar] [CrossRef]
- Energy Information Administration (EIA). Permian Basin Wolfcamp and Bone Spring Shale Plays: Geology Review. Available online: https://www.eia.gov/maps/pdf/Wolfcamp_BoneSpring_EIA_Report_July2019.pdf (accessed on 23 June 2020).
- Kvale, E.P.; Rahman, M. Depositional facies and organic content of upper Wolfcamp Formation (Permian) Delaware Basin and implications for sequence stratigraphy and hydrocarbon source. In Proceedings of the Unconventional Resources Technology Conference (URTeC), San Antonio, TX, USA, 1–3 August 2016. [Google Scholar]
- Lewan, M.D.; Pawlewicz, M.J. Reevalutaion of thermal maturity and stages of petroleum formation of the Mississippian Barnett Shale, Fort Worth Basin, Texas. AAPG Bull. 2017, 101, 1945–1970. [Google Scholar] [CrossRef]
- MacRitchie, C.; Zobaa, M.K. Multiproxy sedimentary organic matter analysis of the upper Wolfcamp Formation in the Collier-1201 well, southeastern Delaware Basin, Texas. Interpretation 2019, 7, SK45–SK52. [Google Scholar] [CrossRef]
- Landis, C.R. Organic Maturation, Primary Migration, and Clay Mineralogy of Selected Permian Basin Shales. Ph.D. Thesis, Texas Tech University, Lubbock, TX, USA, 1990. [Google Scholar]
- Sivagnanam, S. Clay Diagenesis of the Source Rocks from the Permian Basin. Ph.D. Thesis, Texas Tech University, Lubbock, TX, USA, 1990. [Google Scholar]
- Echegu, S. Geological and Geochemical Investigation of the Petroleum Systems of the Permian Basin of west Texas and southeast New Mexico. Ph.D. Thesis, University of Houston, Houston, TX, USA, 2013. [Google Scholar]
- Hills, J.M. Sedimentation, tectonism, and hydrocarbon generation in the Delaware Basin, west Texas and southeastern New Mexico. AAPG Bull. 1984, 68, 250–267. [Google Scholar]
- Candelaria, M.P. “Atoka” detrital a subtle stratigraphic trap in the Midland Basin. In Permian Basin Oil and Gas Fields; Innovative Ideas in Exploration and Development; Flis, J.E., Price, R.C., Eds.; West Texas Geological Society: Midland, TX, USA, 1990; pp. 87–90. [Google Scholar]
- Comer, J.B. Stratigraphic Analysis of the upper Devonian Woodford Formation, Permian Basin, West Texas and Southeastern New Mexico; Bureau of Economic Geology: Austin, TX, USA, 1991; Report of Investigation 201. [Google Scholar]
- Horak, R.L. Tectonic and hydrocarbon maturation history in the Permian Basin. Oil Gas. J. 1985, 27, 124–129. [Google Scholar]
- Yang, K.M.; Dorobek, S.L. The Permian Basin of west Texas and New Mexico: Tectonic history of a “composite” foreland basin and its effects on stratigraphic development. In Stratigraphic Evolution of Foreland Basins; Dorobek, S.L., Ross, G.M., Eds.; Society for Sedimentary Geology: Tulsa, OK, USA, 1995; pp. 149–174. [Google Scholar]
- Ye, H.; Royden, L.; Burchfield, C.; Schuepbach, M. Late Paleozoic deformation of interior North America: The greater Ancestral Rocky Mountains. AAPG Bull. 1996, 80, 1397–1432. [Google Scholar] [CrossRef]
- Helm, J.M. The Depositional Environment and Thermal Maturity of the upper Wolfcamp Formation in Crockett County, TX, MS; University of Louisiana at Lafayette: Lafayette, LA, USA, 2015. [Google Scholar]
- Schumaker, R.C. Paleozoic structure of the Central Basin Uplift and adjacent Delaware Basin, West Texas. AAPG Bull. 1992, 76, 1804–1824. [Google Scholar] [CrossRef]
- Ewing, T.E. Texas through Time: Lone Star Geology, Landscapes, and Resources; Bureau of Economic Geology, Udden Series No. 6: Austin, TX, USA, 2016. [Google Scholar]
- Kinley, T.J.; Cook, L.W.; Breyer, J.A.; Jarive, D.M.; Busbey, A.B. Hydrocarbon potential of the Barnett Shale (Mississippian), Delaware Basin, west Texas and southeastern New Mexico. AAPG Bull. 2008, 92, 967–991. [Google Scholar] [CrossRef]
- Hills, J.M. Structural evolution of the Permian Basin of west Texas and New Mexico. In Structure and Tectonics of Trans-Pecos Texas; Dickerson, P.W., Muehlberger, W.R., Eds.; West Texas Geological Society Guidebook: Midland, TX, USA, 1985; pp. 89–99. [Google Scholar]
- Frenzel, H.N.; Bloomer, R.R.; Cline, R.B.; Cys, J.M.; Galley, J.E.; Gibson, W.R.; Hills, J.M.; King, W.E.; Seager, W.R.; Kottlowski, R.E.; et al. The Permian Basin region. In The Geology of North America Sedimentary Cover—North American Craton: U.S.; Sloss, L.L., Ed.; Geological Society of America: Boulder, CO, USA, 1988; Volume D-2, pp. 261–306. [Google Scholar]
- Wright, W.R. Pennsylvanian paleodepositional evolution of the greater Permian Basin, Texas and New Mexico: Depositional systems and hydrocarbon reservoir analysis. AAPG Bull. 2011, 95, 1525–1555. [Google Scholar] [CrossRef]
- Alnazghah, M.; Kerans, C. Late Pennsylvanian glaciation: Evidence of icehouse conditions from Canyon and Cisco units, Midland Basin, Texas. Mar. Pet. Geol. 2018, 94, 198–211. [Google Scholar] [CrossRef]
- Kohn, J.; Barrick, J.E.; Wahlman, G.P.; Baumgardner, R. Late Pennsylvanian (Virgilian) to Early Permian (Leonardian) conodont biostratigraphy of the “Wolfcamp Shale,” northern Midland Basin, Texas. In Geologic Problem Solving with Microfossils IV; Society for Sedimentary Geology: Tulsa, OK, USA, 2019; pp. 245–261. [Google Scholar]
- Handford, C.R. Deep-water facies of the Spraberry Formation (Permian), Regan County, Texas. In Deep-Water Clastic Sediments; Siemers, C.T., Tillman, R.W., Williamson, C.R., Eds.; Society for Sedimentary Geology: Tulsa, OK, USA, 1981; pp. 375–395. [Google Scholar]
- Brister, B.S.; Stephens, W.C.; Norman, G.A. Structure, stratigraphy, and hydrocarbon system of Pennsylvanian pull-apart basin in north-central Texas. AAPG Bull. 2002, 86, 1–20. [Google Scholar]
- Yang, W.; Kominz, M.A. Characteristics, stratigraphic architecture, and time framework of multi-order mixed siliciclastic and carbonate depositional sequence, outcropping Cisco Group (Late Pennsylvanian and Early Permian, Eastern Shelf, north-central Texas, USA. Sediment. Geol. 2002, 154, 53–87. [Google Scholar] [CrossRef]
- Mazzullo, S.J.; Reid, A.M. Lower Permian platform and basin depositional systems, northern Midland Basin, Texas. In Controls on Carbonate Platforms and Basin Development; Crevello, P.D., Wilson, J.L., Sarg, J.F., Read, J.F., Eds.; Society for Sedimentary Geology: Tulsa, OK, USA, 1989; pp. 305–320. [Google Scholar]
- Hamlin, H.S.; Baumgardner, R.W. Wolfberry (Wolfcampian–Leonardian) Deep-Water Depositional Systems in the Midland Basin Stratigraphy, Lithofacies, Reservoirs, and Source Rocks; Bureau of Economic Geology: Austin, TX, USA, 2012; Report of Investigations 277. [Google Scholar]
- Heij, G.W.; Elmore, R.D. The magnetic fabric of the Wolfcamp shale, Midland Basin, west Texas: Understanding petrofabric variability, hydrocarbon associations, and iron enrichment. AAPG Bull. 2019, 103, 2785–2806. [Google Scholar] [CrossRef]
- Ewing, T.E. Erosional margins and patterns of subsidence in the late Paleozoic west Texas basin and adjoining basins of west Texas and New Mexico. In Carlsbad Region (New Mexico and West Texas), Proceedings of the New Mexico Geological Society 44th Annual Fall Field Conference Guidebook, Carlsbad, CA, USA, 6–9 October 1993; Love, D.W., Hawley, J.W., Kues, B.S., Austin, G.S., Lucas, S.G., Eds.; NM Bureau of Geology & Mineral Resources (NMBGMR): Socorro, NM, USA, 1993. [Google Scholar]
- Leslie, C.; Waite, L.; Ndungu, J.; Johnson, E.; Foster, D.; Maymi, N.; O’Connell, L.; Edmonds, J. Occurrence of volcanic ash beds in the Wolfcamp and Spraberry of the Midland Basin and their potential challenges to drilling. In Proceedings of the AAPG Southwest Section Meeting, Dallas, TX, USA, 6–9 April 2019. Search and Discovery Article #51637. [Google Scholar]
- Heij, G.W.; Elmore, R.D. Burial diagenesis and tectonism inferred from paleomagnetism and magnetic fabrics in the Wolfcamp Shale, Midland Basin, TX, USA. J. Geophys. Res. Solid Earth 2020, 125, e2019JB019046. [Google Scholar] [CrossRef]
- Lazar, O.R.; Bohacs, K.M.; MacQuaker, J.H.S.; Schieber, J.; Demko, T. Capturing key attributes of fine-grained sedimentary rocks in outcrops, cores, and thin sections: Nomenclature and description guidelines. J. Sediment. Res. 2015, 85, 230–246. [Google Scholar] [CrossRef] [Green Version]
- Moore, D.M.; Reynolds, R.C. X-ray Diffraction and the Identification and Analysis of Clay Minerals, 2nd ed.; Oxford University Press: Oxford, UK, 1997. [Google Scholar]
- Środoń, J. Identification and quantitative analysis of clay minerals. In Handbook of Clay Science; Bergaya, F., Theng, B.K.G., Lagaly, G., Eds.; Developments in Clay Science, Elsevier: Amsterdam, Netherlands, 2006. [Google Scholar]
- Lagaly, G.; Ogawa, M.; Dékány, I. Clay mineral organic interactions. In Handbook of Clay Science; Bergaya, F., Theng, B.K.G., Lagaly, G., Eds.; Developments in Clay Science, Elsevier: Amsterdam, Netherlands, 2006. [Google Scholar]
- Meunier, A. Soil hydroxy-interlayered minerals: A reinterpretation of their crystallochemical properties. Clays Clay Miner. 2007, 55, 380–388. [Google Scholar] [CrossRef]
- Drits, V.A.; Sakharov, B.A. X-ray Structural Analysis of Mixed-Layer Minerals; Nauka: Moscow, Russia, 1976. [Google Scholar]
- Uzarowicz, Ł.; Šegvić, B.; Michalik, M.; Bylina, P. The effect of hydrochemical conditions and pH of the environment on phyllosilicate transformations in the weathering zone of pyrite-bearing schists in Wieściszowice (SW Poland). Clay Miner. 2012, 47, 401–417. [Google Scholar] [CrossRef]
- Suquet, H.; De la Calle, C.; Pezerat, H. Swelling and structural organization of saponite. Clays Clay Miner. 1975, 23, 1–9. [Google Scholar] [CrossRef]
- Ferrage, E.; Lanson, B.; Sakharov, B.A.; Drits, V.A. Investigation of smectite hydration properties by modeling of X-ray diffraction profiles. Part 1. Montmorillonite hydration properties. Am. Mineral. 2005, 90, 1358–1374. [Google Scholar] [CrossRef] [Green Version]
- Zhou, X.; Liu, D.; Bu, H.; Deng, L.; Liu, H.; Yuan, P.; Du, P.; Song, H. XRD-based quantitative analysis of clay minerals using reference intensity ratios, mineral intensity factors, Rietveld, and full pattern summation methods: A critical review. Solid Earth Sci. 2018, 3, 16–29. [Google Scholar] [CrossRef]
- Ordonez, L.; Vogel, H.; Sebag, D.; Ariztegui, D.; Adatte, T.; Russell, J.M.; Kallmeyer, J.; Vuillemin, A.; Friese, A.; Crowe, S.A.; et al. Empowering conventional Rock-Eval pyrolysis for organic matter characterization of the siderite-rich sediments of Lake Towuti (Indonesia) using End-Member Analysis. Org. Geochem. 2019, 134, 32–44. [Google Scholar] [CrossRef]
- Hower, J. Shale diagenesis. In Clays and the Resource Geologist; Longstaffe, F.J., Ed.; Smithsonian Libraries: Washington, DC, USA, 1981; pp. 60–80. [Google Scholar]
- Jarvie, D.M. Correlation of Tmax and Measured Vitrinite Reflectance. Available online: http://www.wildcattechnologies.com/application/files/9915/1689/1979/Dan_Jarvie_Correlation_of_Tmax_and_measured_vitrinite_reflectance.pdf (accessed on 15 July 2020).
- Barker, C.E.; Pawlewicz, M.J. Calculation of vitrinite reflectance from thermal histories and peak temperatures. A comparison of methods. In Vitrinite Reflectance as a Maturity Parameter: Applications and Limitations; Mukhopadhyay, P.K., Dow, W.G., Eds.; ACS Publications: Washington, DC, USA, 1994; pp. 216–229. [Google Scholar]
- Reynolds, R.C.; Hower, J. The Nature of Interlayering in Mixed-Layer Illite-Montmorillonites. Clays Clay Miner. 1970, 18, 25–36. [Google Scholar] [CrossRef]
- Espitalié, J.; Deroo, G.; Marquis, F. La pyrolyse Rock-Eval et ses applications: Première Partie. Oil Gas. Sci. Technol. 1985, 40, 563–580. [Google Scholar] [CrossRef]
- Espitalié, J.; Deroo, G.; Marquis, F. La pyrolisis Rock-Eval et ses applications: Deuxième partie. Oil Gas. Sci. Technol. 1985, 40, 755–784. [Google Scholar]
- Espitalié, J.; Deroo, G.; Marquis, F. La pyrolyse Rock-Eval et ses applications. Troisième partie. Oil Gas. Sci. Technol. 1986, 41, 73–89. [Google Scholar] [CrossRef]
- Peters, K.E. Rock-Eval pyrolysis. In Geochemistry. Encyclopedia of Earth Science; Springer: Dordrecht, Netherlands, 1998. [Google Scholar]
- Hower, J.; Eslinger, E.V.; Hower, M.E.; Perry, E.A. Mechanism of burial metamorphism of argillaceous sediment: Mineralogical and chemical evidence. Geol. Soc. Amer. Bull. 1976, 87, 725–737. [Google Scholar] [CrossRef]
- McKinley, J.M.; Worden, R.H.; Ruffell, A.H. Smectite in Sandstones: A Review of the Controls on Occurrence and Behaviour During Diagenesis. In Clay Mineral Cements in Sandstones; Worden, R.H., Morad, S., Eds.; Blackwell Publishing Ltd.: Oxford, UK, 2003; pp. 109–128. [Google Scholar]
- Gao, Y.; Wang, C.; Liu, Z.; Du, X.; Ibarra, D.E. Diagenetic and Paleoenvironmental Controls on Late Cretaceous Clay Minerals in the Songliao Basin, Northeast China. Clays Clay Miner. 2015, 63, 469–484. [Google Scholar] [CrossRef]
- Pollastro, R.M. The Illite/Smectite Geothermometer—Concepts, Methodology, and Application to Basin History and Hydrocarbon Generation. In Applications of Thermal Maturity Studies to Energy Exploration; Society for Sedimentary Geology: Tulsa, OK, USA, 1990; pp. 1–18. [Google Scholar]
- Cuadros, J.; Linares, J. Experimental kinetic study of the smectite-to-illite transformation. Geochim. Cosmochim. Acta 1996, 60, 439–453. [Google Scholar] [CrossRef]
- Hoffman, J.; Hower, J. Clay mineral assemblages as low grade metamorphic geothermometers: Application to the thrust faulted disturbed belt of Montana. In Aspects of Diagenesis; Scholle, P.A., Schluger, P.S., Eds.; Society for Sedimentary Geology: Tulsa, OK, USA, 1979; pp. 55–79. [Google Scholar]
- Hillier, S.; Matyas, J.; Matter, A.; Vasseur, G. Illite/Smectite diagenesis and its variable correlation with vitrinite reflectance in the Pannonian Basin. Clays Clay Miner. 1995, 43, 174–183. [Google Scholar] [CrossRef]
- Meunier, A. Clays; Springer: Berlin, Germany, 2005. [Google Scholar]
- Środoń, J.; Eberl, D.D. Illite. In Micas; Bailey, S.W., Ed.; Mineralogical Society of America: Chantilly, VA, USA, 1984; pp. 495–544. [Google Scholar]
- Jarvie, D.M.; Hill, R.J.; Ruble, T.E.; Pollastro, R.M. Unconventional shale-gas system: The Mississippian Barnett Shale of north-central Texas as one model for thermogenic shale-gas assessment. AAPG Bull. 2007, 91, 475–499. [Google Scholar] [CrossRef]
- Barrenechea, J.F.; Rodas, M.; Frey, M.; Alonso-Azcárate, J.; Mas, J.R. Chlorite, corrensite, and chlorite-mica in Late Jurassic fluvio-lacustrine sediments of the Cameros basin of Northeastern Spain. Clays Clay Miner. 2000, 48, 256–265. [Google Scholar] [CrossRef]
- Ehrenberg, S.N. Relationship between diagenesis and reservoir quality in sandstones of the Garn Formation, Haltenbanken, Mid-Norwegian Continental Shelf (1). AAPG Bull. 1990, 74, 1538–1558. [Google Scholar]
- Aagaard, P.; Jahren, J.; Harstad, A.; Nilsen, O.; Ramm, M. Formation of grain-coating chlorite in sandstones. Laboratory synthesized vs. natural occurrences. Clay Miner. 2000, 35, 261–269. [Google Scholar] [CrossRef]
- Worden, R.H.; Morad, S. Clay minerals in sandstones: Controls on formation, distribution and evolution. In Clay Mineral Cements in Sandstones; Worden, R.H., Morad, S., Eds.; Special Publication of the International Association of Sedimentologists, Blackwells: Oxford, UK, 2003; pp. 3–41. [Google Scholar]
- Kvale, E.P.; Bowie, C.M.; Flenthrope, C.; Mace, C.; Parrish, J.M.; Price, B.; Anderson, S.; DiMichele, W. Facies variability within a mixed carbonate-siliciclastic sea-floor fan (upper Wolfcamp Formation, Permian, Delaware Basin, New Mexico). AAPG Bull. 2020, 104, 525–563. [Google Scholar] [CrossRef]
- Coombs, D.S.; Whetten, J.T. Composition of Analcime from sedimentary and burial metamorphic rocks. Geol. Soc. Amer. Bull. 1967, 78, 269–282. [Google Scholar] [CrossRef]
- Niu, B.; Yoshimura, T. Smectite Conversion in Diagenesis and Low Grade Hydrothermal Alteration from Neogene Basaltic Marine Sediments in Niigata Basin, Japan. Clay Sci. 1996, 10, 37–56. [Google Scholar] [CrossRef]
- Hints, R.; Kirsimäe, K.; Somelar, P.; Kallaste, T.; Kiipli, T. Chloritization of Late Ordovician K-bentonites from the northern Baltic Palaeobasin–influence from source material or diagenetic environment? Sediment. Geol. 2006, 191, 55–66. [Google Scholar] [CrossRef]
- Salda, L.H.D.; Luchi, M.G.L.; de Cingolani, C.A.; Varela, R. Laurentia-Gondwana Collision: The Origin of the Famatinian-Appalachian Orogenic Belt (a Review); Geological Society: London, UK, 1998; pp. 219–234, Special Publications 142. [Google Scholar]
- Tollo, R.P.; Bartholomew, M.J.; Hibbard, J.P.; Karabinos, P.M. From Rodinia to Pangea: The Lithotectonic Record of the Appalachian Region; Geological Society of America: Boulder, CO, USA, 2010; Memoir 206. [Google Scholar]
- Torres, R.; Ruiz, J.; Patchett, P.J.; Grajales, J.M. Permo-Triassic continental arc in eastern Mexico: Tectonic implications for reconstructions of southern North America. In Mesozoic Sedimentary and Tectonic History of North-Central Mexico; Bartolini, C., Wilson, J.L., Lawton, T.F., Eds.; Geological SocietyAmerica: Boulder, CO, USA, 1999; pp. 191–196. [Google Scholar]
- Kirsch, M.; Keppie, J.D.; Murphy, J.B.; Solari, L.A. Permian–Carboniferous arc magmatism and basin evolution along the western margin of Pangea: Geochemical and geochronological evidence from the eastern Acatlán Complex, southern Mexico. Geol. Soc. Amer. Bull. 2012, 124, 1607–1628. [Google Scholar] [CrossRef]
- Hartmann, J.; West, A.J.; Renforth, P.; Kohler, P.; De La Rocha, C.L.; Wolf-Gladrow, D.; Dürr, H.H.; Scheffran, J. Enhanced chemical weathering as a geoengineering strategy to reduce atmospheric carbon dioxide, supply nutrients, and mitigate ocean acidification. Rev. Geophys. 2013, 51, 113–149. [Google Scholar] [CrossRef] [Green Version]
- Worden, R.H.; Griffiths, J.; Wooldridge, L.J.; Utley, J.E.P.; Lawan, A.Y.; Muhammed, D.D.; Simon, N.; Armitage, P.J. Chlorite in sandstones. Earth-Sci. Rev. 2020, 204, 103105. [Google Scholar] [CrossRef]
- Chamley, P.D.H. Terrigenous Supply in the Ocean. In Clay Sedimentology; Springer: Berlin/Heidelberg, Germany, 1989; pp. 163–192. [Google Scholar]
- Ortega-Gutierrez, F.; Elias-Herrea, M.; Moran-Zenteno, D.J.; Solari, L.; Weber, B.; Luna-Gonzalez, L. The pre-Mesozoic metamorphic basement of Mexico, 1.5 billion years of crustal evolution. Earth-Sci. Rev. 2018, 183, 2–37. [Google Scholar] [CrossRef]
- Peters, K.E.; Cassa, M.R. Applied source rock geochemistry. In The Petroleum System—from Source to Trap; Magoon, L.B., Dow, W.G., Eds.; American Association of Petroleum Geologists: Tulsa, OK, USA, 1994; pp. 93–120. [Google Scholar]
- Jarvie, D.M. Shale resource systems for oil and gas: Part 1—Shale-gas resource systems. In Shale Reservoirs—Giant Resources for the 21st Century; Breyer, J.A., Ed.; American Association of Petroleum Geologists: Tulsa, OK, USA, 2012; pp. 69–87. [Google Scholar]
- Baumgardner, R.W.; Hamlin, H.S. Core-based geochemical study of mudrocks in basinal lithofacies in the Wolfberry play, Midland Basin, Texas, Part II. In Proceedings of the AAPG Annual Convention and Exhibition, Pittsburgh, PA, USA, 19–22 May 2013. Search and Discovery Article #10572. [Google Scholar]
- Taylor, G.H.; Teichmüler, M.; Davis, A.; Diessel, C.F.K.; Littke, R.; Robert, P. Organic Petrology; Gebrüder Borntraeger: Berlin, Germany; Stuttgart, Germany, 1998. [Google Scholar]
- Burtner, R.L.; Warner, M.A. Relationship between illite/smectite diagenesis and hydrocarbon generation in Lower Cretaceous Mowry and Skull Creek Shales of the Northern Rocky Mountain area. Clays Clay Miner. 1986, 34, 390–402. [Google Scholar] [CrossRef]
- Velde, B.; Espitalié, J. Comparison of kerogen maturation and illite/smectite composition in diagenesis. J. Pet. Geol. 1989, 12, 103–110. [Google Scholar] [CrossRef]
- Carvajal-Ortiz, H.; Gentzis, T. Geochemical screening of source rocks and reservoirs: The importance of using the proper analytical program. Int. J. Coal Geol. 2018, 190, 56–69. [Google Scholar] [CrossRef]


| Sample | Lease | County | Location | Depth m (ft) | Lithofacies | Applied Methods |
|---|---|---|---|---|---|---|
| T901-7620 | Tonya 901 | Borden | NE MB | 2323 (7620) | Black siliceous shale | XRD, CL, CM, REP |
| T901-7627 | Tonya 901 | Borden | NE MB | 2324 (7627) | Brown calcareous shale | OP, XRD, CL, CM |
| T901-7641 | Tonya 901 | Borden | NE MB | 2329 (7641) | Brown calcareous shale | OP, XRD, REP |
| T901-7645 | Tonya 901 | Borden | NE MB | 2330 (7645) | Brown calcareous shale | REP |
| T901-7649 | Tonya 901 | Borden | NE MB | 2330 (7649) | Brown calcareous shale | OP, REP |
| T901-7650 | Tonya 901 | Borden | NE MB | 2330 (7650) | Brown dolomite | OP, XRD |
| T901-7657 | Tonya 901 | Borden | NE MB | 2333 (7657) | Brown calcareous shale | OP, XRD, CL, CM |
| T901-7665 | Tonya 901 | Borden | NE MB | 2336 (7665) | Brown mudstone | XRD, CL, CM |
| T901-7669 | Tonya 901 | Borden | NE MB | 2337 (7669) | Brown dolomitic shale | OP, XRD, CL, CM |
| T901-7673 | Tonya 901 | Borden | NE MB | 2339 (7673) | Black siliceous shale | XRD, CL, CM, REP |
| T901-7690 | Tonya 901 | Borden | NE MB | 2343 (7690) | Black siliceous shale | OP, XRD |
| T901-7700 | Tonya 901 | Borden | NE MB | 2133 (7000) | Brown calcareous shale | OP, XRD |
| T901-7718 | Tonya 901 | Borden | NE MB | 2352 (7718) | Black siliceous shale | OP, XRD, CL, CM, REP |
| T901-7741 | Tonya 901 | Borden | NE MB | 2359 (7741) | Black shale | XRD, CL, CM |
| T901-8156 | Tonya 901 | Borden | NE MB | 2486 (8156) | Black shale | OP, XRD, CL, CM, REP |
| T901-8167 | Tonya 901 | Borden | NE MB | 2489 (8167) | Black shale | OP, XRD, CL, CM, REP |
| T901-8175 | Tonya 901 | Borden | NE MB | 2492 (8175) | Black shale | XRD, CL, CM, REP |
| T901-8187 | Tonya 901 | Borden | NE MB | 2495 (8187) | Brown dolomite | OP, XRD |
| T901-8197 | Tonya 901 | Borden | NE MB | 2498 (8197) | Black shale | OP, XRD, CL, CM |
| T901-8217 | Tonya 901 | Borden | NE MB | 2505 (8217) | Black shale | OP, XRD, CL, CM, REP |
| T901-8236 | Tonya 901 | Borden | NE MB | 2510 (8236) | Black shale | XRD, REP |
| T901-8252 | Tonya 901 | Borden | NE MB | 2515 (8252) | Black shale | CL, CM |
| T901-8256 | Tonya 901 | Borden | NE MB | 2516 (8256) | Black shale | CL, CM |
| T901-8275 | Tonya 901 | Borden | NE MB | 2522 (8275) | Brown limestone | OP, XRD, REP |
| T901-8289 | Tonya 901 | Borden | NE MB | 2526 (8289) | Brown dolomitic shale | OP, XRD, REP |
| T901-8306 | Tonya 901 | Borden | NE MB | 2532 (8306) | Brown siltstone | OP, XRD, REP |
| T901-8239 | Tonya 901 | Borden | NE MB | 2511 (8239) | Black shale | XRD |
| T901-8357 | Tonya 901 | Borden | NE MB | 2547 (8357) | Black shale | OP, XRD, REP |
| T401-9004 | Tonya 401 | Borden | NE MB | 2744 (9004) | Dark grey mudstone | OP, CL, CM, REP |
| T401-9005 | Tonya 401 | Borden | NE MB | 2744 (9005) | Green claystone | OP, XRD |
| T401-9008 | Tonya 401 | Borden | NE MB | 2745 (9008) | Dark grey limestone | XRD |
| T401-9015 | Tonya 401 | Borden | NE MB | 2748 (9015) | Dark green siltstone | OP, XRD, CL, CM, REP |
| T401-9016 | Tonya 401 | Borden | NE MB | 2748 (9016) | Dark green siltstone | XRD |
| T401-9017 | Tonya 401 | Borden | NE MB | 2748 (9017) | Dark green siltstone | OP, XRD |
| T401-9026 | Tonya 401 | Borden | NE MB | 2751 (9026) | Black limestone | OP, XRD |
| T401-9027 | Tonya 401 | Borden | NE MB | 2751 (9027) | Black mudstone | OP, XRD, CL, CM, REP |
| T401-9028 | Tonya 401 | Borden | NE MB | 2751 (9028) | Black mudstone | XRD |
| T401-9029 | Tonya 401 | Borden | NE MB | 2752 (2029) | Grey mudstone | XRD |
| T401-9030 | Tonya 401 | Borden | NE MB | 2752 (9030)] | Black-grey shale | OP, XRD |
| T401-9031 | Tonya 401 | Borden | NE MB | 2752 (9031) | Black shale | OP, XRD, REP |
| T401-9032 | Tonya 401 | Borden | NE MB | 2752 (9032) | Black-grey shale | XRD |
| T401-9033 | Tonya 401 | Borden | NE MB | 2752 (9033) | Black shale | OP |
| T401-9034 | Tonya 401 | Borden | NE MB | 2753 (9034) | Black-grey shale | OP, XRD, REP |
| T401-9035 | Tonya 401 | Borden | NE MB | 2753 (9035) | Black limestone | XRD |
| JP11091 | JP Chilton #1 | Gaines | NW MB | 3381 (11091) | Black shale | CL, CM, REP |
| JP11107 | JP Chilton #1 | Gaines | NW MB | 3385 (11107) | Black shale | CL, CM, REP |
| JP11118 | JP Chilton #1 | Gaines | NW MB | 3389 (11118) | Black shale | CL, CM, REP |
| JP11135 | JP Chilton #1 | Gaines | NW MB | 3394 (11135) | Black shale | CL, CM, REP |
| Sample | Depth (m) | TOC (wt%) | HI (mg HC/g TOC) | OI (mg CO2/g TOC) | Tmax (°C) | S1 (mg HC/g) | S2 (mg HC/g) | S3 | S2/S3 | Production Index S1/(S1 + S2) | Calculated %Ro * | Calculated %Ro ^ | Estimate Peak Burial Temperature (°C) ** | Estimate Peak Burial Temperature (°C) ^^ |
|---|---|---|---|---|---|---|---|---|---|---|---|---|---|---|
| T901-7620 | 2323 | 0.71 | 336.07 | 43.15 | 438 | 0.32 | 2.38 | 0.31 | 7.79 | 0.12 | 0.71 | 1.07 | 123 | 137 |
| T901-7641 | 2329 | 0.86 | 350.04 | 40.23 | 440 | 0.47 | 3.00 | 0.35 | 8.70 | 0.14 | 0.75 | 1.11 | 125 | 139 |
| T901-7645 | 2330 | 3.40 | 406.36 | 8.97 | 438 | 1.66 | 13.83 | 0.31 | 45.29 | 0.11 | 0.71 | 1.07 | 123 | 137 |
| T901-7649 | 2331 | 3.73 | 518.21 | 6.86 | 434 | 5.39 | 19.32 | 0.26 | 75.50 | 0.22 | 0.64 | 0.98 | 119 | 134 |
| T901-7673 | 2339 | 5.85 | 437.15 | 6.22 | 436 | 2.72 | 25.57 | 0.36 | 70.28 | 0.10 | 0.68 | 1.02 | 121 | 136 |
| T901-7718 | 2352 | 2.17 | 297.76 | 12.70 | 439 | 0.78 | 6.45 | 0.28 | 23.45 | 0.11 | 0.73 | 1.09 | 124 | 138 |
| T901-8156 | 2486 | 3.91 | 306.92 | 9.03 | 439 | 1.69 | 12.01 | 0.35 | 33.97 | 0.12 | 0.73 | 1.09 | 124 | 138 |
| T901-8167 | 2489 | 3.69 | 264.55 | 6.65 | 442 | 1.26 | 9.75 | 0.25 | 39.77 | 0.11 | 0.77 | 1.15 | 126 | 140 |
| T901-8175 | 2492 | 9.16 | 375.14 | 3.85 | 439 | 3.34 | 34.36 | 0.35 | 97.39 | 0.09 | 0.72 | 1.09 | 124 | 138 |
| T901-8217 | 2505 | 3.51 | 311.30 | 9.49 | 442 | 1.25 | 10.92 | 0.33 | 32.81 | 0.10 | 0.77 | 1.15 | 126 | 140 |
| T901-8236 | 2510 | 3.01 | 300.43 | 3.91 | 441 | 2.35 | 18.06 | 0.23 | 76.93 | 0.12 | 0.76 | 1.13 | 125 | 139 |
| T901-8275 | 2522 | 2.22 | 265.95 | 21.13 | 438 | 1.22 | 5.91 | 0.47 | 12.58 | 0.17 | 0.71 | 1.07 | 123 | 137 |
| T901-8289 | 2526 | 1.22 | 319.83 | 28.90 | 438 | 0.91 | 3.89 | 0.35 | 11.07 | 0.19 | 0.71 | 1.07 | 123 | 137 |
| T901-8306 | 2532 | 9.56 | 316.79 | 3.78 | 441 | 4.56 | 30.29 | 0.36 | 83.90 | 0.13 | 0.75 | 1.13 | 125 | 139 |
| T901-8357 | 2547 | 3.23 | 327.18 | 12.98 | 438 | 1.87 | 10.57 | 0.42 | 25.20 | 0.15 | 0.72 | 1.07 | 124 | 137 |
| T401-9004 | 2744 | 0.22 | 133.95 | 108.59 | 347 | 0.08 | 0.30 | 0.24 | 1.23 | 0.21 | ||||
| T401-9015 | 2748 | 0.15 | 294.84 | 108.23 | 347 | 0.10 | 0.45 | 0.17 | 2.72 | 0.18 | ||||
| T401-9027 | 2751 | 0.96 | 82.82 | 87.09 | 428 | 0.23 | 0.79 | 0.84 | 0.95 | 0.23 | 0.55 | 0.91 | 114 | 132 |
| T401-9031 | 2753 | 7.69 | 183.12 | 4.43 | 440 | 1.48 | 14.09 | 0.34 | 41.38 | 0.10 | 0.75 | 1.18 | 125 | 141 |
| T401-9034 * | 2754 | 0.86 | 40.65 | 15.10 | 441 | 0.14 | 0.35 | 0.13 | 2.69 | 0.29 | 0.76 | 1.22 | 125 | 142 |
| JP11091 | 3381 | 13.57 | 457.39 | 5.20 | 440 | 5.62 | 62.08 | 0.71 | 87.89 | 0.08 | 0.75 | 1.11 | 125 | 139 |
| JP11107 | 3385 | 3.62 | 336.14 | 7.76 | 441 | 1.25 | 12.16 | 0.28 | 43.89 | 0.09 | 0.77 | 1.13 | 126 | 139 |
| JP11118 | 3389 | 1.92 | 137.01 | 24.22 | 442 | 0.45 | 2.63 | 0.46 | 5.66 | 0.15 | 0.78 | 1.15 | 126 | 140 |
| JP11135 | 3394 | 3.70 | 216.00 | 6.00 | 441 | 0.71 | 8.00 | 0.22 | 35.99 | 0.08 | 0.76 | 1.13 | 126 | 139 |
© 2020 by the authors. Licensee MDPI, Basel, Switzerland. This article is an open access article distributed under the terms and conditions of the Creative Commons Attribution (CC BY) license (http://creativecommons.org/licenses/by/4.0/).
Share and Cite
Green, H.; Šegvić, B.; Zanoni, G.; Omodeo-Salé, S.; Adatte, T. Evaluation of Shale Source Rocks and Clay Mineral Diagenesis in the Permian Basin, USA: Inferences on Basin Thermal Maturity and Source Rock Potential. Geosciences 2020, 10, 381. https://doi.org/10.3390/geosciences10100381
Green H, Šegvić B, Zanoni G, Omodeo-Salé S, Adatte T. Evaluation of Shale Source Rocks and Clay Mineral Diagenesis in the Permian Basin, USA: Inferences on Basin Thermal Maturity and Source Rock Potential. Geosciences. 2020; 10(10):381. https://doi.org/10.3390/geosciences10100381
Chicago/Turabian StyleGreen, Hunter, Branimir Šegvić, Giovanni Zanoni, Silvia Omodeo-Salé, and Thierry Adatte. 2020. "Evaluation of Shale Source Rocks and Clay Mineral Diagenesis in the Permian Basin, USA: Inferences on Basin Thermal Maturity and Source Rock Potential" Geosciences 10, no. 10: 381. https://doi.org/10.3390/geosciences10100381