Review

The Tagus Estuary as a Numerical Modeling Test Bed: A Review

1
CESAM, Departamento de Física, Universidade de Aveiro, Campus de Santiago, 3810-193 Aveiro, Portugal
2
MARETEC-LarSys, Instituto Superior Técnico, Universidade de Lisboa, Av. Rovisco Pais, 1049-001 Lisboa, Portugal
*
Author to whom correspondence should be addressed.
Geosciences 2020, 10(1), 4; https://doi.org/10.3390/geosciences10010004
Submission received: 31 October 2019 / Revised: 11 December 2019 / Accepted: 16 December 2019 / Published: 20 December 2019

Abstract

:
The Tagus Estuary is the largest estuarine system in the Iberian Peninsula. Located in a heavily populated metropolitan area (Lisbon), the estuary-coastal continuum is subject to significant natural variability (e.g., tidal variations, winds, river inflow, etc.) and human pressures (e.g., sewage outflow, infrastructures, coastal reclamation, dredging, etc.). Since the 1980s, the estuary has been a natural laboratory for a great number of multidisciplinary studies, but also a numerical laboratory to test models and to develop new ideas and numerical methodologies. Hydrodynamic and biogeochemical models have been used ever since to ascertain the main spatial and temporal features of the Tagus system, connecting its dynamic to its biogeochemical cycles, providing numerical tools used to increase knowledge and to manage the estuary and nearby coastal waters. The main objective of this paper is to present a synopsis of the scientific output related to numerical studies in the Tagus system, by reviewing more than fifty papers published over the past four decades. Our work provides a historical background and description of the numerical models implemented to address estuarine hydrodynamics, nutrient uptake, primary production, light availability, seasonal and annual cycles and the link between physical, biological and chemical estuarine oceanography.

1. Introduction

Estuaries are natural buffers between two rather different environments, land and ocean, constituting the mixing zone between freshwater coming from inland (rivers) and the open ocean. Estuaries are complex systems in which matter, energy and information are exchanged between terrestrial and marine ecosystems [1]. They are, consequently, characterized by intense physical, biological and chemical interactions, leading to significant spatial gradients and temporal variability. They are frequently impacted by human activities and from an ecological perspective, estuaries host complex benthic and pelagic processes, both providing significant ecosystem services [2,3,4], mostly due to their role as chemical and biological filters or reactors that transform mass fluxes from riverine inputs on their way to the ocean [5]. Consequently, estuaries have been considered as unique ecosystems [6], but such acknowledgement has not prevent their constant degradation [7].
Managing such systems poses serious challenges, as it frequently requires maintaining their natural structure and functioning, while preventing negative impacts of human actions, or even reversing some, keeping a balance between conservation and restoration, and socio-economic benefits associated with present and future developments [3]. Decisions involved in such efforts frequently require a multidisciplinary process-oriented approach, based on the knowledge of the dynamics of the systems, but specially on the capacity of anticipating changes as a result of management options. Numerical models are the best tools to tackle such complexity, allowing to simulate past and present conditions, and to predict the evolution of estuaries to future states.
Over the past decades, numerical models have become fundamental tools to understand the intricate functioning of estuarine ecosystems, and their outputs have been pivotal in the integration of physical, ecological and socio-economic factors in the design and implementation of management policies [8,9,10,11]. In this context, numerical modeling has evolved in time, with increased model sophistication and complexity, mostly due to the rapid development of new mathematical methods to discretize the formulations that describe the processes and the increase in computational power.
The degree of sophistication of estuarine models has followed the continuous trend in the development of these numerical tools. Frequently, the complexity of issues to address has been the trigger to pursue new algorithms to cope with the many problems associated with estuarine management, thus spurring model development. Researchers have faced these challenges and commitments over the years by transforming estuaries into test beds or natural laboratories for numerical modeling, assessing existing or producing new algorithms, validating them with in-situ or remote sensing available data and integrating them into existing monitoring programs.
Nowadays, a wide range of numerical models are available to simulate estuarine processes that are related to natural or human-induced processes. Many of such models have the ability to integrate hydrology, morphology, habitat, and water/sediment quality [12], and the number of ways to use such tools keeps increasing. Here we briefly review the evolution of the many modeling approaches used to study estuaries over the past decades, using the Tagus Estuary (Portugal) as an illustrative example of a vast set of estuaries influenced by major littoral cities. This review provides a general overview of the methodologies used to simulate a wide range of processes and scales that characterize the dynamic of estuarine systems with focus on the Tagus-Coastal continuum.
This work amalgamates the knowledge from peer-reviewed literature on the many modeling studies of the Tagus estuary, and discusses future trends and challenges to model such a large coastal plain estuary. The paper is structured as follows: Section 2 provides a description of the main features of the study area; Section 3 offers a generic description of the evolution of estuarine hydrodynamic and biogeochemical modeling; Section 4 contains a synopsis of the modeling studies performed in the estuary since the 1980s; Finally, Section 5 provides a brief discussion on future modeling work that will provide additional understanding on the dynamics of the system.

2. The Tagus Estuary

2.1. Overview

The Tagus Estuary is located on the Portuguese central west coast, and comprises the inner estuarine area, the Tagus River mouth and adjacent coastal area (Figure 1), setting up a river-estuary-coast continuum. This coastal plain estuary, with an area of about 320 km2, is surrounded by the large metropolitan area of Lisbon, with a population of approximately 3 million, and it is the largest urban center at the Atlantic Coast of Europe (see Table 1 and references within for details). It is a mesotidal system, with semidiurnal tides and with a complex geomorphology constituted by a deep, long and narrow inlet connecting the Atlantic Ocean to a broad, shallow inner basin with extensive tidal flats and salt marsh areas (see Table 1). The estuary is shallow with an inner area presenting depths ranging from 0 to 12 m (mixing region), and a deeper channel that connects the estuary to the coastal sea, with depth ranging from 25 to 30 m, (see Figure 1). At the upper reaches of the estuary, the depth is lower than 1 m, and the estuary presents large intertidal and salt marsh areas. These represent about 43% of the total estuarine surface [13]. The estuary is part of a transnational river basin with a catchment area of more than 80,000 km2, discharging an average annual flow of more than 12,500 hm3 with a high sediment influx, making the estuary a turbid region [14].

2.2. Hydrodynamics

Water circulation in the region is controlled by the complex interplay of tides, wind stress and freshwater discharge [16]. The wind effect on circulation is conditioned by the vertical stratification, which in turn depends on heat exchange with the atmosphere and on salinity advection, besides the dependence on the balance between tides and river inflow effects. The estuary is often considered well mixed, even though stratification can be observed on different times of the tidal cycle [17,18] as depicted in Figure 2, s full salinity vertical gradients at different locations inside the estuary, extending toward the mouth (as visible in the left panel) and on the north and south corridor flows (middle and right panels) are visible. At longer time scales, an increase in the river flow, during winter, acts to intensify vertical density gradients, reducing vertical mixing and intensifying gravitational circulation [17]. At these locations, velocities of about 1 ms-1 are found and bottom salinity presents oceanic values ranging from 34 to 36.
Residual currents inside the estuary induce different transport pathways, which are controlled by freshwater discharge and wind [19]. Here, a theoretical transport pathway is proposed, highlighting the main forcing effect, controlling residual current on different areas of the estuary (Figure 3). In fact, the river discharge may induce the dispersion and transport of properties through two well defined corridors passing through the deeper areas of the estuary (the navigation channels). The outflow of the Tagus and Sorraia rivers produces a downward transport of properties (black arrows in Figure 3), which is visible in the central area of the estuary, corresponding to its mixing region. Then, the transport turns more chaotic due to the particular features of the bathymetry of the estuary in the area close to its mouth.
The wind stress plays a key role in the establishment of residual flow in the shallow areas of the estuary (close to its south margin). In this region, the wind direction may induce clockwise or counterclockwise residual flows according to the direction of the wind. A southwest wind generates a counterclockwise circulation and a north/northeast wind may induce a clockwise circulation as depicted in gray color in Figure 3.
Water exchange with the coastal region modulates stratification and controls the transport of estuarine waters to the coast [20,21], affecting hydrodynamics and biogeochemical processes [22]. Freshwater inflow, combined with tidal propagation, is responsible for the formation of a density gradient inside the estuary, which is advected back and forth, depending on the tidal phase and amplitude. When river inflow is high (~1000 m3 s−1), estuarine ebb velocities are enhanced by the strong pulse of freshwater, contributing to the propagation of low salinity estuarine water towards the shelf.
Local wind is determinant for the Tagus estuarine circulation. Wind direction is predominantly from northwest, north and southeast during winter over the entire extension of the estuary, and the predominant wind intensity ranges from 1.5 m s−1 (8.5% of occurrence) to 14 m s−1 (7.5% of occurrence). During spring, the predominant winds are mainly from the north or the northwest and the intensity ranges from 1 m s−1 (~5% of occurrence) to 15 m s−1 (~20% of occurrence).
Swell and winds are dominant from west and northwest but can change seasonally [22]. During winter, storm events are characterized by strong winds from the southwest, and by persistent northern winds in summer, which are favorable to the occurrence of upwelling.

2.3. Pollution

Contaminant deposition of several pollutants has occurred for decades in the bed sediments (silt, mud and sand particles) of the estuary. Local industries on both sides of the estuary are known sources of contaminants, such as Polycyclic Aromatic Hydrocarbons (PAH), organometallic compounds and a variety of toxic metals (e.g., arsenic, mercury, cadmium). A problematic situation has been reported for disabled phosphate plant located in the Barreiro area on the south margin [23], in which the phosphogypsum stockpile is identified as causing localized enhanced concentrations of natural radioisotopes of the uranium family (uranium 238 and its descendants, lead 210 and polonium 210). These elements enter the aquatic system by wind spreading and run-off and can be detected in the particulate matter found in the bottom sediments and in the water column.
Although many pollutants end up in the sediments, the disturbance associated to human activities promote their remobilization, leading to a temporary solubility followed by re-adsorption to the particulate phase [24]. In the inner part of the estuary, the construction of the Vasco da Gama Bridge for four years (September 1994–December 1998) was an example of such activities. Another example of sediment disturbance is the periodical dredging of the navigation channels, which can lead to pollutants displacement that are in rest in the benthic layer. However, these are sporadic activities, unlike the almost continuous action of hundreds of clam harvesters and boat clam dredging that scavenge the bottom sediments of wide shallow areas of the estuary.

3. Brief Historical Background on Estuarine and Coastal Modeling

3.1. Estuarine and Coastal Hydrodynamics

Circulation patterns, dissolved and suspended particles transport, bed sediment transport and flooding are directly controlled by estuarine and coastal hydrodynamics. The numerical tools developed over the year to address this wide range of phenomena started with the pioneering work of Hansen and Rattray [25]. Their work paved the way for the implementation of 1-dimensional models to study processes such as the net landward transport in estuarine systems (e.g., estuarine dynamics [26]), relevant for the understanding of salt, sediments and contaminant transport balances in estuaries. Subsequent developments brought the addition of an along-estuary coordinate, rendering the models 2-dimensions, expanding their capacity to simulate estuarine fronts, e.g., areas of estuarine convergence and/or stagnation. One of the first applications of such models is mentioned by Festa and Hansen [27], and describes the use of a 2-dimensionalmodel to tackle the effect of changes in depth and river flow on the salinity intrusion, showing a landward movement of the water intrusion with channel deepening.
While this development allowed the study of narrow estuarine systems, more complex domains including irregular geomorphological features required the inclusion of a lateral dimension. This necessity lead to the development of 2-dimensional depth integrated and 3-dimensional models, [28,29] that include wet and dry areas. This enhancement in model complexity, stands as a fundamental step in the study of estuaries and coastal regions where significant changes in hydrodynamic patterns occur due to complex bathymetric features, vertical gradients and/or lateral circulation.
Since then, model evolution has been continuous, benefiting from the increase in computational resources and development of sophisticated assimilation techniques. The synergy between these two factors made possible the development of more robust mixing schemes, higher resolution domains, nested model approaches, and the inclusion of detailed circulation processes. Early models relied on specified vertical mixing, mostly due to computational power constraints. The increase in such capacity, however, made possible the use of two-equation turbulence schemes to solve the transport of kinetic energy and turbulent length scales [30], achieving a better vertical structure simulation of estuarine areas. The increase in computational power also allowed an increase of spatial resolution for both structure and unstructured grids [29,31]. The capacity for high resolution domains proved to be crucial to simulate flooding processes in marshes, as well as other estuarine processes, such as salt and heat transport.

3.2. Estuarine and Coastal Biogeochemistry

Over the last decade, ecological modeling has become a standard methodology in the study of biogeochemical cycles in estuarine and coastal systems, resulting in a significant increase in knowledge on systems dynamics. However, ecological models have been used since the groundbreaking work of Riley et al. [32] back in 1949, with the first Nutrient-Phytoplankton-Zooplankton (NPZ) model for aquatic systems. This innovating work was followed in the 1960s and 1970s by an intense dissemination of the application of ecological models to estuaries, shelf ecosystems and lakes, as reported in the recent overview by Brush and Harris [33]. During this period, the models were limited in both the biological processes described and on their spatial resolution, usually accounting for 1 or 2 phytoplankton groups, a single zooplankton group, and with relatively course spatial resolution in 0- or 1-dimensional setups [34,35,36].
A substantial increase in model complexity occurred during the 1980s, seen in the innovative models developed for the Chesapeake Bay [37] and the Ems-Dollar estuary [38]. These models brought the novelty of including dissolved oxygen and particulate forms of nutrients in high resolution 3-dimensional domains. The implementation for the Ems Estuary, for instance, also included pelagic and benthic processes, with microphytobenthos along with deposit and suspension feeders. The implementation of models to support estuarine management also started in the 1980s, to address anthropogenic nutrient enrichment and the cultural eutrophication of estuaries [37].
In the following decades, some major developments in estuarine modeling have consisted in the inclusion of processes mediating watershed-estuary interactions, as well as a number of new components of coastal ecosystems and their food webs [39,40,41]. Also, increasingly higher spatial resolution was adopted, and the number of state variables increased considerably. Overall, ecological modelling followed the same trend as hydrodynamic models, as both modelling approaches tended to be coupled, and both benefited from a continuous increase in computational sciences. New computational schemes (e.g., finite-differences, finite -elements or finite-volumes) and new methodologies for domain discretization (rectilinear, curvilinear, unstructured or nested) become available, increasing the complexity of biogeochemical models by describing more thoroughly the role of hydrodynamics on the ecology of estuaries.
In recent years, some works have questioned the cost of complex models, proposing instead alternative modeling approaches that reduce some complexity [42,43]. For instance, 3-dimensional models that have a high computational cost have been in some cases where the vertical stratification is weak or non-existent, replaced by 2-dimensional approaches, without decreasing the model skill. Consequently, coupled hydro-biogeochemical model implementations in a 2-dimention setup become more usual in estuarine studies [44,45,46,47,48]. Throughout the years many models have been implemented to explore the influence of hydrodynamics in the transport patterns of salt, heat, nutrients and in the primary production of estuarine-coastal continuums. These implementations became the topic of workshops that summarized the implementations of coupled hydro-biogeochemical models to estuaries and coastal seas, addressing questions as parameterizations in estuarine and coastal modelling, methodological improvements in coastal modeling or the use of data (remote sensing and in-situ) to benefit estuarine and coastal models. Several of these models, which are currently being implemented, are referred in [49] and several examples are summarized in Table 2.

4. Modeling of the Tagus Estuary-costal Continuum

The Tagus Estuary acts as the interface between the Tagus River and the coastal ocean, constituting a continuum from the river to the coastal sea. Surrounded by a heavily populated area, the estuary and nearby coastal waters are subject to significant natural and anthropogenic stress. Understanding its hydrodynamic patterns has always been a requirement for the proper management of the entire estuarine area. Paradoxically, a limited number of numerical studies of pure hydrodynamic research and salt and heat transport processes have been performed through the years. Instead, hydrodynamic models have been widely used in combination with sediment transport models, expanded with water quality algorithms or coupled to ecological models. In fact, in most modeling studies, hydrodynamics is only a backup tool to provide a dynamic feature to the biological activity or chemical processes in the estuary.
This section addresses the modeling studies in the Tagus estuary, irrespective of the modelled processes or object of study. For convenience, the review is presented by decade and the terms biogeochemical, ecological and water quality models are used interchangeably, for simplicity.

4.1. The 1980s

The first published modeling study of the Tagus estuary addressed estuarine water quality management [50]. According to the state-of-the-art modelling strategies during the 1980s, this modeling study combined algorithms for physical transport processes and biochemical reactions giving a first approach to modeling studies in the estuary. The physical transport model consisted in a 1-dimensional dispersion model for non-conservative substances to track simplified non-point sources. The water quality algorithm accounted for the evolution of dissolved oxygen, biochemical oxygen demand, suspended solids, ammonia, nitrite, nitrate, organic nitrogen, orthophosphate and fecal coliforms. The model has constituted a novel methodology, since it combined a hydrodynamic algorithm and transport formulations of solute and particulate matter.

4.2. The 1990s

The first modeling study published in the 1990s presented a model to simulate suspended sediment transport in two tidal estuaries: the Scheldt (Belgium–The Netherlands) an the Tagus estuary [14]. This model application relied on a 2-dimensional regularly spaced grid (600 m resolution) for the lower estuary and adjacent coastal waters, combined with a 1-dimensional grid for the upper estuary and upstream fluvial section. Besides river input, the model considered tidal forcing (14 major tidal constituents) in the control of sediment transport, allowing an accurate representation of the hydrodynamics of the region and, also, of the transport of water properties that are mostly performed by the tidal propagation
Another modeling study of sediment dynamics in the estuary was performed a few years later, presenting a study more focused on the assessment of model parameterization [51]. This model considered the Tagus Estuary as a well-mixed water body, relying on the 2-dimensional depth averaged formulation of the transport equation. The numerical implementation of the model consisted on a finite-element solution of the transport equation on a Eulerian-Lagrangian framework. Also, constituting an evolution from the previous study, the model was composed by two distinct coupled modules: one describing water column dynamics (advection-dispersion, erosion, deposition, flocculation), and another addressing bottom consolidation mechanisms. After this work, another study was published, addressing the dispersal and deposition of suspended sediments in the Tagus region of freshwater influence (ROFI) using data, revealing the spatial patterns of fine sediments in the water column [21].
Almost simultaneously, two other modeling studies targeting water quality and ecological processes were presented. One work addressed the EcoWin model [52], whose development started some years earlier, consisting on an object-oriented approach to the ecological modelling. The model was tested on Carlingford Loug (Ireland) and the Tagus Estuary, and it was able to simulate physical processes (flow, advection-diffusion, etc.) along with ecological parameters (phytoplankton, zooplankton, nutrients, etc.) and their dynamics, connecting the dynamic characteristics and the ecological compartments of estuaries and lakes.
In 1995, the major outcomes of the JEEP-92 Project were summarized in a paper describing the use of different hydrodynamic and ecological models to study major microbiological processes in several European estuaries: Elbe, Ems, Westerschelde, Somme, Gironde, Shannon and Tagus [53]. Here, the model described pelagic and benthic processes, and their interaction, including primary production, nitrification, denitrification, zooplankton grazing, microbiological degradation of organic matter, grazing and migration, benthic mineralization, grazing by deposit and filter feeders, primary production by microphytobenthos and sedimentation, transport. However, this work didn’t report any results on the application of the models to the Tagus estuary. Also during this period, modelling studies addressed radionuclides pollution by employing box-models to evaluate the relationship of radionuclides 226Ra, 210Pb and 210PO with the transport of sediments, as well as their release into the estuary [54].
As mentioned before, there are just some examples of dedicated hydrodynamic studies in the Tagus Estuary-coastal continuum. Initial studies of such nature date back to the 1990s. The first published work on estuary hydrodynamics was performed using a finite-element model implementation [20] to investigate the complex circulation at the mouth of the Tagus Estuary, as depicted in Figure 4, where the generation of eddies in the mouth of the estuary was addressed. This work was part of a first effort to understand the tidal dynamics in the estuary, aiming to build a prognostic water quality model to support estuarine management. The same hydrodynamic model was then used to study the effect of tidal flats on the Tagus Estuary hydrodynamics [55], revealing a positive feedback between sediment deposition and hydrodynamic accretion in the upper reaches of the estuary, resulting on the increase of the duration of ebb tides.

4.3. The 2000s

The explosion in complexity of estuarine and coastal hydrodynamic models experienced during the 2000s was also evident in the modeling works developed in the Tagus Estuary. A model implementation used to evaluate the impact of climate change in the estuary was published in the start of this decade [56]. In this study, a methodology merging ecological modeling with geographical information analysis and remote sensing was proposed. In the model, salt marsh vegetation processes were simulated by combining a 20-parameter biogeochemical model describing physiological processes at the individual level, with a 12-parameter demographic model describing the population dynamics of salt marsh and mapping the risk assessment for losses in salt marshes in the estuary (Figure 5). Both models were developed for aboveground vegetation. The model application had no transport scheme and the spatial dimension was given by the GIS analysis.
The same authors revisited the subject years later, having expanded their earlier modeling study to a more comprehensive but complex modeling approach. Their aim was to assess the role of salt marsh vegetation in the nutrient dynamics and in the nutrient enrichment process in the estuary [57]. For that, they described salt marsh vegetation growth using a model that includes the simulation of nutrient dynamics through the sediment-water interface and the uptake kinetics by the vascular plants. This new model was an extension of the previous one, having also the simulation of the belowground component of the C3 and C4 photosynthetic plants, and ammonium supply to the sediments for plant uptake. Water flow and transport (advection-diffusion) within the estuary was calculated as fluxes between the 13 boxes used for spatial discrimination, achieved by incorporating the extended version of the model into the EcoWin modeling platform, developed during the previous decade for the estuary [52].
Salt marsh modeling was again the object of modeling by the end of the decade, to study the role of this areas in the sedimentation processes inside Ria de Aveiro and Tagus estuary [58]. In this study, the modeling approach used coupled hydrodynamic and Lagrangian models. The hydrodynamic model was 2-D vertically integrated, solving a set of finite difference equations using the alternating direction implicit (ADI) method on a space-staggered grid. The results, sea surface elevation and instantaneous horizontal velocities averaged over the entire depth of the water column, were then used by the Lagrangian model to determine the trajectories of passive particles that can be a proxy for suspended sediment movement. Because flooding and drying over tidal flats play a major role in the sediment dynamics, moving boundaries are used. The model domain was set as a square grid with 500 m horizontal resolution.
In a rather different study related to sediment dynamics, the Tagus estuary mouth was used as a “real-world” application to test a non-cohesive sediment transport model and bed-level change in near-shore regions [59]. The aim of this study was to assess the effect of waves and currents at the Bugio lighthouse island (located near the mouth of the estuary), highlighting possible changes of erosion/accretion patterns in the region.
Another modeling study using the Tagus estuary as a test case was performed to determine the water renewal time in estuaries and coastal lagoons [60]. The modeling approach relied on the use of a Lagrangian model coupled to the hydrodynamic model MOHID (www.mohid.com). The results provided interesting insights on the dynamics of the estuary, namely, that there are distinct regions: one with low renewal efficiency, e.g., the mixing region, located in the central area, and two more efficient areas in terms of water renewal, located on the upper reaches, where the water renewal is due to the freshwater inflow from the Tagus River, and another located near the estuary mouth, where water renewal is determined by advection of water. The Tagus estuary was again used as a numerical tool, to illustrate the capacity of the object-oriented design of the MOHID Water Modelling System to simulate complex coastal systems [61], where two intricate examples were advanced: an operational model for the Tagus estuary and the coupling of a river basin model (Trancão river) with the Tagus estuary model. This was a step forward in the connection of hydrological and estuarine models, constituting a numerical approach still in use in the Tagus Estuary management.
Two relevant numerical studies were published during the 2000s, both related to eutrophication in the estuary [62,63]. In the first published study, a mechanistic model of seaweed productivity was developed, with enhanced description of the underwater light climate in intertidal areas over the whole tidal cycle, while accounting for the formation of tide pools [62]. The aim of this study was to tackle the role of seaweeds on the Tagus Estuary eutrophication. Seaweed biomass variation was calculated from gross production and respiration, based on light climate data. The model relied on harmonic constituents to simulate tidal height and phase and calculated the erosion–deposition control on the distribution of suspended particulate matter in the tidal pools. Here the authors have calculated the annual seaweed production for the Tagus Estuary, revealing the subspecies that are more productive, as summarized in Figure 6.
The other modeling approach consisted on the estimating what would be the effect of the implementing Directive 91/271/EEC of 21 May 1991 (Waste Water Treatment Plant Directive) and Directive 91/676/EEC of 12 December (Nitrates Directive) in seven Portuguese estuaries (Minho, Lima, Douro, Mondego, Tagus, Sado and Guadiana) and two coastal lagoons (Ria de Aveiro and Ria Formosa) [47] The implementation of these two directives has the objective of reducing the risk of eutrophication in these Portuguese estuaries by imposing restrictions to against pollution caused by nitrates from agricultural sources and a key finding was that in systems with short residence time the reduction of nutrient loads will only produce a decrease in nutrient advection, having a negligible effect on primary production. In systems with high residence time, primary production is affected by the main factor limiting it: nutrients or light availability. This modelling evaluation relied on the use of the MOHID Water Modelling System in a 2-dimensional setup to perform simulations for three nitrogen load scenarios: reference, 50% nitrate removal by agriculture and 100% nutrients removal by wastewater treatment plants. The hydrodynamic model used in this study was based on a finite volume concept in which the motion and advection-diffusion transport equations are discretized. The model was coupled to a sediment transport and ecological models. Ecological processes were included in the form of sinks and sources terms of the transport model, computed on a 0-dimensional water quality model, solving the nitrogen and phosphorus cycles.
During the 2000s a first model application coupling a complex biogeochemical algorithm with a 2-dimensional hydrodynamic model for the Tagus estuary was published [64]. This preliminary model application aimed the evaluation of the role of nutrient and light limitation of primary production along the estuary continuum, using a process-oriented model, based on MOHID, with a 0-dimensional ecological model that solves the carbon, nitrogen, phosphorus, silica, and oxygen cycles (e.g., nutrient cycles). The model accounted for two major groups of producers in the system (e.g., diatoms and autotrophic flagellates) with chlorophyll synthesis and variable stoichiometry, the microbial loop (heterotrophic bacteria), and several organic matter components and reveals a light limitation in phytoplankton productivity along the estuary-coastal continuum.
During this period, a final modeling work focused on the hydrodynamics of the estuary, addressing the role of the wind regime on the estuary outflow plume and its transportation to the coastal ocean [16]. This study relied on a 3-dimensional coastal implementation of a hydrodynamic and transport model (based on MOHID) to simulate the advection the buoyant plume of the Tagus Estuary during winter conditions, as part of a preliminary effort to evaluate the impact of estuarine waters on the coastal area, revealing the competition between the estuary discharge and wind propagation. This study was a first attempt to address the impact of the estuary in the water properties and propagation patterns into the coast, revealing a fast response of the coastal water to wind stress and estuarine outflow.

4.4. The 2010s

The last decade has been prolific regarding computational applications to the Tagus estuary, as seen by the +30 papers published on a wide range of model applications, covering the hydrodynamic and biogeochemical features of the estuary. Three modeling studies focused on the hydrodynamics of the estuary [65,66,67] were published in the beginning of the decade. One of them addressed the influence of currents and waves on the circulation at the entrance of the estuary [65], using a high-resolution application of the SWAN model coupled to a wave predictor system consisting of two phase averaged wave models. the role of tidal level and tidal currents were considered in the simulation that highlighted an improvement in wave calculations with the inclusion of those hydrodynamic variables, allowing a better representation of significant wave height and wave period along the estuary and near its mouth, contributing to an accurate spatial representation of the wave characteristics along the estuary, as depicted in Figure 7.
In a rather different approach, the semidiurnal and spring-neap tide-induced variation on the biogeochemistry of the estuary was evaluated, by coupling a 2-dimensional hydrodynamic model with a 200 m resolution grid for the whole extension of the estuary [66]. The model application was based on the MOHID Water Modelling System, using the same complex biogeochemical model tested in a previous model application [64]. Here the relation between suspended sediment dynamics and chlorophyll a pigment was evaluated, and an inverse relation was computed, highlighting the light limitation in chlorophyll generation along the estuary continuum. The other study focused on the complex tidal dynamics of the Tagus Estuary with a 2-dimensional model, analyzed the amplitude, phase and tidal ellipse of the main diurnal and semidiurnal constituents, generated inside the estuary [67], pointing to the high dependence of the tidal dynamics on the bottom topography and coastline geometry, and, also to the generation of an amplification of the main tidal constituent (M2) in the mixing area of the estuary, due to a resonance mode generated through reflection, with a period close to 12 h. Moreover, tidal dissipation was found to be higher in deeper areas where tidal currents are higher than in shallow regions where the tidal flow is considerably lower. This work had a follow-up with a more detailed assessment of local variations in the tidal regime of the estuary [68].
Two modeling studies coupling a high-resolution 2-dimensional model with a complex biogeochemical model were issued, denoting a trend in high-computational demand in the implementation of numerical algorithms to the estuary. In one paper, a follow-up of a previous work [64], the model was used to highlight some major biogeochemical patterns and processes in the estuary and their potential drivers [48], revealing the establishment of complete horizontal gradients of nutrients inside the estuary, forced by the complex interplay of river inflow and tidal propagation, with a higher contribution of nutrients from inland (e.g., river discharge) (Figure 8).
The same modeling setup was used on a more theoretical study, to evaluate the relevance of having variable C:Chla ratios in ecological models [48], suggesting that the use of the proposed methodology should become standard in estuarine ecological modeling.
The effect of the projected sea level rise on the Tagus estuary and nearby coastal waters was also object of numerical studies. One study, based on a 2-dimensional hydrodynamic model, pointing out to significant differences in the residual circulation in the upper reaches of the estuary as a response to different sea level rise scenarios [70]. A similar study was published showing the results of a model implementation for the Tagus continuum and Ria de Aveiro Lagoon. Here the study focused on the impact of seal level changes on the salt marsh dynamics [69], revealing some differences on the current velocity due to an increase in the mean sea level. A subsequent study showed that sea level rise will lead to an amplification of both semi-diurnal and quarter-diurnal tidal constituents, along the mixing region of the Tagus estuary [71] due to advection of coastal waters into the estuary. In a related application, a suite of regional and local scale wave, tide and surge models was developed to analyze the impact of an extreme natural event induced by a storm in 1941 on water level within the estuary [72]. This interesting modeling study revealed that the regional surge and the setup induced by swell were the two main drivers of the inundation in the inner reaches of the estuary, and that the modulation of the wave setup by tides induced a semi-diurnal signal, amplified by resonance inside the estuary.
The constant and intense upgrading of the open-source MOHID water modeling system throughout the 2010s provided several different modeling approaches to study the Tagus estuary. The explicit modeling of CO2 dynamics inside the estuary was tested, using a model upgrade that adds gas fluxes across the water-air interface and the role of physical processes controlling CO2 partial pressure on the water, to an already complex biogeochemical model [73]. The mussel growth inside the estuary was also studied, using a dynamic energy budget (DEB) model coupled to a 2-dimensional biophysical model [74]. Moreover, a methodology to estimate water fluxes and constituents budgets across different section of the estuary was proposed, based on a 3-dimensional hydrodynamic model application coupled to a water quality model [75]. In a latter paper, the MOHID water modeling system was presented as the center of an operational decision support system that combines water quality and hydrodynamic modeling to simulate the impact of the sewage system in Tagus estuary and adjacent coastal area [76]. All these numerical implementations set the base for the management of the estuary in terms of its chemical and biological features and are still in use similar numerical tools.
Following on the study of the link between coastal hydrodynamics and heat transport and chlorophyll patterns, a 3-dimensional nested hydrodynamic-biogeochemical model was implemented to the Tagus Estuary Coastal area, revealing an increase in sea surface temperature (SST) and chlorophyll-a in the coastal area, as consequence of an increase in concentration of such variables inside the estuary [22]. The effect of the estuary in the coastal ocean was also investigated in terms of the CO2 fluxes across the water-air interaction, under different hydrological conditions [77]. However, in this study the model application only dealt with the simulation of estuarine and coastal hydrodynamics, to highlight the processes controlling the Tagus plume.
Sediment dynamic in the Tagus estuary was also revisited using numerical models. In a novel modeling approach that uses an upgraded version of the MOHID, a three-nested hydrodynamic one-way modeling approach with a detailed model for cohesive sediment dynamics was combined [78]. This application that relied on a previous validation of the hydrodynamic results by harmonic analysis and with acoustic doppler current profiler (ADCP) data, illustrated the relevance of wind and waves on cohesive sediment erosion, besides the well know role of tidal currents. This modelling study set the foundations to a latter development of the sediment dynamics model [79], to include morphodynamics with a 3-dimensional hydrodynamic model and advection-diffusion transport of multiple classes of suspended sediments, both cohesive and non-cohesive. The model also included the effects of sediment mixtures and bed consolidation because of resistance to erosion. The Tagus estuary was used as a real-life test scenario to this model, in a set of six test cases proposed by the authors in order to map the bottom granulometry of the estuary using this model of bottom sediment transport (Figure 9).
During the 2010s an intensification on the development and use of models to address higher trophic levels in the estuary has been observed. Fish modeling is such an example. A first study reports the use of an ecophysiological model to determine the effects of varying habitat conditions on the growth of two juvenile sole species in the estuary [81]. Almost at the same time, two similar studies were published to explain the occurrence and density of juvenile fish of different species with commercial interest, based on environmental variables, at different estuaries in Portugal, among which was the Tagus estuary [80,82]. These preliminary studies relied on a generalized linear model that provides information for future spatially explicit modelling of the distribution of the target species, to understand key features of nursery areas. The use of numerical model to evaluate fish availability according to the environmental variables and habitat characteristics was later revisited for the Tagus estuary [83], by comparing a set of modeling techniques: 1) conventional non-parametric statistical models (Generalized Linear Models and Generalized Additive Models) and 2) machine-learning methods (Classification and Regression Trees and Boosted Regression Trees). A related study was published shortly after, assessing the influence of the ecology of the studied species in model accuracy [84].
More recently, some works proposed an advance in the modeling methodologies, pointing to the importance of the use of such approaches for managing the estuary. A purely hydrodynamic analyses of the circulation in the Tagus estuary has been proposed in a numerical study with a 3-dimensional baroclinic circulation model using the modeling system SCHISM [18]. At the same time, a study on the role of saltmarsh detrital metal exports under extreme climatic events was published [85], in which a previously develop hydrodynamic model application was used [66], to simulate transport patterns of passive particles (using a lagrangian approach) inside the estuary and possible exportation of metals to the coastal area. Other work addressed hydrodynamic control of the processes at the Tagus ROFI area, identifying the main modes of variability of the region [86]. This study sets the main horizontal distribution patterns of salinity and water temperature in response to different wind conditions, namely upwelling and downwelling favorable (as depicted in Figure 10).
Another work sets an operational 3-dimensional model for the estuary and its region of freshwater influence [88]. The main objective of this study was to perform simulation of the Tagus continuum, both in hindcast and forecast modes, providing high-resolution outputs for the hydrodynamics and water quality parameters of the region. A final work was focused on the saltwater intrusion at the upper reaches of the Tagus Estuary, and was based on a finite element model system (SCHISM) applied to the estuary, showing that the impact of a moderate sea level rise on salinity intrusion is modest when compared with the impact of low river discharges [89].
This decade has provided a breakthrough in modelling of the Tagus-estuary-coastal continuum. Several new model implementations were developed, using higher spatial resolutions, different grids (e.g., finite elements or volumes) and numerical schemes to discretize the model equations. The increase in computational resources allowed the use of more refined grids to achieve a better representation of features as bottom granulometry, nutrient and chlorophyll spatial distribution, CO2 absorption or flooding areas that are prone to be a reality in a climate change context. All the advances allowed to add more processes to the numerical models simulating more accurately the dynamic features of the biogeochemical cycles along the estuary without sacrificing the model skill and accuracy.

5. Future Challenges

The volume of modeling approaches compiled in this review, and the wide range of processes and phenomena they address, shows that the Tagus estuary has been used as a numerical test bed for the last four decades. These studies contributed to a significant increase in the knowledge of the dynamic of the estuary and to the development of several numerical models, specific algorithms or related methodologies.
The cooperation between academic researchers, consultancy professionals and end users will have an important role in the development of novel numerical implementations to study future challenges on the hydrodynamics and biogeochemistry of the Tagus Estuary-Coastal continuum. So far, model applications to the Tagus Estuary have followed the general trend in modeling developments along the decades, sometimes even setting the state-of-the-art in modeling the role of the estuary in the land-sea continuum. As such, it is expected that modeling studies in the estuary keep in pace with model improvements and trends in the topics of research. Some of these will unquestionably be central in future modeling studies of the Tagus estuary:
  • The increase of Sea level for the Portuguese coast is expected to occur within a range from 0.05 to 0.57 m [87,90,91]. If materialized, it will induce inundation of low-lying lands and erosion of sandy beaches, an increase in tidal prism with the potential to modify residence time and stratification, landward intrusion of salt water that increases salinization of agricultural fields and aquifers and displacement of ecosystems and habitat loss [91,92].
  • Shifts in algal, plankton and fish abundances, decrease in oxygen levels and changes in nutrient cycles [93] forced by variations in air temperature, which presents a predicted increase of 1.9 °C by the end of the century and the increase of heat waves [94].
  • Changes in the hydrologic regimes may occur as a result of predicted decrease in the precipitation regime of around 20% to 40% that will impact in the amount of freshwater discharged into the estuary, with a cascade effect on cohesive sediment availability [95] and, subsequently, on the light availability on the water column.
  • The regulation by Spanish and Portuguese environmental authorities of dam discharges, which regulates, the main river tributaries, like the Tagus and Sorraia rivers, can affect the amount of freshwater discharging into the estuary leading to river forcing modulated by water pulses, which may act to change cohesive sediments, light availability and consequently estuarine primary production.
  • Changes due to human interaction such as dredging operations that affect water columns depth, leading to changes in the Tagus estuary hydrodynamics.
  • On the coast, the impact of changes in meteorological forcing, e.g., wind intensity and direction, will be a reality, affecting the propagation of estuarine plumes that transport particulate and solute materials onto the coastal sea. This may impact on the trophic levels, since local production could be affected.
All the previously referred topics will be studied using novel and sophisticated numerical implementations that will allow a better representation of estuarine hydrodynamics and biogeochemical patterns. These implementations should use a better representation of estuarine and coastal bathymetry, which is hard to obtain, in order to generate numerical grids that resolve not only the main navigation channels, but also topographic and ecosystem features like intertidal areas, salt marshes or marginal zones, around the estuarine margins that are prone to marine flooding.
One other aspect that we should consider in future implementations for the Tagus Estuary is to use adaptable horizontal grids, with higher horizontal resolution in areas of interest, which will be critical to improve the representation of the horizontal velocity fields. Directly connected to the horizontal grid, one aspect that should be considered is the use of a vertical coordinate to better resolve vertical variations of current velocity and also of the water properties like salinity, water temperature, light availability or nutrients, that could be used to study primary production of the benthonic and pelagic layers. The better representation of the horizonal and vertical gradients of current velocity is critical to identify preferential areas in which water properties are transported to perform an accurate model validation, regarding the Tagus Hydrodynamics and biogeochemistry.
The future model developments should focus on a full representation of the estuary’s biogeochemistry. The studies should Assimilate variables originated from the state-of-the art satellite imagery (Sentinel satellite) and available in-situ data in order to improve the results. For that, the use of sophisticated neural networks that consider independent learning, should be considered to generate numerical systems with hindcast and forecast capacity.
All the aspects referred in this section represents a time consuming and challenging task that will occupy much of the modelers working in such a large and important estuarine system like the Tagus Estuary.

Author Contributions

Conceptualization, N.V. and M.M.; writing—original draft preparation, N.V. and M.M.; writing—review and editing, L.P., R.N. and J.M.D. All authors have read and agreed to the published version of the manuscript.

Funding

NV is supported by national funds (OE), through FCT – Fundação para a Ciência e a Tecnologia, I.P., in the scope of the framework contract foreseen in the numbers 4, 5 and 6 of the article 23, of the Decree-Law 57/2016, of August 29, changed by Law 57/2017, of July 19. NV and JMD are partially funded by FCT/MCTES that supports CESAM (UID/AMB/50017/2019), through national funds. M.M., L.P. and R.N. were funded by ERDF Funds of the Competitiveness Factors Operational Programme—COMPETE and by national funds from the FCT—Foundation for Science and Technology project UID/EEA/50009/2013.

Acknowledgments

The authors acknowledge the contribution of Vanda Brotas and Isabel Ambar for the data depicted in Figure 2.

Conflicts of Interest

The authors declare no conflict of interest.

References

  1. Dame, R.F. Estuaries. In Encyclopedia of Ecology; Jorgensen, S.E., Fath, B., Eds.; Elsevier: Amsterdam, The Netherlands, 2008; pp. 1407–1413. ISBN 9780080454054. [Google Scholar]
  2. Jacobs, S.; Wolfstein, K.; Vandenbruwaene, W.; Vrebos, D.; Beauchard, O.; Maris, T.; Meire, P. Detecting ecosystem service trade-offs and synergies: A practice-oriented application in four industrialized estuaries. Ecosyst. Serv. 2015, 16, 378–389. [Google Scholar] [CrossRef]
  3. Boerema, A.; Meire, P. Management for estuarine ecosystem services: A review. Ecol. Eng. 2017, 98, 172–182. [Google Scholar] [CrossRef]
  4. Luisetti, T.; Turner, R.K.; Jickells, T.; Andrews, J.; Elliott, M.; Schaafsma, M.; Beaumont, N.; Malcolm, S.; Burdon, D.; Adams, C.; et al. Coastal Zone Ecosystem Services: From science to values and decision making; a case study. Sci. Total Environ. 2014, 493, 682–693. [Google Scholar] [CrossRef] [PubMed]
  5. Kirk Cochran, J. Estuaries. Ref. Modul. Earth Syst. Environ. Sci. 2014. [Google Scholar] [CrossRef]
  6. Potter, I.C.; Chuwen, B.M.; Hoeksema, S.D.; Elliott, M. The concept of an estuary: A definition that incorporates systems which can become closed to the ocean and hypersaline. Estuar. Coast. Shelf Sci. 2010, 87, 497–500. [Google Scholar] [CrossRef]
  7. Lotze, H.K.; Lenihan, H.S.; Bourque, B.J.; Bradbury, R.H.; Cooke, R.G.; Kay, M.C.; Kidwell, S.M.; Kirby, M.X.; Peterson, C.H.; Jackson, J.B.C. Depletion, Degradation, and Recovery Potential of Estuaries and Coastal Seas. Science 2006, 312, 1806–1809. [Google Scholar] [CrossRef]
  8. Hardisty, J. (Ed.) Estuaries: Monitoring and Modeling the Physical System; Wiley: Hoboken, NJ, USA, 2007. [Google Scholar]
  9. dit Durell, S.E.A.L.V.; Stillman, R.A.; Triplet, P.; Desprez, M.; Fagot, C.; Loquet, N.; Sueur, F.; Goss-Custard, J.D. Using an individual-based model to inform estuary management in the Baie de Somme, France. Oryx 2008, 42, 265–277. [Google Scholar] [CrossRef] [Green Version]
  10. Jovanovic, D.; Gelsinari, S.; Bruce, L.; Hipsey, M.; Teakle, I.; Barnes, M.; Coleman, R.; Deletic, A.; Mccarthy, D.T. Modelling shallow and narrow urban salt-wedge estuaries: Evaluation of model performance and sensitivity to optimise input data collection. Estuar. Coast. Shelf Sci. 2019, 217, 9–27. [Google Scholar] [CrossRef]
  11. Slinger, J.H. Hydro-morphological modelling of small, wave-dominated estuaries. Estuar. Coast. Shelf Sci. 2017, 198, 583–596. [Google Scholar] [CrossRef] [Green Version]
  12. Wolanski, E.; McLusky, D. (Eds.) Treatise on Estuarine and Coastal Science; Elsevier: Amsterdam, The Netherlands, 2011. [Google Scholar]
  13. Castanheiro, J.M. Distribution, transport and sedimentation of suspended matter in the Tejo Estuary. In Estuarine Processes: An Application to the Tagus Estuary; Secretaria de Estado Naturais, Ambiente e Recursos: Lisboa, Portugal, 1986; pp. 75–90. [Google Scholar]
  14. Portela, L.I.; Neves, R. Numerical modelling of suspended sediment transport in tidal estuaries: A comparison between the Tagus (Portugal) and the Scheldt (Belgium-the Netherlands). Netherlands J. Aquat. Ecol. 1994, 28, 329–335. [Google Scholar] [CrossRef]
  15. Pinto, P.J.; Kondolf, G.M. Evolution of Two Urbanized Estuaries: Environmental Change, Legal Framework, and Implications for Sea-Level Rise Vulnerability. Water 2016, 8, 535. [Google Scholar] [CrossRef] [Green Version]
  16. Vaz, N.; Fernandes, L.; Leitão, P.C.; Dias, J.M.; Neves, R.; Manuel, A. The Tagus Estuarine Plume Induced By Wind and River Runoff: Winter 2007 Case Study. J. Coast. Res. 2009, SI 56, 1090–1094. [Google Scholar]
  17. Neves, F.J. Dynamics and Hydrology of the Tagus Estuary: Results from In Situ Observations; University of Lisbon: Lisbon, Portugal, 2010. [Google Scholar]
  18. Rodrigues, M.; Fortunato, A.B. Assessment of a three-dimensional baroclinic circulation model of the Tagus estuary (Portugal). AIMS Environ. Sci. 2017, 4, 763–787. [Google Scholar] [CrossRef]
  19. Vaz, N.; Dias, J.M. Residual currents and transport pathways in the Tagus estuary, Portugal: the role of freshwater discharge and wind. J. Coast. Res. 2014, 70, 610–615. [Google Scholar] [CrossRef]
  20. Fortunato, A.; Baptista, A.; Luettich, R. A three-dimensional model of tidal currents in the mouth of the Tagus estuary. Cont. Shelf Res. 1997, 17, 1689–1714. [Google Scholar] [CrossRef]
  21. Jouanneau, J.M.; Garcia, C.; Oliveira, A.; Rodrigues, A.; Dias, J.A.; Weber, O. Dispersal and deposition of suspended sediment on the shelf off the Tagus and Sado estuaries, S.W. Portugal. Prog. Oceanogr. 1998, 42, 233–257. [Google Scholar] [CrossRef]
  22. Vaz, N.; Mateus, M.; Plecha, S.; Sousa, M.C.; Leitão, P.C.; Neves, R.; Dias, J.M. Modeling SST and chlorophyll patterns in a coupled estuary-coastal system of Portugal: The Tagus case study. J. Mar. Syst. 2015, 147, 123–137. [Google Scholar] [CrossRef]
  23. Carvalho, F.P.; Oliveira, J.M.; Silva, L.; Malta, M. Radioactivity of anthropogenic origin in the Tejo Estuary and need for improved waste management and environmental monitoring. Int. J. Environ. Stud. 2013, 70, 952–963. [Google Scholar] [CrossRef]
  24. Caetano, M.; Madureira, M.-J.; Vale, C. Metal Remobilisation during Resuspension of Anoxic Contaminated Sediment: Short-Term Laboratory Study. Water. Air. Soil Pollut. 2003, 143, 23–40. [Google Scholar] [CrossRef]
  25. Hansen, D.V. Gravitational circulation in straits and estuaries. J. Mar. Res. 1965, 23, 104–122. [Google Scholar]
  26. Geyer, W.R.; MacCready, P. The Estuarine Circulation. Annu. Rev. Fluid Mech. 2014, 46, 175–197. [Google Scholar] [CrossRef]
  27. Festa, J.F.; Hansen, D. V A two-dimensional numerical model of estuarine circulation: The effects of altering depth and river discharge. Estuar. Coast. Mar. Sci. 1976, 4, 309–323. [Google Scholar] [CrossRef]
  28. Cheng, R.T.; Casulli, V.; Gartner, J.W. Tidal, Residual, Intertidal Mudflat (TRIM) Model and its Applications to San Francisco Bay, California. Estuar. Coast. Shelf Sci. 1993, 36, 235–280. [Google Scholar] [CrossRef]
  29. Vaz, N.; Dias, J.M.; Leitão, P.; Martins, I. Horizontal patterns of water temperature and salinity in an estuarine tidal channel: Ria de Aveiro. Ocean Dyn. 2005, 55, 416–429. [Google Scholar] [CrossRef] [Green Version]
  30. Umlauf, L.; Burchard, H. A generic length-scale equation for geophysical turbulence models. J. Mar. Res. 2003, 61, 235–265. [Google Scholar] [CrossRef]
  31. Zhao, L.; Chen, C.; Vallino, J.; Hopkinson, C.; Beardsley, R.C.; Lin, H.; Lerczak, J. Wetland-estuarine-shelf interactions in the Plum Island Sound and Merrimack River in the Massachusetts coast. J. Geophys. Res. Ocean. 2010, 115, C10. [Google Scholar] [CrossRef] [Green Version]
  32. Riley, G.A.; Stommel, H.; Bumpus, D.F. Quantitative Ecology of the Plankton of the Western North Atlantic. Bull. Bingham Oceanogr. 1949, 12, 1–169, Collection. [Google Scholar]
  33. Brush, M.J.; Harris, L.A. Introduction to the special issue of Ecological Modelling: “Advances in Modeling Estuarine and Coastal Ecosystems: Approaches, Validation, and Applications”. Ecol. Modell. 2010, 221, 965–968. [Google Scholar] [CrossRef]
  34. DiToro, M.D. A dynamic model of the phytoplankton population in the Sacramento-San Joaquin delta. Advan.in Chem Ser. 1971, 106, 262–267. [Google Scholar]
  35. Steele, J.H. The Structure of Marine Ecosystems; Harvard University Press: Cambridge, MA, USA, 1974. [Google Scholar]
  36. Kremer, J.N.; Nixon, S.W. A Coastal Marine Ecosystem: Simulation and Analysis; Springer: New York, NY, USA, 1978. [Google Scholar]
  37. HydroQual A Steady-State Coupled Hydrodynamic/Water Quality Model of the Eutrophication and Anoxia Process in Chesapeake Bay; HydroQual Inc.: Mahwah, NJ, USA, 1987.
  38. Baretta, J.; Ruardij, P. Tidal Flat Estuaries: Simulation and Analysis of the Ems Estuary; Springer: Berlin, Germany, 1988. [Google Scholar]
  39. Billen, G.; Garnier, J. The Phison River plume: coastal eutrophication in response to changes in land use and water management in the watershed. Aquat. Microb. Ecol. 1997, 13, 3–17. [Google Scholar] [CrossRef]
  40. Baretta-Bekker, J.G.; Baretta, J.W.; Ebenhöh, W. Microbial dynamics in the marine ecosystem model ERSEM II with decoupled carbon assimilation and nutrient uptake. J. Sea Res. 1997, 38, 195–211. [Google Scholar] [CrossRef]
  41. Baretta, J.W.; Ebenhöh, W.; Ruardij, P. The European regional seas ecosystem model, a complex marine ecosystem model. Netherlands J. Sea Res. 1995, 33, 233–246. [Google Scholar] [CrossRef]
  42. Friedrichs, M.A.M.; Hood, R.R.; Wiggert, J.D. Ecosystem model complexity versus physical forcing: Quantification of their relative impact with assimilated Arabian Sea data. Deep Sea Res. Part II Top. Stud. Oceanogr. 2006, 53, 576–600. [Google Scholar] [CrossRef]
  43. Duarte, C.M.; Amthor, J.S.; DeAngelis, D.L.; Joyce, L.A.; Maranger, R.J.; Pace, M.L.; Pastor, J.; Running, S.W. The limits to models in ecology. In Models in Ecosystem Science; Canham, C.D., Cole, J.J., Lauenroth, W.K., Eds.; Princeton University Press: Princeton, NJ, USA, 2003; pp. 437–451. [Google Scholar]
  44. Arndt, S.; Lacroix, G.; Gypens, N.; Regnier, P.; Lancelot, C. Nutrient dynamics and phytoplankton development along an estuary–coastal zone continuum: A model study. J. Mar. Syst. 2011, 84, 49–66. [Google Scholar] [CrossRef]
  45. Lopes, J.F.; Vaz, N.; Vaz, L.; Ferreira, J.A.; Dias, J.M. Assessing the state of the lower level of the trophic web of a temperate lagoon, in situations of light or nutrient stress: A modeling study. Ecol. Modell. 2015, 313, 59–76. [Google Scholar] [CrossRef]
  46. Dijkstra, Y.M.; Chant, R.J.; Reinfelder, J.R. Factors Controlling Seasonal Phytoplankton Dynamics in the Delaware River Estuary: An Idealized Model Study. Estuaries Coasts 2019, 42, 1839–1857. [Google Scholar] [CrossRef] [Green Version]
  47. Trancoso, A.R.; Saraiva, S.; Fernandes, L.; Pina, P.; Leitão, P.; Neves, R. Modelling macroalgae using a 3D hydrodynamic-ecological model in a shallow, temperate estuary. Ecol. Modell. 2005, 187, 232–246. [Google Scholar] [CrossRef]
  48. Mateus, M.; Vaz, N.; Neves, R. A process-oriented model of pelagic biogeochemistry for marine systems. Part II: Application to a mesotidal estuary. J. Mar. Syst. 2012, 94, S90–S101. [Google Scholar] [CrossRef]
  49. Fringer, O.B.; Dawson, C.N.; He, R.; Ralston, D.K.; Zhang, Y.J. The future of coastal and estuarine modeling: Findings from a workshop. Ocean Model. 2019, 143, 101458. [Google Scholar] [CrossRef]
  50. Câmara, A.S.; Néo, F.A.; Ribeiro, M.T.G.; Painho, M.T. Estuarine Water Quality Management—A New Approach. IFAC Proc. Vol. 1985, 18, 63–67. [Google Scholar] [CrossRef]
  51. Barros, A.P. An evaluation of model parameterizations of sediment pathways: A case study for the Tejo estuary. Cont. Shelf Res. 1996, 16, 1725–1749. [Google Scholar] [CrossRef]
  52. Ferreira, J.G. ECOWIN—An object-oriented ecological model for aquatic ecosystems. Ecol. Modell. 1995, 79, 21–34. [Google Scholar] [CrossRef]
  53. Heip, C.; Herman, P.M.J. Major biological processes in European tidal estuaries: A synthesis of the JEEP-92 Project. Hydro 1995, 311, 1–7. [Google Scholar] [CrossRef]
  54. Carvalho, F.P. Distribution, cycling and mean residence time of 226Ra, 210Pb and 210Po in the Tagus estuary. Sci. Total Environ. 1997, 196, 151–161. [Google Scholar] [CrossRef]
  55. Fortunato, A.; Oliveira, A. On the effect of tidal flats on the hydrodynamics of the Tagus estuary. Oceanol. Acta 1999, 22, 31–44. [Google Scholar] [CrossRef] [Green Version]
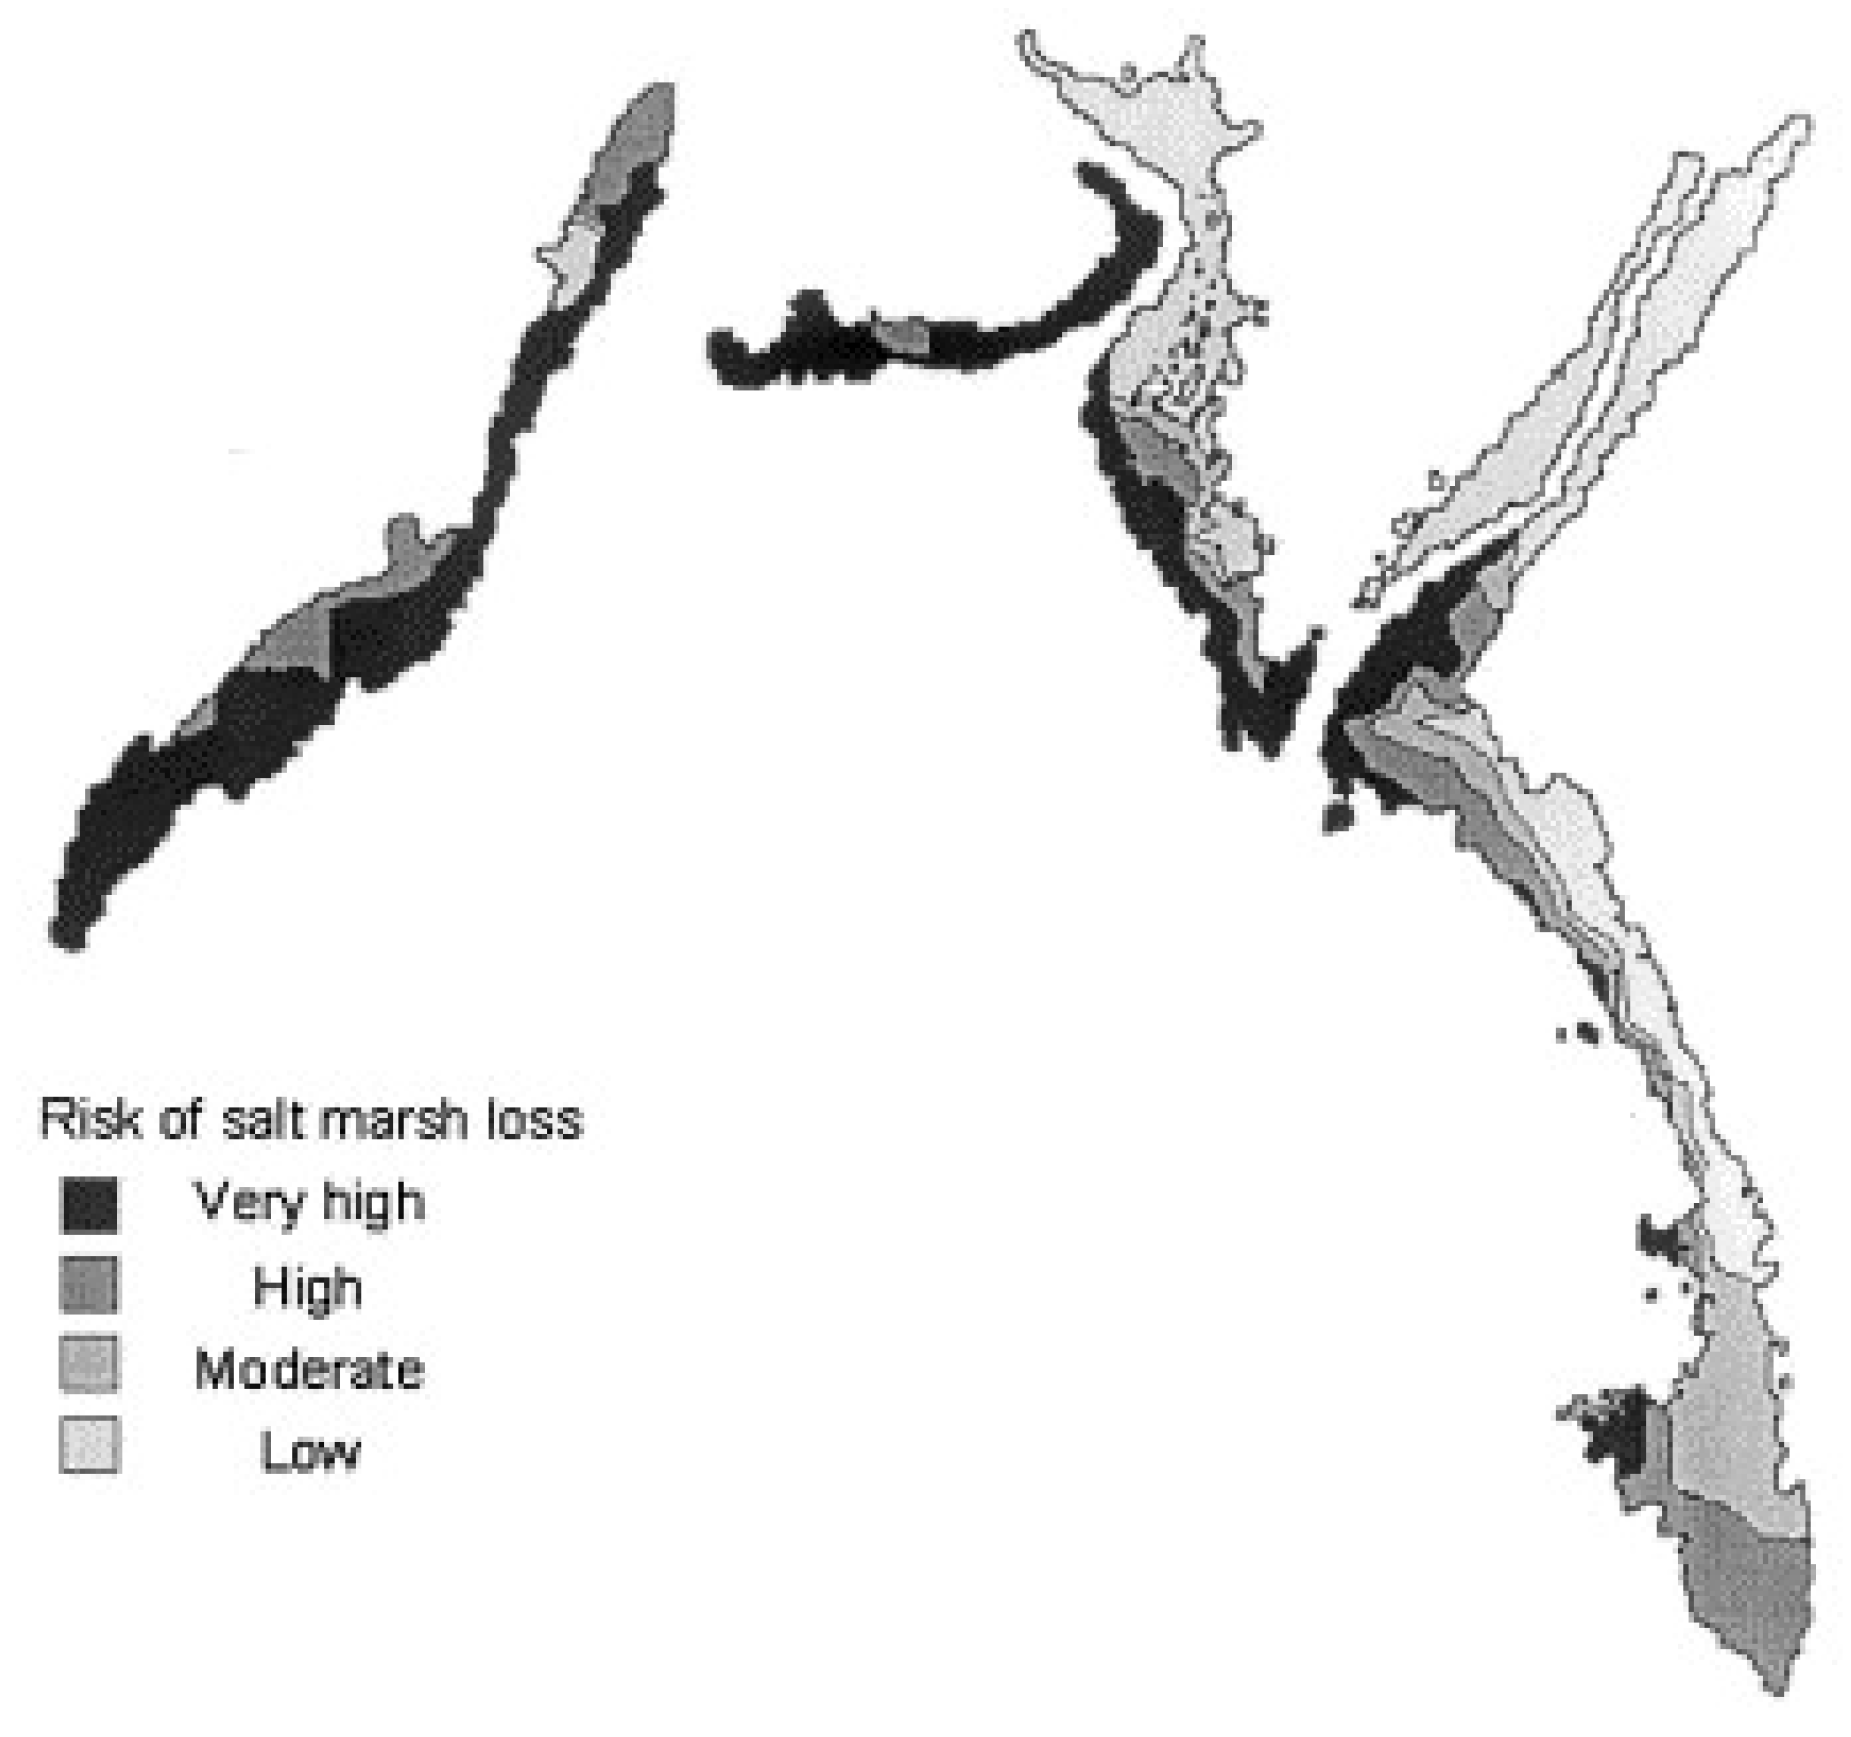
  56. Simas, T.; Nunes, J.P.; Ferreira, J.G. Effects of global climate change on coastal salt marshes. Ecol. Modell. 2001, 139, 1–15. [Google Scholar] [CrossRef]
  57. Simas, T.C.; Ferreira, J.G. Nutrient enrichment and the role of salt marshes in the Tagus estuary (Portugal). Estuar. Coast. Shelf Sci. 2007, 75, 393–407. [Google Scholar] [CrossRef]
  58. Silva, H.; Dias, J.M.; Caçador, I. Is the salt marsh vegetation a determining factor in the sedimentation processes? Hydrobiologia 2009, 621, 33–47. [Google Scholar] [CrossRef]
  59. Carmo, J.S.A. Near-shore sediment dynamics computation under the combined effects of waves and currents. Adv. Eng. Softw. 2002, 33, 37–48. [Google Scholar] [CrossRef] [Green Version]
  60. Braunschweig, F.; Martins, F.; Chambel, P.; Neves, R. A methodology to estimate renewal time scales in estuaries: the Tagus Estuary case. Ocean Dyn. 2003, 53, 137–145. [Google Scholar] [CrossRef]
  61. Braunschweig, F.; Leitao, P.C.; Fernandes, L.; Pina, P.; Neves, R.J.J. The object-oriented design of the integrated water modelling system MOHID. Dev. Water Sci. 2004, 55, 1079–1090. [Google Scholar]
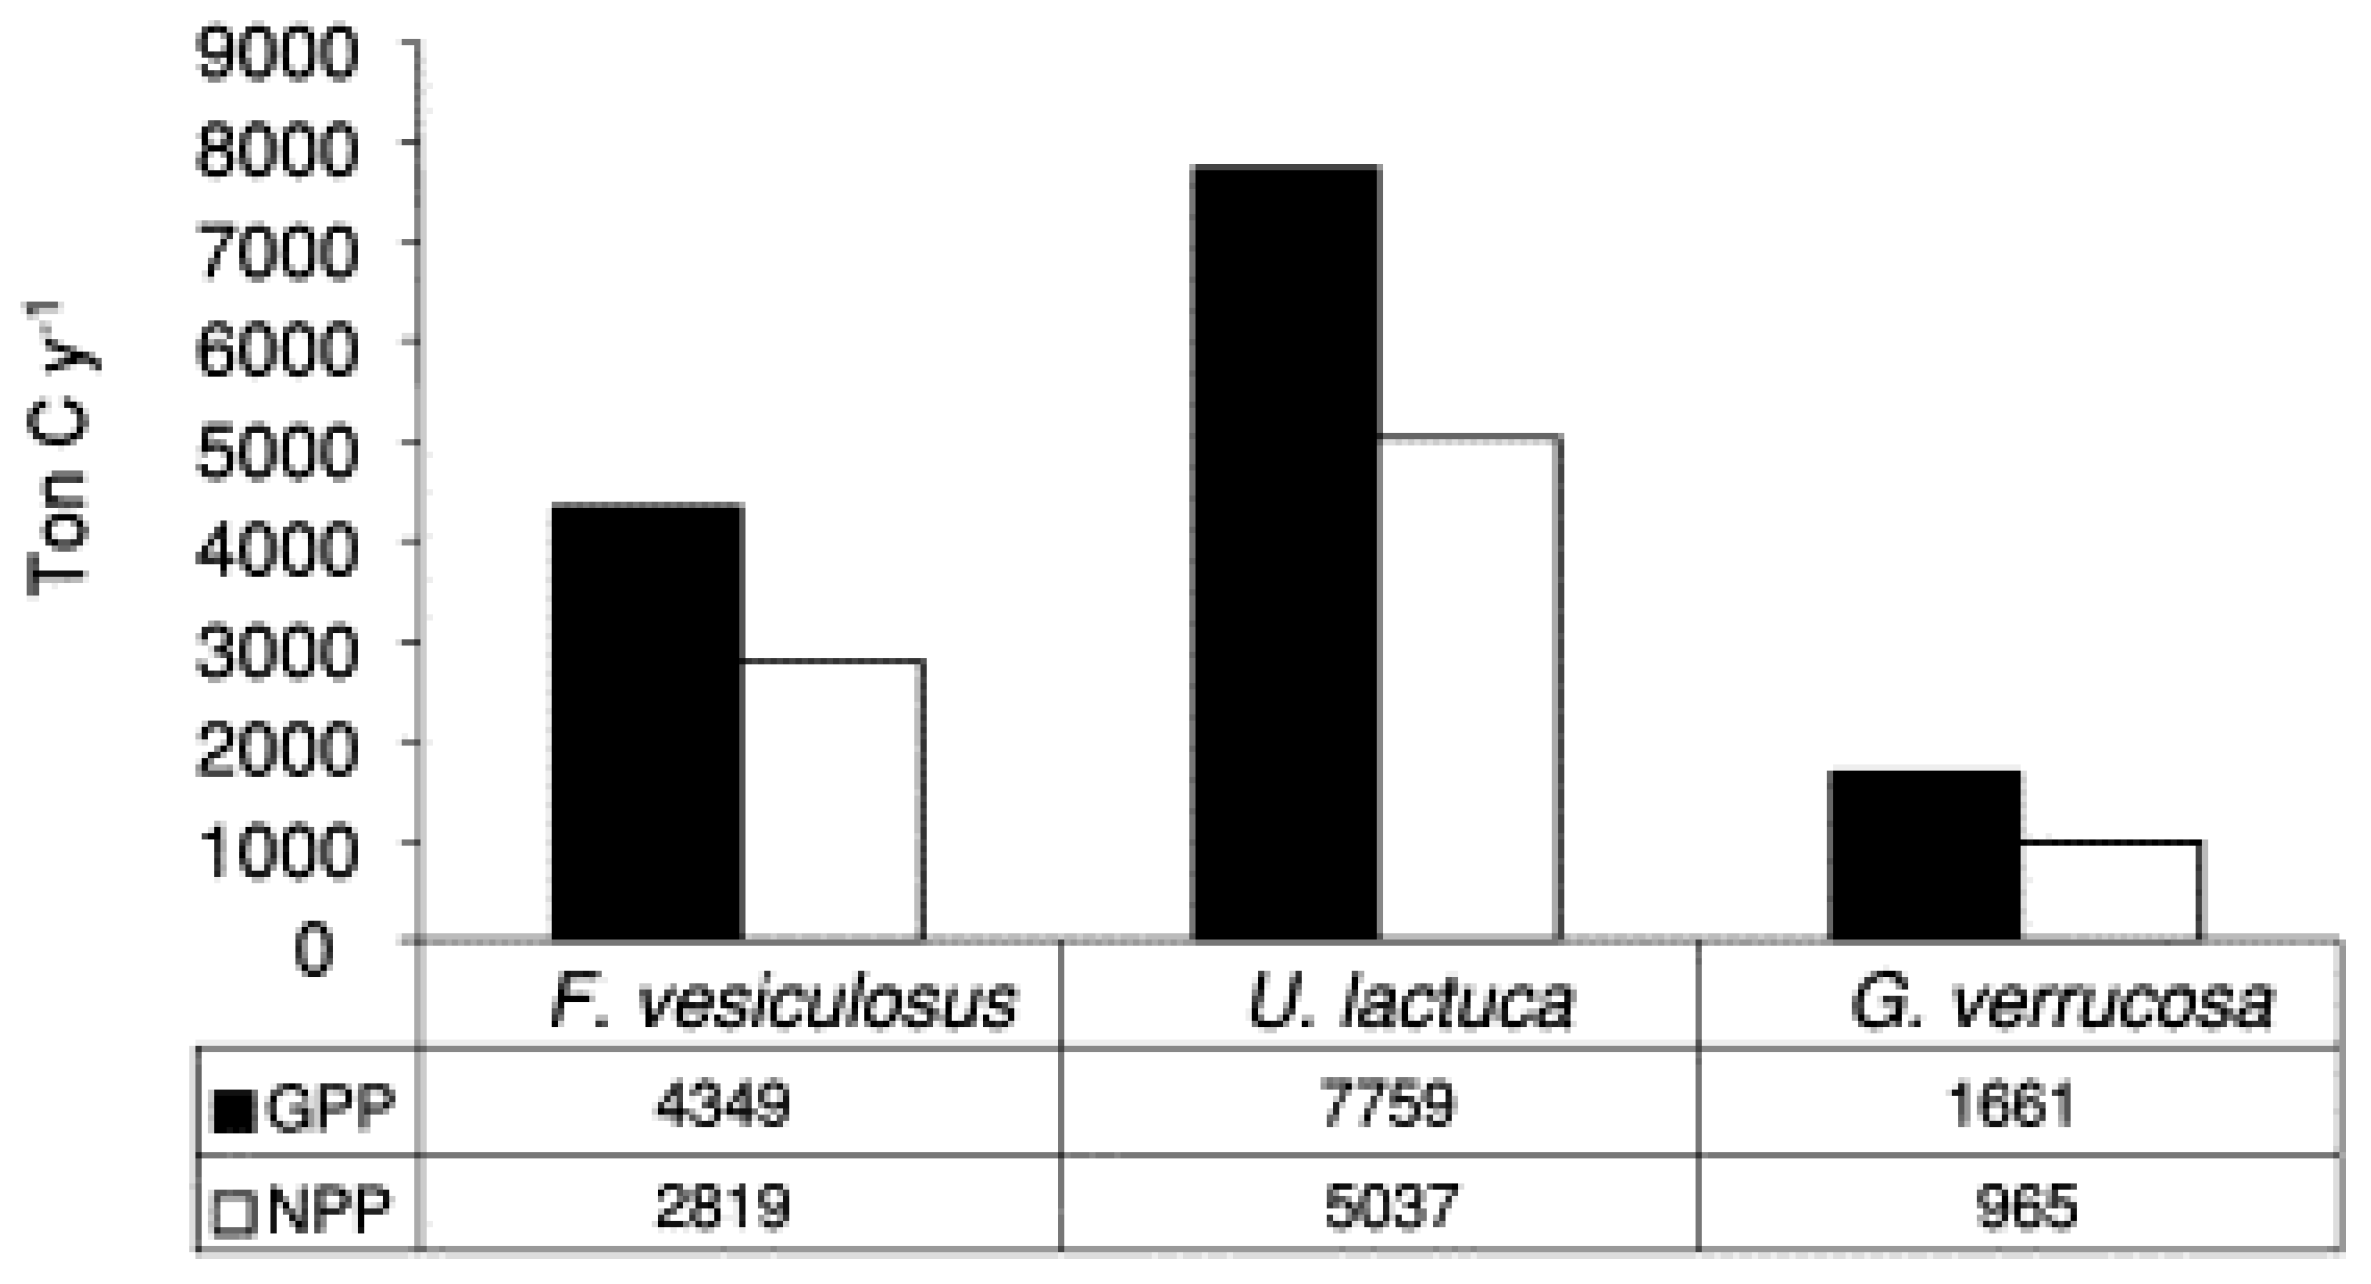
  62. Alvera-Azcárate, A.; Ferreira, J.G.; Nunes, J.P. Modelling eutrophication in mesotidal and macrotidal estuaries. The role of intertidal seaweeds. Estuar. Coast. Shelf Sci. 2003, 57, 715–724. [Google Scholar] [CrossRef]
  63. Saraiva, S.; Pina, P.; Martins, F.; Santos, M.; Braunschweig, F.; Neves, R. Modelling the influence of nutrient loads on Portuguese estuaries. Hydrobiologia 2007, 587, 5–18. [Google Scholar] [CrossRef]
  64. Mateus, M.; Neves, R. Evaluating light and nutrient limitation in the Tagus estuary using a process-oriented ecological model. J. Mar. Eng. Technol. 2008, 7, 43–54. [Google Scholar] [CrossRef]
  65. Rusu, L.; Bernardino, M.; Guedes Soares, C. Modelling the influence of currents on wave propagation at the entrance of the Tagus estuary. Ocean Eng. 2011, 38, 1174–1183. [Google Scholar] [CrossRef]
  66. Vaz, N.; Mateus, M.; Dias, J.M. Semidiurnal and spring-neap variations in the Tagus Estuary: Application of a process-oriented hydro-biogeochemical model. J. Coast. Res. 2011, SI 64, 1619–1623. [Google Scholar]
  67. Dias, J.M.; Valentim, J.M. Numerical modeling of Tagus estuary tidal dynamics. J. Coast. Res. SI 64 2011, 1495–1499. [Google Scholar]
  68. Dias, J.M.; Valentim, J.M.; Sousa, M.C. A numerical study of local variations in tidal regime of Tagus estuary, Portugal. PLoS ONE 2013, 8, e80450. [Google Scholar] [CrossRef]
  69. Valentim, J.M.; Vaz, N.; Silva, H.; Duarte, B.; Caçador, I.; Dias, J.M. Tagus estuary and Ria de Aveiro salt marsh dynamics and the impact of sea level rise. Estuar. Coast. Shelf Sci. 2013, 130, 138–151. [Google Scholar] [CrossRef]
  70. Valentim, J.M.; Vaz, L.; Vaz, N.; Silva, H.; Duarte, B.; Caçador, I.; Dias, J.M. Sea level rise impact in residual circulation in Tagus estuary and Ria de Aveiro lagoon. J. Coast. Res. 2013, 65, 1981–1986. [Google Scholar] [CrossRef]
  71. Guerreiro, M.; Fortunato, A.B.; Freire, P.; Rilo, A.; Taborda, R. Evolution of the hydrodynamics of the Tagus estuary (Portugal) in the 21 st century. J. Integr. Coast. Zo. Manag. 2015, 15, 65–80. [Google Scholar]
  72. Fortunato, A.B.; Freire, P.; Bertin, X.; Rodrigues, M.; Ferreira, J.; Liberato, M.L.R. A numerical study of the February 15, 1941 storm in the Tagus estuary. Cont. Shelf Res. 2017, 144, 50–64. [Google Scholar] [CrossRef]
  73. Mateus, M.; Oliveira, A.P. A numerical study of CO2 dynamics in the Tagus estuary. In Ocean Modelling for Coastal Management—Case Studies with MOHID; Mateus, M., Neves, R., Eds.; IST Press: Lisbon, Portugal, 2013; pp. 185–197. [Google Scholar]
  74. Pinto, L.; Mateus, M.; Ascione, I.; Franz, G.; Neves, R. Modelling mussel growth in Tagus estuary: A preliminary approach. In Ocean Modelling for Coastal Management—Case Studies with MOHID; Mateus, M., Neves, R., Eds.; IST Press: Lisbon, Portugal, 2013; pp. 175–183. [Google Scholar]
  75. de Pablo, H.; Brito, D.; Mateus, M.; Trancoso, A.R.; Campuzano, F.J.N.; Pinto, L.; Neves, R. An integration methodology to estimate water fluxes and constituents budgets in coastal area. In Ocean Modelling for Coastal Management: Case Studies with MOHID; Mateus, M., Neves, R., Eds.; IST Press: Lisbon, Portugal, 2013; ISBN 978-989-8481-24-5. [Google Scholar]
  76. Póvoa, P.; Nobre, A.; Leitão, P.; Galvão, P.; Santos, H.; Frazão, A.; Neves, R.; Matos, J.S. Operational decision support system for large combined sewage systems: Lisbon/Tagus estuary case study. Water Sci. Technol. 2015, 72, 1421–1427. [Google Scholar] [CrossRef] [PubMed]
  77. Oliveira, A.P.; Mateus, M.D.; Cabeçadas, G.; Neves, R. Water-air CO2 fluxes in the Tagus estuary plume (Portugal) during two distinct winter episodes. Carbon Balance Manag. 2015, 10, 2. [Google Scholar] [CrossRef] [Green Version]
  78. Franz, G.; Pinto, L.; Ascione, I.; Mateus, M.; Fernandes, R.; Leitão, P.; Neves, R. Modelling of cohesive sediment dynamics in tidal estuarine systems: Case study of Tagus estuary, Portugal. Estuar. Coast. Shelf Sci. 2014, 151, 34–44. [Google Scholar] [CrossRef]
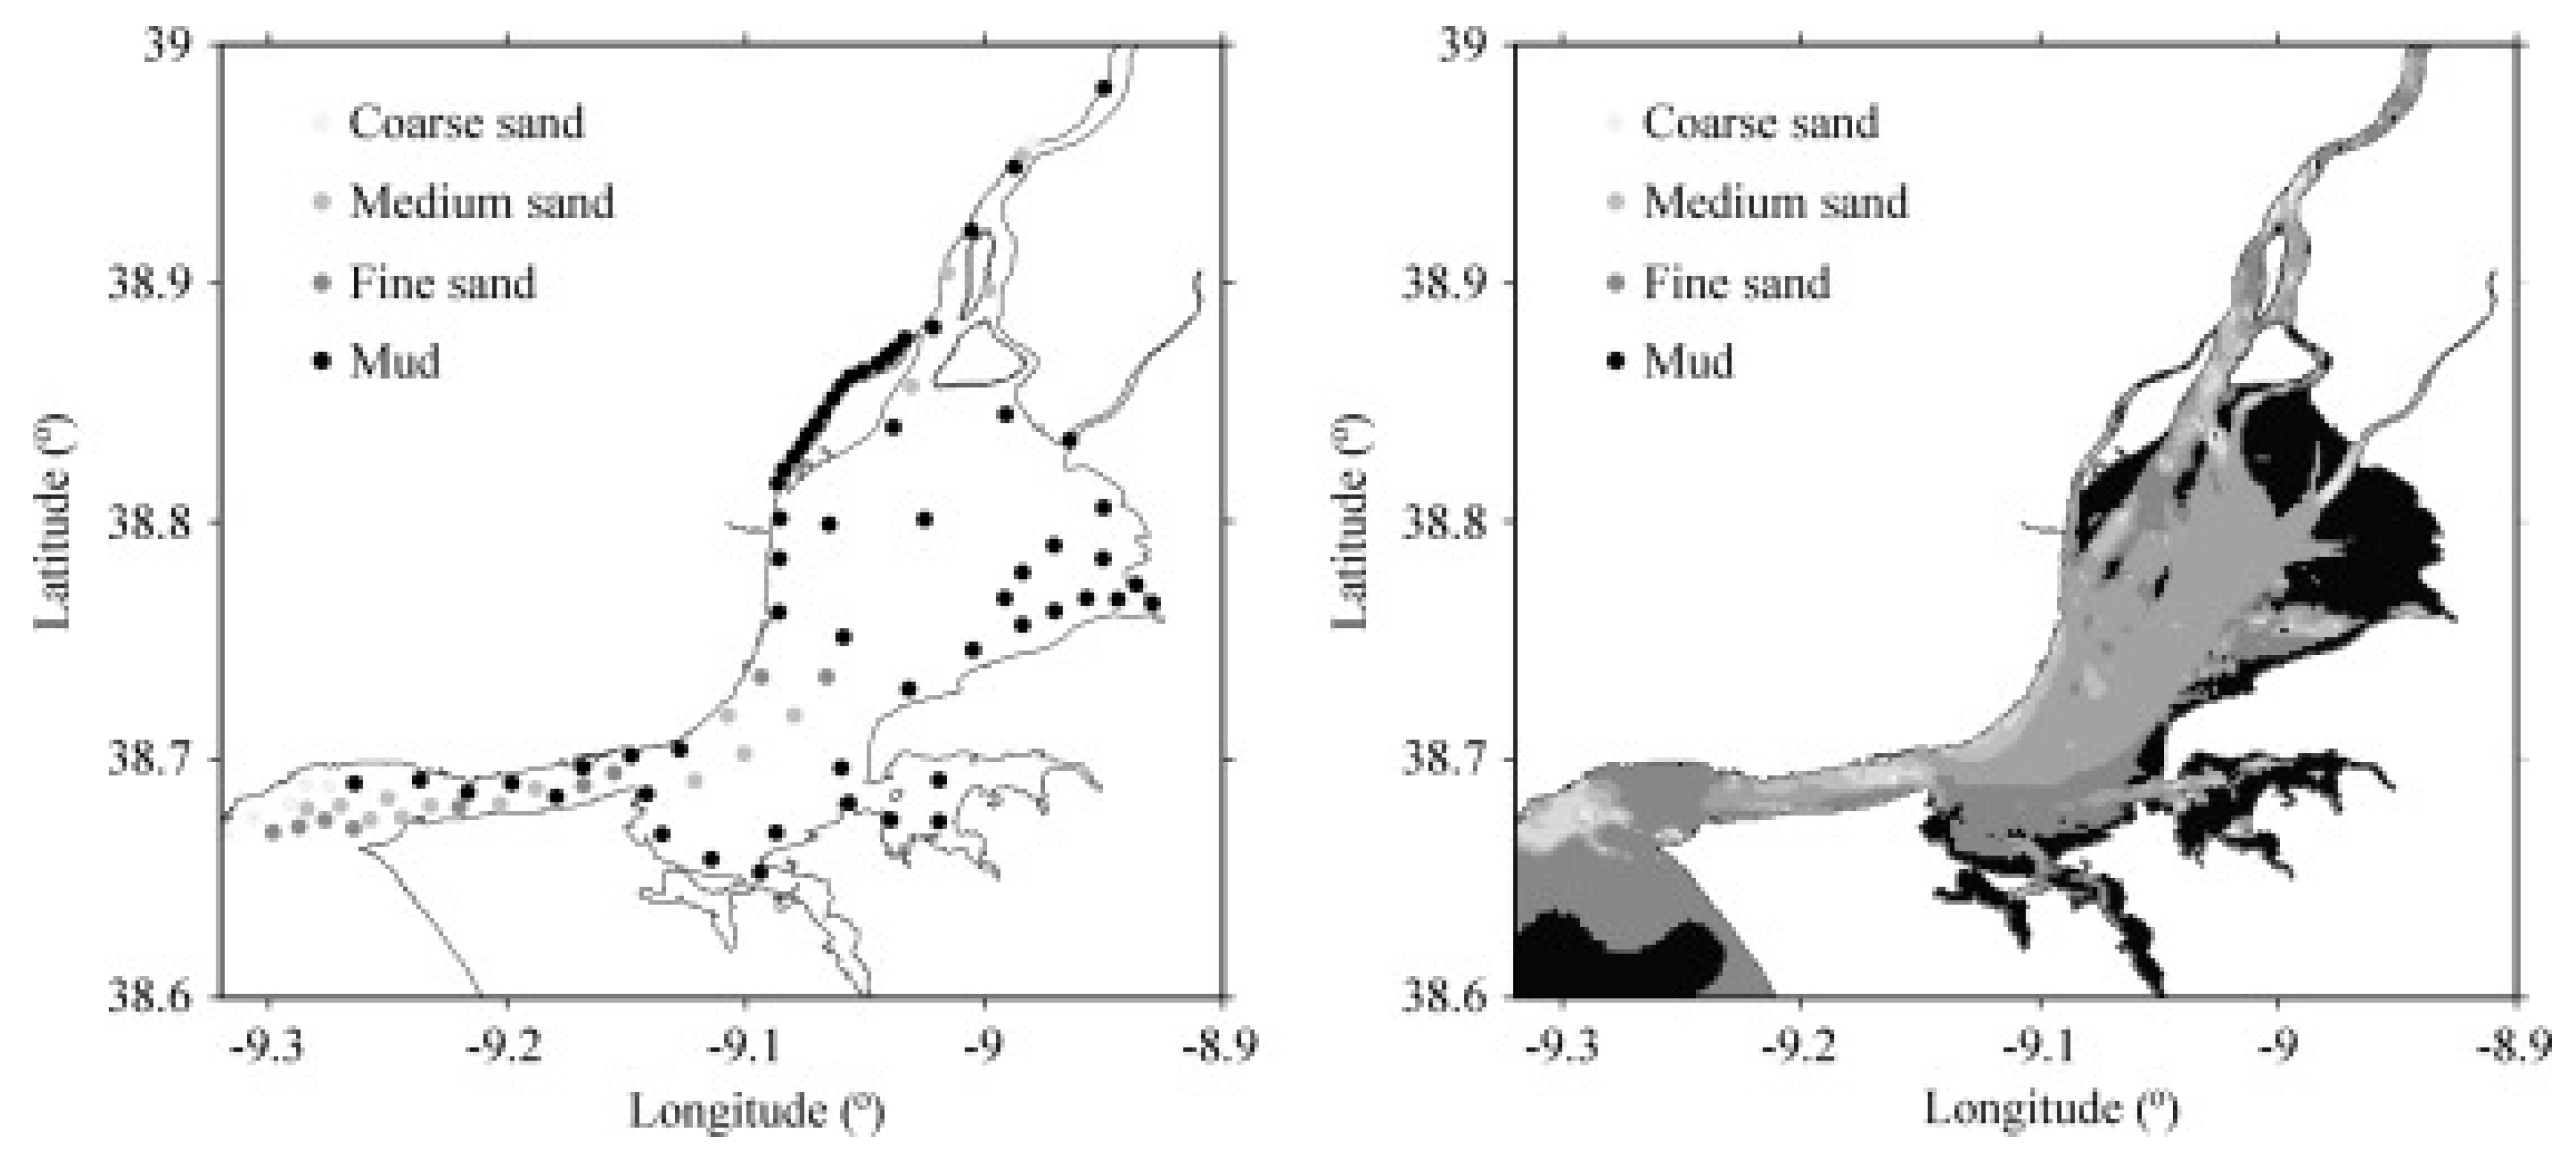
  79. Franz, G.; Leitão, P.; Pinto, L.; Jauch, E.; Fernandes, L.; Neves, R. Development and validation of a morphological model for multiple sediment classes. Int. J. Sediment Res. 2017, 32, 585–596. [Google Scholar] [CrossRef]
  80. França, S.; Vasconcelos, R.P.; Fonseca, V.F.; Tanner, S.E.; Reis-Santos, P.; Costa, M.J.; Cabral, H.N. Predicting fish community properties within estuaries: Influence of habitat type and other environmental features. Estuar. Coast. Shelf Sci. 2012, 107, 22–31. [Google Scholar] [CrossRef]
  81. Fonseca, V.F.; Neill, W.H.; Miller, J.M.; Cabral, H.N. Ecophys.Fish perspectives on growth of juvenile soles, Solea solea and Solea senegalensis, in the Tagus estuary, Portugal. J. Sea Res. 2010, 64, 118–124. [Google Scholar] [CrossRef]
  82. Vasconcelos, R.P.; Reis-Santos, P.; Maia, A.; Fonseca, V.; França, S.; Wouters, N.; Costa, M.J.; Cabral, H.N. Nursery use patterns of commercially important marine fish species in estuarine systems along the Portuguese coast. Estuar. Coast. Shelf Sci. 2010, 86, 613–624. [Google Scholar] [CrossRef]
  83. França, S.; Cabral, H.N. Predicting fish species richness in estuaries: Which modelling technique to use? Environ. Model. Softw. 2015, 66, 17–26. [Google Scholar] [CrossRef]
  84. França, S.; Cabral, H.N. Predicting fish species distribution in estuaries: Influence of species’ ecology in model accuracy. Estuar. Coast. Shelf Sci. 2016, 180, 11–20. [Google Scholar] [CrossRef]
  85. Duarte, B.; Vaz, N.; Valentim, J.M.; Dias, J.M.; Silva, H.; Marques, J.C.; Sleimi, N.; Caçador, I. Revisiting the outwelling hypothesis: Modelling salt marsh detrital metal exports under extreme climatic events. Mar. Chem. 2017, 191, 24–33. [Google Scholar] [CrossRef]
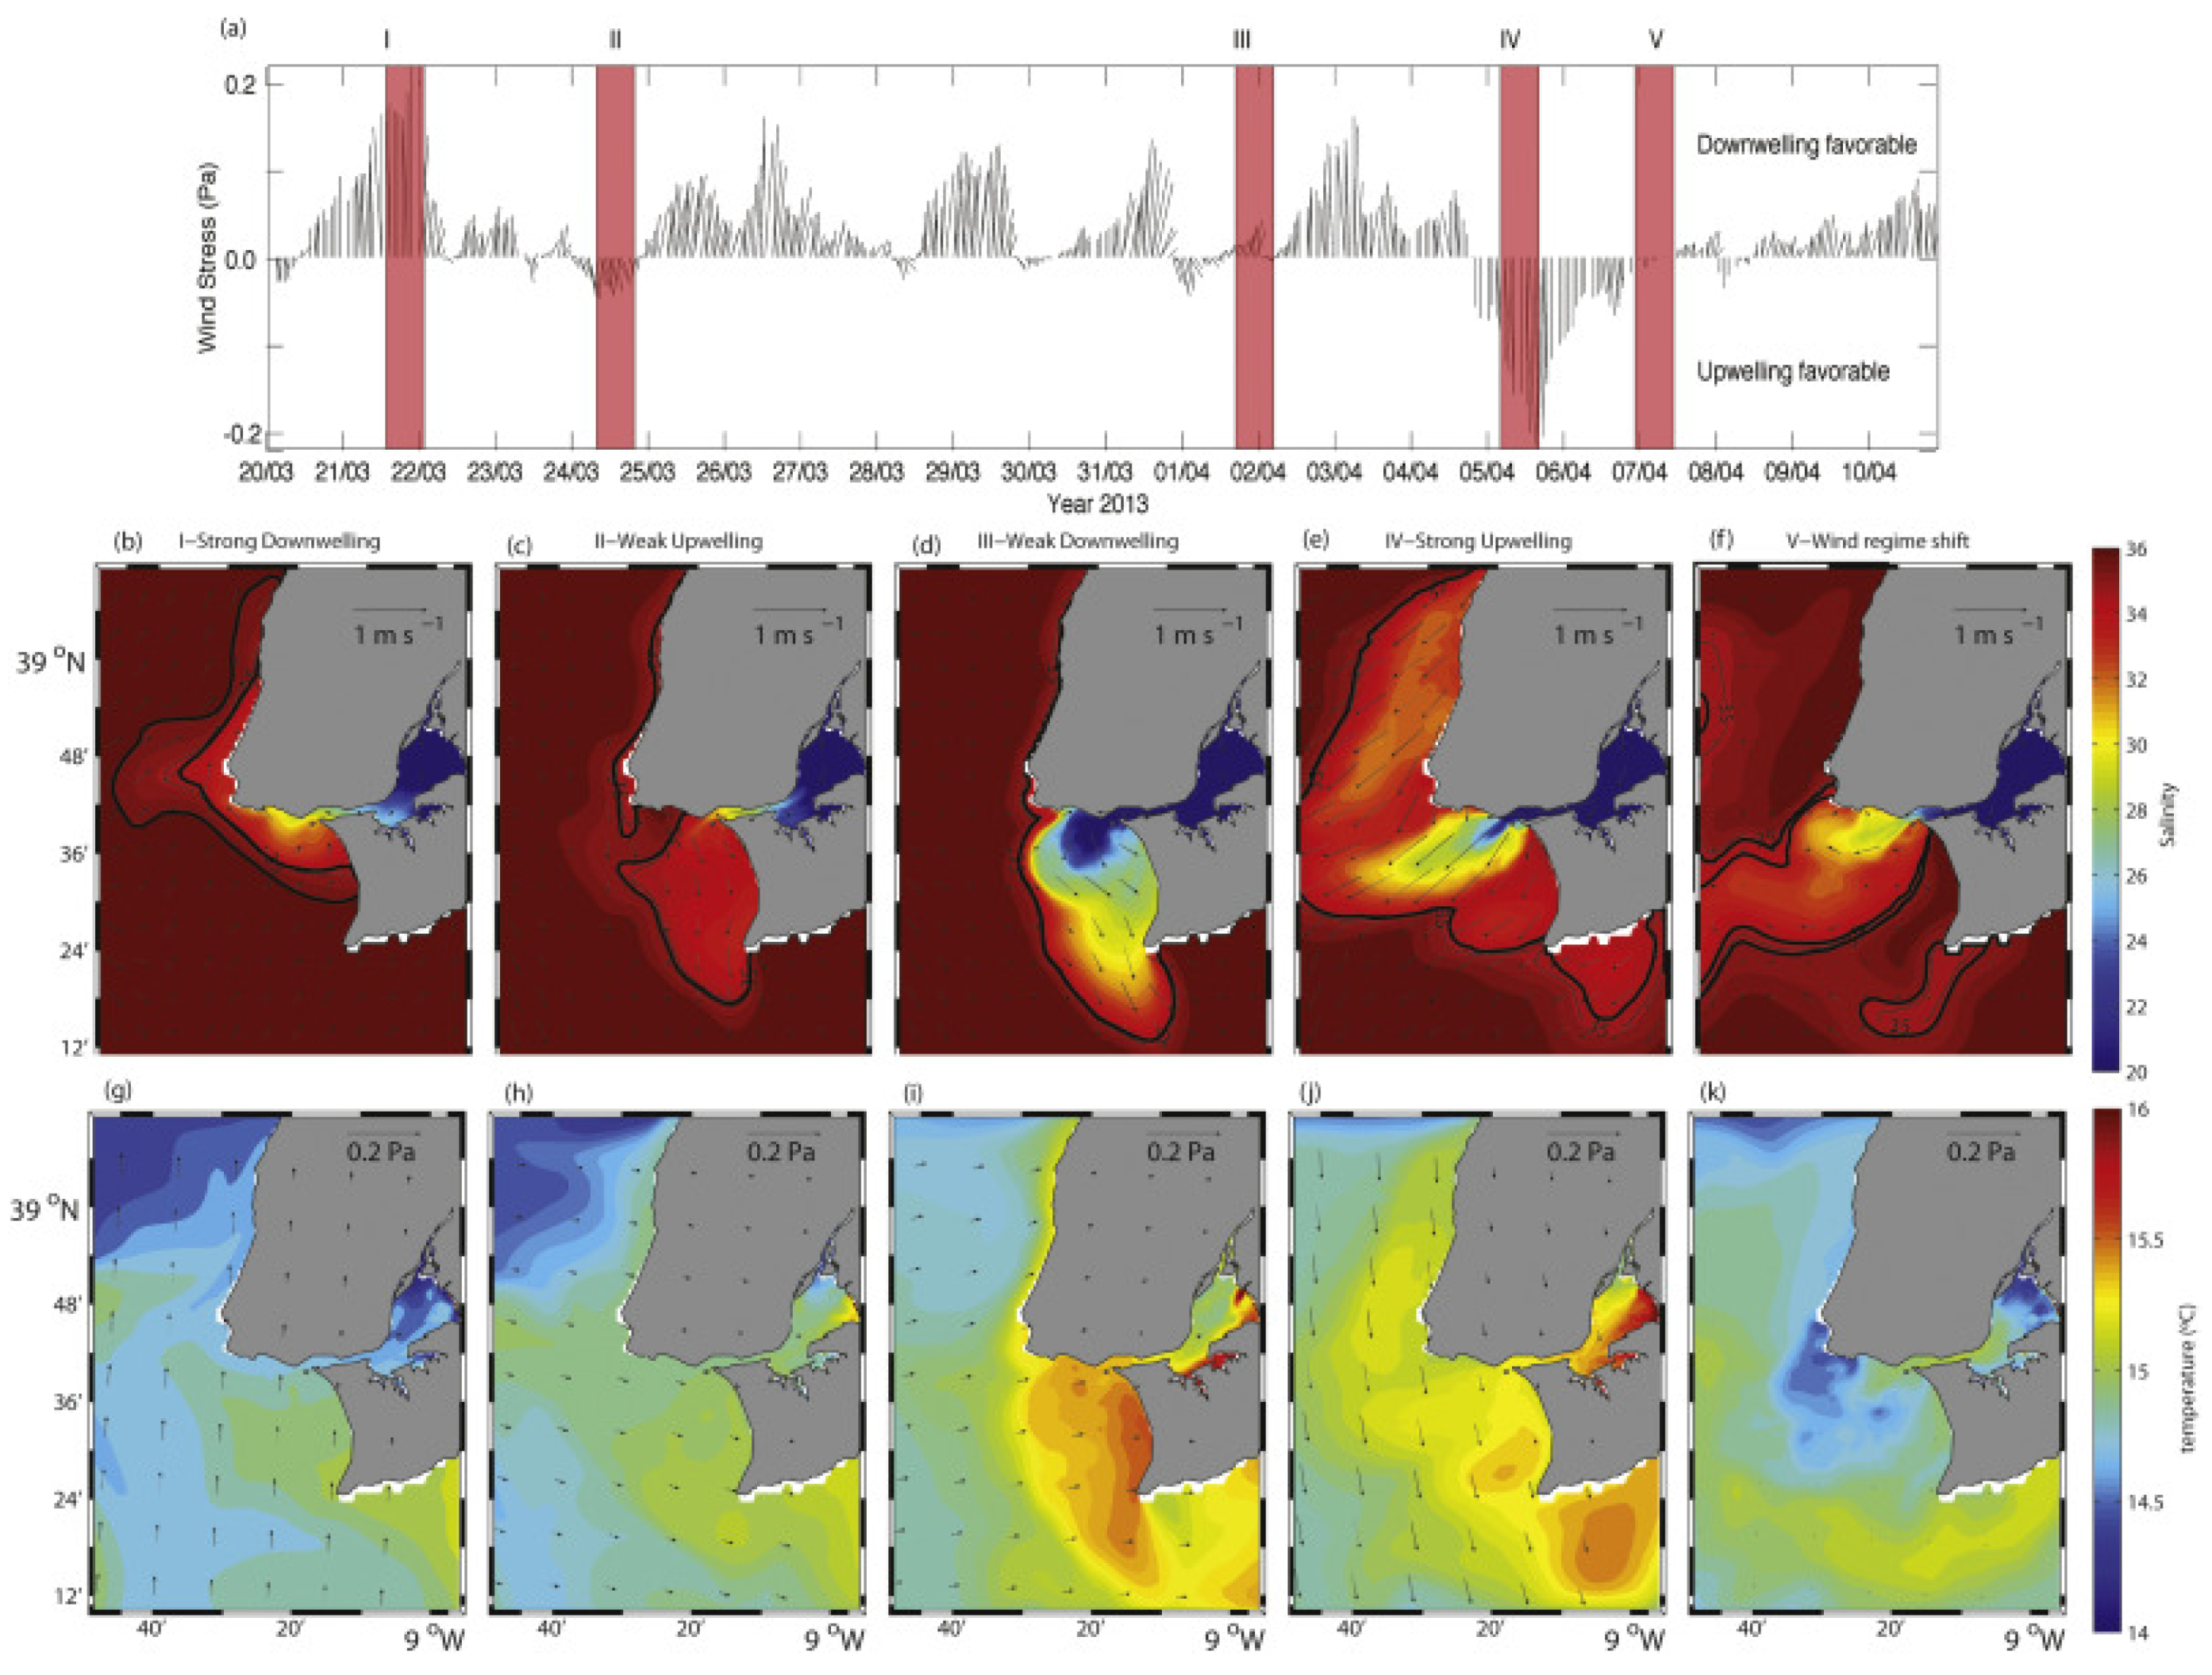
  86. Vaz, N.; Rodrigues, J.G.; Mateus, M.; Franz, G.; Campuzano, F.; Neves, R.; Dias, J.M. Subtidal variability of the Tagus river plume in winter 2013. Sci. Total Environ. 2018, 627, 1353–1362. [Google Scholar] [CrossRef] [PubMed]
  87. Antunes, C.; Taborda, R. Sea level at Cascais tide gauge: data, analysis and results. J. Coast. Res. 2009, 56 (SI), 218–222. [Google Scholar]
  88. de Pablo, H.; Sobrinho, J.; Garcia, M.; Campuzano, F.; Juliano, M.; Neves, R. Validation of the 3D-MOHID Hydrodynamic Model for the Tagus Coastal Area. Water 2019, 11, 1713. [Google Scholar] [CrossRef] [Green Version]
  89. Rodrigues, M.; Fortunato, A.B.; Freire, P. Saltwater intrusion in the upper Tagus Estuary during droughts. Geosciences 2019, 9, 400. [Google Scholar] [CrossRef] [Green Version]
  90. Dias, J.A.; Taborda, R. Evolução recente do nível médio do mar em Portugal. An. do Inst. Hidrográfico 1988, 9, 83–97. [Google Scholar]
  91. Lopes, C.L.; Silva, P.A.; Dias, J.M.; Rocha, A.; Picado, A.; Plecha, S.; Fortunato, A.B. Local sea level change scenarios for the end of the 21st century and potential physical impacts in the lower Ria de Aveiro (Portugal). Cont. Shelf Res. 2011, 31, 1515–1526. [Google Scholar] [CrossRef]
  92. Pethick, J. Coastal management and sea-level rise. CATENA 2001, 42, 307–322. [Google Scholar] [CrossRef]
  93. Statham, P.J. Nutrients in estuaries—An overview and the potential impacts of climate change. Sci. Total Environ. 2012, 434, 213–227. [Google Scholar] [CrossRef]
  94. Pereira, S.C.; Marta-Almeida, M.; Carvalho, A.C.; Rocha, A. Heat wave and cold spell changes in Iberia for a future climate scenario. Int. J. Climatol. 2017, 37, 5192–5205. [Google Scholar] [CrossRef] [Green Version]
  95. Vaz, N.; Vaz, L.; Serôdio, J.; Dias, J.M. A modeling study of light extinction due to cohesive sediments in a shallow coastal lagoon under well mixed conditions. Sci. Total Environ. 2019, 694, 133707. [Google Scholar] [CrossRef] [PubMed]
Figure 1. Location of the Tagus Estuary and nearby coastal waters. The bathymetry of the Tagus Estuary is also depicted using meters above the local datum (color figure). The sections depicted in Figure 2 are represented as black lines.
Geosciences 10 00004 g001
Figure 2. Observations of stratification in three locations inside the Tagus Estuary. The regions are: Estuary Corridor (Left Panel), North margin (Middle panel) and South margin (right panel) (Adapted from [18]).
Geosciences 10 00004 g002
Figure 3. Sketch of the transport pathways inside the estuary. In black is depicted the theoretical river discharge effect and in grey is depicted the wind effect on the transport pathways. (Adapted from [19])
Geosciences 10 00004 g003
Figure 4. (a) surface currents during ebb and (b) during flood. Entrainment eddies form on both sides of the tidal jet. adapted from [20]).
Geosciences 10 00004 g004
Figure 5. Results of the risk assessment for the losses in salt marsh areas within the Tagus Estuary (Adpated from From [52]).
Geosciences 10 00004 g005
Figure 6. Total annual seaweed production for the Tagus Estuary, estimated by the model proposed by Alvera-Azcárate et al. (From [58]).
Geosciences 10 00004 g006
Figure 7. Variation of the wave parameters due to the presence of currents (current vectors—white arrows): significant wave height (a) and mean wave period fields (b) for the peak ebb tide situation from 2003/12/19; significant wave height (c) and mean wave period fields (d) for the peak flood tide situation from 2003/12/19. (From [65]).
Geosciences 10 00004 g007
Figure 8. Spatial distribution of nutrients along the estuary-coastal continuum of the Tagus Estuary (from [69]).
Geosciences 10 00004 g008
Figure 9. Sediment distribution in the Tagus Estuary. In situ data (left) and model results (right) after a warm-up run in which sediment fractions were distributed according to the local hydrodynamic conditions. (adapted from [80])
Geosciences 10 00004 g009
Figure 10. (a) Wind stress for the vicinity of the Tagus Estuary mouth; (b–f) daily, mean surface salinity, superimposed on surface velocity; (g–k) surface water temperature superimposed on wind stress; Maps show the results for 21/03, 24/03, 02/04, 05/04 and 07/04, indicated by the bars (I, II, III, IV and V). These days correspond to strong downwelling favorable winds, weak upwelling favorable winds, weak downwelling favorable winds, strong upwelling favorable winds and shift between wind regimes, respectively. (from [87])
Geosciences 10 00004 g010
Table 1. Statistics for the Tagus Estuary (compiled from Pinto and Kondolf [15] and references therein).
Lisbon Metropolitan Area
Population2,821, 876
Total area3002 km2
Population Density940 per km2
Tagus Estuary
Water surface at high tide area320 km2
Mudflats area152 km2
Low marsh area4.4 km2
Salt ponds area<1 km2
Mean tidal range2.4 m
Mean tidal prism7.5 × 108 m3
Tagus Basin
Catchment area80,629 km2
Annual average unimpaired flow into estuary17,004 hm3
Average annual flow into estuary~12,500 hm3
Average annual sediment influx into estuary1–5 × 10⁶ metric ton/year
Table 2. Examples of estuarine and coastal models developed and implemented to study hydro-biogeochemical features. Adapted from [49]. C—Coastal, R—Regional; FV—Finite Volume: FE—Finite Elements.
ModelCitationC/R(FV)/(FE)Vertical Coordinate
ADCIRChttps://adcirc.org/CFESigma
COAWSThttps://www.usgs.gov/software/coupled-ocean-atmosphere-wave-sediment-transport-coawst-modeling-systemC/RFVSigma
Delft3DOss.deltares.nl/web/delft3d/homeCFVSigma
ECOM/POMhttp://www.ccpo.odu.edu/POMWEB/C/RFVSigma
FVCOMhttp://fvcom.smast.umassd.edu/C/RFVSigma
GETMhttps://getm.eu/CFVSigma/adaptive
MARS3Dhttps://wwz.ifremer.fr/mars3dC/RFVSigma
MITgcmhttp://mitgcm.org/C/RFVZ
MOHIDhttp://www.mohid.com/C/RFVSigma/adaptive
ROMShttps://www.myroms.org/RFVSigma
SCHISMhttp://ccrm.vims.edu/schismweb/C/RFV/FEZ/Sigma
SELFEhttp://www.stccmop.org/knowledge_transfer/software/selfeCFV/FEZ/Sigma
SHYFEMhttps://www.cmcc.it/models/shyfem-shallow-water-hydrodynamic-finite-element-modelCFEZ/Sigma
SUNTANShttps://github.com/ofringer/suntansCFVZ

