Genome-Wide Association Study in Mexican Holstein Cattle Reveals Novel Quantitative Trait Loci Regions and Confirms Mapped Loci for Resistance to Bovine Tuberculosis

 , , , , ,
Simple Summary
Abstract
1. Introduction
2. Materials and Methods
2.1. Tissue Samples
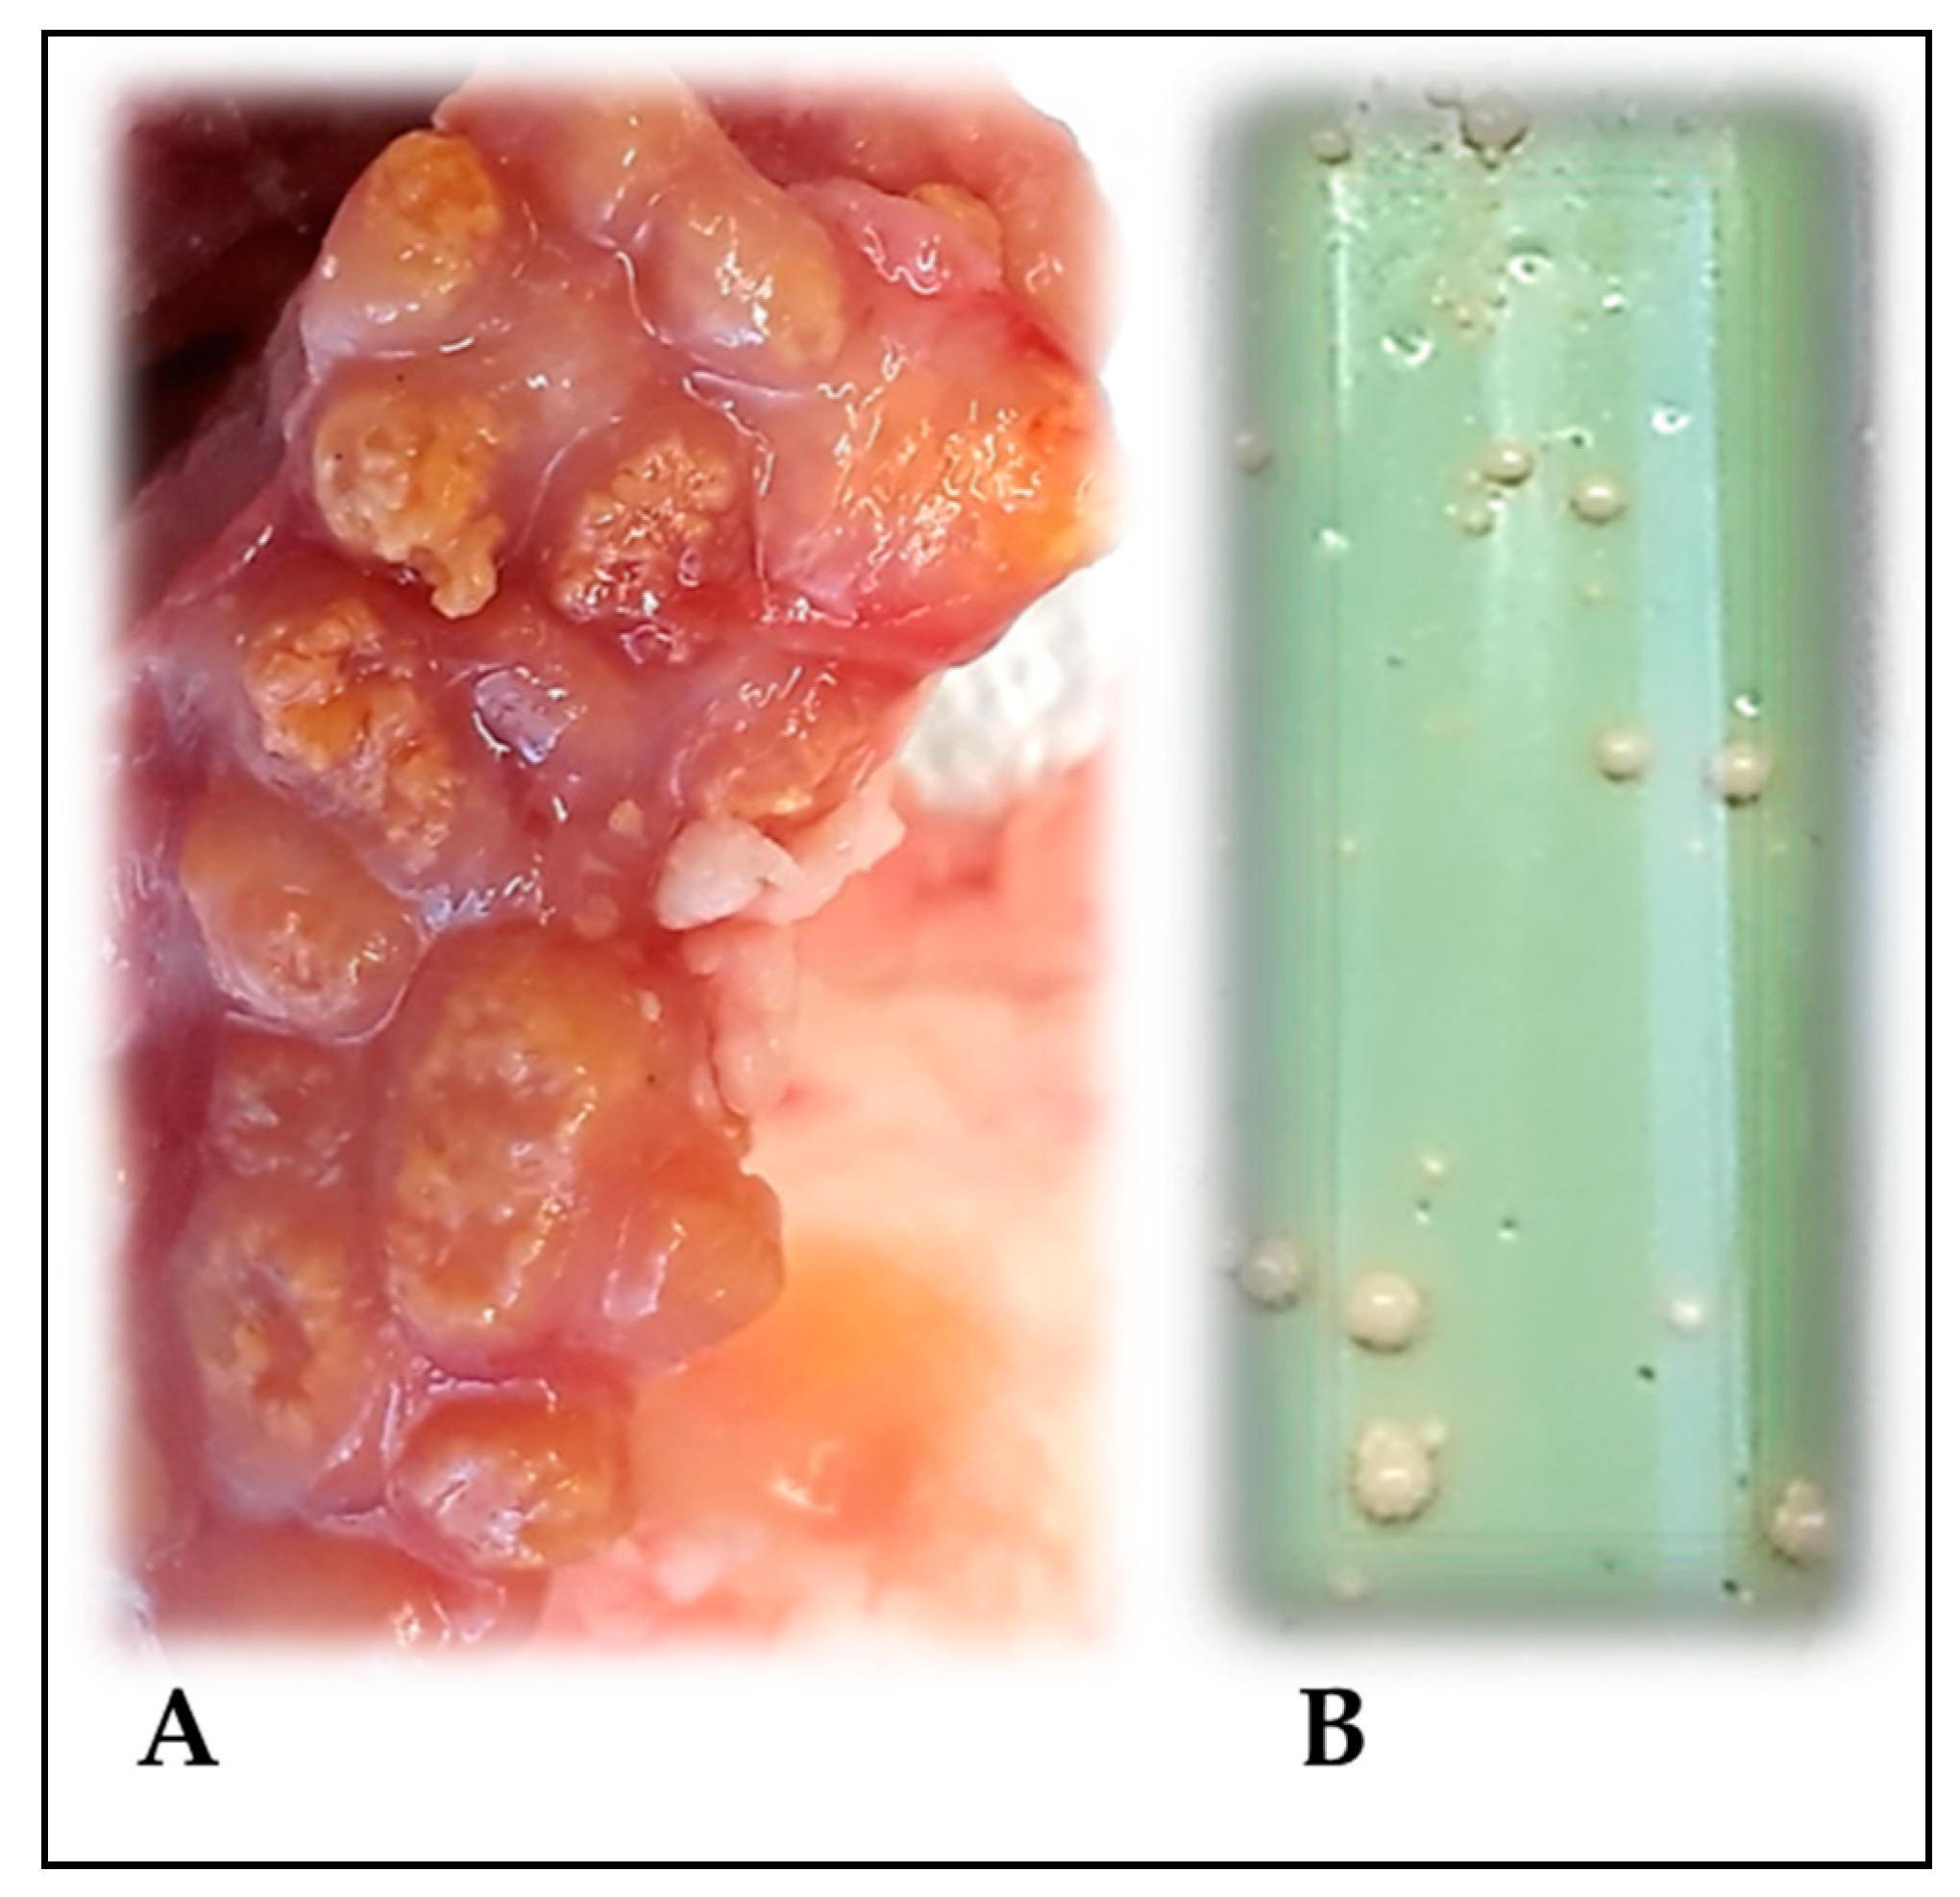
2.2. Bacteriological Analysis
2.3. Experimental Design, DNA Extraction, Pooling and Genotyping
2.4. Statistical Analysis of Pool
2.5. Quantitative Trait Loci Region Definition
2.6. Functional Annotation of the QTLR
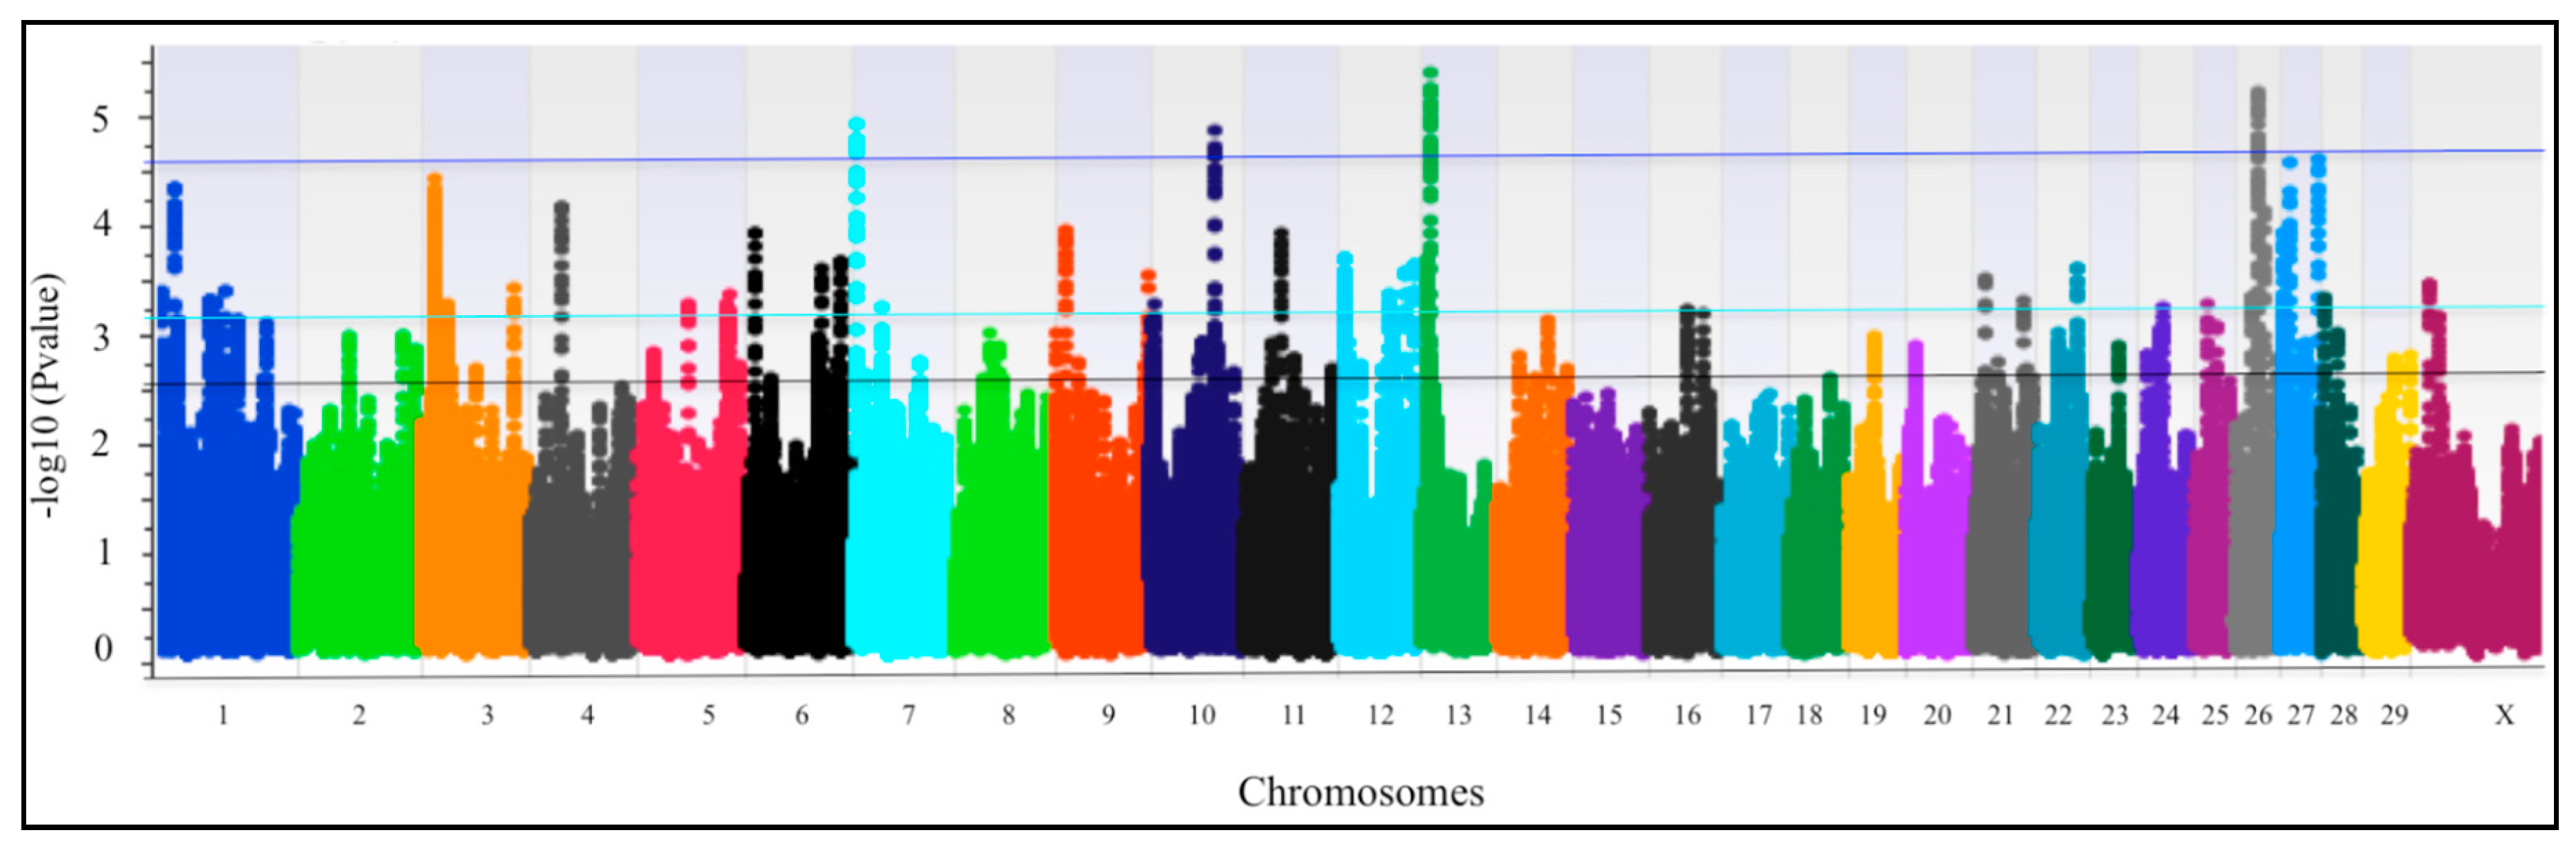
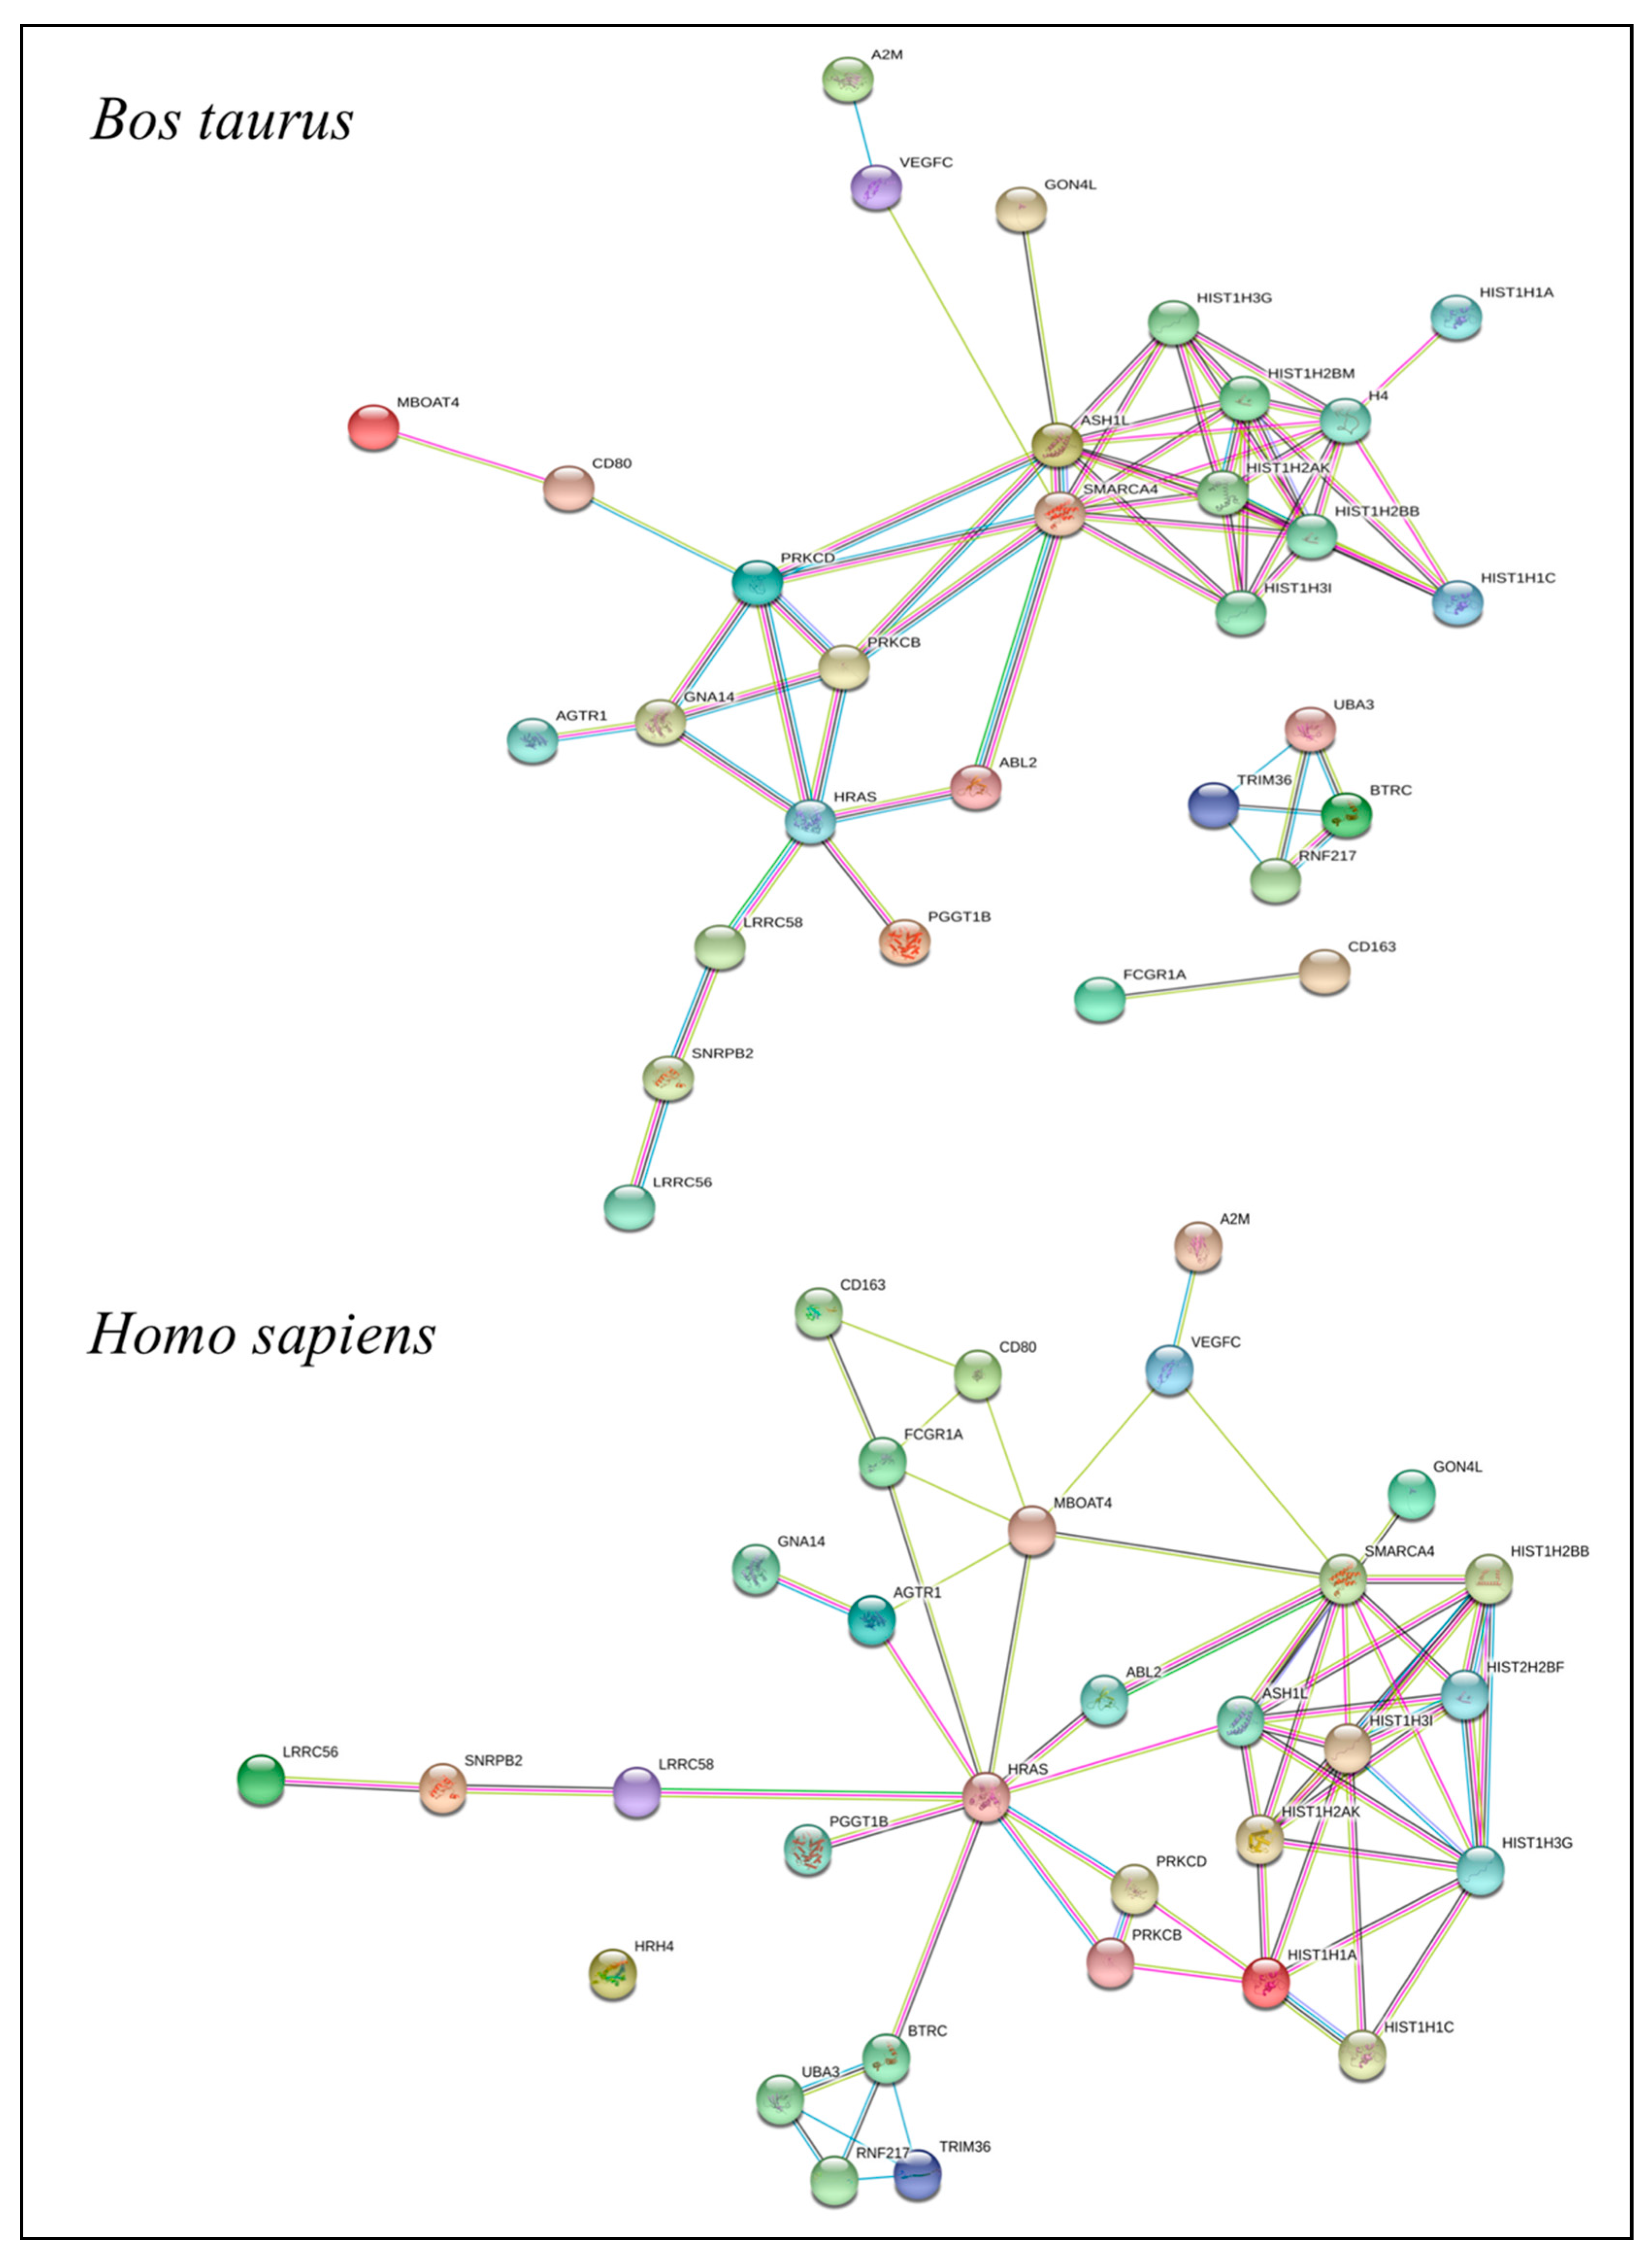
3. Results
QTLRs Associated with Resistance/Susceptibility to bTB
4. Discussion
4.1. QTLR_1%_PFP
4.2. QTLR_5%_PFP
4.2.1. BTA 1
4.2.2. BTA 3
4.2.3. BTA 5
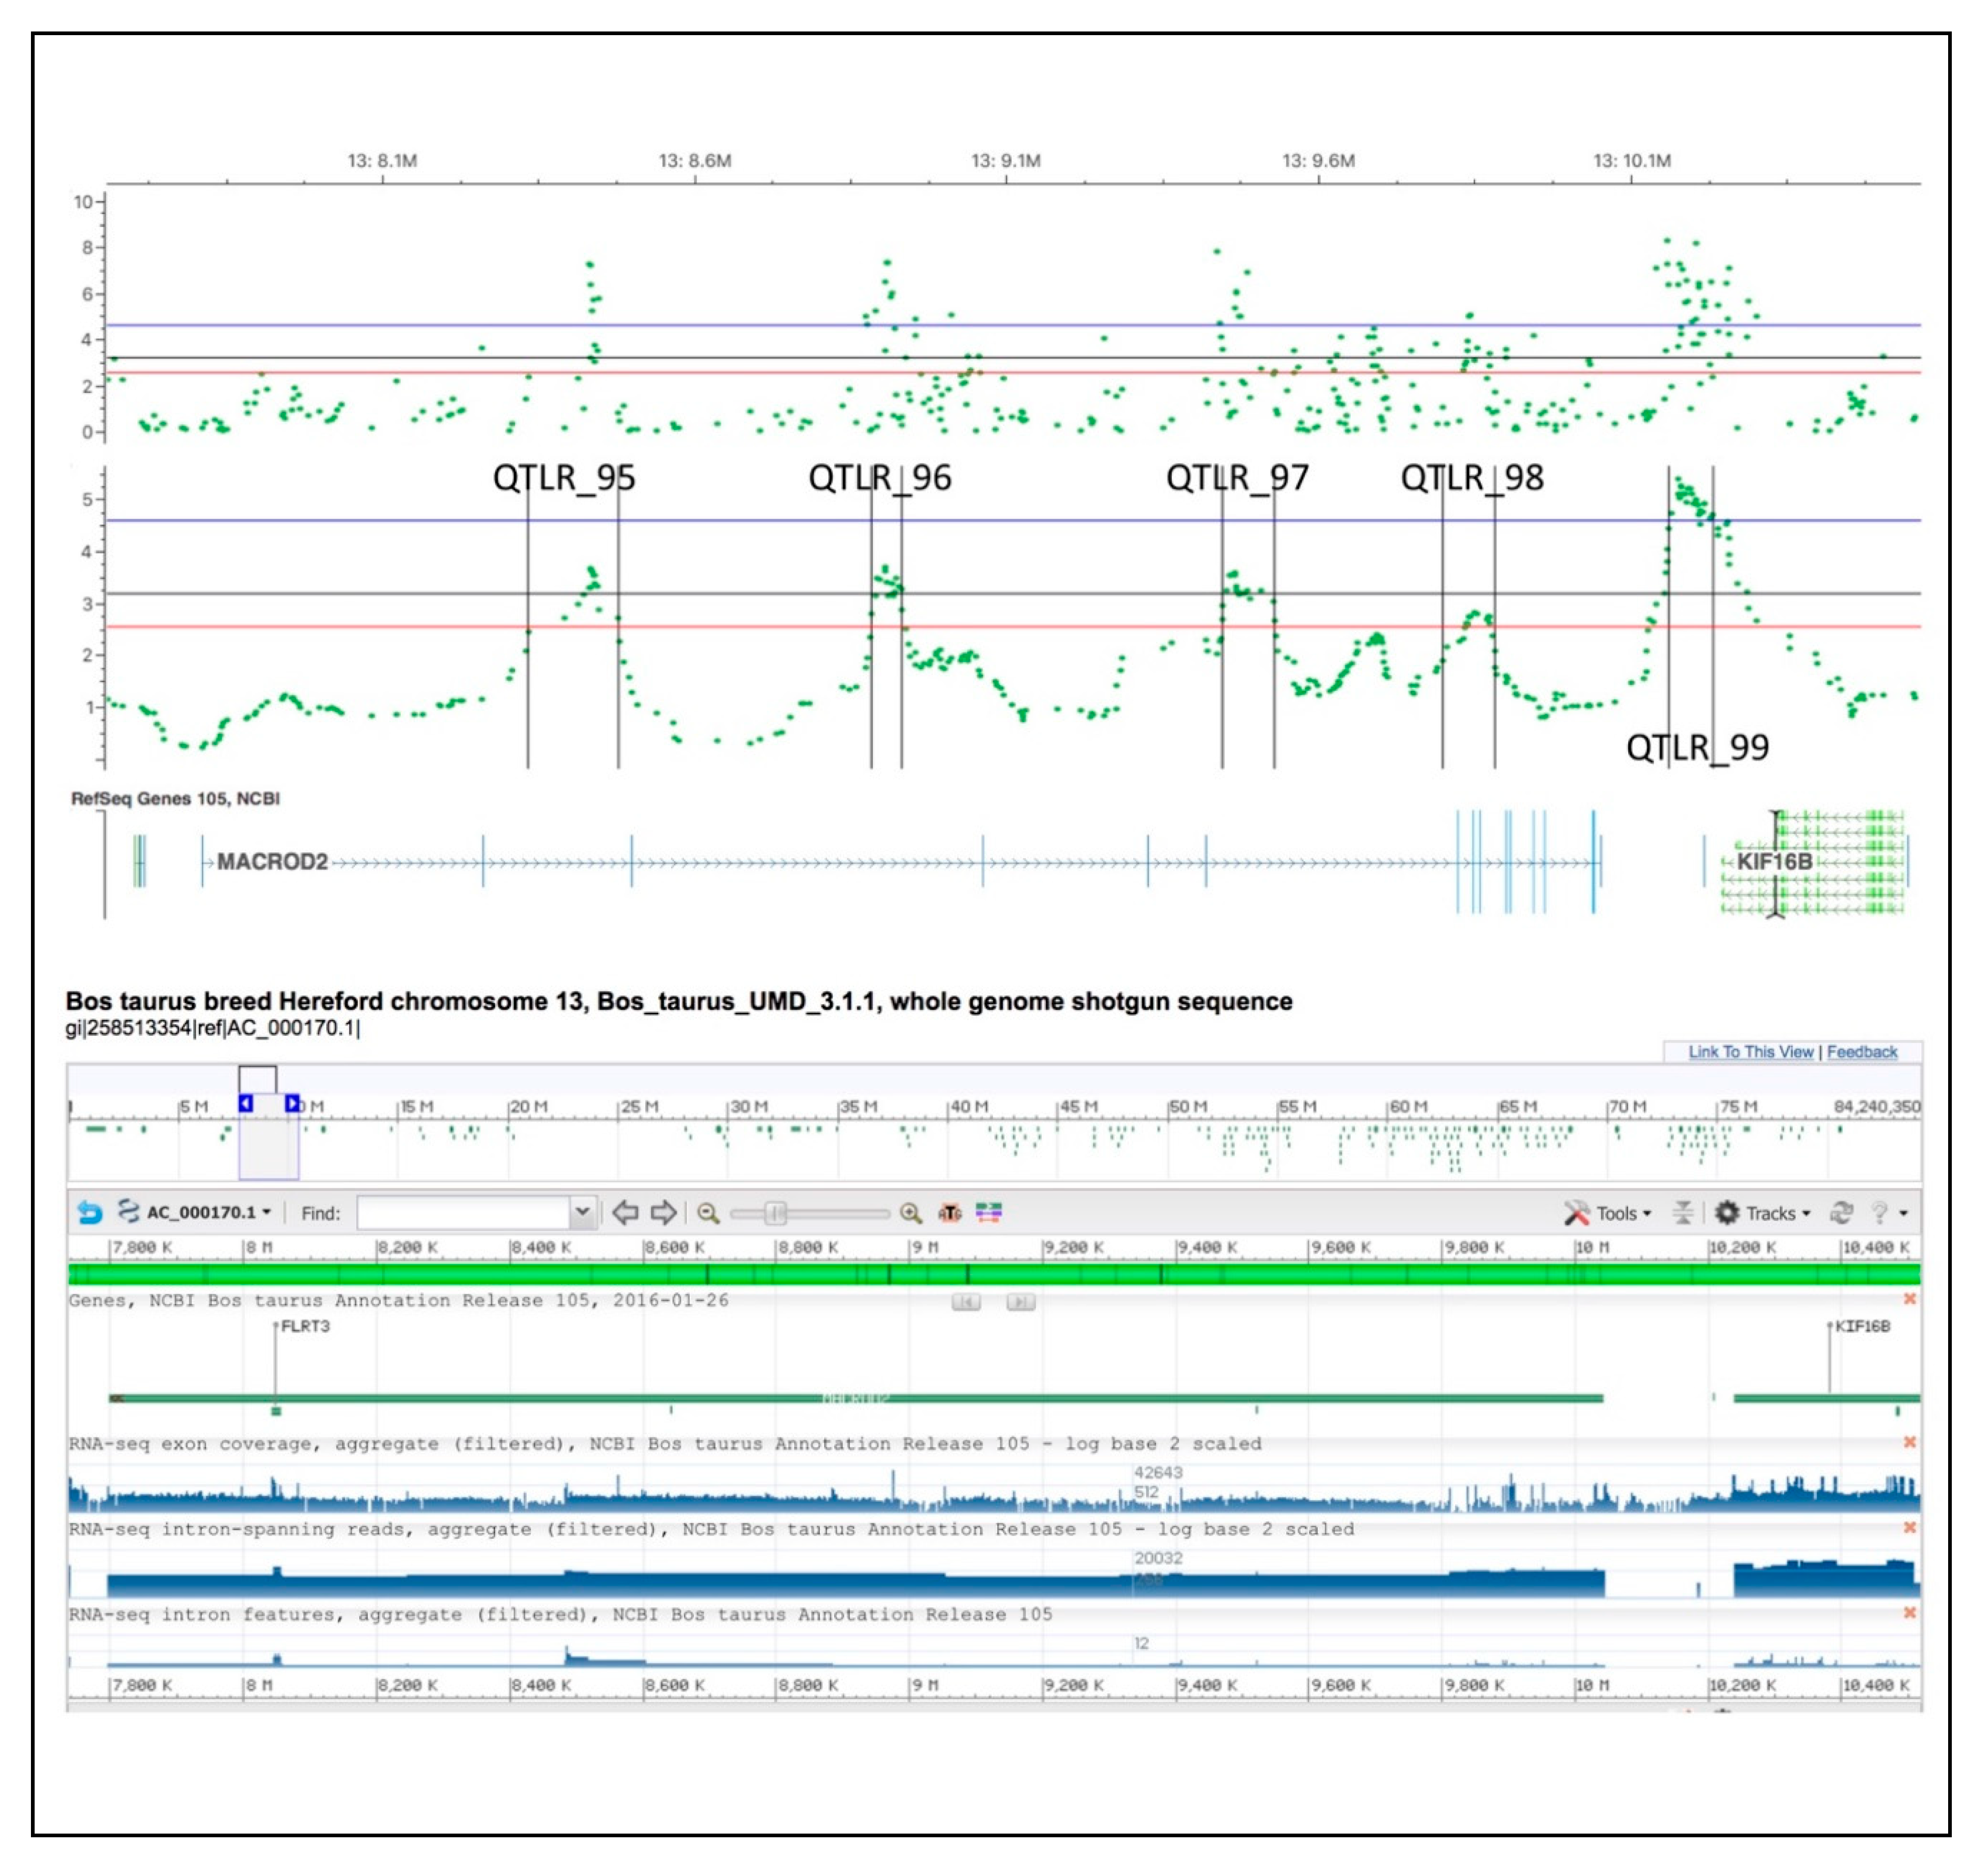
4.2.4. BTA 13
4.3. QTLR_10%_PFP
BTA 2
- Cathepsins, including Cathepsin S (CTSS) are proteolytic enzymes that function mainly in lysosomes, where they contribute to pathogen killing by their involvement in antigen presentation pathways. Pires et al. [59] demonstrated the role of this class of proteins in the control of M. tuberculosis by manipulating the cathepsin expression by pathogenic mycobacteria to favor its intracellular survival.
- The protein encoded by the CD80 gene (CD80 molecule), the B-lymphocyte activation antigen B7-1 is a membrane receptor that affects the immunological reactivity of T-lymphocytes when its expression decreases. In addition, CD80 has a role in enhancing the anti-tuberculosis immunity [60].
- The FCGR1A gene (Fc fragment of IgG receptor Ia) expression, together with that of the BLR1 gene has been considered as potential marker for monitoring the extent of TB disease and to predict treatment outcome in children affected by M. tuberculosis [61].
- Booty et al. [62] reported that the cytokine IL-21, produced predominantly by activated CD4+ T cells and CD8+ T cells, is an essential signaling marker for host resistance to M. tuberculosis infection via the IL-21 receptor (IL-21R).
- Gomes-Pereira et al. [63] reported an increased susceptibility to M. avium in Hemochromatosis Protein HFE-Deficient Mice. HEF (homeostatic iron regulator) is a fundamental protein involved in the regulation of cellular iron uptake and iron homeostasis. Studies indicate that monocytes with mutated HFE have decreased intracellular iron levels [64]. Also, Wang at el. [65] demonstrated that hemochromatosis impacts the regulation of macrophage cytokine translation and, consequently the inflammatory response.
- The ANO9 gene, also known as TMEM16J (anoctamin 9), together with the SIGIRR and the PKP3 genes constitute a polymorphic complex associated with susceptibility to tuberculosis [66]. The SIGIRR gene, also known as Toll IL-1 receptor 8, is a regulatory protein acting to inhibit ILRs and TLRs signaling [67]. The PKP3, the third part of this complex gene, maps 6.2 Kb from the end of the QTLR_152.
5. Conclusions
Supplementary Materials
Author Contributions
Funding
Acknowledgments
Conflicts of Interest
References
- Phillips, C.J.C.; Foster, C.R.W.; Morris, P.A.; Teverson, R. The transmission of Mycobacterium bovis infection to cattle. Res. Vet. Sci. 2003, 74, 1–15. [Google Scholar] [CrossRef]
- Abalos, P.; Retamal, P. Tuberculosis: Una zoonosis re-Emergente? Rev. Sci. 2004, 23, 583–594. [Google Scholar] [CrossRef]
- Blischak, J.D.; Tailleux, L.; Mitrano, A.; Barreiro, L.B.; Gilad, Y. Mycobacterial infection induces a specific human innate immune response. Sci. Rep. 2015, 5, 16882. [Google Scholar] [CrossRef] [PubMed]
- Mûller, B.; Hity, M.; Berg, S.; García-Pelayo, M.C.; Dale, J.; Boschiroli, M.L.; Cadmus, S.; Ngandolo, B.N.; Godreuil, S.; Diguimbaye-Djaibé, C.; et al. African 1, an epidemiologically important clonal complex of Mycobacterium bovis dominant in Mali, Nigeria, Cameroon and Chad. J. Bacteriol. 2009, 191, 1951–1960. [Google Scholar] [CrossRef] [PubMed]
- Olea-Popelka, F.; Muwonge, A.; Perera, A.; Dean, A.S.; Mumford, E.; Erlacher-Vindel, E.; Forcella, S.; Silk, B.J.; Ditiu, L.; El Idrissi, A. Zoonotic tuberculosis in human beings caused by Mycobacterium bovis a call for action. Lancet Infect. Dis. 2017, 17, 21–25. [Google Scholar] [CrossRef]
- Perea-Razo, C.A.; Milián-Suazo, F.; Bárcenas-Reyes, I.; Sosa-Gallegos, S.; Rodríguez-Hernández, E.; Flores-Villalba, S.; Canto-Alarcón, G.J. Whole genome sequencing for detection of zoonotic tuberculosis in Querétaro, Mexico. J. Infect. Dis. Prev. Med. 2017, 5, 2. [Google Scholar] [CrossRef]
- Milián-Suazo, F.; Pérez-Guerrero, L.; Arriaga-Díaz, C.; Romero-Torres, C.; Escartín-Chávez, M. Epidemiología molecular de las tuberculosis bovina y humana en una zona endémica de Querétaro, México. Salub Publ. Mex. 2008, 50, 1–6. [Google Scholar]
- Elias, K.; Hussein, D.; Asseged, B.; Wondwossen, T.; Gebeyehu, M. Status of bovine tuberculosis in Addis Ababa dairy farms. Rev. Sci. Tech. 2008, 27, 915–923. [Google Scholar] [CrossRef]
- Perry, B.D.; Randolph, T.F.; McDermott, J.J.; Sones, K.R.; Thornton, P.K. Investing in Animal Health Research to Alleviate Poverty; ILRI (International Livestock Research Institute): Nairobi, Kenya, 2002. [Google Scholar]
- De la Rua-Domenech, R.; Goodchild, A.T.; Vordermeier, M.; Hewinson, R.G.; Christiansen, K.H.; Clifton-Hadley, R.S. Ante mortem diagnosis of tuberculosis in cattle: A review of the tuberculin tests. C-interferon assay and other ancillary diagnostic techniques. Res. Vet. Sci. 2006, 81, 190–210. [Google Scholar] [CrossRef]
- Uren, C.; Henn, B.M.; Franke, A.; Wittig, M.; van Helden, P.D.; Hoal, E.G.; Möller, M. A post-GWAS analysis of predicted regulatory s and tuberculosis susceptibility. PLoS ONE 2017, 12. [Google Scholar] [CrossRef]
- Allen, A.R.; Minozzi, G.; Glass, E.J.; Skuce, R.A.; McDowell, S.W.J.; Woolliams, J.A.; Bischop, S.C. Bovine tuberculosis: The genetic basis of host susceptibility. Proc. Biol. Sci. 2010, 277, 2737–2745. [Google Scholar] [CrossRef] [PubMed]
- Hernández-Marín, J.A.; Cortez-Romero, C.; Clemente-Sánchez, F.; Gallegos-Sánchez, J.; Salazar-Ortiz, J.; Tarango-Arámbula, L.A. Risk of transmission of Mycobacterium avium subspecies paratuberculosis (Map) in domestic and wild species. AGRO Prod. 2014, 7, 65–70. [Google Scholar]
- Bermingham, M.L.; More, S.J.; Good, M.; Cromie, A.R.; Higgins, I.M.; Berry, D.P. Genetic correlations between measures of Mycobacterium bovis infection and economically important traits in Irish Holstein–Friesian dairy cows. J. Dairy Sci. 2010, 93, 5413–5422. [Google Scholar] [CrossRef] [PubMed]
- Brotherstone, S.; White, I.M.S.; Coffey, M.; Downs, S.H.; Mitchell, A.P.; Clfton-Hadley, R.S.; More, S.J.; Good, M.; Woolliams, J.A. Evidence of genetic resistance of cattle to infection with Mycobacterium bovis. J. Dairy Sci. 2010, 93, 1234–1242. [Google Scholar] [CrossRef] [PubMed]
- Carmichael, J. Bovine tuberculosis in the tropics with special reference to Uganda. Part 1. Vet. J. 1941, 97, 329–339. [Google Scholar]
- Ameni, G.; Aseffa, A.; Engers, H.; Young, D.; Gordon, S.; Hewinson, G.; Vordermeier, M. High prevalence and increased severity of pathology of bovine tuberculosis in Holsteins compared to Zebu breeds under field cattle husbandry in central Ethiopia. Clin. Vaccine Immunol. 2007, 14, 1356–1361. [Google Scholar] [CrossRef]
- Kadarmideen, H.N.; Ali, A.A.; Thomson, P.C.; Mûller, B.; Zinsstag, J. Polymorphisms of the SLC11A1 gene and resistance to bovine tuberculosis in African Zebu cattle. Anim. Genet. 2011, 42, 656–658. [Google Scholar] [CrossRef]
- Sun, L.; Song, Y.; Ria, H.; Yang, H.; Hua, G.; Guo, A.; Yang, L. Polymorphisms in Toll-Like receptor 1 and 9 genes and their association with tuberculosis susceptibility in Chinese Holstein cattle. Vet. Immunol. Immunopathol. 2012, 147, 195–201. [Google Scholar] [CrossRef]
- Richardson, I.A.; Berry, D.P.; Wiencko, H.L.; Higgins, I.M.; More, S.J.; McClure, J.; Lynn, D.J.; Bradley, D.G. A genome wide association study for genetic susceptibility to Mycobacterium bovis infection in dairy cattle identifies a susceptibility QTL on chromosome 23. Genet. Sel. Evol. 2016, 48, 19–23. [Google Scholar] [CrossRef]
- Bermingham, M.L.; Bishop, S.C.; Woolliams, J.A.; Pon-Wong, R.; Allen, A.R.; McBride, S.H.; Ryder, J.J.; Wright, D.M.; Skuce, R.A.; McDowell, S.W. Genome wide association study identifies novel loci associated with resistance to bovine tuberculosis. Heredity 2014, 112, 543–551. [Google Scholar] [CrossRef]
- Finlay, E.K.; Berry, D.P.; Wickham, B.; Gormley, E.P.; Bradley, D.G. A genome wide association scan of bovine tuberculosis susceptibility in Holstein-Friesian dairy cattle. PLoS ONE 2012, 7, 30545. [Google Scholar] [CrossRef]
- Minozzi, G.; Buggiotti, L.; Stella, A.; Strozzi, F.; Luini, M.; Williamas, J.L. Genetic loci involved in antibody response to Mycobacterium avium ssp. paratuberculosis in cattle. PLoS ONE 2010, 5, 11117. [Google Scholar] [CrossRef]
- Milián, F.; Harris, B.; Arriaga, C.; Thomsen, B.; Stuber, T.; González, D.; Álvarez, G.; Santillán, M.A.; Morales, A.; Estrada, C. Sensibilidad y especificidad de PCR anidada y spoligotyping como pruebas rápidas de diagnóstico de tuberculosis bovina en tejido fresco. Rev. Mex. Cienc. Pecu. 2010, 1, 403–415. [Google Scholar]
- González-Ruiz, S.; Verdugo-Escárcega, D.A.; Milián-Suazo, F.; Cantó-Alarcón, G.J.; Sosa-Gallegos, L. Prevalencia de Mycobacterium bovis en tejidos obtenidos de bovinos Holstein en rastros de los Altos de Jalisco. In Proceedings of the LII Reunión Anual de Investigación Pecuaria, Querétaro, Mexico, 30 November 2016; pp. 372–374. [Google Scholar]
- Payeur, B.J.; Jarnagin, L.J.; Marquardt, G.J.; Schaper, A.L.; Martin, M.B. Laboratory methods in veterinary mycobacteriology for the isolation and identification of mycobacteria. In Natural Veterinary Services Laboratory; United State Department of Agriculture: Ames, IA, USA, 1993. [Google Scholar]
- Darvasi, A.; Soller, M. Selective DNA pooling for determination of linkage between a molecular marker and a quantitative trait locus. Genetics 1994, 138, 1365–1373. [Google Scholar]
- Le Hellard, S.; Ballereau, S.J.; Visscher, P.M.; Torrance, H.S.; Pinson, J.; Morris, S.W.; Thomson, M.L.; Semple, C.A.; Muir, W.J.; Blackwood, D.H.; et al. SNP genotyping on pooled DNAs: Comparison of genotyping technologies and a semi automated method for data storage and analysis. Nucleic Acids Res. 2002, 30, 74. [Google Scholar] [CrossRef]
- Janicki, P.K.; Liu, J. Accuracy of allele frequency estimates in pool DNA analyzed by high-Density Illumina Human 610-Quad microarray. Intern. J. Genom. Proteom. 2009, 5, 1. [Google Scholar]
- Strillacci, M.G.; Frigo, E.; Canavesi, F.; Ungar, Y.; Schiavini, F.; Zaniboni, L.; Reghenzani, L.; Cozzi, M.C.; Samoré, A.B.; Kashi, Y.; et al. Quantitative trait loci mapping for conjugated linoleic acid, vaccenic acid and Δ9-Desaturase in Italian Brown Swiss dairy cattle using selective DNA pooling. Anim. Genet. 2014, 45, 485–499. [Google Scholar] [CrossRef]
- Lipkin, E.; Strillacci, M.G.; Eitam, H.; Yishay, M.; Schiavini, F.; Soller, M.; Bagnato, A.; Shabtay, A. The Use of Kosher Phenotyping for Mapping QTL Affecting Susceptibility to Bovine Respiratory Disease. PLoS ONE 2016, 11, 0153423. [Google Scholar] [CrossRef]
- Peletto, S.; Strillacci, M.G.; Capucchioc, M.T.; Biasibettic, E.; Modesto, P.; Acutis, P.L.; Bagnato, A. Genetic basis of Lipomatous Myopathy in Piedmontese beef cattle. Livest. Sci. 2017, 206, 9–16. [Google Scholar] [CrossRef]
- Macgregor, S. Most pooling variation in array-Based DNA pooling is attributable to array error rather than pool construction error. Eur. J. Hum. Genet. 2007, 15, 501–504. [Google Scholar] [CrossRef]
- Macgregor, S.; Zhao, Z.Z.; Henders, A.; Nicholas, M.G.; Montgomery, G.W.; Visscher, P.M. Highly cost-Efficient genome-Wide association studies using DNA pools and dense SNP arrays. Nucleic Acids Res. 2008, 36, 35. [Google Scholar] [CrossRef]
- Fernando, R.L.; Nettleton, D.; Southey, B.R.; Dekkers, J.C.M.; Rothschild, M.F.; Soller, M. Controlling the proportion of false positives in multiple dependent tests. Genetics 2004, 166, 611–619. [Google Scholar] [CrossRef]
- Nicolazzi, E.L.; Picciolini, M.; Strozzi, F.; Schnabel, R.D.; Lawley, C.; Pirani, A.; Breu, F.; Stella, A. SNPchiMp: A database to disentangle the SNPchip jungle in bovine livestock. BMC Genom. 2014, 15, 123. [Google Scholar] [CrossRef]
- European Variation Archive. 2017. Available online: https://www.ebi.ac.uk/eva/?Home (accessed on 21 September 2017).
- Ensembl Project. 1999. Available online: http://www.ensembl.org/biomart/martview/502ede1207156b60a738ec6c34389633 (accessed on 18 November 2017).
- Huang, D.W.; Sherman, B.T.; Lempicki, R.A. Systematic and integrative analysis of large gene lists using DAVID Bioinformatics Resources. Nat. Protoc. 2009, 4, 44–57. [Google Scholar] [CrossRef]
- National Animal Genome Research Program. USDA-NRI. 2003–2018. Available online: https://www.animalgenome.org (accessed on 12 March 2018).
- Hawn, T.T.; Day, T.A.; Scriba, T.J.; Hatherill, M.; Hanekom, W.A.; Evans, T.G.; Churchyard, G.J.; Kublin, J.G.; Bekker, L.G.; Self, S.G. Tuberculosis Vaccines and Prevention of Infection. Microbiol. Mol. Biol. Rev. 2014, 78, 650–671. [Google Scholar] [CrossRef]
- Tsairidou, S.; Woolliams, J.A.; Allen, A.R.; Skuce, R.A.; McBride, S.H.; Wright, D.M.; Bermingham, M.L.; Pong-Wong, R.; Matika, O.; McDowell, S.W.J. Genomic prediction for Tuberculosis resistance in dairy cattle. PLoS ONE 2014, 9, 96728. [Google Scholar] [CrossRef]
- Richardson, I.W.; Bradley, D.G.; Higgins, I.M.; More, S.J.; McClure, J.; Berry, D.P. Variance components for susceptibility to Mycobacterium bovis infection in dairy and beef cattle. Genet. Sel. Evol. 2014, 46, 77. [Google Scholar] [CrossRef]
- Curtis, J.; Luo, Y.; Zenner, H.L.; Cuchet-Lourenc, D.; Wu, C.; Lo, K.; Maes, M.; Alisaaca, A.; Stebbings, E.; Liu, J.C.; et al. Susceptibility to tuberculosis is associated with variants in the ASAP1 gene encoding a regulator of dendritic cell migration. Nat. Genet. 2015, 47, 523–527. [Google Scholar] [CrossRef]
- Sobota, R.S.; Stein, C.M.; Kodaman, N.; Scheinfeldt, L.B.; Maro, I.; Wieland-Alter, W.; Igo, R.P.; Magohe, A.; Malone, L.L.; Chervenak, K. A Locus at 5q33.3 Confers Resistance to Tuberculosis in Highly Susceptible Individuals. Am. J. Hum. Genet. 2016, 98, 514–524. [Google Scholar] [CrossRef]
- Raphaka, K.; Matika, O.; Sánchez-Molano, E.; Mrode, R.; Coffey, M.P.; Riggio, V.; Glas, E.J.; Woolliams, J.A.; Bishop, S.C.; Banos, G. Genomic regions underlying susceptibility to bovine tuberculosis in Holstein-Friesian cattle. BMC Genet. 2017, 18, 27. [Google Scholar] [CrossRef]
- Hasenauer, F.C.; Garbaccio, S.G.; Caffaro, M.E.; Garro, C.; Huertas, P.; Poli, M.A.; Rossetti, C.A. Exploring the association between polymorphisms at 3′UTR SLC11A1 gene microsatellites and resistance to tuberculosis: A case-Control study in Bos taurus dairy cattle. Livest. Sci. 2018, 210, 1–7. [Google Scholar] [CrossRef]
- Banos, G.; Winters, M.; Mrode, R.; Mitchell, A.P.; Bishop, S.C.; Woolliams, J.A.; Coffey, M.P. Genetic evaluation for bovine tuberculosis resistance in dairy cattle. J. Dairy Sci. 2017, 100, 1272–1281. [Google Scholar] [CrossRef]
- Kurtulus, S.; Sakuishi, K.; Ngiow, S.F.; Joller, N.; Tan, D.J.; Teng, M.W.; Smyth, M.J.; Kuchroo, V.K.; Anderson, A.C. TIGIT predominantly regulates the immune response via regulatory T cells. J. Clin. Investig. 2015, 125, 4053–4062. [Google Scholar] [CrossRef]
- Joller, N.; Hafler, J.P.; Brynedal, B.; Kassam, N.; Spoerl, S.; Levin, S.D.; Arle, H.; Sharpe, K. TIGIT has T cell-Intrinsic inhibitory functions. J. Immunol. 2011, 186, 1338–1342. [Google Scholar] [CrossRef]
- Whitaker, H.C.; Shiong, L.L.; Kay, J.D.; Grönberg, H.; Warren, A.Y.; Seipel, A.; Wiklund, F.; Thomas, B.; Wiklund, P.; Miller, J.L. N-Acetyl-L-Aspartyl-L-Glutamate peptidase-Like 2 is overexpressed in cancer and promotes a pro-Migratory and pro-Metastatic phenotype. Oncogene 2014, 33, 5274–5287. [Google Scholar] [CrossRef]
- Demy, D.L.; Tauzin, M.; Lancino, M.; Le Cabec, V.; Redd, M.; Murayama, E.; Maridonneau-Parini, I.; Trede, N.; Herbomel, P. Trim33 is essential for macrophage and neutrophil mobilization to developmental or inflammatory cues. J. Cell. Sci. 2017, 130, 2797–2807. [Google Scholar] [CrossRef]
- Weng, L.; Mitoma, H.; Tricot, C.; Boo, M.; Liu, Y.; Zhang, Z.; Liu, Y.J. The E3 Ubiquitin Ligase Tripartite Motif 33 Is Essential for Cytosolic RNA–Induced NLRP3 Inflammasome Activation. J. Immunol. 2014, 193, 3676–3682. [Google Scholar] [CrossRef]
- Fjeldborg, K.; Møller, H.J.; Richelsen, B.; Pedersen, S.B. Regulation of CD163 mRNA and soluble CD163 protein in human adipose tissue in vitro. J. Mol Endocrinol. 2014, 53, 227–235. [Google Scholar] [CrossRef]
- National Center for Biotechnology Information. Available online: https://www.ncbi.nlm.nih.gov/gene/100125389 (accessed on 3 April 2018).
- GeneCards®: The Human Gene Database. Weizmann Institute of Science. Available online: https://www.genecards.org/cgi-bin/carddisp.pl?gene=KIF16B (accessed on 3 April 2018).
- Newman, J.H.; Holt, T.N.; Hedges, L.K.; Womack, B.; Memon, S.S.; Willers, E.D.; Wheeler, L.; Phillips, J.A.; Hamid, R. High-Altitude pulmonary hypertension in cattle (brisket disease): Candidate genes and gene expression profiling of peripheral blood mononuclear cells. Pulm. Circ. 2011, 1, 462–469. [Google Scholar] [CrossRef]
- Clark, D.L.; Boler, D.D.; Kutzler, L.W.; Jones, K.A.; McKeith, F.K.; Killefer, J.; Carr, T.R.; Dilger, A.C. Muscle gene expression associated with increased marbling in beef cattle. Anim. Biotechnol. 2011, 22, 51–63. [Google Scholar] [CrossRef]
- Pires, D.; Bernard, E.M.; Pombo, J.P.; Carmo, N.; Fialho, C.; Gutierrez, M.G.; Bettencourt, P.; Anes, E. Mycobacterium tuberculosis Modulates miR-106b-5p to Control Cathepsin S Expression Resulting in Higher Pathogen Survival and Poor T-Cell Activation. Front. Immunol. 2017, 8, 1819. [Google Scholar] [CrossRef]
- Bragina, E.Y.; Tiys, E.S.; Rudko, A.A.; Ivanisenko, V.A.; Freidin, M.B. Novel tuberculosis susceptibility candidate genes revealed by the reconstruction and analysis of associative networks. Infect. Genet. Evol. 2016, 46, 118–123. [Google Scholar] [CrossRef]
- Jenum, S.; Bakken, R.; Dhanasekaran, S.; Mukherjee, A.; Lodha, R.; Singh, S.; Haks, M.C.; Ottenhoff, T.H.M.; Kabra, K.; Doherty, T.M. BLR1 and FCGR1A transcripts in peripheral blood associate with the extent of intrathoracic tuberculosis in children and predict treatment outcome. Sci. Rep. 2016, 12, 6. [Google Scholar] [CrossRef]
- Booty, M.G.; Barreira-Silva, P.; Carpenter, S.M.; Nunes-Alves, C.; Jacques, M.K.; Stowell, B.L.; Jayaraman, P.; Beamer, G.; Behar, S.M. IL-21 signaling is essential for optimal host resistance against Mycobacterium tuberculosis infection. Sci. Rep. 2016, 7, 6. [Google Scholar] [CrossRef]
- Gomes-Pereira, S.; Rodrigues, P.N.; Appelberg, R.; Gomes, M.S. Increased susceptibility to Mycobacterium avium in hemochromatosis protein HFE-deficient mice. Infect. Immun. 2008, 76, 4713–4719. [Google Scholar] [CrossRef]
- Moalem, S.; Weinberg, E.D.; Percy, M.E. Hemochromatosis and the enigma of misplaced iron: Implications for infectious disease and survival. Biometals 2004, 17, 135–139. [Google Scholar] [CrossRef]
- Wang, L.; Johnson, E.E.; Shi, H.N.; Walker, W.A.; Wessling-Resnick, M.; Cherayil, B.J. Attenuated inflammatory responses in hemochromatosis reveal a role for iron in the regulation of macrophage cytokine translation. J. Immunol. 2008, 15, 2723–2731. [Google Scholar] [CrossRef]
- Horne, D.J.; Randhawa, A.K.; Chau, T.T.; Bang, N.D.; Yen, N.T.; Farrar, J.J.; Dunstan, S.J.; Haen, T.R. Common polymorphisms in the PKP3-SIGIRR-TMEM16J gene region are associated with susceptibility to tuberculosis. J. Infect. Dis. 2012, 205, 586–594. [Google Scholar] [CrossRef]
- Riva, F.; Bonavita, E.; Barbati, E.; Muzio, M.; Mantovani, A.; Garlanda, C. TIR8/SIGIRR is an Interleukin-1 Receptor/Toll Like Receptor Family Member with Regulatory Functions in Inflammation and Immunity. Front. Immunol. 2012, 3, 322. [Google Scholar] [CrossRef]


| CASES | CONTROLS | ||||
|---|---|---|---|---|---|
| Biological | Technical | Biological | Technical | ||
| Bio_rep a | Pool_Rep b | Array_Rep c | Bio_rep a | Pool_Rep b | Array_Rep c |
| CA_1 | CA1_A | CA_1A_1 | CT_1 | CT1_A | CT_1A_1 |
| CA_1A_2 | CT_1A_2 | ||||
| CA_1A_3 | CT_1A_3 | ||||
| CA1_B | CA_1B_1 | CT1_B | CT_1B_1 | ||
| CA_1B_2 | CT_1B_2 | ||||
| CA_1B_3 | CT_1B_3 | ||||
| CA_2 | CA2_A | CA_2A_1 | CT_2 | CT2_A | CT_2A_1 |
| CA_2A_2 | CT_2A_2 | ||||
| CA_2A_3 | CT_2A_3 | ||||
| CA2_B | CA_2B_1 | CT2_B | CT_2B_1 | ||
| CA_2B_2 | CT_2B_2 | ||||
| CA_2B_3 | CT_2B_3 | ||||
| CT_3 | CT3_A | CT_3A_1 | |||
| CT_3A_3 | |||||
| CT_3A_3 | |||||
| CT3_B | CT_3B_1 | ||||
| CT_3B_3 | |||||
| CT_3B_3 | |||||
| Term | Count | p-Value | Genes |
|---|---|---|---|
| Biological process | |||
| GO:0006334: nucleosome assembly | 6 | 9.42 × 10⁵ | HIST1H2BB, HIST1H1C, HIST1H1A, H2B, HIST1H3G, HIST1H3I |
| GO:0006335: DNA replication-dependent nucleosome assembly | 3 | 6.12 × 10³ | H4, HIST1H3G, HIST1H3I |
| GO:0051290: protein heterotetramerization | 3 | 6.81 × 10³ | H4, HIST1H3G, HIST1H3I |
| GO:0098792: xenophagy | 5 | 2.27 × 10³ | TMEM39A, SNRPB2, CPA3, HIST1H3G, HIST1H3I |
| GO:0002230: positive regulation of defense response to virus by host | 5 | 3.68 × 10³ | TMEM39A, SNRPB2, CPA3, HIST1H3G, HIST1H3I |
| GO:0046627: negative regulation of insulin receptor signaling pathway | 3 | 9.09 × 10³ | PRKCD, KANK1, PRKCB |
| GO:0042742: defense response to bacterium | 4 | 1.63 × 10² | STAB1, FCGR1A, PRKCD, TMF1 |
| Cellular Components | |||
| GO:0000786: nucleosome | 7 | 1.60 × 10⁵ | H4, HIST1H1C, HIST1H1A, H2B, HIST1H2AK, HIST1H3G, HIST1H3I |
| GO:0000788: nuclear nucleosome | 5 | 2.47 × 10⁴ | HIST1H2BB, H2B, HIST1H3G, HIST1H3I |
| GO:0000784: nuclear chromosome, telomeric region | 4 | 2.3 × 10² | H4, TNKS, HIST1H3G, HIST1H3I |
| GO:0030176: integral component of endoplasmic reticulum membrane | 4 | 1.50 × 10² | PIGG, SARAF, MBOAT4, SLC27A2 |
| GO:0005615: extracellular space | 13 | 3.32 × 10² | A2M, H2B, HFE, FSTL1, CTSS, OVOS2, ESF1, VEGFC, GPI, CTSK, CPA3, CPB1, SMARCA4 |
| GO:0005788: endoplasmic reticulum lumen | 3 | 4.77 × 10² | EOGT, SLC27A2, POGLUT1 |
| Molecular Functions | |||
| GO:0046982: protein heterodimerization activity | 5 | 7.15 × 10³ | AGTR1, HIST1H2BB, H4, H2B, FOXP1 |
| GO:0042393: histone binding | 3 | 3.67 × 10² | H4, PRKCB, SMARCA4 |
| KEGG Pathways | |||
| bta05322: Systemic lupus erythematosus | 9 | 7.64 × 10⁸ | HIST1H2BB, H4, CD80, FCGR1A, HIST2H2BF, H2B, HIST1H2AK, HIST1H3G, HIST1H3I |
| bta05034: Alcoholism | 8 | 4.32 × 10⁶ | HIST1H2BB, HRAS, H4, HIST2H2BF, H2B, HIST1H2AK, HIST1H3G, HIST1H3I |
| bta05203: Viral carcinogenesis | 5 | 1.92 × 10³ | HIST1H2BB, HRAS, H4, HIST2H2BF, H2B |
| bta00514: Other types of O-glycan biosynthesis | 3 | 2.18 × 10² | ST6GAL2, EOGT, POGLUT1 |
© 2019 by the authors. Licensee MDPI, Basel, Switzerland. This article is an open access article distributed under the terms and conditions of the Creative Commons Attribution (CC BY) license (http://creativecommons.org/licenses/by/4.0/).
Share and Cite
González-Ruiz, S.; Strillacci, M.G.; Durán-Aguilar, M.; Cantó-Alarcón, G.J.; Herrera-Rodríguez, S.E.; Bagnato, A.; Guzmán, L.F.; Milián-Suazo, F.; Román-Ponce, S.I. Genome-Wide Association Study in Mexican Holstein Cattle Reveals Novel Quantitative Trait Loci Regions and Confirms Mapped Loci for Resistance to Bovine Tuberculosis. Animals 2019, 9, 636. https://doi.org/10.3390/ani9090636
González-Ruiz S, Strillacci MG, Durán-Aguilar M, Cantó-Alarcón GJ, Herrera-Rodríguez SE, Bagnato A, Guzmán LF, Milián-Suazo F, Román-Ponce SI. Genome-Wide Association Study in Mexican Holstein Cattle Reveals Novel Quantitative Trait Loci Regions and Confirms Mapped Loci for Resistance to Bovine Tuberculosis. Animals. 2019; 9(9):636. https://doi.org/10.3390/ani9090636
Chicago/Turabian StyleGonzález-Ruiz, Sara, Maria G. Strillacci, Marina Durán-Aguilar, Germinal J. Cantó-Alarcón, Sara E. Herrera-Rodríguez, Alessandro Bagnato, Luis F. Guzmán, Feliciano Milián-Suazo, and Sergio I. Román-Ponce. 2019. "Genome-Wide Association Study in Mexican Holstein Cattle Reveals Novel Quantitative Trait Loci Regions and Confirms Mapped Loci for Resistance to Bovine Tuberculosis" Animals 9, no. 9: 636. https://doi.org/10.3390/ani9090636
APA StyleGonzález-Ruiz, S., Strillacci, M. G., Durán-Aguilar, M., Cantó-Alarcón, G. J., Herrera-Rodríguez, S. E., Bagnato, A., Guzmán, L. F., Milián-Suazo, F., & Román-Ponce, S. I. (2019). Genome-Wide Association Study in Mexican Holstein Cattle Reveals Novel Quantitative Trait Loci Regions and Confirms Mapped Loci for Resistance to Bovine Tuberculosis. Animals, 9(9), 636. https://doi.org/10.3390/ani9090636