Finding Meanings in Low Dimensional Structures: Stochastic Neighbor Embedding Applied to the Analysis of Indri indri Vocal Repertoire

 , ,
, , 
Abstract
Simple Summary
Abstract
1. Introduction
2. Materials and Methods
2.1. Data Collection
2.2. Acoustical Analysis
2.3. Acoustic Embedding and Classification Procedure
3. Results
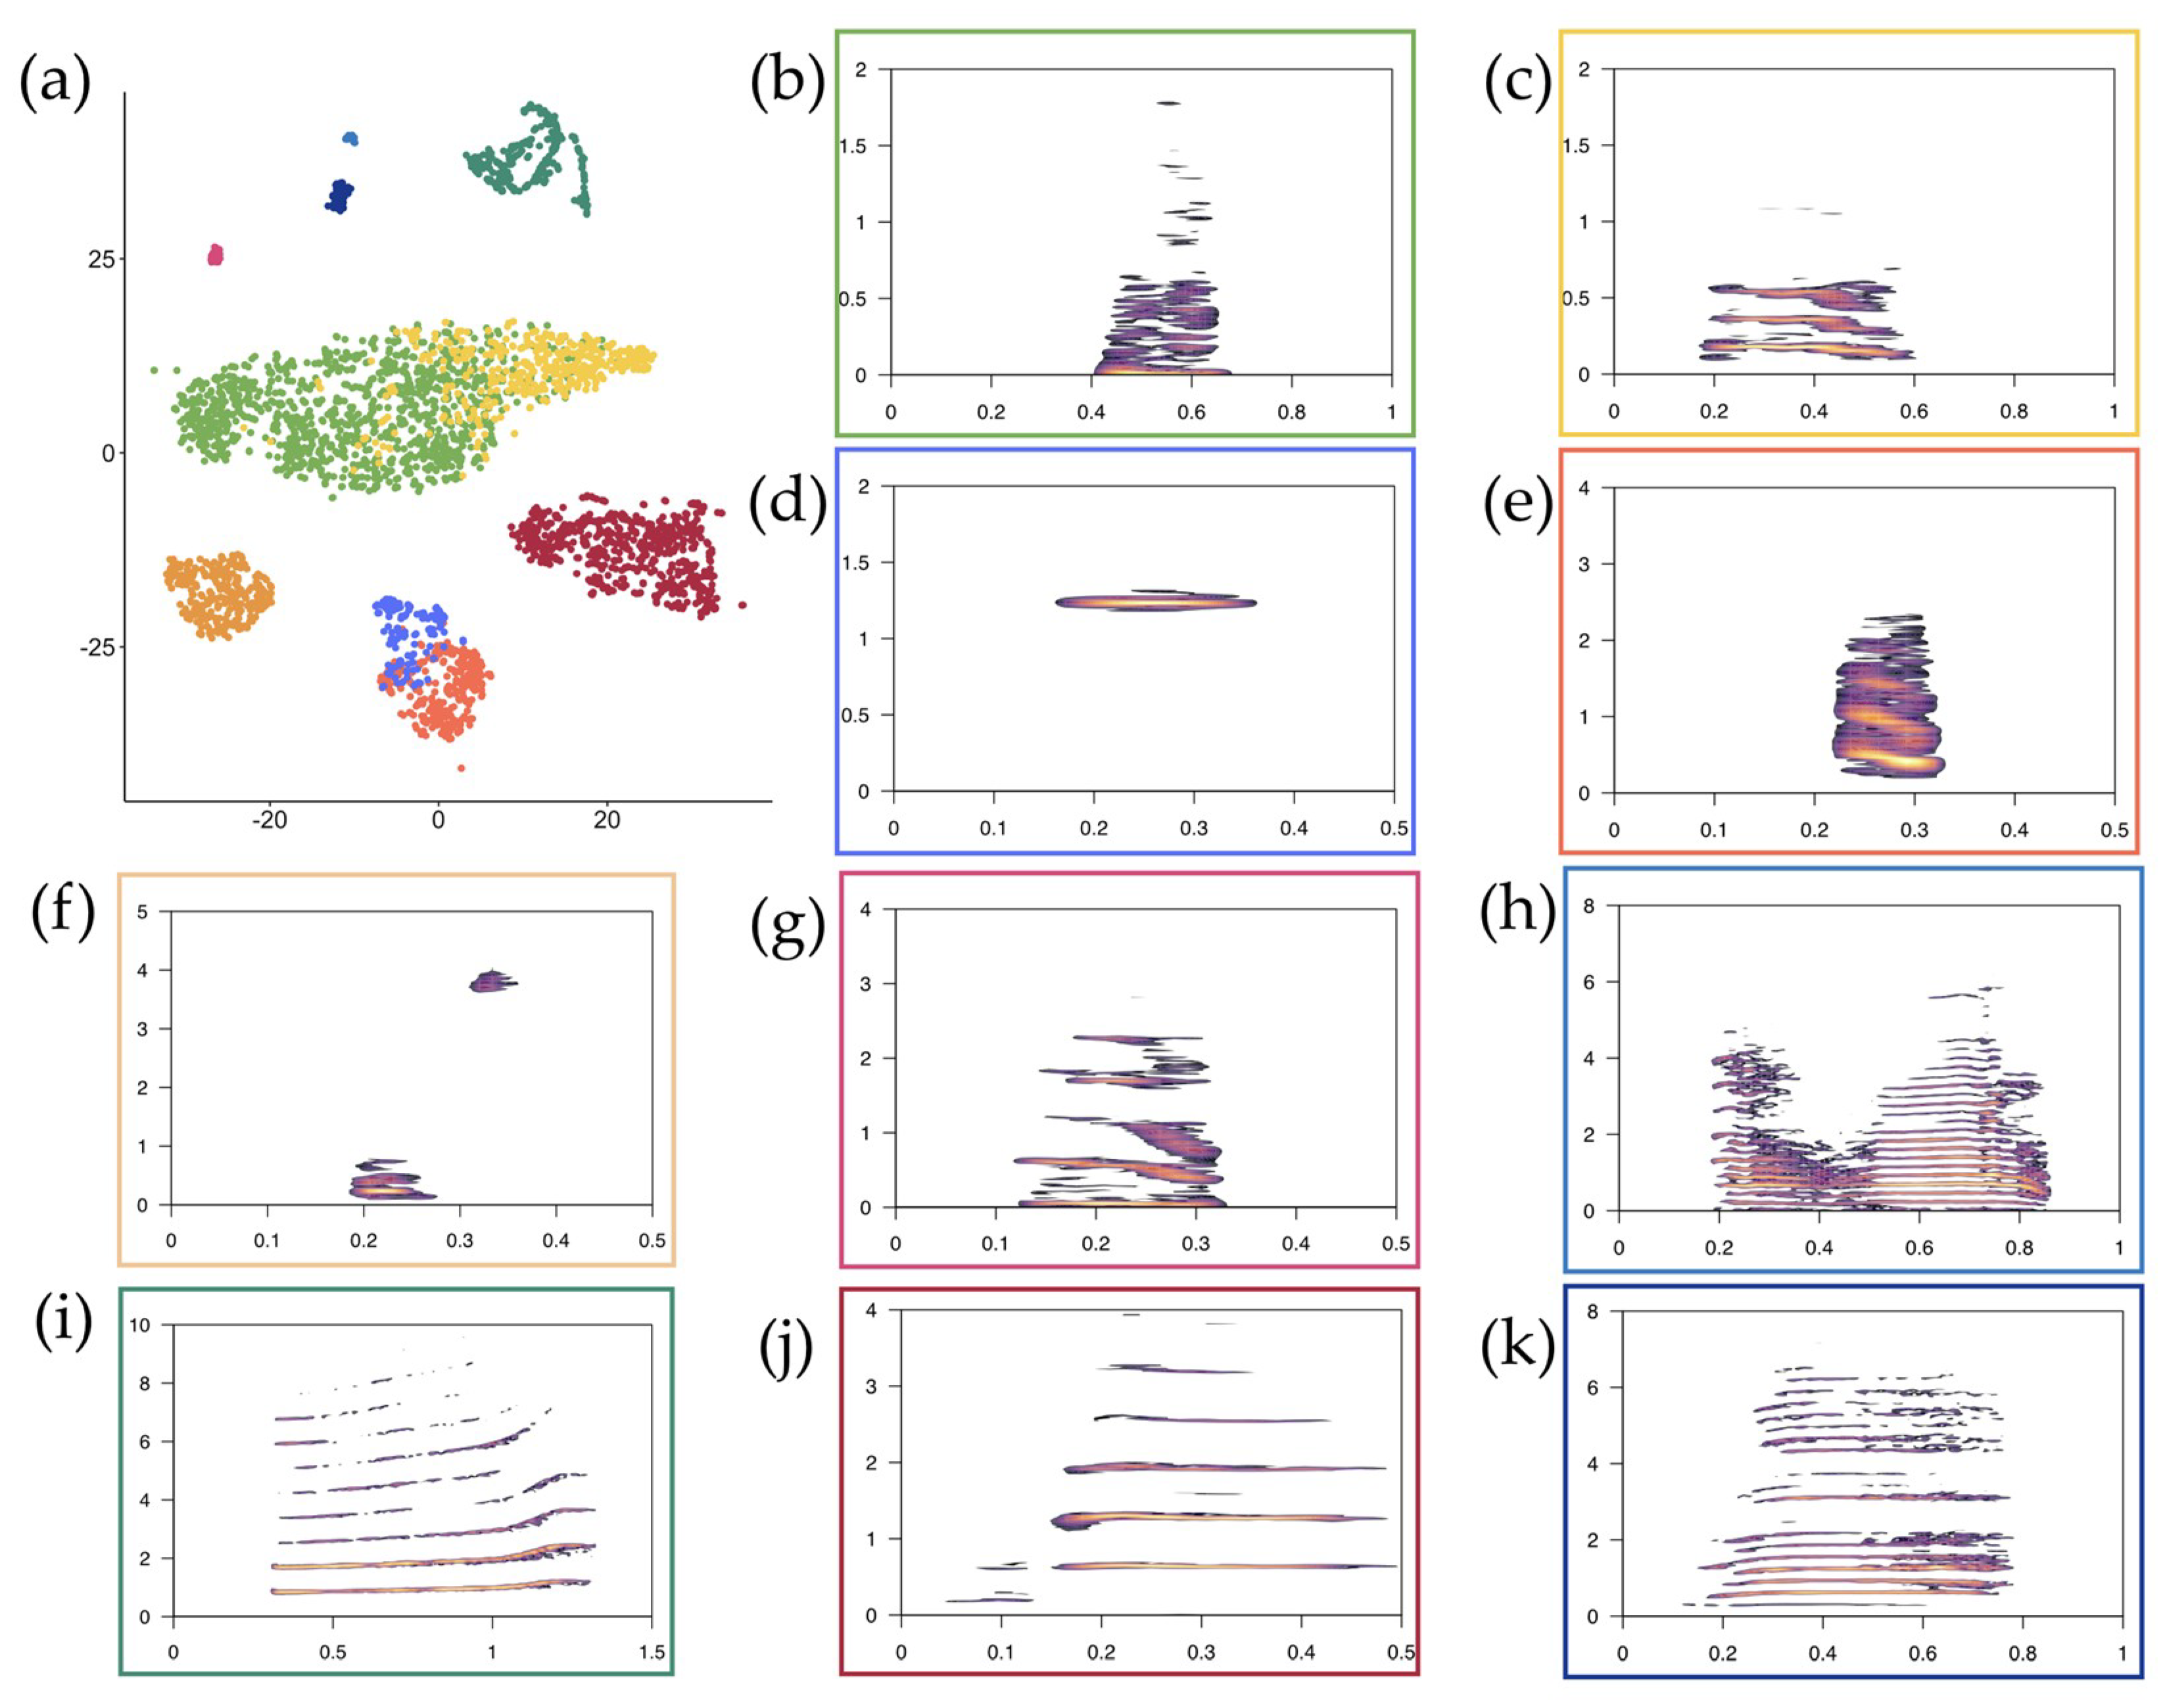
3.1. t-SNE Mapping
3.2. Call Recognition
4. Discussion
5. Conclusions
Supplementary Materials
Author Contributions
Funding
Acknowledgments
Conflicts of Interest
References
- Valletta, J.J.; Torney, C.; Kings, M.; Thornton, A.; Madden, J. Applications of machine learning in animal behaviour studies. Anim. Behav. 2017, 124, 203–220. [Google Scholar] [CrossRef]
- Zheng, J.; Qiu, H.; Xu, X.; Wang, W.; Huang, Q. Fast Discriminative Stochastic Neighbor Embedding Analysis. Comput. Math. Methods Med. 2013, 2013, 106867. [Google Scholar] [CrossRef]
- Piles, M.; Díez, J.; del Coz, J.J.; Montañés, E.; Quevedo, J.R.; Ramon, J.; Rafel, O.; López-Béjar, M.; Tusell, L. Predicting fertility from seminal traits: Performance of several parametric and non-parametric procedures. Livest Sci. 2013, 155, 137–147. [Google Scholar] [CrossRef]
- Cox, M.A.; Cox, T.F. Multidimensional Scaling; Chapman & Hall/CRC: Boca Raton, FL, USA, 2001. [Google Scholar]
- Jolliffe, I.T. Principal Component Analysis; Springer: New York, NY, USA, 1986. [Google Scholar] [CrossRef]
- Tenenbaum, J.B.; Silva, V.; Langford, J.C. A Global Geometric Framework for Nonlinear Dimensionality Reduction. Science 2000, 290, 2319. [Google Scholar] [CrossRef]
- Cook, J.A.; Sutskever, I.; Mnih, A.; Hinton, G.E. Visualizing similarity data with a mixture of maps. In Proceedings of the 11th International Conference on Artificial Intelligence and Statistics, San Juan, Puerto Rico, 21–24 March 2007; pp. 67–74. [Google Scholar]
- Hinton, G.; Roweis, S. Stochastic neighbor embedding. Adv. Neural Inf. Process. Syst. 2002, 15, 833–840. [Google Scholar]
- Roweis, S.T.; Saul, L.K. Nonlinear Dimensionality Reduction by Locally Linear Embedding. Science 2000, 290, 2323. [Google Scholar] [CrossRef]
- Van der Maaten, L.J.P.; Hinton, G. Visualizing data using t-SNE. J. Mach. Learn. Res. 2008, 9, 2579–2605. [Google Scholar]
- Van der Maaten, L.J.P.; Postma, E.O. Proceedings of the SPIE Optical Engineering and Applications. Tescher, A., Ed.; The International Society for Optical Engineering: San Diego, CA, USA, 2010; Volume 7798. [Google Scholar]
- Platzer, A. Visualization of SNPs with t-SNE. PLoS ONE 2013, 8, e56883. [Google Scholar] [CrossRef] [PubMed]
- Jamieson, A.R.; Giger, M.L.; Drukker, K.; Li, H.; Yuan, Y.; Bhooshan, N. Exploring nonlinear feature space dimension reduction and data representation in breast CADx with Laplacian Eigenmaps and t-SNE. Med. Phys. 2010, 37, 339–351. [Google Scholar] [CrossRef] [PubMed]
- Acuff, N.V.; Linden, J. Using Visualization of t-Distributed Stochastic Neighbor Embedding to Identify Immune Cell Subsets in Mouse Tumors. J. Immunol. 2017, 198, 4539–4546. [Google Scholar] [CrossRef]
- Bittner, R.M.; Salamon, J.; Bosch, J.J.; Bello, J.P. Pitch Contours as a Mid-Level Representation for Music Informatics. In Proceedings of the Audio Engineering Society Conference: 2017 AES International Conference on Semantic Audio, Erlangen, Germany, 22–24 June 2017. [Google Scholar]
- Cho, K.; van Merriënboer, B.; Gulcehre, C.; Bougares, F.; Schwenk, H.; Bahdanau, D.; Bengio, Y. Learning Phrase Representations using RNN Encoder–Decoder for Statistical Machine Translation. In Proceedings of the Conference on Empirical Methods in Natural Language Processing (EMNLP), Doha, Qatar, 25–29 October 2014; pp. 1724–1734. [Google Scholar]
- Hamel, P.; Eck, D. Learning features from music audio with deep belief networks. In Proceedings of the 11th International Society for Music Information Retrieval Conference (ISMIR 2010), Utrecht, The Netherlands, 9–13 August 2010. [Google Scholar]
- Panteli, M.; Bittner, R.; Bello, J.P.; Dixon, S. Towards the characterization of singing styles in world music. In Proceedings of the IEEE International Conference on Acoustics, Speech and Signal Processing (ICASSP), New Orleans, LA, USA, 5–9 March 2017. [Google Scholar]
- Charan, R.; Manisha, A.; Karthik, R.; Kumar, R.M. A text-independent speaker verification model: A comparative analysis. In Proceedings of the IEEE International Conference on Intelligent Computing and Control (I2C2), Tamil Nadu, India, 23–24 June 2017. [Google Scholar]
- Berman, G.J.; Choi, D.M.; Bialek, W.; Shaevitz, J.W. Mapping the stereotyped behaviour of freely moving fruit flies. J. R. Soc. Interface 2014, 11, 20140672. [Google Scholar] [CrossRef]
- Gamba, M.; Friard, O.; Riondato, I.; Righini, R.; Colombo, C.; Miaretsoa, L.; Torti, V.; Nadhurou, B.; Giacoma, C. Comparative analysis of the vocal repertoire of Eulemur: A dynamic time warping approach. Int. J. Primatol. 2015, 36, 894–910. [Google Scholar] [CrossRef]
- Green, S. Communication by a graded vocal system in Japanese monkeys. In Primate Behaviour; Rosenblum, L.A., Ed.; Academic Press: New York, NY, USA, 1975; pp. 1–102. [Google Scholar]
- Hammerschmidt, K.; Fischer, J. The vocal repertoire of Barbary macaques: A quantitative analysis of a graded signal system. Ethology 1998, 104, 203–216. [Google Scholar] [CrossRef]
- Zuberbühler, K.; Noë, R.; Seyfarth, R.M. Diana monkey long-distance calls: Messages for conspecifics and predators. Anim. Behav. 1997, 53, 589–604. [Google Scholar] [CrossRef]
- Arnold, K.; Zuberbühler, K. The alarm calling system of adult male putty-nosed monkeys (Cercopithecus nictitans martini). Anim. Behav. 2006, 72, 643–653. [Google Scholar] [CrossRef]
- Marler, P. The structure of animal communication sounds. In Recognition of Complex Acoustic Signals; Bullock, T.H., Evans, E.F., Eds.; Dahlem Konferenzen: Berlin, Germany, 1977; pp. 17–35. [Google Scholar]
- Kenaan, S.; Lemasson, A.; Zuberbühler, K. Graded or discrete? A quantitative analysis of Campbell’s monkey alarm calls. Anim. Behav. 2013, 85, 109–118. [Google Scholar] [CrossRef]
- Peckre, L.; Kappeler, P.M.; Fichtel, C. Clarifying and expanding the social complexity hypothesis for communicative complexity. Behav. Ecol. Sociobiol. 2019, 73, 11. [Google Scholar] [CrossRef]
- Wadewitz, P.; Hammerschmidt, K.; Battaglia, D.; Witt, A.; Wolf, F.; Fischer, J. Characterizing vocal repertoires—Hard vs. soft classification approaches. PLoS ONE 2015, 10, e0125785. [Google Scholar] [CrossRef]
- Bouchet, H.; Blois-Heulin, C.; Lemasson, A. Social complexity parallels vocal complexity: A comparison of three non-human primate species. Front. Psychol. 2013, 4, 390. [Google Scholar] [CrossRef]
- Manser, M.B.; Seyfarth, R.M.; Cheney, D.L. Suricate alarm calls signal predator class and urgency. Trends Cogn. Sci. 2002, 6, 55–57. [Google Scholar] [CrossRef]
- Fischer, J.; Wadewitz, P.; Hammerschmidt, K. Structural variability and communicative complexity in acoustic communication. Anim. Behav. 2016, 134, 229–237. [Google Scholar] [CrossRef]
- McCowan, B. A New Quantitative Technique for Categorizing Whistles Using Simulated Signals and Whistles from Captive Bottlenose Dolphins (Delphinidae, Tursiops truncatus). Ethology 1995, 100, 177–193. [Google Scholar] [CrossRef]
- Snowdon, C.T.; Elowson, A.M.; Roush, R.S. Social influences on vocal development in new world primates. In Social Influences on Vocal Development; Snowdon, C.T., Elowson, A.M., Eds.; Cambridge University Press: Cambridge, UK, 1997; pp. 234–248. [Google Scholar]
- Lemasson, A.; Hausberger, M. Acoustic variability and social significance of calls in female Campbell’s monkeys (Cercopithecus campbelli campbelli). J. Acoust. Soc. Am. 2011, 129, 3341–3352. [Google Scholar] [CrossRef] [PubMed]
- McComb, K.; Semple, S. Coevolution of vocal communication and sociality in primates. Biol. Lett. 2005, 1, 381–385. [Google Scholar] [CrossRef] [PubMed]
- Altmann, J. Observational study of behavior: Sampling methods. Behaviour 1974, 49, 227–267. [Google Scholar] [CrossRef] [PubMed]
- Boersma, P.; Weenink, D. Praat: Doing Phonetics by Computer [Computer Program]. Version 6.0.28. 2017. Available online: http://www.praat.org/ (accessed on 23 March 2017).
- Maretti, G.; Sorrentino, V.; Finomana, A.; Gamba, M.; Giacoma, C. Not just a pretty song: An overview of the vocal repertoire of Indri indri. J. Anthropol. Sci. 2010, 88, 151–165. [Google Scholar] [PubMed]
- Gamba, M.; Torti, V.; Estienne, V.; Randrianarison, R.M.; Valente, D.; Rovara, P.; Bonadonna, G.; Friard, O.; Giacoma, C. Indris have got rhythm! Timing and pitch variation of a primate song examined between sexes and age Classes. Front. Neurosci. 2016, 10, 249. [Google Scholar] [CrossRef] [PubMed]
- Macedonia, J.; Stanger, K. Phylogeny of the Lemuridae Revisited: Evidence from Communication Signals. Folia Primatol. 1994, 63, 1–43. [Google Scholar] [CrossRef]
- Krijthe, J.H. Rtsne: T-Distributed Stochastic Neighbor Embedding Using a Barnes-Hut Implementation. 2015. Available online: https://github.com/jkrijthe/Rtsne (accessed on 8 February 2019).
- R Core Team. R: A Language and Environment for Statistical Computing; R Foundation for Statistical Computing: Vienna, Austria, 2018; Available online: https://www.R-project.org/ (accessed on 23 April 2018).
- MacQueen, J.B. Some Methods for classification and Analysis of Multivariate Observations. In Proceedings of the 5th Berkeley Symposium on Mathematical Statistics and Probability; University of California Press: Berkeley, CA, USA; Los Angeles, CA, USA, 1967; Volume 1, pp. 281–297. [Google Scholar]
- Frank, E.; Hall, M.A.; Witten, I.H. The WEKA Workbench. Online Appendix for Data Mining: Practical Machine Learning Tools and Techniques, 4th ed.; Morgan Kaufmann: Burlington, MA, USA, 2016. [Google Scholar]
- Hornik, K.; Stinchcombe, M.; White, H. Multi-layer feedforward networks are universal approximators. Neural Netw. 1989, 2, 359–366. [Google Scholar] [CrossRef]
- Schalkoff, R. Pattern Recognition: Statistical, Structural and Neural Approaches; John Wiley & Sons: New York, NY, USA, 1992; p. 364. [Google Scholar]
- Sueur, J.; Aubin, T.; Simonis, C. Seewave: A free modular tool for sound analysis and synthesis. Bioacoustics 2008, 18, 213–226. [Google Scholar] [CrossRef]
- Sueur, J. What Is Sound? In Sound Analysis and Synthesis with R; Use R! Series; Springer: Cham, Switzerland, 2018. [Google Scholar] [CrossRef]
- Pozzi, L.; Gamba, M.; Giacoma, C. The Use of Artificial Neural Networks to Classify Primate Vocalizations: A Pilot Study on Black Lemurs. Am. J. Primatol. 2010, 72, 337–348. [Google Scholar] [CrossRef] [PubMed]
- Mosavi, M.R.; Khishe, M.; Naseri, M.J.; Parvizi, G.R.; Ayat, M. Multi-Layer Perceptron Neural Network Utilizing Adaptive Best-Mass Gravitational Search Algorithm to Classify Sonar Dataset. Arch. Acoust. 2019, 44, 137–151. [Google Scholar]
- Petter, J.J.; Charles-Dominique, P. Vocal communication in prosimians. In The Study of Prosimian Behaviour; Doyle, G.A., Martin, R.D., Eds.; New York Academic Press: New York, NY, USA, 1979; pp. 272–282. [Google Scholar]
- Bouchet, H.; Blois-Heulin, C.; Pellier, A.S.; Zuberbühler, K.; Lemasson, A. Acoustic variability and individual distinctiveness in the vocal repertoire of red-capped mangabeys (Cercocebus torquatus). J. Comp. Psychol. 2012, 126, 45–56. [Google Scholar] [CrossRef] [PubMed]
- Hammerschmidt, K.; Fischer, J. Baboon vocal repertoires and the evolution of primate vocal diversity. J. Hum. Evol. 2018, 126, 1–13. [Google Scholar] [CrossRef]
- Pollock, J.I. Field observations on Indri indri: A preliminary report. In Lemur Biology; Tattersall, I., Sussman, R., Eds.; Plenum Press: New York, NY, USA, 1975; pp. 28–31. [Google Scholar]
- Hauser, M.D. Vocal communication in macaques: Causes of variation. In Evolutionary Ecology and Behavior of Macaques; Fa, J.E., Lindburg, D., Eds.; Cambridge University Press: Cambridge, UK, 1996; pp. 551–578. [Google Scholar]
- Fuller, J.L. The Vocal Repertoire of Adult Male Blue Monkeys (Cercopithecus mitis stulmanni): A Quantitative Analysis of Acoustic Structure. Am. J. Primatol. 2014, 76, 203–216. [Google Scholar] [CrossRef]
- Fichtel, C.; Kappeler, P.M. Anti-predator behavior of group-living Malagasy primates: Mixed evidence for a referential alarm call system. Behav. Ecol. Sociobiol. 2002, 51, 262–275. [Google Scholar] [CrossRef]
- Cäsar, C.; Zuberbühler, K. Referential alarm calling behaviour in New World primates. Curr. Zool. 2012, 58, 680–697. [Google Scholar] [CrossRef][Green Version]
- Price, T.; Wadewitz, P.; Cheney, D.; Seyfarth, R.; Hammerschmidt, K.; Fischer, J. Vervet revisited: A quantitative analysis of alarm call structure and context specificity. Sci. Rep. 2015, 5, 13220. [Google Scholar] [CrossRef] [PubMed]
- Riondato, I.; Cissello, E.; Papale, E.; Friard, O.; Gamba, M.; Giacoma, C. Unsupervised Acoustic Analysis of the Vocal Repertoire of the Gray-Shanked Douc Langur (Pygathrix cinerea). J. Comput. Acoust. 2017, 25, 1750018. [Google Scholar] [CrossRef]
- Bonadonna, G.; Torti, V.; Randrianarison, R.M.; Martinet, N.; Gamba, M.; Giacoma, C. Behavioral correlates of extra-pair copulation in Indri indri. Primates 2014, 55, 119–123. [Google Scholar] [CrossRef] [PubMed]
- Tecot, S.R. Seasonality and Predictability: The Hormonal and Behavioral Responses of the Red-Bellied Lemur, Eulemur rubriventer, in Southeastern Madagascar. Ph.D. Dissertation, University of Texas, Austin, TX, USA, 2008. [Google Scholar]
- Mitani, J.C. Comparative field studies of African ape vocal behavior. In Great Ape Societies; McGrew, W., Marchant, L., Nishida, T., Eds.; Cambridge University Press: Cambridge, UK, 1996; pp. 241–254. [Google Scholar] [CrossRef]
- Riondato, I.; Giuntini, M.; Gamba, M.; Giacoma, C. Vocalization of red- and grey-shanked douc langurs (Pygathrix nemaeus and P. cinerea). Vietnam. J. Primatol. 2013, 2, 75–82. [Google Scholar]
- Kawabe, M.; Mano, T. Ecology and behavior of the wild proboscis monkey, Nasalis larvatus (Wurmb), in Sabah, Malaysia. Primates 1972, 13, 213–227. [Google Scholar] [CrossRef]
- Röper, K.M.; Scheumann, M.; Wiechert, A.B.; Nathan, S.; Goossens, B.; Owren, M.K.; Zimmermann, E. Vocal acoustics in the endangered proboscis monkey (Nasalis larvatus). Am. J. Primatol. 2014, 76, 192–201. [Google Scholar] [CrossRef] [PubMed]
- Marler, P. On the origin of speech from animal sounds. In The Role of Speech in Language; Kavanagh, J.F., Cutting, J., Eds.; MIT Press: Cambridge, MA, USA, 1975; pp. 11–37. [Google Scholar]


| Cluster | CL | GR | WG | HU | KI | LT | RO | SB | ST | WH |
|---|---|---|---|---|---|---|---|---|---|---|
| 1st | 0.00 | 0.00 | 100.00 | 0.00 | 0.00 | 0.00 | 0.00 | 0.00 | 0.00 | 0.00 |
| 2nd | 0.00 | 0.00 | 0.00 | 0.00 | 0.00 | 0.00 | 0.00 | 100.00 | 0.00 | 0.00 |
| 3rd | 100.00 | 0.00 | 0.00 | 0.00 | 0.00 | 0.00 | 0.00 | 0.00 | 0.00 | 0.00 |
| 4th | 0.00 | 85.04 | 0.00 | 14.96 | 0.00 | 0.00 | 0.00 | 0.00 | 0.00 | 0.00 |
| 5th | 0.00 | 0.00 | 0.00 | 0.00 | 66.37 | 0.00 | 0.00 | 0.00 | 0.00 | 33.63 |
| 6th | 0.00 | 0.00 | 0.00 | 0.00 | 0.00 | 22.63 | 45.26 | 0.00 | 32.12 | 0.00 |
| 7th | 0.00 | 99.00 | 0.00 | 1.00 | 0.00 | 0.00 | 0.00 | 0.00 | 0.00 | 0.00 |
| 8nd | 0.00 | 17.94 | 0.00 | 82.06 | 0.00 | 0.00 | 0.00 | 0.00 | 0.00 | 0.00 |
| Vocal Type | TP Rate | FP Rate | Precision | Recall | F-Measure | MCC | ROC Area | PRC Area |
|---|---|---|---|---|---|---|---|---|
| CL | 0.99 | 0.00 | 0.99 | 0.99 | 0.99 | 0.988 | 1.00 | 1.00 |
| GR | 0.82 | 0.08 | 0.84 | 0.82 | 0.83 | 0.74 | 0.94 | 0.88 |
| GRH | 0.71 | 0.04 | 0.59 | 0.71 | 0.64 | 0.61 | 0.96 | 0.65 |
| HU | 0.83 | 0.02 | 0.85 | 0.83 | 0.84 | 0.81 | 0.98 | 0.90 |
| KI | 0.79 | 0.02 | 0.78 | 0.79 | 0.78 | 0.76 | 0.98 | 0. 87 |
| LT | 1.00 | 0.00 | 1.00 | 1.00 | 1.00 | 1.00 | 1.00 | 1.00 |
| RO | 0.81 | 0.00 | 1.00 | 0.81 | 0.90 | 0.90 | 1.00 | 0.98 |
| SB | 1.00 | 0.02 | 0.98 | 1.00 | 0.99 | 0.99 | 1.00 | 1.00 |
| ST | 0.69 | 0.00 | 0.75 | 0.70 | 0.72 | 0.72 | 0.98 | 0.76 |
| WH | 0.75 | 0.01 | 0.79 | 0.75 | 0.77 | 0.76 | 0.95 | 0.84 |
| Weighted Average | 0.86 | 0.04 | 0.86 | 0.86 | 0.86 | 0.82 | 0.97 | 0.90 |
| Classified As | A | B | C | D | E | F | G | H | I | J |
|---|---|---|---|---|---|---|---|---|---|---|
| CL | 99.03 | 0.00 | 0.00 | 0.00 | 0.00 | 0.00 | 0.00 | 0.00 | 0.00 | 4.76 |
| GR | 0.00 | 84.25 | 38.14 | 14.09 | 10.53 | 0.00 | 0.00 | 0.00 | 0.00 | 4.76 |
| GRH | 0.00 | 4. 99 | 58.76 | 0.00 | 4.21 | 0.00 | 0.00 | 0.00 | 0.00 | 0.00 |
| HU | 0.00 | 6.30 | 1.03 | 84.56 | 0.00 | 0.00 | 0.00 | 0.00 | 0.00 | 2.38 |
| KI | 0.00 | 3.15 | 1.03 | 0.67 | 77.89 | 0.00 | 0.00 | 0.00 | 16.67 | 9.52 |
| LT | 0.00 | 0.00 | 0.00 | 0.00 | 0.00 | 100.00 | 0.00 | 0.00 | 0.00 | 0.00 |
| RO | 0.97 | 0.00 | 0.00 | 0.00 | 0.00 | 0.00 | 100.00 | 2.00 | 0.00 | 0.00 |
| SB | 0.00 | 0.00 | 0.00 | 0.00 | 0.00 | 0.00 | 0.00 | 98.00 | 0.00 | 0.00 |
| ST | 0.00 | 0.79 | 0.00 | 0.67 | 0.00 | 0.00 | 0.00 | 0.00 | 75.00 | 0.00 |
| WH | 0.00 | 0.52 | 1.03 | 0.00 | 7.37 | 0.00 | 0.00 | 0.00 | 8.33 | 78.57 |
| Cluster | TP Rate | FP Rate | Precision | Recall | F-Measure | MCC | ROC Area | PRC Area |
|---|---|---|---|---|---|---|---|---|
| 3rd | 1.00 | 0.00 | 1.00 | 1.00 | 1.00 | 1.00 | 1.00 | 1.00 |
| 1st | 1.00 | 0.00 | 1.00 | 1.00 | 1.00 | 1.00 | 1.00 | 1.00 |
| 4th | 0.96 | 0.05 | 0.85 | 0.96 | 0.90 | 0.88 | 0.99 | 0.97 |
| 7th | 0.83 | 0.00 | 0.97 | 0.83 | 0.90 | 0.88 | 1.00 | 0.98 |
| 8th | 0.88 | 0.01 | 0.95 | 0.88 | 0.92 | 0.91 | 1.00 | 0.98 |
| 5th | 1.00 | 0.00 | 1.00 | 1.00 | 1.00 | 1.00 | 1.00 | 1.00 |
| 6th | 1.00 | 0.00 | 1.00 | 1.00 | 1.00 | 1.00 | 1.00 | 1.00 |
| 2nd | 1.00 | 0.00 | 1.00 | 1.00 | 1.00 | 1.00 | 1.00 | 1.00 |
| Weighted Average | 0.95 | 0.01 | 0.96 | 0.95 | 0.95 | 0.95 | 1.00 | 0.99 |
| Classified as | A | B | C | D | E | F | G | H |
|---|---|---|---|---|---|---|---|---|
| 3rd | 100.00 | 0.00 | 0.00 | 0.00 | 0.00 | 0.00 | 0.00 | 0.00 |
| 1st | 0.00 | 100.00 | 0.00 | 0.00 | 0.00 | 0.00 | 0.00 | 0.00 |
| 4th | 0.00 | 0.00 | 85.35 | 3.08 | 5.00 | 0.00 | 0.00 | 0.00 |
| 7th | 0.00 | 0.00 | 9.16 | 96.92 | 0.00 | 0.00 | 0.00 | 0.00 |
| 8th | 0.00 | 0.00 | 5.49 | 0.00 | 95.00 | 0.00 | 0.00 | 0.00 |
| 5th | 0.00 | 0.00 | 0.00 | 0.00 | 0.00 | 100.00 | 0.00 | 0.00 |
| 6th | 0.00 | 0.00 | 0.00 | 0.00 | 0.00 | 0.00 | 100.00 | 0.00 |
| 2nd | 0.00 | 0.00 | 0.00 | 0.00 | 0.00 | 0.00 | 0.00 | 100.00 |
© 2019 by the authors. Licensee MDPI, Basel, Switzerland. This article is an open access article distributed under the terms and conditions of the Creative Commons Attribution (CC BY) license (http://creativecommons.org/licenses/by/4.0/).
Share and Cite
Valente, D.; De Gregorio, C.; Torti, V.; Miaretsoa, L.; Friard, O.; Randrianarison, R.M.; Giacoma, C.; Gamba, M. Finding Meanings in Low Dimensional Structures: Stochastic Neighbor Embedding Applied to the Analysis of Indri indri Vocal Repertoire. Animals 2019, 9, 243. https://doi.org/10.3390/ani9050243
Valente D, De Gregorio C, Torti V, Miaretsoa L, Friard O, Randrianarison RM, Giacoma C, Gamba M. Finding Meanings in Low Dimensional Structures: Stochastic Neighbor Embedding Applied to the Analysis of Indri indri Vocal Repertoire. Animals. 2019; 9(5):243. https://doi.org/10.3390/ani9050243
Chicago/Turabian StyleValente, Daria, Chiara De Gregorio, Valeria Torti, Longondraza Miaretsoa, Olivier Friard, Rose Marie Randrianarison, Cristina Giacoma, and Marco Gamba. 2019. "Finding Meanings in Low Dimensional Structures: Stochastic Neighbor Embedding Applied to the Analysis of Indri indri Vocal Repertoire" Animals 9, no. 5: 243. https://doi.org/10.3390/ani9050243
APA StyleValente, D., De Gregorio, C., Torti, V., Miaretsoa, L., Friard, O., Randrianarison, R. M., Giacoma, C., & Gamba, M. (2019). Finding Meanings in Low Dimensional Structures: Stochastic Neighbor Embedding Applied to the Analysis of Indri indri Vocal Repertoire. Animals, 9(5), 243. https://doi.org/10.3390/ani9050243