A Comprehensive Analysis of Runs of Homozygosity of Eleven Cattle Breeds Representing Different Production Types

 , , ,
, , , 
Simple Summary
Abstract
1. Introduction
2. Materials and Methods
2.1. Research Material, Genotyping and Data Filtering
2.2. Identification of ROH
2.3. Determination of Inbreeding Coefficient Based on ROH
2.4. Identification of Genome Regions with a High Frequency of ROH Occurrence
3. Results
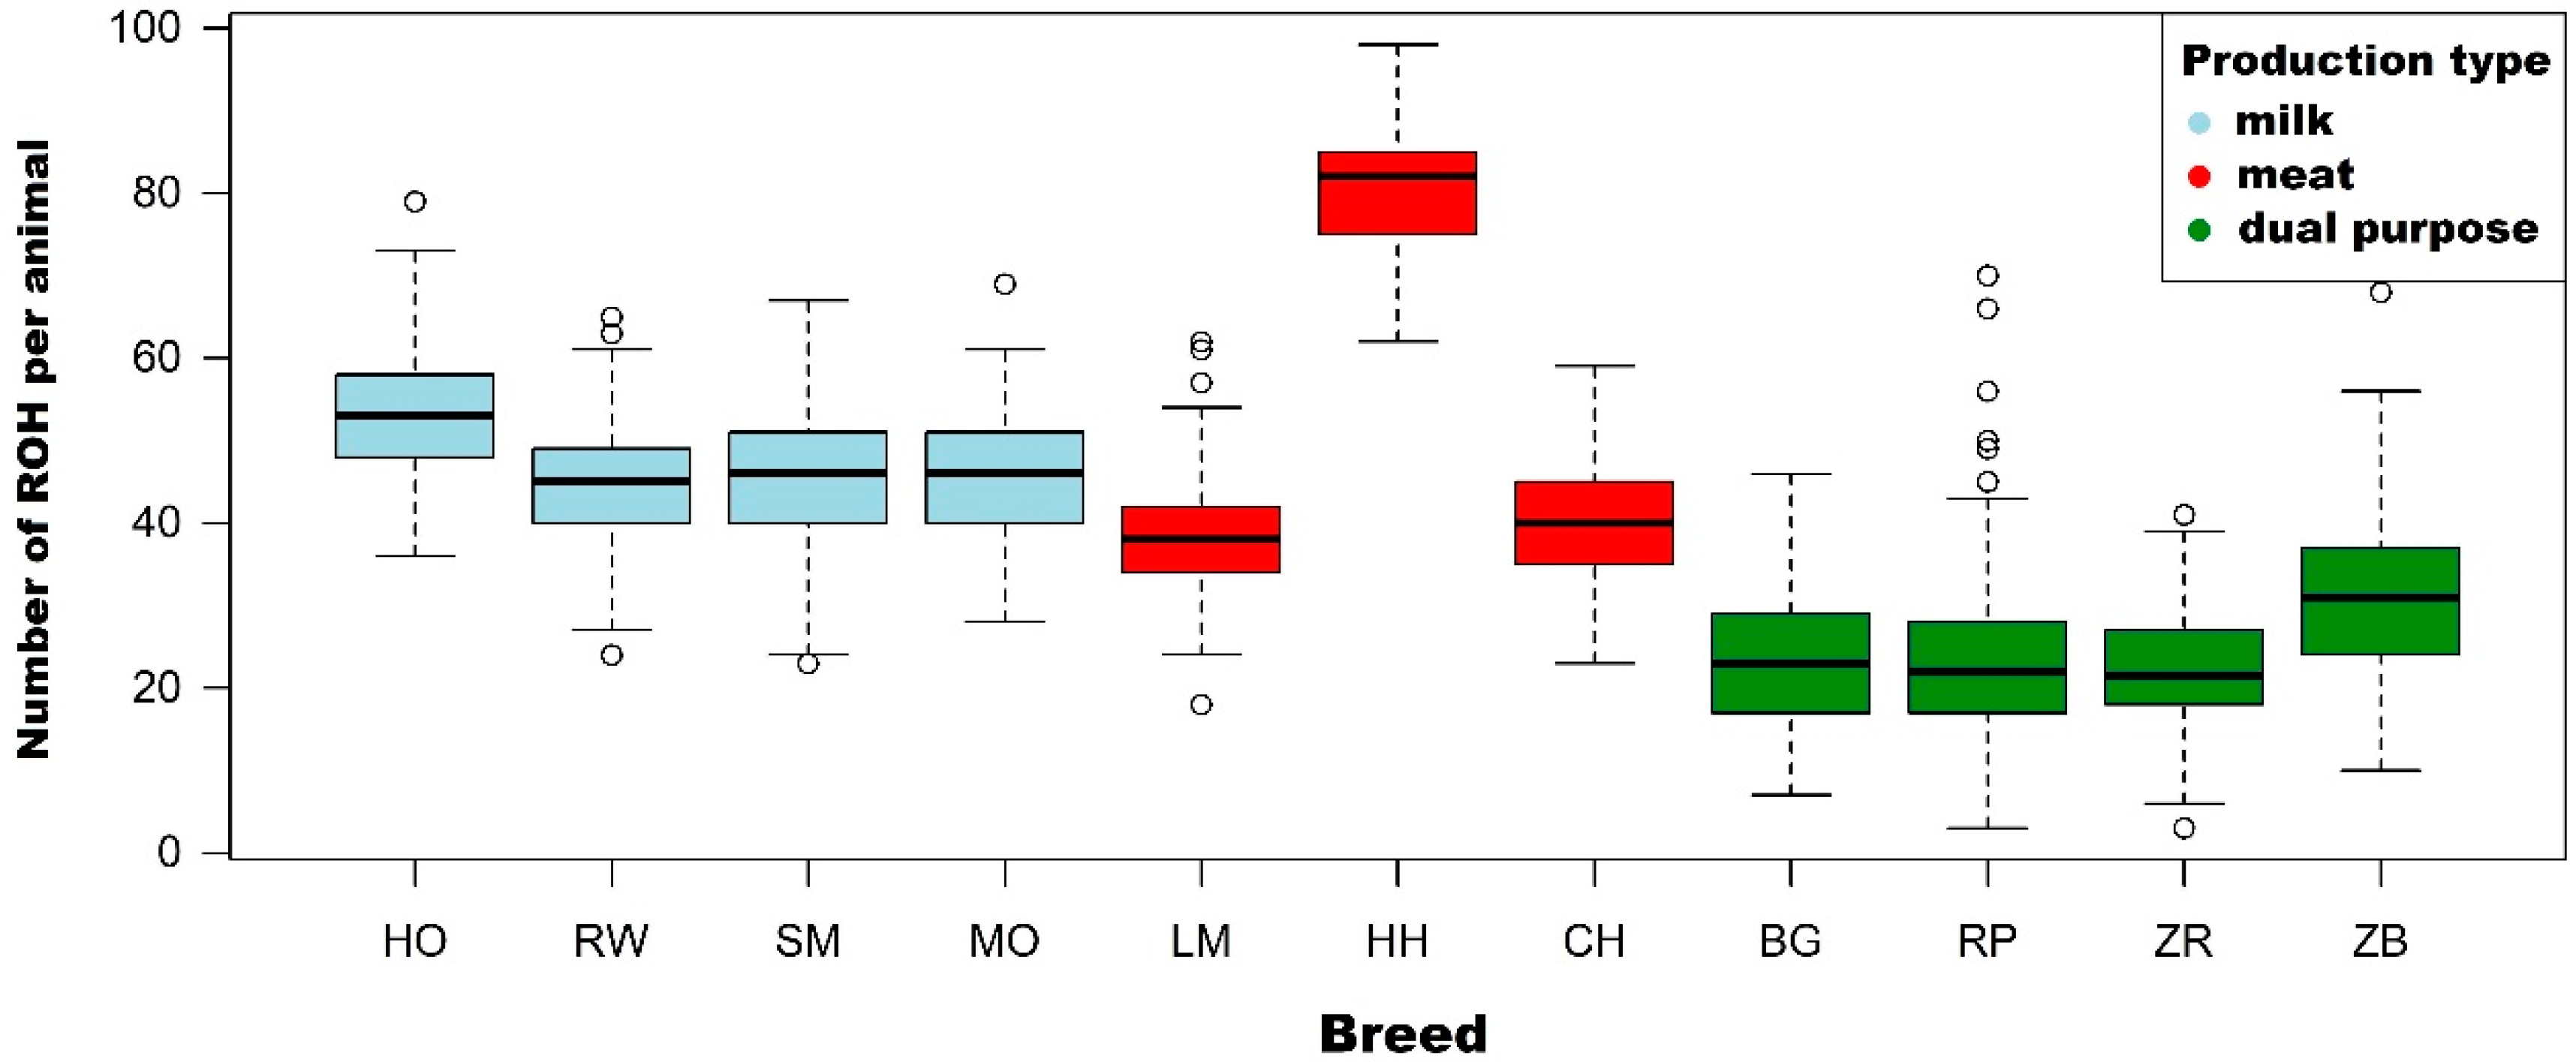
3.1. Characteristics of Runs of Homozygosity
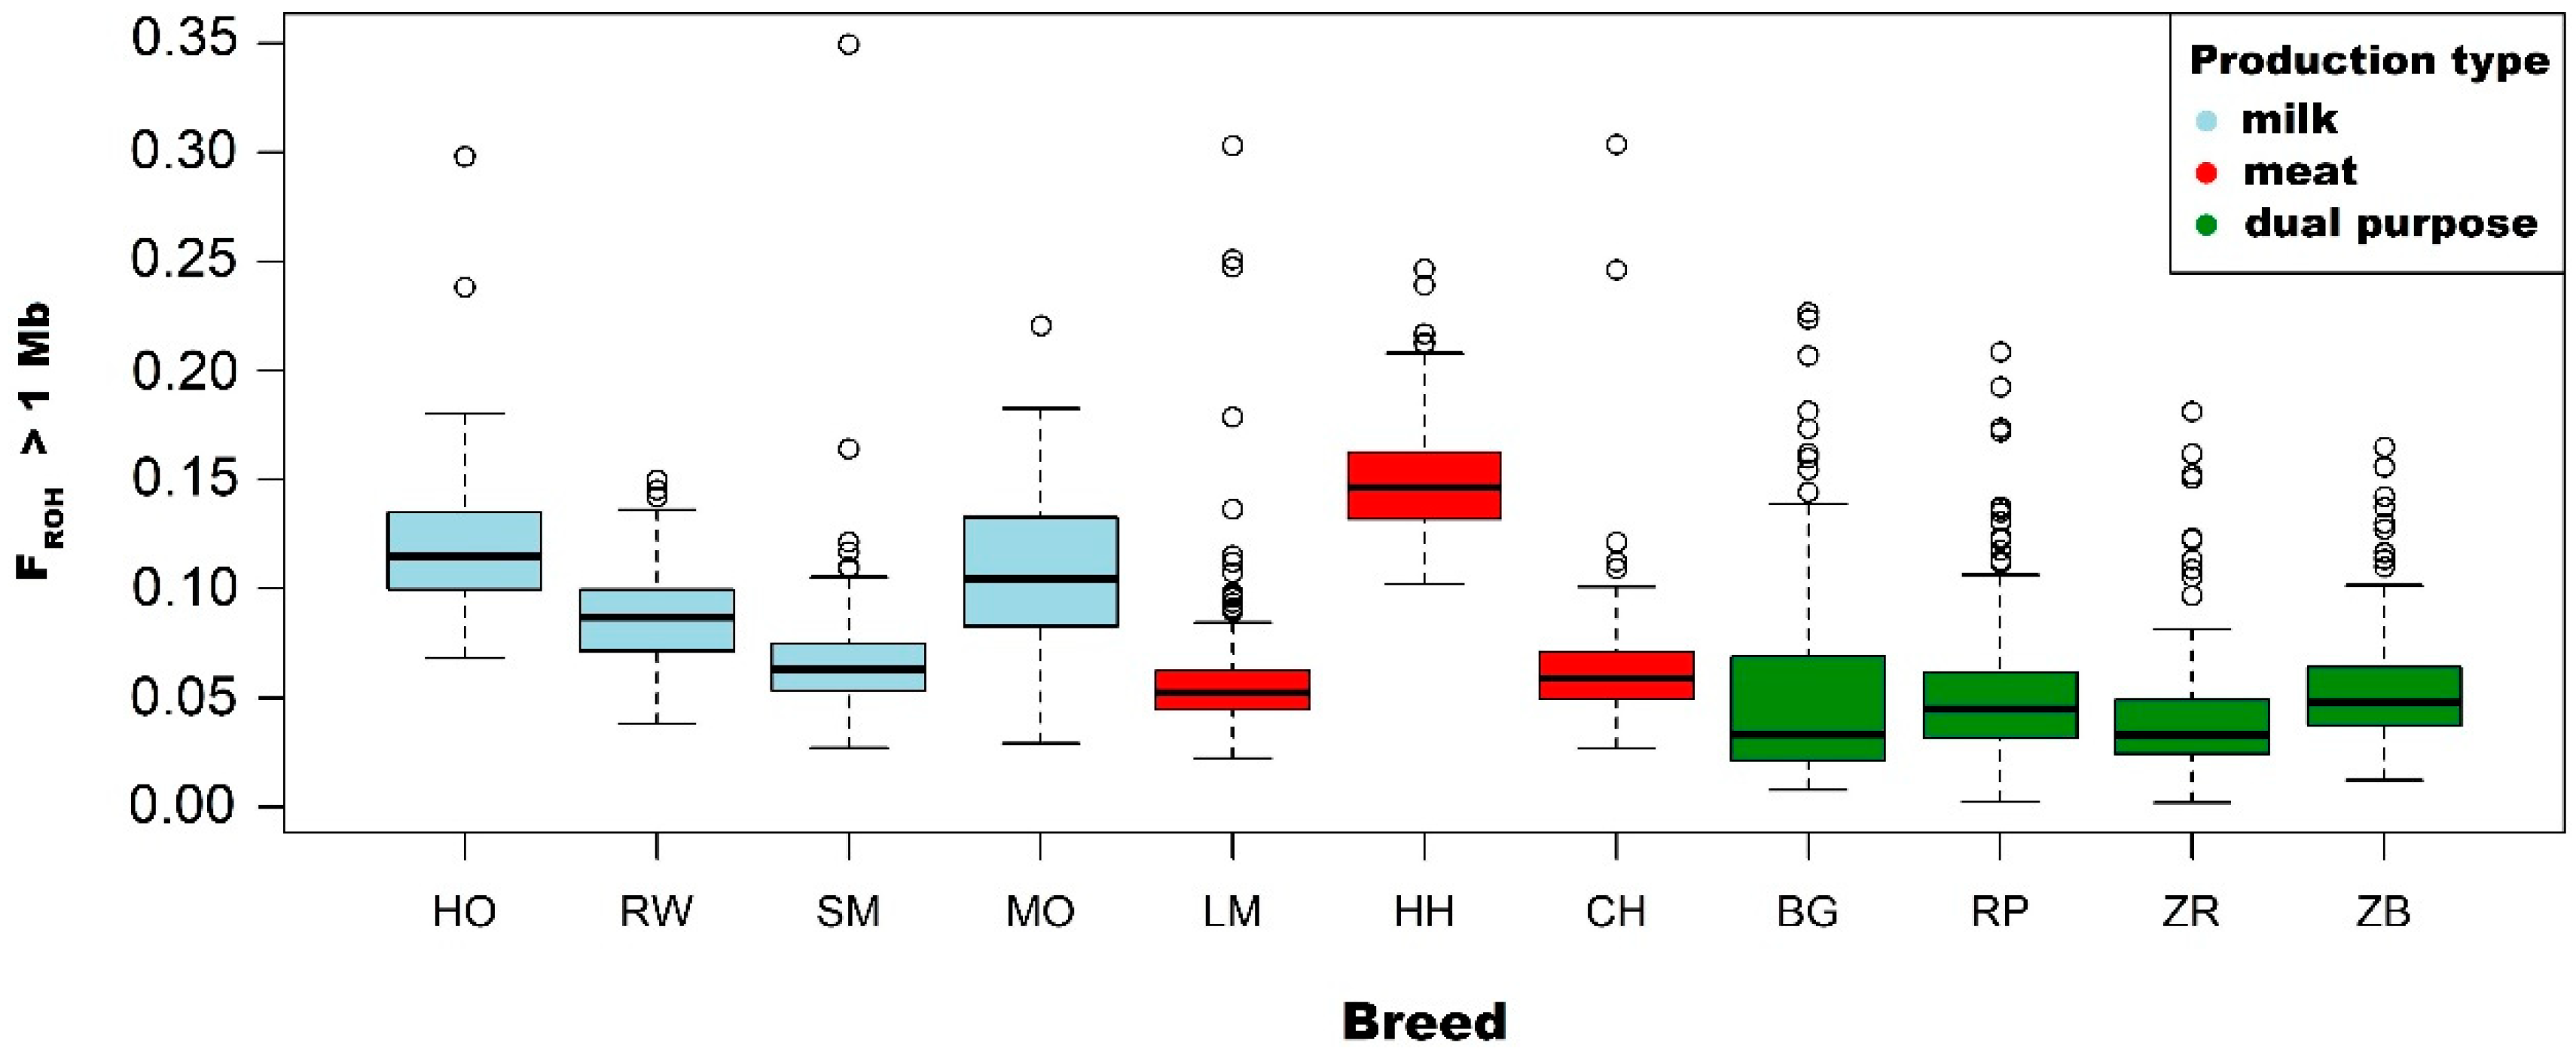
3.2. Analysis of the FROH Inbreeding Coefficient
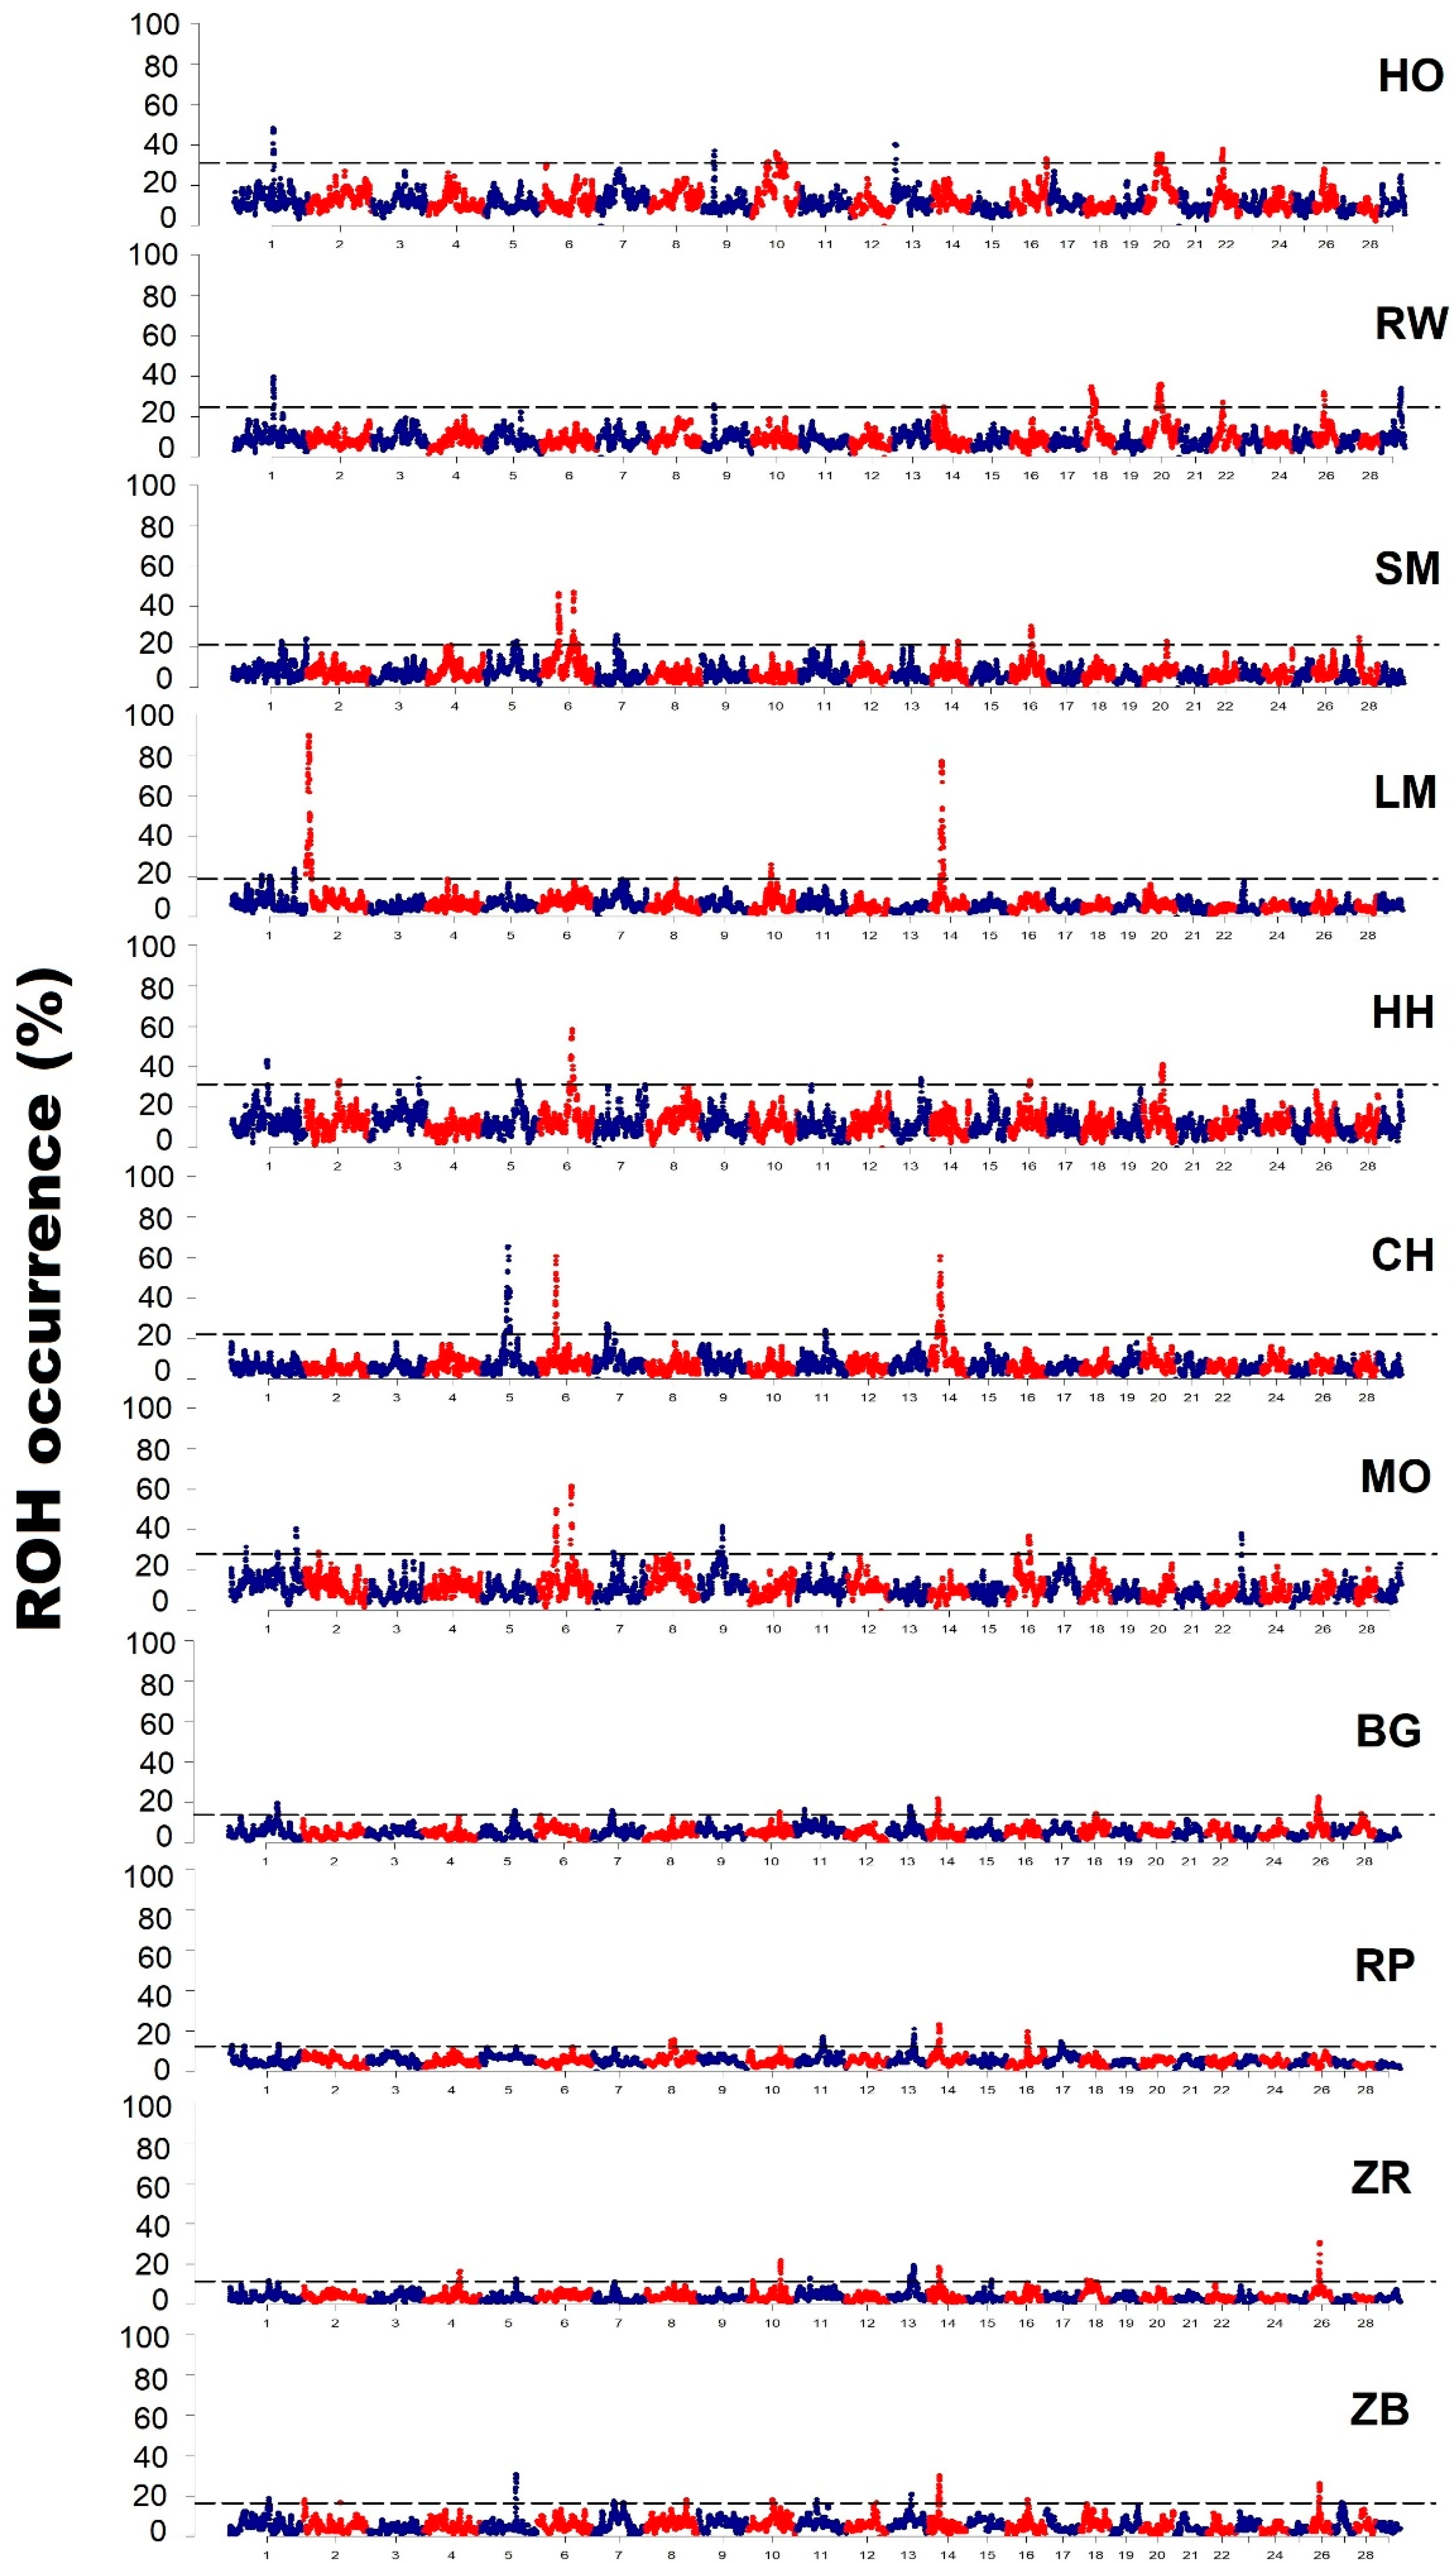
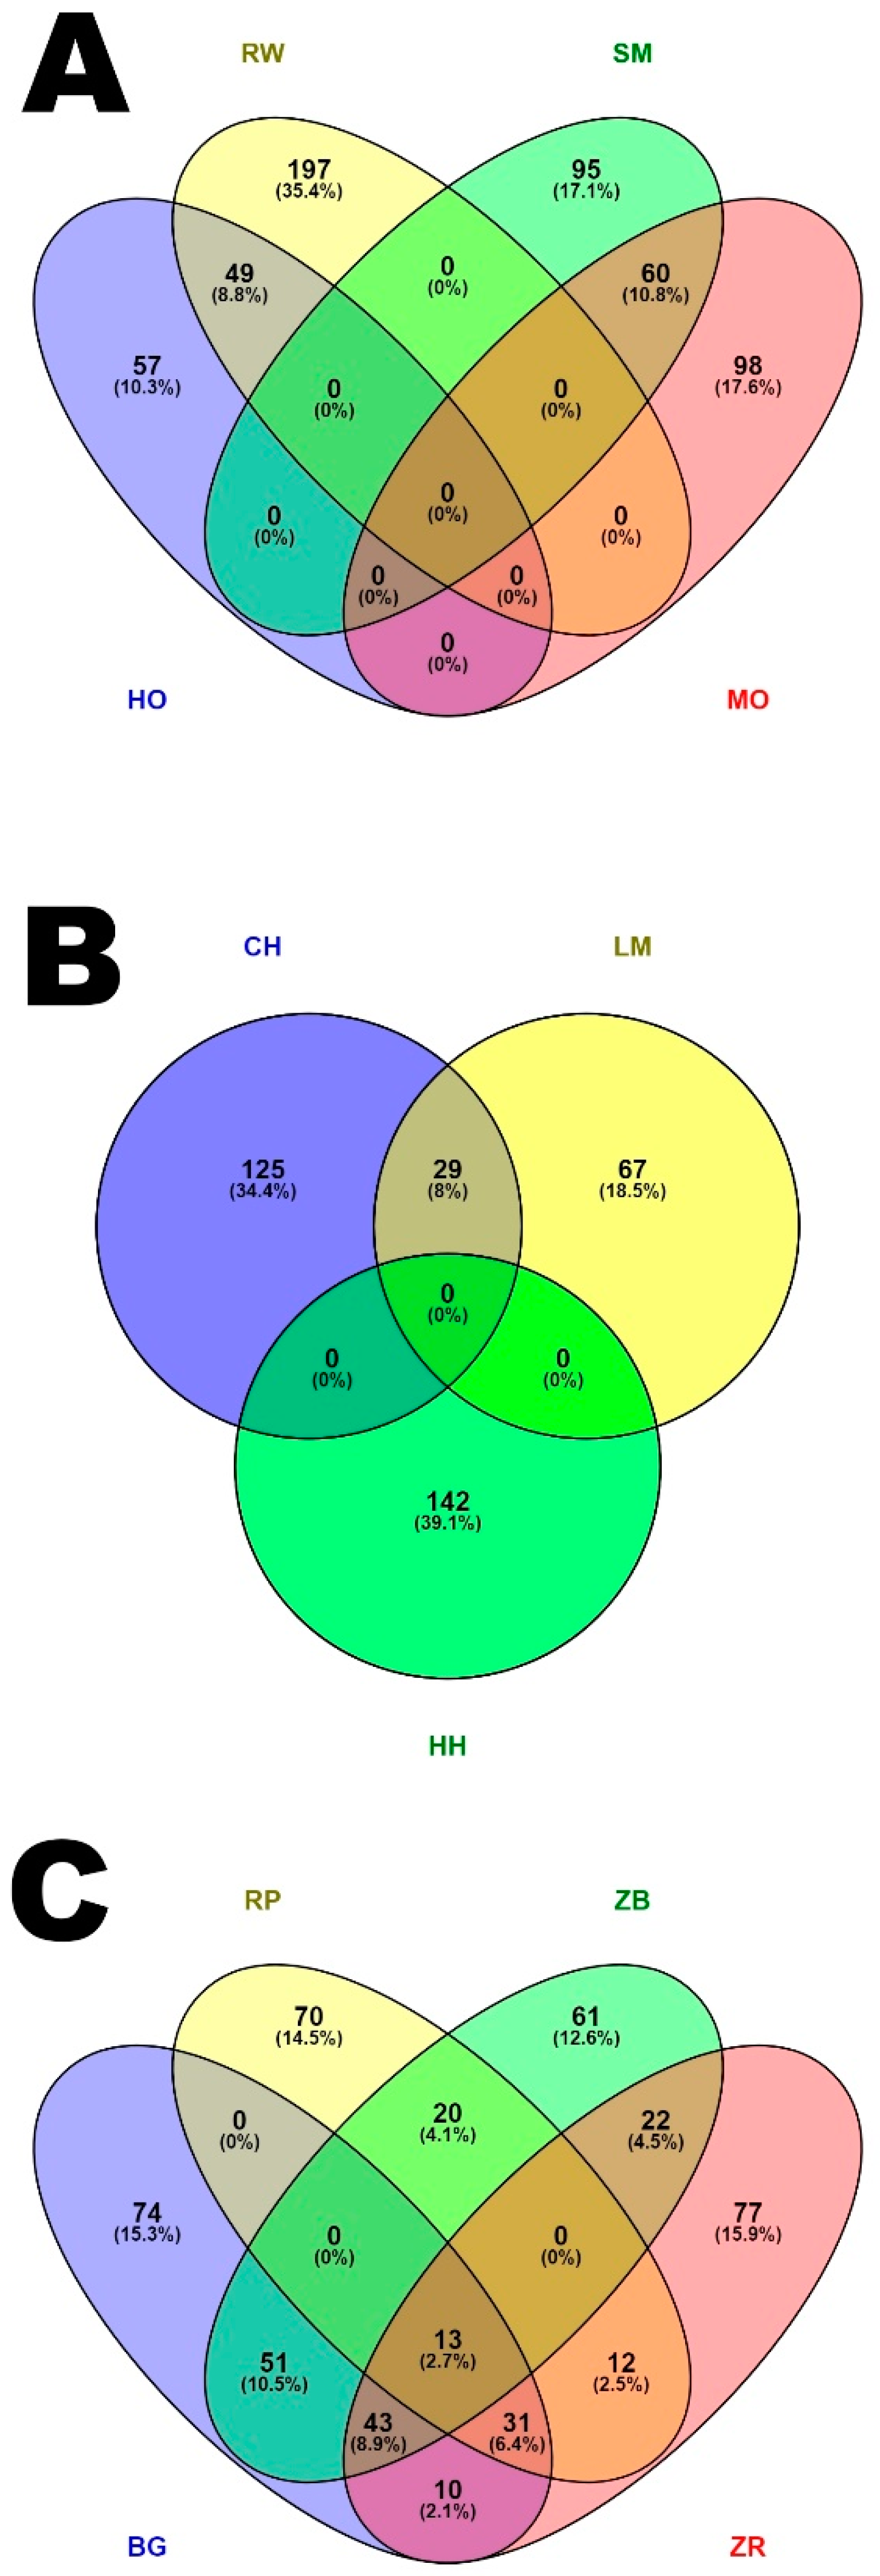
3.3. Characteristics of Genomic Regions with a High Frequency of ROH Occurrence
4. Discussion
4.1. Characteristics of Runs of Homozygosity
4.2. Runs of Homozygosity as a Tool of Inbreeding Estimation
4.3. Analysis of Genomic Regions with a High Frequency of ROH Occurrence
5. Conclusions
Supplementary Materials
Author Contributions
Funding
Conflicts of Interest
References
- Purfield, D.C.; Berry, D.P.; McParland, S.; Bradley, D.G. Runs of homozygosity and population history in cattle. BMC Genet. 2012, 13, 70. [Google Scholar] [CrossRef]
- Ceballos, F.C.; Hazelhurst, S.; Ramsay, M. Assessing runs of Homozygosity: A comparison of SNP Array and whole genome sequence low coverage data. BMC Genom. 2018, 19, 106. [Google Scholar] [CrossRef]
- Curik, I.; Ferenčaković, M.; Sölkner, J. Inbreeding and runs of homozygosity: A possible solution to an old problem. Livest. Sci. 2014, 166, 26–34. [Google Scholar] [CrossRef]
- McQuillan, R.; Leutenegger, A.-L.; Abdel-Rahman, R.; Franklin, C.S.; Pericic, M.; Barac-Lauc, L.; Smolej-Narancic, N.; Janicijevic, B.; Polasek, O.; Tenesa, A.; et al. Runs of homozygosity in European populations. Am. J. Hum. Genet. 2008, 83, 359–372. [Google Scholar] [CrossRef] [PubMed]
- Ferencakovic, M.; Hamzic, E.; Gredler, B.; Curik, I.; Sölkner, J. Runs of homozygosity reveal genomewide autozygosity in the Austrian Fleckvieh cattle. Agric. Conspec. Sci. 2011, 76, 325–328. [Google Scholar]
- Smith, J.M.; Haigh, J. The hitch-hiking effect of a favourable gene. Genet. Res. 1974, 23, 23–35. [Google Scholar] [CrossRef] [PubMed]
- Sabeti, P.C.; Reich, D.E.; Higgins, J.M.; Levine, H.Z.P.; Richter, D.J.; Schaffner, S.F.; Gabriel, S.B.; Platko, J.V.; Patterson, N.J.; McDonald, G.J.; et al. Detecting recent positive selection in the human genome from haplotype structure. Nature 2002, 419, 832–837. [Google Scholar] [CrossRef]
- Stella, A.; Ajmone-Marsan, P.; Lazzari, B.; Boettcher, P. Identification of selection signatures in cattle breeds selected for dairy production. Genetics 2010, 185, 1451–1461. [Google Scholar] [CrossRef]
- Sabeti, P.C.; Varilly, P.; Fry, B.; Lohmueller, J.; Hostetter, E.; Cotsapas, C.; Xie, X.; Byrne, E.H.; McCarroll, S.A.; Gaudet, R.; et al. Genome-wide detection and characterization of positive selection in human populations. Nature 2007, 449, 913–918. [Google Scholar] [CrossRef]
- Quilez, J.; Short, A.D.; Martínez, V.; Kennedy, L.J.; Ollier, W.; Sanchez, A.; Altet, L.; Francino, O. A selective sweep of >8 Mb on chromosome 26 in the Boxer genome. BMC Genom. 2011, 12, 339. [Google Scholar] [CrossRef]
- Ramey, H.R.; Decker, J.E.; McKay, S.D.; Rolf, M.M.; Schnabel, R.D.; Taylor, J.F. Detection of selective sweeps in cattle using genome-wide SNP data. BMC Genom. 2013, 14, 382. [Google Scholar] [CrossRef] [PubMed]
- Bosse, M.; Megens, H.J.; Madsen, O.; Paudel, Y.; Frantz, L.A.F.; Schook, L.B.; Crooijmans, R.P.M.A.; Groenen, M.A.M. Regions of Homozygosity in the Porcine Genome: Consequence of Demography and the Recombination Landscape. PLoS Genet. 2012, 8, e1003100. [Google Scholar] [CrossRef] [PubMed]
- Nothnagel, M.; Lu, T.T.; Kayser, M.; Krawczak, M. Genomic and geographic distribution of SNP-defined runs of homozygosity in Europeans. Hum. Mol. Genet. 2010, 19, 2927–2935. [Google Scholar] [CrossRef]
- Pemberton, T.J.; Absher, D.; Feldman, M.W.; Myers, R.M.; Rosenberg, N.A.; Li, J.Z. Genomic patterns of homozygosity in worldwide human populations. Am. J. Hum. Genet. 2012, 91, 275–292. [Google Scholar] [CrossRef]
- Karimi, Z. Runs of Homozygosity patterns in Taurine and Indicine cattle breeds. Arrumar 2013, 1, 1–53. [Google Scholar]
- Peripolli, E.; Munari, D.P.; Silva, M.V.G.B.; Lima, A.L.F.; Irgang, R.; Baldi, F. Runs of homozygosity: Current knowledge and applications in livestock. Anim. Genet. 2017, 48, 255–271. [Google Scholar] [CrossRef]
- Szmatoła, T.; Gurgul, A.; Ropka-Molik, K.; Jasielczuk, I.; Zabek, T.; Bugno-Poniewierska, M. Characteristics of runs of homozygosity in selected cattle breeds maintained in Poland. Livest. Sci. 2016, 188, 72–80. [Google Scholar] [CrossRef]
- Zhang, L.; Orloff, M.S.; Reber, S.; Li, S.; Zhao, Y.; Eng, C. cgaTOH: Extended Approach for Identifying Tracts of Homozygosity. PLoS ONE 2013, 8, e57772. [Google Scholar] [CrossRef]
- Howrigan, D.P.; Simonson, M.A.; Keller, M.C. Detecting autozygosity through runs of homozygosity: A comparison of three autozygosity detection algorithms. BMC Genom. 2011, 12, 460. [Google Scholar] [CrossRef]
- Ferenčaković, M.; Hamzić, E.; Gredler, B.; Solberg, T.R.; Klemetsdal, G.; Curik, I.; Sölkner, J. Estimates of autozygosity derived from runs of homozygosity: Empirical evidence from selected cattle populations. J. Anim. Breed. Genet. 2013, 130, 286–293. [Google Scholar] [CrossRef]
- James Kent, W.; Sugnet, C.W.; Furey, T.S.; Roskin, K.M.; Pringle, T.H.; Zahler, A.M.; Haussler, D. The human genome browser at UCSC. Genome Res. 2002, 12, 996–1006. [Google Scholar] [CrossRef] [PubMed]
- Thomas, P.D.; Campbell, M.J.; Kejariwal, A.; Mi, H.; Karlak, B.; Daverman, R.; Diemer, K.; Muruganujan, A.; Narechania, A. PANTHER: A library of protein families and subfamilies indexed by function. Genome Res. 2003, 13, 2129–2141. [Google Scholar] [CrossRef] [PubMed]
- Iacolina, L.; Stronen, A.V.; Pertoldi, C.; Tokarska, M.; Nørgaard, L.S.; Muñoz, J.; Kjærsgaard, A.; Ruiz-Gonzalez, A.; Kaminski, S.; Purfield, D.C. Novel graphical analyses of runs of homozygosity among species and livestock breeds. Int. J. Genom. 2016, 2016, 2152847. [Google Scholar] [CrossRef] [PubMed]
- Peripolli, E.; Stafuzza, N.B.; Munari, D.P.; Lima, A.L.F.; Irgang, R.; Machado, M.A.; do Carmo Panetto, J.C.; Ventura, R.V.; Baldi, F.; da Silva, M.V.G.B. Assessment of runs of homozygosity islands and estimates of genomic inbreeding in Gyr (Bos indicus) dairy cattle. BMC Genom. 2018, 19, 34. [Google Scholar] [CrossRef]
- Zhang, Q.; Guldbrandtsen, B.; Bosse, M.; Lund, M.S.; Sahana, G. Runs of homozygosity and distribution of functional variants in the cattle genome. BMC Genom. 2015, 16, 542. [Google Scholar] [CrossRef]
- Marras, G.; Gaspa, G.; Sorbolini, S.; Dimauro, C.; Ajmone-Marsan, P.; Valentini, A.; Williams, J.L.; MacCiotta, N.P.P. Analysis of runs of homozygosity and their relationship with inbreeding in five cattle breeds farmed in Italy. Anim. Genet. 2015, 46, 110–121. [Google Scholar] [CrossRef] [PubMed]
- Kim, E.S.; Cole, J.B.; Huson, H.; Wiggans, G.R.; van Tassel, C.P.; Crooker, B.A.; Liu, G.; Da, Y.; Sonstegard, T.S. Effect of artificial selection on runs of homozygosity in U.S. Holstein cattle. PLoS ONE 2013, 8, e80813. [Google Scholar] [CrossRef]
- Ferenčaković, M.; Sölkner, J.; Curik, I. Estimating autozygosity from high-throughput information: Effects of SNP density and genotyping errors. Genet. Sel. Evol. 2013, 45, 42. [Google Scholar] [CrossRef]
- Gurgul, A.; Szmatoła, T.; Topolski, P.; Jasielczuk, I.; Żukowski, K.; Bugno-Poniewierska, M. The use of runs of homozygosity for estimation of recent inbreeding in Holstein cattle. J. Appl. Genet. 2016, 57, 527–530. [Google Scholar] [CrossRef]
- Hauke, J.; Kossowski, T. Comparison of values of pearson’s and spearman’s correlation coefficients on the same sets of data. Quaest. Geogr. 2011, 30, 87–93. [Google Scholar] [CrossRef]
- Saura, M.; Fernández, A.; Varona, L.; Fernández, A.I.; De Cara, M.Á.R.; Barragán, C.; Villanueva, B. Detecting inbreeding depression for reproductive traits in Iberian pigs using genome-wide data. Genet. Sel. Evol. 2015, 47, 1. [Google Scholar] [CrossRef] [PubMed]
- Scraggs, E.; Zanella, R.; Wojtowicz, A.; Taylor, J.F.; Gaskins, C.T.; Reeves, J.J.; de Avila, J.M.; Neibergs, H.L. Estimation of inbreeding and effective population size of full-blood wagyu cattle registered with the American Wagyu Cattle Association. J. Anim. Breed. Genet. 2014, 131, 3–10. [Google Scholar] [CrossRef] [PubMed]
- Kim, E.-S.; Sonstegard, T.S.; van Tassell, C.P.; Wiggans, G.; Rothschild, M.F. The Relationship between Runs of Homozygosity and Inbreeding in Jersey Cattle under Selection. PLoS ONE 2015, 10, e0129967. [Google Scholar] [CrossRef] [PubMed]
- Bjelland, D.W.; Weigel, K.A.; Vukasinovic, N.; Nkrumah, J.D. Evaluation of inbreeding depression in Holstein cattle using whole-genome SNP markers and alternative measures of genomic inbreeding. J. Dairy Sci. 2013, 96, 4697–4706. [Google Scholar] [CrossRef]
- Esmailizadeh, A.K.; Bottema, C.D.K.; Sellick, G.S.; Verbyla, A.P.; Morris, C.A.; Cullen, N.G.; Pitchford, W.S. Effects of the myostatin F94L substitution on beef traits. J. Anim. Sci. 2008, 86, 1038–1046. [Google Scholar] [CrossRef]
- Figeac, N.; Serralbo, O.; Marcelle, C.; Zammit, P.S. ErbB3 binding protein-1 (Ebp1) controls proliferation and myogenic differentiation of muscle stem cells. Dev. Biol. 2014, 386, 135–151. [Google Scholar] [CrossRef]
- Mendias, C.L.; Gumucio, J.P.; Davis, M.E.; Bromley, C.W.; Davis, C.S.; Brooks, S.V. Transforming growth factor-beta induces skeletal muscle atrophy and fibrosis through the induction of atrogin-1 and scleraxis. Muscle Nerve 2012, 45, 55–59. [Google Scholar] [CrossRef]
- Kühn, C.; Weikard, R. An investigation into the genetic background of coat colour dilution in a Charolais × German Holstein F2 resource population. Anim. Genet. 2007, 38, 109–113. [Google Scholar] [CrossRef]
- Siegenthaler, G.; Hotz, R.; Chatellard-Gruaz, D.; Didierjean, L.; Hellman, U.; Saurat, J.H. Purification and characterization of the human epidermal fatty acid-binding protein: Localization during epidermal cell differentiation in vivo and in vitro. Biochem. J. 1994, 302 Pt 2, 363–371. [Google Scholar] [CrossRef]
- Goszczynski, D.E.; Papaleo-Mazzucco, J.; Ripoli, M.V.; Villarreal, E.L.; Rogberg-Muñoz, A.; Mezzadra, C.A.; Melucci, L.M.; Giovambattista, G. Genetic Variation in FABP4 and Evaluation of Its Effects on Beef Cattle Fat Content. Anim. Biotechnol. 2017, 28, 211–219. [Google Scholar] [CrossRef]
- Zhou, H.; Cheng, L.; Azimu, W.; Hodge, S.; Edwards, G.R.; Hickford, J.G.H. Variation in the bovine FABP4 gene affects milk yield and milk protein content in dairy cows. Sci. Rep. 2015, 5, 10023. [Google Scholar] [CrossRef] [PubMed]
- Mészáros, G.; Boison, S.A.; Pérez O’Brien, A.M.; Ferenčaković, M.; Curik, I.; da Silva, M.V.B.; Utsunomiya, Y.T.; Garcia, J.F.; Sölkner, J. Genomic analysis for managing small and endangered populations: A case study in Tyrol Grey cattle. Front. Genet. 2015, 6, 173. [Google Scholar] [PubMed]
- Sölkner, J.; Ferenčaković, M.; Karimi, Z.; O‘Brien, A.M.P.; Mészáros, G.; Eaglen, S.; Boison, S.A.; Curik, I. Extremely Non-uniform: Patterns of Runs of Homozygosity in Bovine Populations. In Proceedings of the 10th World Congress on Genetics Applied to Livestock Production, Vancouver, BC, Canada, 17–22 August 2014. [Google Scholar]
- Cohen, M.; Reichenstein, M.; Everts-van der Wind, A.; Heon-Lee, J.; Shani, M.; Lewin, H.A.; Weller, J.I.; Ron, M.; Seroussi, E. Cloning and characterization of FAM13A1—A gene near a milk protein QTL on BTA6: Evidence for population-wide linkage disequilibrium in Israeli Holsteins. Genomics 2004, 84, 374–383. [Google Scholar] [CrossRef] [PubMed]
- Cohen-Zinder, M.; Seroussi, E.; Larkin, D.M.; Loor, J.J.; Everts-van der Wind, A.; Lee, J.-H.; Drackley, J.K.; Band, M.R.; Hernandez, A.G.; Shani, M.; et al. Identification of a missense mutation in the bovine ABCG2 gene with a major effect on the QTL on chromosome 6 affecting milk yield and composition in Holstein cattle. Genome Res. 2005, 15, 936–944. [Google Scholar] [CrossRef] [PubMed]
- Cobanoglu, O.; Zaitoun, I.; Chang, Y.M.; Shook, G.E.; Khatib, H. Effects of the Signal Transducer and Activator of Transcription 1 (STAT1) Gene on Milk Production Traits in Holstein Dairy Cattle. J. Dairy Sci. 2006, 89, 4433–4437. [Google Scholar] [CrossRef]
- Sun, D.; Jia, J.; Ma, Y.; Wang, Y.; Yu, Y.; Zhang, Y. Effects of DGAT1 and GHR on milk yield and milk composition in the Chinese dairy population. Anim. Genet. 2009, 40, 997–1000. [Google Scholar] [CrossRef]
- Rahmatalla, S.A.; Müller, U.; Strucken, E.M.; Reissmann, M.; Brockmann, G.A. The F279Y polymorphism of the GHR gene and its relation to milk production and somatic cell score in German Holstein dairy cattle. J. Appl. Genet. 2011, 52, 459–465. [Google Scholar] [CrossRef]
- Kaiser, U.B.; Katzenellenbogen, R.A.; Conn, P.M.; Chin, W.W. Evidence that signalling pathways by which thyrotropin-releasing hormone and gonadotropin-releasing hormone act are both common and distinct. Mol. Endocrinol. 1994, 8, 1038–1048. [Google Scholar]
- Plaut, K.; Bauman, D.E.; Agergaard, N.; Akers, R.M. Effect of exogenous prolactin administration on lactational performance of dairy cows. Domest. Anim. Endocrinol. 1987, 4, 279–290. [Google Scholar] [CrossRef]
- Hartnell, G.F.; Franson, S.E.; Bauman, D.E.; Head, H.H.; Huber, J.T.; Lamb, R.C.; Madsen, K.S.; Cole, W.J.; Hintz, R.L. Evaluation of Sometribove in a Prolonged-Release System in Lactating Dairy Cows—Production Responses. J. Dairy Sci. 1991, 74, 2645–2663. [Google Scholar] [CrossRef]
- Liu, S.; Dontu, G.; Mantle, I.D.; Patel, S.; Ahn, N.S.; Jackson, K.W.; Suri, P.; Wicha, M.S. Hedgehog signaling and Bmi-1 regulate self-renewal of normal and malignant human mammary stem cells. Cancer Res. 2006, 66, 6063–6071. [Google Scholar] [CrossRef] [PubMed]
- Le Guillou, S.; Marthey, S.; Laloë, D.; Laubier, J.; Mobuchon, L.; Leroux, C.; Le Provost, F. Characterisation and Comparison of Lactating Mouse and Bovine Mammary Gland miRNomes. PLoS ONE 2014, 9, e91938. [Google Scholar] [CrossRef] [PubMed]
- Ramirez, R.A.; Lee, A.; Schedin, P.; Russell, J.S.; Masso-Welch, P.A. Alterations in mast cell frequency and relationship to angiogenesis in the rat mammary gland during windows of physiologic tissue remodeling. Dev. Dyn. 2012, 241, 890–900. [Google Scholar] [CrossRef] [PubMed]
- Pausch, H.; Flisikowski, K.; Jung, S.; Emmerling, R.; Edel, C.; Götz, K.U.; Fries, R. Genome-wide association study identifies two major loci affecting calving ease and growth-related traits in cattle. Genetics 2011, 187, 289–297. [Google Scholar] [CrossRef] [PubMed]
- Utsunomiya, Y.T.; do Carmo, A.S.; Carvalheiro, R.; Neves, H.H.R.; Matos, M.C.; Zavarez, L.B.; Pérez O’Brien, A.M.; Sölkner, J.; McEwan, J.C.; Cole, J.B.; et al. Genome-wide association study for birth weight in Nellore cattle points to previously described orthologous genes affecting human and bovine height. BMC Genet. 2013, 14, 52. [Google Scholar] [CrossRef]
- Zhao, F.; McParland, S.; Kearney, F.; Du, L.; Berry, D.P. Detection of selection signatures in dairy and beef cattle using high-density genomic information. Genet. Sel. Evol. 2015, 47, 49. [Google Scholar] [CrossRef]
- Takasuga, A. PLAG1 and NCAPG-LCORL in livestock. Anim. Sci. J. 2016, 87, 159–167. [Google Scholar] [CrossRef]
- Lindholm-Perry, A.K.; Kuehn, L.A.; Smith, T.P.L.; Ferrell, C.L.; Jenkins, T.G.; Freetly, H.C.; Snelling, W.M. A region on BTA14 that includes the positional candidate genes LYPLA1, XKR4 and TMEM68 is associated with feed intake and growth phenotypes in cattle. Anim. Genet. 2012, 43, 216–219. [Google Scholar] [CrossRef]
- Seabury, C.M.; Oldeschulte, D.L.; Saatchi, M.; Beever, J.E.; Decker, J.E.; Halley, Y.A.; Bhattarai, E.K.; Molaei, M.; Freetly, H.C.; Hansen, S.L.; et al. Genome-wide association study for feed efficiency and growth traits in U.S. beef cattle. BMC Genom. 2017, 18, 386. [Google Scholar] [CrossRef]
- Boettcher, P. Breeding for improvement of functional traits in dairy cattle. Ital. J. Anim. Sci. 2005, 4, 7–16. [Google Scholar] [CrossRef]
- Charlesworth, D.; Willis, J.H. The genetics of inbreeding depression. Nat. Rev. Genet. 2009, 10, 783–796. [Google Scholar] [CrossRef] [PubMed]


| Breed | Number of Individuals | Production Type * |
|---|---|---|
| Holstein-Friesian Black-and-White variety (HO) | 299 | M |
| Holstein-Friesian Red-and-White variety (RW) | 231 | M |
| Simmental (SM) | 161 | M |
| Limusin (LM) | 197 | MS |
| Hereford (HH) | 77 | MS |
| Charolais (CH) | 99 | MS |
| Montbeliarde (MO) | 86 | M |
| White-Backed (BG) | 136 | D |
| Polish Red (RP) | 283 | D |
| Polish Red-and-White (ZR) | 210 | D |
| Polish black and white (ZB) | 152 | D |
| Breed | Statistics | ROH Length Category (Mb) | |||||
|---|---|---|---|---|---|---|---|
| 1+ | 2+ | 4+ | 8+ | 16+ | |||
| Holstein-Friesian Black-and-White variety (n = 299) | Number of ROH per animal | Mean | 53.3 | 42.3 | 22.4 | 10.1 | 3.0 |
| SD | 7.3 | 6.8 | 5.2 | 3.4 | 1.9 | ||
| Min | 36 | 26 | 9 | 2 | 0 | ||
| Max | 79 | 70 | 52 | 32 | 12 | ||
| Length of ROH per animal (Mb) | Mean | 295.1 | 277.0 | 220.8 | 151.3 | 74.2 | |
| SD | 68.5 | 68.6 | 67.6 | 63.1 | 52.4 | ||
| Min | 170.4 | 151.0 | 77.8 | 25.3 | 0 | ||
| Max | 745.0 | 729.2 | 678.7 | 557.0 | 402.0 | ||
| Holstein-Friesian Red-and-White variety (n = 231) | Number of ROH per animal | Mean | 44.3 | 33.8 | 16.5 | 6.7 | 1.9 |
| SD | 7.0 | 6.6 | 4.9 | 2.9 | 1.5 | ||
| Min | 24 | 18 | 6 | 1 | 0 | ||
| Max | 65 | 57 | 35 | 17 | 8 | ||
| Length of ROH per animal (Mb) | Mean | 216.7 | 199.4 | 150.7 | 96.0 | 43.0 | |
| SD | 53.4 | 53.9 | 52.5 | 45.0 | 34.3 | ||
| Min | 95.3 | 82.8 | 41.5 | 13.3 | 0 | ||
| Max | 375.1 | 361.5 | 316.6 | 225.6 | 185.6 | ||
| Simmental (n = 161) | Number of ROH per animal | Mean | 46.1 | 32.0 | 10.7 | 3.1 | 0.8 |
| SD | 8.3 | 7.4 | 4.4 | 2.9 | 1.7 | ||
| Min | 23 | 15 | 2 | 0 | 0 | ||
| Max | 67 | 57 | 32 | 26 | 18 | ||
| Length of ROH per animal (Mb) | Mean | 169.1 | 146.0 | 87.4 | 50.0 | 22.0 | |
| SD | 74.8 | 75.3 | 71.9 | 69.7 | 56.9 | ||
| Min | 68.0 | 49.6 | 9.2 | 0 | 0 | ||
| Max | 874.1 | 859.0 | 787.2 | 755.2 | 661.3 | ||
| Limousin (n = 197) | Number of ROH per animal | Mean | 38.5 | 26.2 | 9.2 | 3.1 | 1.0 |
| SD | 6.9 | 6.0 | 4.6 | 3.2 | 2.1 | ||
| Min | 18 | 13 | 1 | 0 | 0 | ||
| Max | 62 | 50 | 35 | 28 | 17 | ||
| Length of ROH per animal (Mb) | Mean | 147.4 | 127.1 | 80.3 | 47.5 | 27.8 | |
| SD | 80.5 | 80.1 | 80.3 | 76.4 | 68.6 | ||
| Min | 56.0 | 48.1 | 4.4 | 0 | 0 | ||
| Max | 757.9 | 746.0 | 709.9 | 670.2 | 556.6 | ||
| Hereford (n = 77) | Number of ROH per animal | Mean | 80.6 | 66.5 | 31.4 | 9.6 | 2.3 |
| SD | 7.5 | 7.0 | 5.7 | 4.0 | 2.0 | ||
| Min | 62 | 47 | 19 | 4 | 0 | ||
| Max | 98 | 84 | 51 | 25 | 8 | ||
| Length of ROH per animal (Mb) | Mean | 378.0 | 354.5 | 253.4 | 134.0 | 56.4 | |
| SD | 73.9 | 74.4 | 75.7 | 71.6 | 53.3 | ||
| Min | 255.0 | 228.4 | 135.8 | 40.5 | 0 | ||
| Max | 616.5 | 593.1 | 509.3 | 376.9 | 228.3 | ||
| Charolais (n = 99) | Number of ROH per animal | Mean | 40.0 | 29.2 | 11.9 | 3.6 | 0.8 |
| SD | 7.7 | 6.6 | 5.0 | 3.5 | 1.9 | ||
| Min | 23 | 15 | 3 | 0 | 0 | ||
| Max | 59 | 49 | 40 | 23 | 13 | ||
| Length of ROH per animal (Mb) | Mean | 163.2 | 145.6 | 97.2 | 52.5 | 21.8 | |
| SD | 87.4 | 87.1 | 88.2 | 84.4 | 68.7 | ||
| Min | 66.9 | 50.6 | 19.4 | 0 | 0 | ||
| Max | 759.0 | 737.4 | 699.0 | 662.2 | 555.0 | ||
| Montbeliarde (n = 86) | Number of ROH per animal | Mean | 45.9 | 34.2 | 17.6 | 9.2 | 3.6 |
| SD | 7.5 | 6.8 | 5.4 | 4.0 | 2.2 | ||
| Min | 28 | 16 | 4 | 0 | 0 | ||
| Max | 69 | 51 | 33 | 20 | 12 | ||
| Length of ROH per animal (Mb) | Mean | 269.8 | 251.0 | 204.7 | 157.6 | 94.8 | |
| SD | 85.4 | 86.6 | 86.4 | 80.6 | 65.2 | ||
| Min | 73.2 | 54.1 | 21.3 | 0 | 0 | ||
| Max | 551.6 | 540.2 | 506.5 | 453.0 | 345.4 | ||
| White-Backed (n = 136) | Number of ROH per animal | Mean | 23.9 | 17.1 | 8.5 | 3.8 | 1.5 |
| SD | 8.9 | 8.4 | 6.9 | 4.5 | 2.6 | ||
| Min | 7 | 5 | 1 | 0 | 0 | ||
| Max | 46 | 42 | 31 | 21 | 12 | ||
| Length of ROH per animal (Mb) | Mean | 127.6 | 116.6 | 93.0 | 67.4 | 42.2 | |
| SD | 113.4 | 113.4 | 111.2 | 100.0 | 80.4 | ||
| Min | 19.3 | 15.1 | 4.4 | 0 | 0 | ||
| Max | 566.6 | 559.9 | 529.4 | 477.4 | 391.3 | ||
| Polish Red (n = 283) | Number of ROH per animal | Mean | 23.3 | 17.7 | 9.5 | 4.3 | 1.3 |
| SD | 9.4 | 8.4 | 5.3 | 3.2 | 1.5 | ||
| Min | 3 | 1 | 0 | 0 | 0 | ||
| Max | 70 | 64 | 34 | 18 | 8 | ||
| Length of ROH per animal (Mb) | Mean | 131.7 | 122.3 | 98.8 | 69.0 | 35.1 | |
| SD | 86.1 | 84.8 | 76.1 | 64.9 | 48.9 | ||
| Min | 6.0 | 2.4 | 0 | 0 | 0 | ||
| Max | 521.6 | 511.6 | 454.7 | 382.1 | 298.7 | ||
| Polish Red-and-White (n = 210) | Number of ROH per animal | Mean | 21.8 | 14.4 | 5.1 | 2.2 | 0.6 |
| SD | 7.2 | 5.8 | 3.6 | 2.5 | 1.4 | ||
| Min | 3 | 0 | 0 | 0 | 0 | ||
| Max | 41 | 32 | 18 | 13 | 9 | ||
| Length of ROH per animal (Mb) | Mean | 105.7 | 91.2 | 61.3 | 38.4 | 18.7 | |
| SD | 74.6 | 71.2 | 65.4 | 57.6 | 46.0 | ||
| Min | 5.0 | 0 | 0 | 0 | 0 | ||
| Max | 453.1 | 436.0 | 399.2 | 358.3 | 336.3 | ||
| Polish Black-and-White (n = 152) | Number of ROH per animal | Mean | 30.8 | 21.8 | 9.0 | 3.6 | 1.0 |
| SD | 9.5 | 7.6 | 4.9 | 3.0 | 1.6 | ||
| Min | 10 | 6 | 0 | 0 | 0 | ||
| Max | 68 | 41 | 23 | 13 | 8 | ||
| Length of ROH per animal (Mb) | Mean | 135.8 | 120.7 | 84.9 | 54.4 | 25.0 | |
| SD | 71.1 | 69.4 | 66.7 | 58.7 | 48.3 | ||
| Min | 31.2 | 20.3 | 0 | 0 | 0 | ||
| Max | 412.5 | 401.0 | 377.7 | 342.5 | 277.5 | ||
| Breed | Statistics | ROH Length Category (Mb) | ||||
|---|---|---|---|---|---|---|
| 1+ | 2+ | 4+ | 8+ | 16+ | ||
| Holstein-Friesian Black-and-White variety | Mean | 0.118 | 0.111 | 0.088 | 0.061 | 0.029 |
| SD | 0.027 | 0.027 | 0.027 | 0.025 | 0.021 | |
| Min | 0.068 | 0.060 | 0.031 | 0.010 | 0.000 | |
| Max | 0.298 | 0.292 | 0.271 | 0.223 | 0.161 | |
| Holstein-Friesian Red-and-White variety | Mean | 0.087 | 0.080 | 0.060 | 0.038 | 0.017 |
| SD | 0.021 | 0.022 | 0.021 | 0.018 | 0.014 | |
| Min | 0.038 | 0.033 | 0.017 | 0.005 | 0.000 | |
| Max | 0.150 | 0.145 | 0.127 | 0.090 | 0.074 | |
| Simmental | Mean | 0.068 | 0.068 | 0.035 | 0.019 | 0.009 |
| SD | 0.030 | 0.030 | 0.029 | 0.028 | 0.023 | |
| Min | 0.027 | 0.020 | 0.004 | 0.000 | 0.000 | |
| Max | 0.350 | 0.344 | 0.315 | 0.302 | 0.265 | |
| Limousin | Mean | 0.059 | 0.051 | 0.032 | 0.019 | 0.011 |
| SD | 0.032 | 0.032 | 0.032 | 0.031 | 0.027 | |
| Min | 0.022 | 0.019 | 0.002 | 0.000 | 0.000 | |
| Max | 0.303 | 0.298 | 0.284 | 0.268 | 0.223 | |
| Hereford | Mean | 0.151 | 0.142 | 0.101 | 0.054 | 0.023 |
| SD | 0.029 | 0.029 | 0.030 | 0.029 | 0.021 | |
| Min | 0.102 | 0.091 | 0.054 | 0.016 | 0.000 | |
| Max | 0.247 | 0.237 | 0.204 | 0.151 | 0.091 | |
| Charolais | Mean | 0.065 | 0.058 | 0.039 | 0.021 | 0.009 |
| SD | 0.035 | 0.035 | 0.035 | 0.033 | 0.027 | |
| Min | 0.027 | 0.020 | 0.007 | 0.000 | 0.000 | |
| Max | 0.304 | 0.295 | 0.280 | 0.265 | 0.222 | |
| Montbeliarde | Mean | 0.108 | 0.100 | 0.082 | 0.063 | 0.038 |
| SD | 0.034 | 0.034 | 0.035 | 0.032 | 0.026 | |
| Min | 0.029 | 0.022 | 0.009 | 0.000 | 0.000 | |
| Max | 0.221 | 0.216 | 0.203 | 0.181 | 0.138 | |
| White-Backed | Mean | 0.051 | 0.047 | 0.037 | 0.027 | 0.017 |
| SD | 0.045 | 0.045 | 0.044 | 0.040 | 0.032 | |
| Min | 0.008 | 0.006 | 0.002 | 0.000 | 0.000 | |
| Max | 0.227 | 0.224 | 0.212 | 0.191 | 0.157 | |
| Polish Red | Mean | 0.053 | 0.049 | 0.040 | 0.028 | 0.014 |
| SD | 0.034 | 0.034 | 0.030 | 0.026 | 0.019 | |
| Min | 0.002 | 0.001 | 0.000 | 0.000 | 0.000 | |
| Max | 0.209 | 0.205 | 0.182 | 0.153 | 0.120 | |
| Polish Red-and-White | Mean | 0.042 | 0.036 | 0.025 | 0.015 | 0.007 |
| SD | 0.030 | 0.029 | 0.026 | 0.023 | 0.018 | |
| Min | 0.002 | 0.000 | 0.000 | 0.000 | 0.000 | |
| Max | 0.181 | 0.174 | 0.160 | 0.143 | 0.135 | |
| Polish Black-and-White | Mean | 0.054 | 0.048 | 0.034 | 0.022 | 0.010 |
| SD | 0.028 | 0.028 | 0.027 | 0.023 | 0.019 | |
| Min | 0.012 | 0.008 | 0.000 | 0.000 | 0.000 | |
| Max | 0.165 | 0.160 | 0.151 | 0.137 | 0.111 | |
| Breed | Chromosome | Start (bp) | End (bp) | Number of SNPs | Length of the Region (kb) |
|---|---|---|---|---|---|
| Holstein-Friesian Black-and-White variety | 1 | 82,928,948 | 85,264,656 | 46 | 2365 |
| 9 | 24,369,582 | 25,408,468 | 20 | 1038 | |
| 10 | 36,486,868 | 36,807,581 | 6 | 320 | |
| 10 | 52,190,618 | 61,064,570 | 128 | 8873 | |
| 13 | 4,755,215 | 6,822,805 | 40 | 2067 | |
| 16 | 74,532,751 | 75,892,097 | 28 | 1359 | |
| 20 | 25,850,728 | 32,074,342 | 73 | 6223 | |
| 20 | 34,728,244 | 36,917,645 | 41 | 2189 | |
| 22 | 21,266,612 | 23,914,818 | 44 | 2648 | |
| Holstein-Friesian Red-and-White variety | 1 | 82,951,366 | 85,525,315 | 46 | 2573 |
| 9 | 24,369,582 | 25,359,074 | 19 | 989 | |
| 14 | 25,254,540 | 25,638,580 | 6 | 384 | |
| 18 | 13,901,770 | 18,449,746 | 77 | 4547 | |
| 18 | 23,196,347 | 25,471,374 | 44 | 2275 | |
| 20 | 24,544,146 | 36,311,419 | 149 | 11,767 | |
| 22 | 23,365,188 | 23,914,818 | 12 | 549 | |
| 26 | 21,180,893 | 23,071,595 | 35 | 1890 | |
| 29 | 40,858,913 | 440,85,769 | 57 | 3226 | |
| Simmental | 1 | 103,675,933 | 105,570,832 | 31 | 1894 |
| 1 | 155,955,828 | 156,710,174 | 14 | 754 | |
| 4 | 50,547,931 | 51,370,504 | 6 | 822 | |
| 5 | 63,555,403 | 64,190,317 | 9 | 634 | |
| 5 | 70,338,965 | 71,546,802 | 18 | 1207 | |
| 6 | 37,252,345 | 42,714,287 | 132 | 5461 | |
| 6 | 65,217,698 | 65,978,639 | 8 | 760 | |
| 6 | 67,752,994 | 73,254,801 | 78 | 5501 | |
| 6 | 81,499,583 | 82,047,313 | 7 | 547 | |
| 7 | 41,565,963 | 46,354,401 | 72 | 4788 | |
| 12 | 26,967,177 | 27,337,843 | 9 | 370 | |
| 14 | 57,672,324 | 58,740,723 | 16 | 1068 | |
| 16 | 42,892,437 | 45,552,538 | 29 | 2660 | |
| 16 | 46,069,918 | 47,201,903 | 18 | 1131 | |
| 20 | 48,114,351 | 50,086,666 | 35 | 1972 | |
| 28 | 2,181,928 | 2,924,302 | 5 | 742 | |
| Limousin | 1 | 63,421,529 | 64,276,370 | 14 | 854 |
| 1 | 80,548,510 | 81,656,974 | 12 | 1108 | |
| 1 | 1.33 × 10⁸ | 1.35 × 10⁸ | 26 | 1597 | |
| 2 | 35,126 | 12,632,490 | 206 | 12,597 | |
| 4 | 45,577,225 | 46,381,877 | 6 | 804 | |
| 7 | 58,809,602 | 58,923,345 | 4 | 113 | |
| 10 | 45,864,066 | 47,664,187 | 36 | 1800 | |
| 14 | 22,643,306 | 29,543,761 | 134 | 6900 | |
| Hereford | 1 | 73,757,146 | 76,938,175 | 47 | 3181 |
| 2 | 68,877,969 | 72,583,890 | 32 | 3705 | |
| 3 | 1.05 × 10⁸ | 1.06 × 10⁸ | 14 | 521 | |
| 5 | 75,114,559 | 79,165,498 | 62 | 4050 | |
| 6 | 65,380,200 | 74,354,100 | 131 | 8973 | |
| 7 | 1.07 × 10⁸ | 1.08 × 10⁸ | 27 | 1237 | |
| 11 | 28,946,979 | 29,079,159 | 4 | 132 | |
| 13 | 64,253,779 | 65,817,864 | 21 | 1564 | |
| 16 | 43,371,269 | 45,376,614 | 25 | 2005 | |
| 20 | 39,538,676 | 44,414,152 | 96 | 4875 | |
| Charolais | 5 | 53,263,967 | 62,180,846 | 94 | 8916 |
| 6 | 36,708,862 | 40,063,618 | 72 | 3354 | |
| 7 | 28,182,762 | 31,973,748 | 50 | 3790 | |
| 11 | 60,738,925 | 61,700,872 | 11 | 961 | |
| 14 | 18,756,025 | 29,543,761 | 191 | 10787 | |
| Montbeliarde | 1 | 32,509,969 | 33,036,107 | 11 | 526 |
| 1 | 99,477,567 | 1.01 × 10⁸ | 29 | 1385 | |
| 1 | 1.39 × 10⁸ | 1.42 × 10⁸ | 41 | 2840 | |
| 2 | 29,055,572 | 29,627,722 | 16 | 572 | |
| 6 | 36,829,725 | 40,580,921 | 82 | 3751 | |
| 6 | 70,349,791 | 73,092,782 | 55 | 2742 | |
| 7 | 41,805,531 | 44,136,041 | 37 | 2330 | |
| 8 | 49,981,054 | 50,725,941 | 18 | 744 | |
| 9 | 40,287,003 | 44,951,803 | 42 | 4664 | |
| 9 | 46,351,157 | 50,728,426 | 67 | 4377 | |
| 11 | 72,069,940 | 72,864,887 | 12 | 794 | |
| 16 | 22,179,895 | 23,037,476 | 7 | 857 | |
| 16 | 43,424,406 | 47,558,131 | 50 | 4133 | |
| 23 | 9,020,371 | 10,665,897 | 34 | 1645 | |
| White-Backed | 1 | 1.02 × 10⁸ | 1.06 × 10⁸ | 68 | 4203 |
| 5 | 75,794,378 | 77,311,671 | 33 | 1517 | |
| 6 | 9,404,648 | 10,424,905 | 10 | 1020 | |
| 7 | 42,521,261 | 46,626,888 | 38 | 4105 | |
| 10 | 70,894,537 | 71,985,171 | 27 | 1090 | |
| 11 | 20,558,025 | 21,817,694 | 36 | 1259 | |
| 13 | 47,546,608 | 50,701,854 | 37 | 3155 | |
| 13 | 53,618,942 | 55,006,836 | 21 | 1387 | |
| 14 | 24,145,838 | 26,473,490 | 44 | 2327 | |
| 18 | 36,146,356 | 38,147,823 | 25 | 2001 | |
| 26 | 18,335,079 | 24,531,763 | 100 | 6196 | |
| 26 | 25,170,222 | 25,657,642 | 10 | 487 | |
| 28 | 16,727,989 | 17,304,235 | 14 | 576 | |
| Polish Red | 1 | 4,648,383 | 5,351,369 | 12 | 702 |
| 1 | 31,269,020 | 31,551,425 | 3 | 282 | |
| 1 | 1.04 × 10⁸ | 1.05 × 10⁸ | 13 | 1042 | |
| 8 | 55,145,132 | 57,339,395 | 39 | 2194 | |
| 8 | 58,789,069 | 60,589,007 | 34 | 1799 | |
| 8 | 61,536,940 | 63,000,189 | 32 | 1463 | |
| 8 | 63,162,363 | 63,901,386 | 16 | 739 | |
| 11 | 55,809,281 | 60,250,739 | 49 | 4441 | |
| 13 | 53,347,036 | 57,016,938 | 68 | 3669 | |
| 14 | 23,384,687 | 26,597,692 | 57 | 3213 | |
| 16 | 42,892,437 | 46,625,869 | 37 | 3733 | |
| 17 | 34,139,617 | 37,933,239 | 42 | 3793 | |
| Polish Red-and-White | 1 | 83,838,758 | 83,916,372 | 3 | 77 |
| 4 | 75,890,428 | 77,635,835 | 31 | 1745 | |
| 5 | 76,317,361 | 77,311,671 | 26 | 994 | |
| 10 | 11,707,725 | 12,020,216 | 6 | 312 | |
| 10 | 70,736,766 | 72,202,330 | 33 | 1465 | |
| 11 | 29,822,671 | 30,945,111 | 31 | 1122 | |
| 13 | 46,150,079 | 47,990,990 | 40 | 1840 | |
| 13 | 50,950,127 | 51,165,507 | 4 | 215 | |
| 13 | 52,837,622 | 56,190,025 | 57 | 3352 | |
| 14 | 24,275,232 | 28,332,133 | 45 | 4056 | |
| 15 | 52,311,393 | 52,910,307 | 14 | 598 | |
| 18 | 13,901,770 | 15,594,562 | 26 | 1692 | |
| 18 | 23,196,347 | 23,949,849 | 21 | 753 | |
| 26 | 19,727,292 | 23,461,479 | 63 | 3734 | |
| Polish Black-and-White | 1 | 82,787,221 | 84,515,050 | 19 | 1727 |
| 2 | 784,712 | 2,415,461 | 36 | 1630 | |
| 2 | 78,556,325 | 80,096,393 | 30 | 1540 | |
| 5 | 75,627,333 | 77,679,706 | 43 | 2052 | |
| 7 | 44,901,489 | 47,213,804 | 22 | 2312 | |
| 7 | 66,303,743 | 66,645,827 | 7 | 342 | |
| 8 | 87,308,122 | 88,974,063 | 26 | 1665 | |
| 10 | 52,606,823 | 54,514,075 | 44 | 1907 | |
| 10 | 56,464,919 | 56,812,824 | 3 | 347 | |
| 11 | 44,061,322 | 45,008,048 | 20 | 946 | |
| 12 | 65,092,442 | 65,481,742 | 6 | 389 | |
| 13 | 48,485,992 | 50,813,233 | 32 | 2327 | |
| 14 | 23,054,179 | 26,542,736 | 61 | 3488 | |
| 16 | 43,810,410 | 45,017,787 | 14 | 1207 | |
| 18 | 14,115,136 | 15,099,438 | 14 | 984 | |
| 26 | 20,365,711 | 23,129,849 | 45 | 2764 | |
| 27 | 17,593,646 | 18,991,970 | 27 | 1398 |
| Biological Processes/Breeds | The Number of Genes Involved in the Process | ||||||||||
|---|---|---|---|---|---|---|---|---|---|---|---|
| HO | RW | SM | LM | HH | CH | MO | BG | RP | ZB | ZR | |
| Organization of cellular components or biogenesis (GO: 0071840) | 11 | 21 | 21 | 14 | 17 | 21 | 16 | 33 | 21 | 31 | 24 |
| Cellular processes (GO: 0009987) | 47 | 98 | 76 | 42 | 77 | 73 | 65 | 103 | 71 | 109 | 96 |
| Location (GO: 0051179) | 7 | 25 | 16 | 9 | 26 | 13 | 17 | 28 | 17 | 29 | 27 |
| Reproduction (GO: 0000003) | 1 | 1 | 2 | 1 | 3 | 0 | 3 | 1 | 4 | 5 | 4 |
| Biological regulation (GO: 0065007) | 15 | 28 | 19 | 15 | 29 | 22 | 20 | 32 | 25 | 33 | 31 |
| Response to stimulus (GO: 0050896) | 15 | 24 | 20 | 19 | 25 | 26 | 26 | 28 | 21 | 32 | 24 |
| Development processes (GO: 0032502) | 14 | 13 | 14 | 6 | 14 | 21 | 9 | 20 | 15 | 23 | 16 |
| Processes of multicellular organisms (GO: 0032501) | 9 | 15 | 13 | 6 | 18 | 15 | 9 | 14 | 15 | 20 | 15 |
| Adhesion processes (GO:0022610) | 3 | 2 | 3 | 1 | 3 | 3 | 0 | 3 | 2 | 3 | 4 |
| Locomotion (GO:0040011) | 2 | 3 | 4 | 1 | 3 | 2 | 1 | 4 | 1 | 4 | 1 |
| Metabolic processes (GO:0008152) | 41 | 76 | 58 | 33 | 48 | 60 | 55 | 84 | 47 | 83 | 74 |
| Processes of the immune system (GO:0002376) | 5 | 4 | 5 | 1 | 2 | 7 | 1 | 7 | 7 | 5 | 5 |
| Breed | Pathways | Genes |
|---|---|---|
| HO | Angiogenesis (P00005) | EPHB3, DLL4 |
| Integrin signal pathway (P00034) | LAMB3, ITGA2 | |
| Thyrotropin-releasing hormone receptor signaling pathway (P04394) | TRH, GNB5 | |
| CCKR signaling map (P06959) | AP2M1, HDC | |
| Gonadotropin-releasing hormone receptor pathway (P06664) | ISL1, GNB5 | |
| RW | Gonadotropin-releasing hormone receptor pathway (P06664) | GNAO1, PRKAA1, FST, MAP4K2, ISL1, ESRRA, PTGER4 |
| Inflammation involving chemokine and cytokine signaling pathway (P00031) | GNG3, GNAO1, CCL22, NFKB2, ITGA2, PLCB3 | |
| Wnt signaling pathway (P00057) | GNG3, CDH15, BTRC, PPP2R5B, SIAH1, PLCB3 | |
| Endogenous cannabinoid signaling pathway (P05730) | GNG3, GNAO1, PLCB3 | |
| Thyrotropin-releasing hormone receptor signaling pathway (P04394) | GNG3, TRH, PLCB3 | |
| CCKR signaling map (P06959) | AP2M1, MEN1, BAD | |
| SM | Angiogenesis (P00005) | KDR, PIK3CD, PDGFRA |
| Wnt signaling pathway (P00057) | CSNK1G2, CDH10 | |
| VEGF signaling pathway (P00056) | KDR, PIK3CD | |
| Regulation of transcription by the bZIP transcription factor (P00055) | POLR2E, MTERF2 | |
| Transcription regulation (P00023) | POLR2E, MTERF2 | |
| FGF signaling pathway (P00021) | PIK3CD, FGF22 | |
| PDGF signaling pathway (P00047) | PIK3CD, PDGFRA | |
| Circadian clock (P00015) | CLOCK, CRY1 | |
| LM | Integrin signaling pathway (P00034) | ITGAV, LIMS2 |
| PDGF signaling pathway (P00047) | NCK1, RAB2A | |
| CCKR signaling map (P06959) | LYN, ITGAV | |
| HH | Inflammation involving chemokine and cytokine signaling pathway (P00031) | SOCS5, RAC2, PIK3CD, MYH9 |
| Angiogenesis (P00005) | KDR, PIK3CD, PDGFRA | |
| VEGF signaling pathway (P00056) | KDR, RAC2, PIK3CD | |
| Ras signaling pathway (P04393) | RAC2, PIK3CD, RALB | |
| FGF signaling pathway (P00021) | RAC2, FGF12, PIK3CD | |
| Notch signaling pathway (P00045) | LNX1, HES1, MFNG | |
| Integrin signaling pathway (P00034) | RAC2, PIK3CD | |
| PDGF signaling pathway (P00047) | PIK3CD, PDGFRA | |
| CH | Interleukin signaling pathway (P00036) | STAT6, STAT2, ELK3, IL23A |
| EGF receptor signaling pathway (P00018) | STAT6, STAT2, ERBB3 | |
| DNA replication (P00017) | PRIM1, H3F3C, Histone H3.3C | |
| PDGF signaling pathway (P00047) | STAT6, STAT2, RAB2A | |
| JAK / STAT signaling pathway (P00038) | STAT6, STAT2 | |
| Integrin signaling pathway (P00034) | ITGA7, NTN4 | |
| Wnt signaling pathway (P00057) | CSNK1G3, SMARCC2 | |
| MO | Angiogenesis (P00005) | KDR, PIK3CD, MAPK14, PDGFRA |
| p53 pathway feedback loop two (P04398) | PIK3CD, MAPK14, MAPK13, CDKN1A | |
| VEGF signaling pathway (P00056) | KDR, PIK3CD, MAPK14 | |
| Ras signaling pathway (P04393) | PIK3CD, MAPK14, MAPK13 | |
| FGF signaling pathway (P00021) | PIK3CD, MAPK14, MAPK13 | |
| TGF-beta signaling pathway (P00052) | MAPK14, MAPK13, TGFB2 | |
| EGF receptor signaling pathway (P00018) | PIK3CD, MAPK14, MAPK13 | |
| Activation of B cells (P00010) | PIK3CD, MAPK14, MAPK13 | |
| Gonadotropin-releasing hormone receptor pathway (P06664) | MAPK14, MAPK13, TGFB2 | |
| Interleukin signaling pathway (P00036) | FOXO3, CDKN1A | |
| Integrin signaling pathway (P00034) | PIK3CD, MAPK13 | |
| BG | Wnt signaling pathway (P00057) | SFRP5, BTRC, CSNK1G2, CDH1 |
| Activation of B cells (P00010) | LYN, CHUK, RAC2, NFKB2 | |
| Apoptosis signaling pathway (P00006) | CHUK, MAP4K3, NFKB2 | |
| Inflammation involving chemokine and cytokine signaling pathway (P00031) | CHUK, RAC2, NFKB2 | |
| Activation of T cells (P00053) | CHUK, RAC2, NFKB2 | |
| FGF Signaling pathway (P00021) | RAC2, FGF22, FGF8 | |
| Nicotinic acetylcholine receptor signaling pathway (P00044) | CHRNA4, BCHE, ACTR1A | |
| Gonadotropin-releasing hormone receptor pathway (P06664) | RGS19, OPRL1 | |
| RP | FGF signaling pathway (P00021) | SPRY1, FGF2, PIK3CD |
| Opioid proenkephalin pathway (P05916) | OPRK1, VAMP3, PDYN | |
| Opioid proencephalin pathway (P05915) | PENK, VAMP3, PDYN | |
| Angiogenesis (P00005) | FGF2, PIK3CD | |
| Integrin signaling pathway (P00034) | TLN1, PIK3CD | |
| Wnt signaling pathway (P00057) | CTNNA2, TLE4 | |
| ZR | Inflammation involving chemokine and cytokine signaling pathway (P00031) | CHUK, NFKB2, INPPL1 |
| Activation of B cells (P00010) | LYN, CHUK, NFKB2 | |
| Gonadotropin-releasing hormone receptor pathway (P06664) | PTGER2, SNRPB, ADCY1 | |
| ZB | Activation of B cells (P00010) | LYN, SYK, CHUK, RAC2, PIK3CD, NFKB2 |
| Inflammation involving chemokine and cytokine signaling pathway (P00031) | CHUK, STAT1, RAC2, PIK3CD, NFKB2 | |
| PDGF signaling pathway (P00047) | CHUK, STAT1, PIK3CD, STAT4, PDGFRL | |
| Interleukin signaling pathwau (P00036) | CHUK, STAT1, CSF2RB, STAT4 | |
| Activation of T cells (P00053) | CHUK, RAC2, PIK3CD, NFKB2 | |
| EGF receptor signaling pathway (P00018) | STAT1, RAC2, PIK3CD, STAT4 |
© 2019 by the authors. Licensee MDPI, Basel, Switzerland. This article is an open access article distributed under the terms and conditions of the Creative Commons Attribution (CC BY) license (http://creativecommons.org/licenses/by/4.0/).
Share and Cite
Szmatoła, T.; Gurgul, A.; Jasielczuk, I.; Ząbek, T.; Ropka-Molik, K.; Litwińczuk, Z.; Bugno-Poniewierska, M. A Comprehensive Analysis of Runs of Homozygosity of Eleven Cattle Breeds Representing Different Production Types. Animals 2019, 9, 1024. https://doi.org/10.3390/ani9121024
Szmatoła T, Gurgul A, Jasielczuk I, Ząbek T, Ropka-Molik K, Litwińczuk Z, Bugno-Poniewierska M. A Comprehensive Analysis of Runs of Homozygosity of Eleven Cattle Breeds Representing Different Production Types. Animals. 2019; 9(12):1024. https://doi.org/10.3390/ani9121024
Chicago/Turabian StyleSzmatoła, Tomasz, Artur Gurgul, Igor Jasielczuk, Tomasz Ząbek, Katarzyna Ropka-Molik, Zygmunt Litwińczuk, and Monika Bugno-Poniewierska. 2019. "A Comprehensive Analysis of Runs of Homozygosity of Eleven Cattle Breeds Representing Different Production Types" Animals 9, no. 12: 1024. https://doi.org/10.3390/ani9121024
APA StyleSzmatoła, T., Gurgul, A., Jasielczuk, I., Ząbek, T., Ropka-Molik, K., Litwińczuk, Z., & Bugno-Poniewierska, M. (2019). A Comprehensive Analysis of Runs of Homozygosity of Eleven Cattle Breeds Representing Different Production Types. Animals, 9(12), 1024. https://doi.org/10.3390/ani9121024