Selection of Meat Inspection Data for an Animal Welfare Index in Cattle and Pigs in Denmark


Simple Summary
Abstract
1. Introduction
2. Materials and Methods
2.1. Exclusion of Codes
2.2. Estimation of Abattoir Effects for Each Code and Category
3. Results
3.1. Code Selection
3.2. Descriptive Statistics
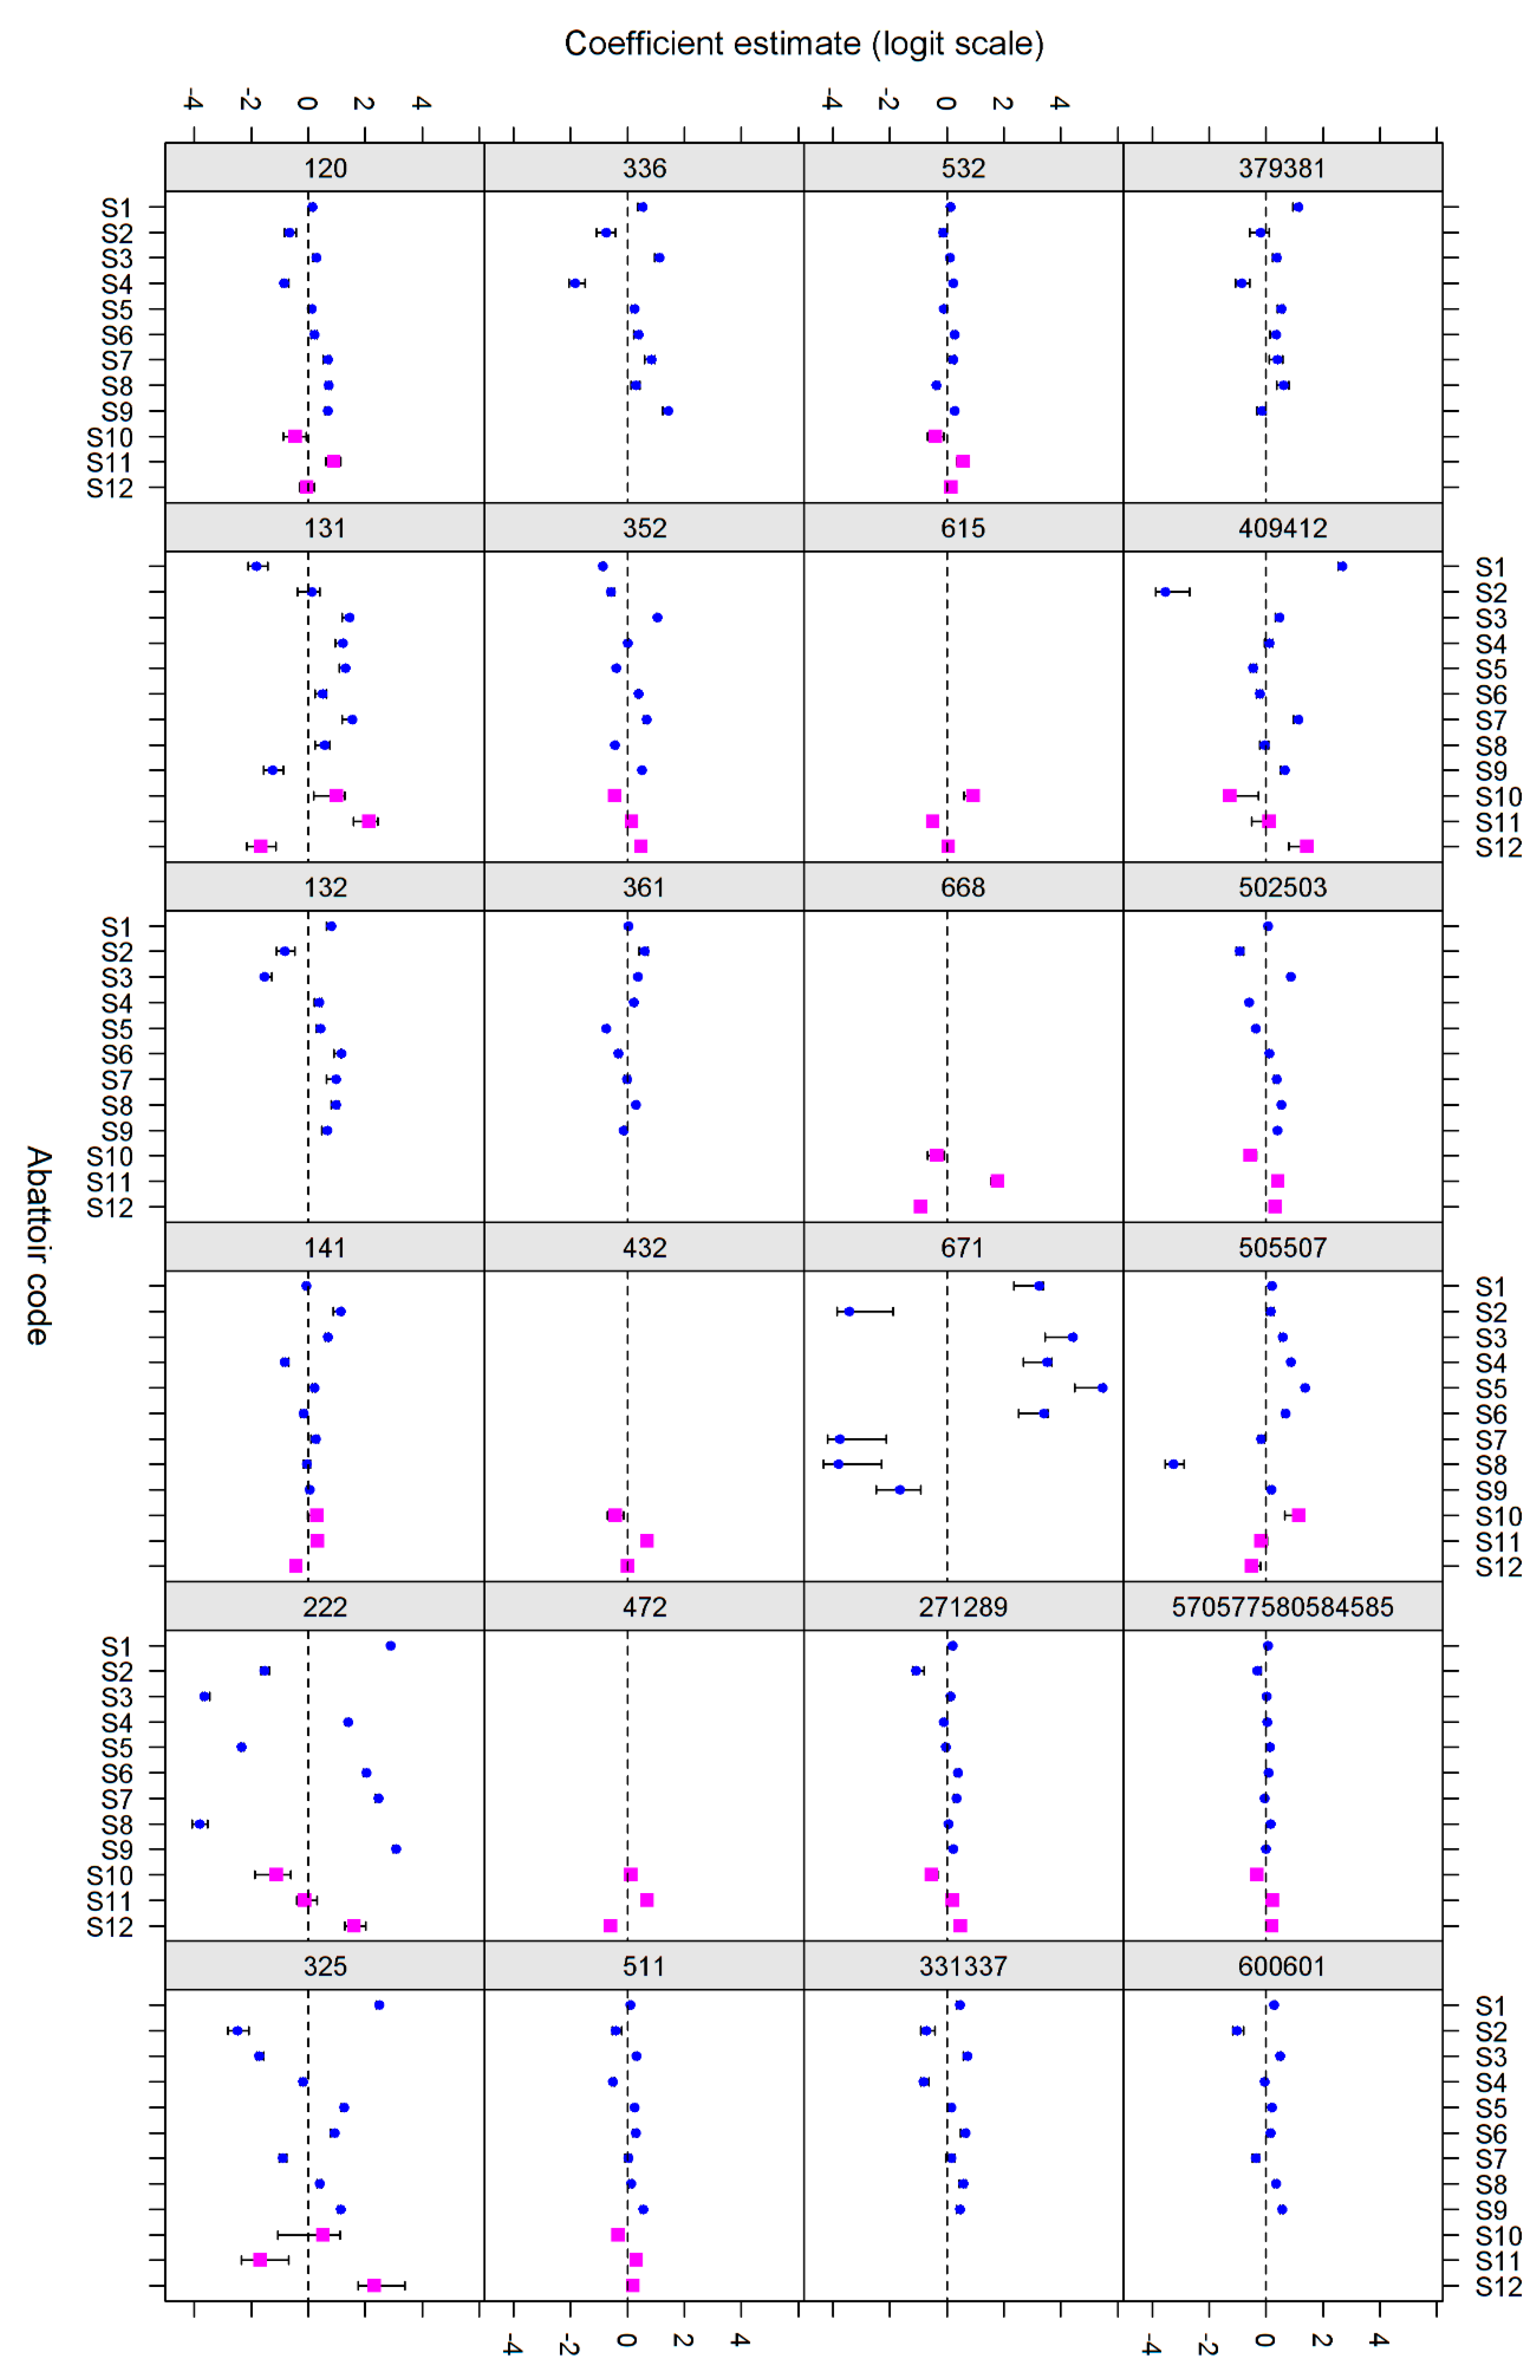
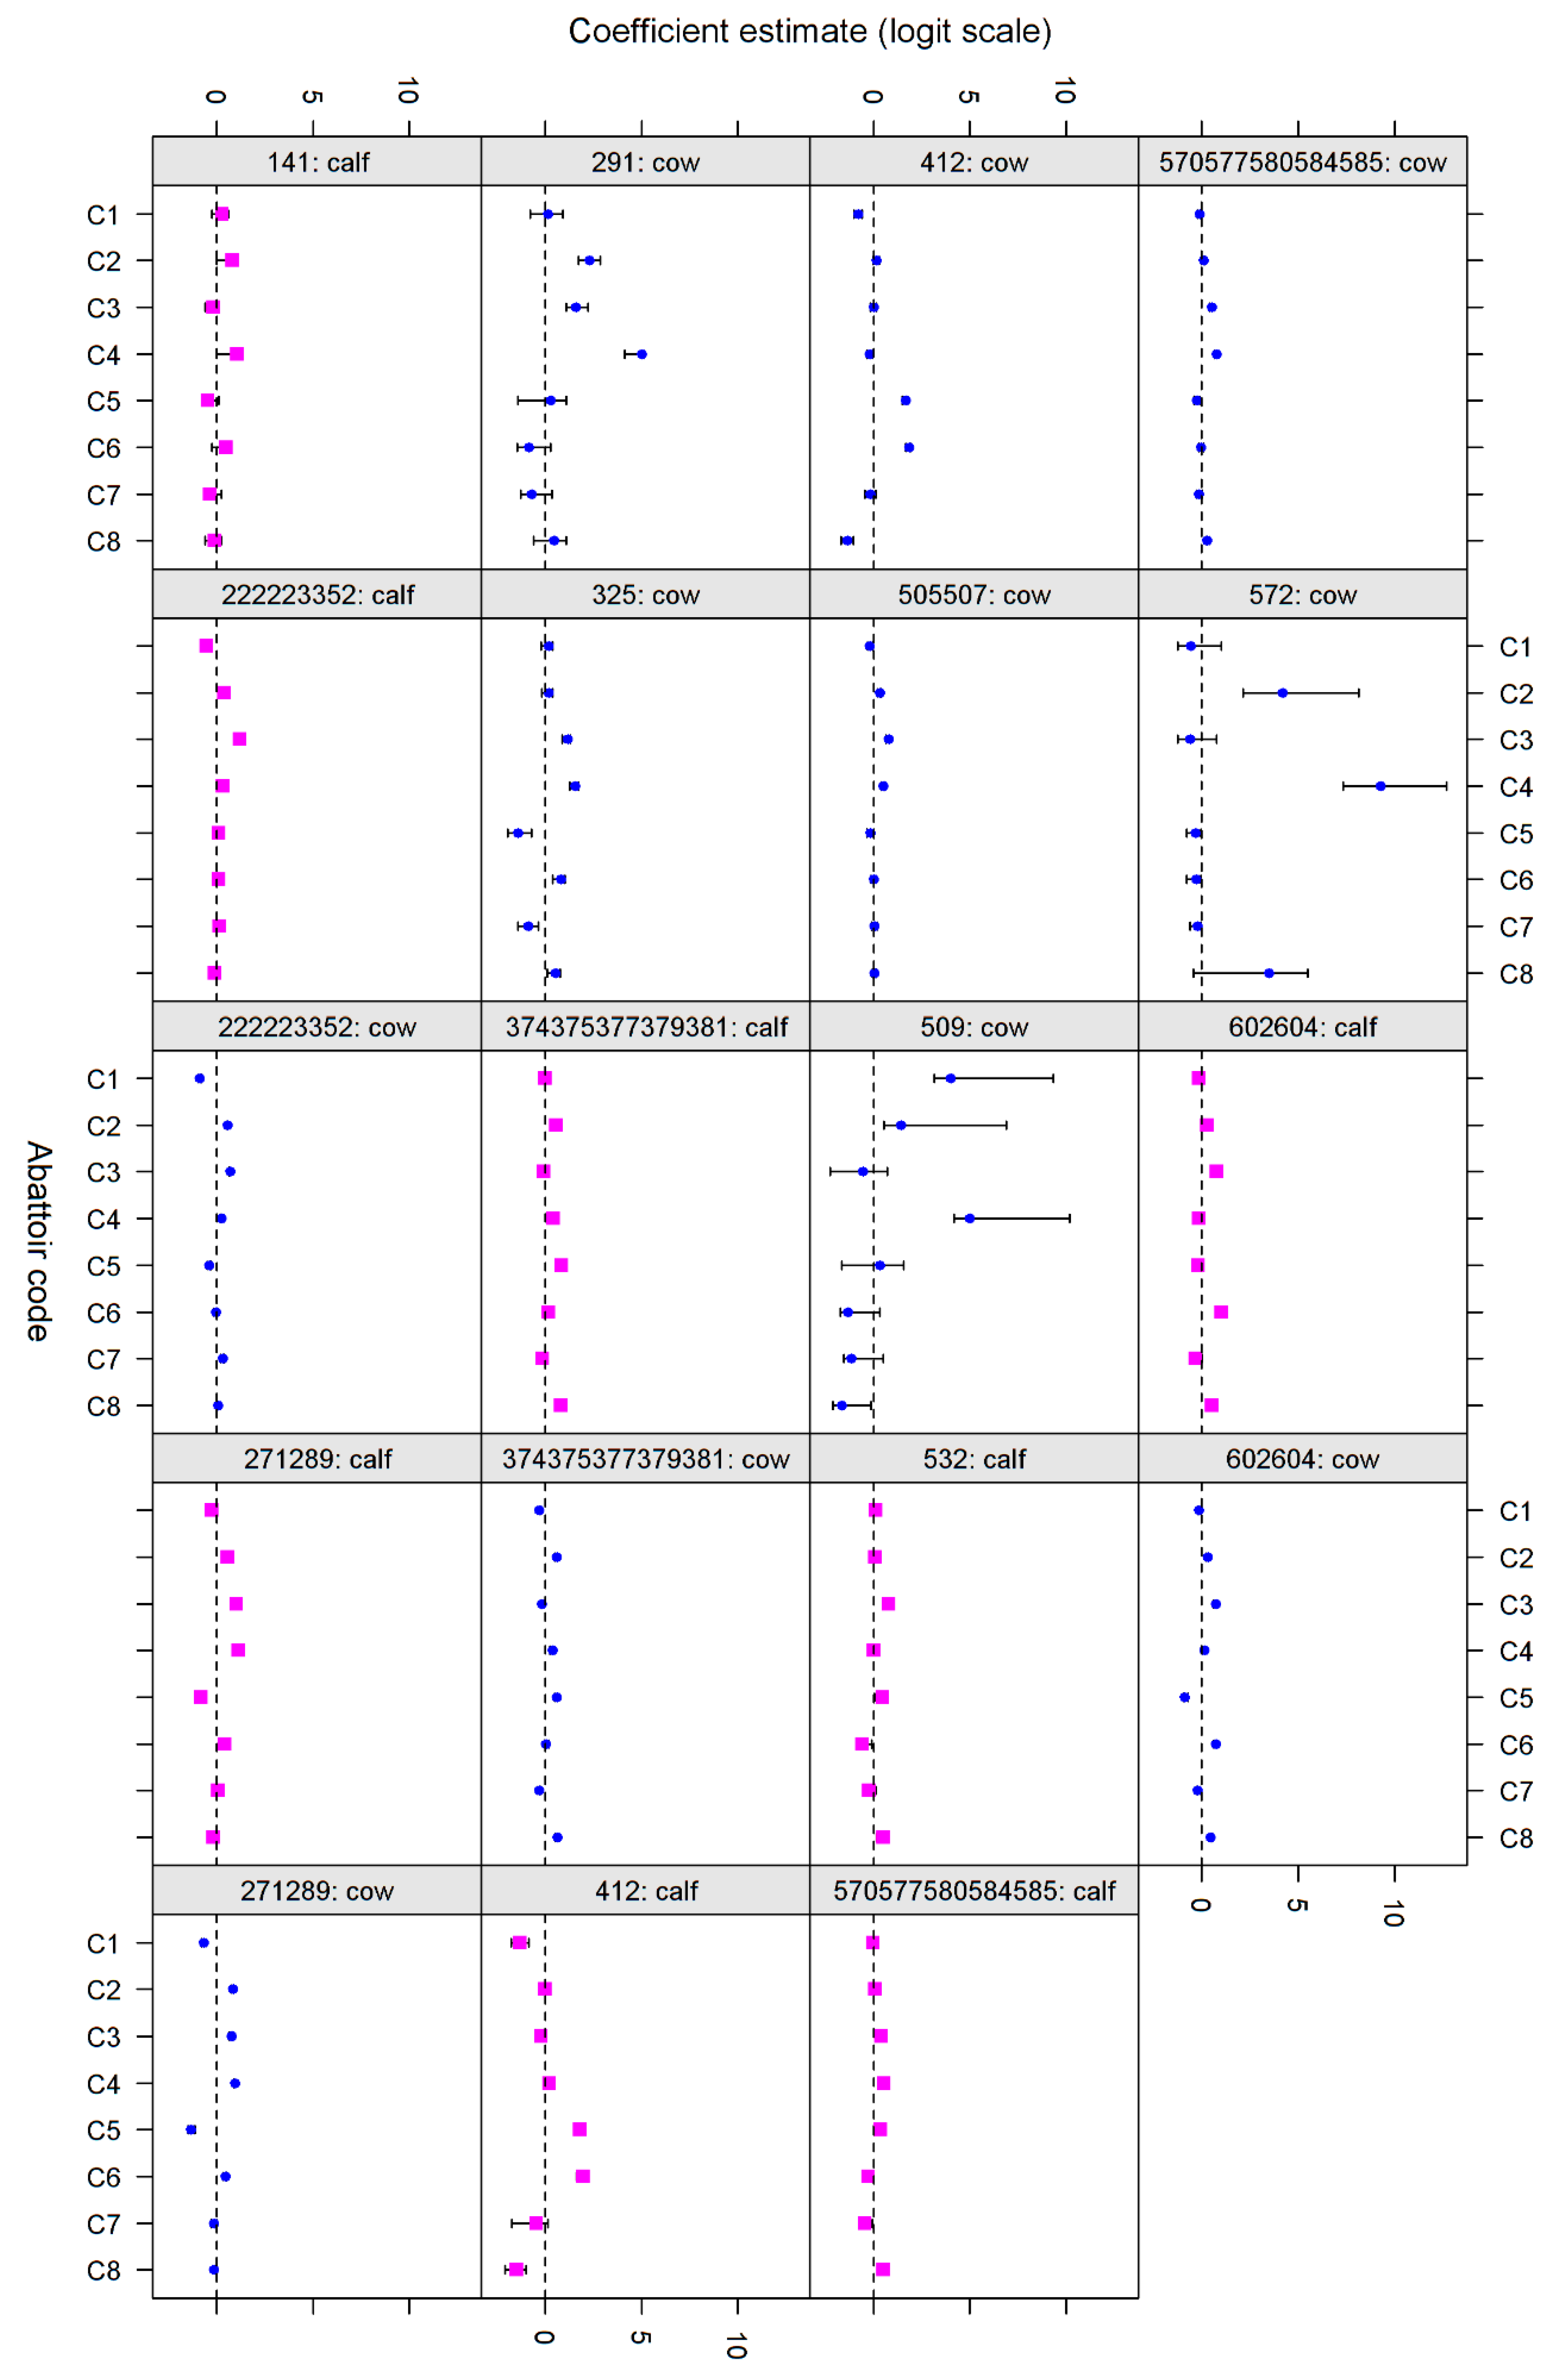
3.3. Random Effects Logistic Regression
3.3.1. Pig and Sow Data
3.3.2. Calf and Cow Data
3.3.3. Pigs, Sows, and Cattle Combined
4. Discussion
5. Conclusions
Acknowledgments
Author Contributions
Conflicts of Interest
Appendix A. Description on Meat Inspection Codes

| Code | Code Description | Exclusion Criterion 1 |
|---|---|---|
| 101 | Disturbed overall well-being; excited/exhausted | Transport |
| 111 | Dead at arrival | Transport |
| 113 | Rejected from being slaughtered; killed at ante-mortem inspection; dying | Transport |
| 114 | Dead in stable | Transport |
| 115 | Emergency slaughter | Transport |
| 120 | Circulatory affection; anaemic appearance; dropsy; oedema | |
| 131 | Emaciated | |
| 132 | Skinny | |
| 141 | Pyaemia, blood poisoning, pyaemic abscesses, splenitis or nephritis following blood poisoning | |
| 181 | Abnormal smell (not boar taint), taste, colour | Not welfare |
| 203 | Brain abscess; CNS symptoms in stable | CNS |
| 221 | Acute pericarditis | Acute |
| 222 | Chronic pericarditis | |
| 230 | Endocarditis, acute or healed | |
| 250 | Atrophic rhinitis, sinusitis, rhinitis | |
| 258 | Acute/sub-acute pneumonia and necrosis of the lungs under and under 25% | |
| 271 | Chronic pneumonia; aerogenic abscesses in the lungs | |
| 287 | Fibrinous pleuritis over and under 25% | Acute |
| 289 | Chronic pleuritis, serositis | |
| 320 | Acute stomatitis or enteritis, cattharal or fibrinous | Acute |
| 325 | Chronic stomatitis or enteritis, adhesions | |
| 331 | Rectal prolapse, bowel prolapse | |
| 336 | Gastric ulcers | |
| 337 | Haemorrhagic bowel syndrome, rectal stricture | |
| 350 | Acute peritonitis, extensive or local | Acute |
| 352 | Chronic peritonitis, peritoneal abscess, peritoneal discoloration (following splenic torsion) | |
| 361 | Umbilical hernia, inguinal hernia, scrotal hernia | |
| 371 | Acute hepatitis, extensive or local | Acute |
| 379 | Chronic hepatitis, hepatic necrosis | |
| 381 | Jaundice (toxic, infectious, following hepatosis | |
| 382 | Jaundice (physiological, neonatal) | Not welfare |
| 385 | Hepatic milk spots | Not welfare |
| 402 | Acute nephritis | Acute |
| 409 | Mycotoxic nephropathy | |
| 412 | Chronic nephritis incl. nephritic degeneration and necrosis | |
| 431 | Acute metritis | Acute |
| 432 | Chronic metritis, retained placenta, uterine prolapse | |
| 446 | Rupture of the vagina, vaginitis, vaginal prolapse | |
| 451 | Recent farrowing, abortion, foetus in last 10th of pregnancy (suspicion) | Transport |
| 471 | Acute mastitis | Acute |
| 472 | Chronic mastitis | |
| 501 | Acute fracture | Transport |
| 502 | Chronic fracture | |
| 503 | Infected fracture, open fracture >6 h | |
| 504 | Acute tail fracture | Acute |
| 505 | Healed tail fracture | |
| 506 | Acute rib fracture | Acute |
| 507 | Healed rib fracture | |
| 511 | Acute, chronic, local and healed myelitis, including associated abscesses | |
| 531 | Acute, infectious arthritis | Acute |
| 532 | Chronic arthritis, osteoarthritis | |
| 535 | Hip dislocation/joint dislocation | Transport |
| 542 | Lameness | Transport |
| 551 | High and low degree of PSE/DFD (pale, soft and exudative) | Acute |
| 565 | Suspicion on notifiable disease | Not welfare |
| 570 | Abscess in front part | |
| 572 | Muscle atrophy | Not welfare & low prev. |
| 577 | Abscess in mid part | |
| 580 | Abscess in rear part | |
| 584 | Abscess in leg/toe, elephantiasis in leg | |
| 585 | Abscess in head, blood ear, curly ear, elephantiasis in ear | |
| 600 | Tail bite, locally, limited | |
| 601 | Tail bite/tail infection | Non-specific |
| 602 | Scar/contusion/bursitis | Non-specific |
| 603 | Wound, inflammation, eczema, insect bite | |
| 608 | Acute erysipelas | |
| 615 | Shoulder wound | |
| 634 | Sarcoptes scabei in pigs | Not welfare & low prev. |
| 668 | Injection injury | |
| 671 | Frostbite/corrosion | |
| 815 | Suspicion on poisoning or medical residues | Not welfare |
| 829 | Caseous lymphadenitis | Not welfare |
| 890 | Malignant tumour, benign, unspecific tumour | Not welfare |
| 901 | Skin lesions, not human inflicted or human-inflicted below acceptable threshold | Transport |
| 903 | Bite marks | Transport |
| 904 | Skin lesions, human inflicted, including excessive use of tattoo hammer, suspicion on violation of animal welfare | Transport |
| Code | Code Description | Exclusion Criterion 1 |
|---|---|---|
| 101 | Disturbed overall well-being; excited/exhausted | Transport |
| 113 | Rejected from being slaughtered; killed at ante-mortem inspection; dying | Transport |
| 115 | Emergency slaughter | Non-specific |
| 120 | Circulatory affection; anaemic appearance; dropsy; oedema | |
| 131 | Emaciated | |
| 133 | Tucked up | Acute |
| 141 | Pyaemia, blood poisoning, pyaemic abscesses, splenitis or nephritis following blood poisoning | |
| 181 | Abnormal smell, taste, colour, consistency, texture, exudative | Not welfare-related |
| 204 | CNS symptoms in stable | CNS |
| 221 | Acute pericarditis | Acute |
| 222 | Chronic pericarditis | |
| 223 | Traumatic pericarditis, reticuloperitonitis, splenitis etc. | |
| 230 | Endocarditis, acute or healed, blood clot | |
| 258 | Acute/subacture pneumoia, aspiration pneumonia and necrosis of the lungs over and under 25% | Acute |
| 271 | Chronic pneumonia, aerogenous abscesses | |
| 287 | Acute pneumonia over and under 25% | Acute |
| 289 | Chronic pneumonia, serositis | |
| 291 | Pulmonary strongylosis/lungworm | |
| 304 | BSE/suspicion | CNS |
| 320 | Acute gastroenteritis, cathral/fibrinous | Acute |
| 325 | Chronic gastroenteritis | |
| 334 | Ruminal atony | Acute |
| 335 | Geo-sediment | Non-specific |
| 336 | Abomasal/ruminal ulcer | |
| 350 | Acute peritonitis, extensive or local | Acute |
| 352 | Chronic peritonitis, abscess in peritoneum incl. subphrenic abscesses | |
| 361 | Umbilical hernia, inguinal hernia, scrotal hernia | |
| 365 | Ruminal tympany | Acute |
| 371 | Acute hepatitis, extensive (incl. diffuse/extensive acute or subacute necrosis) or locally (individual acute or subacute necrosis) | Acute |
| 374 | Fatty liver | |
| 375 | Acute, subacute and chronic liver abscesses, liver abscess in calves (nutritional in origin), abscesses not part of a pyaemic spread | |
| 377 | Flukes | |
| 379 | Chronic hepatitis, hepatic necrosis, chronic parasitic hepatitis incl. scarring in the liver, hepatic cirrhosis | |
| 381 | Jaundice (toxic, infectious, following hepatosis | |
| 382 | Jaundice (physiological, neonatal) | Not welfare-related |
| 402 | Acute nephritis | Acute |
| 412 | Chronic nephritis incl. nephritic degeneration and necrosis, pyelonephrtis, cysts in the kidneys, purulent nephritis | |
| 431 | Acute metritis | Acute |
| 432 | Chronic metritis, retained placenta, uterine prolapse, hydrallantois, uterine rupture | |
| 446 | Vaginal rupture, vaginitis, vaginal prolapse | |
| 451 | Recent calving, abortion, foetus in last 10th of gestation (suspicion) | Transport |
| 471 | Acute/necrotic mastitis | Acute |
| 472 | Chronic mastitis, incl. fungal | |
| 476 | Traumatised teat/teat amputation | |
| 501 | Acute fracture | Acute |
| 502 | Chronic fracture | |
| 503 | Infected fracture, open, >6 h | |
| 504 | Acute tail fracture | Acute |
| 505 | Healed tail fracture | |
| 506 | Acute rib fracture | Acute |
| 507 | Healed rib fracture | |
| 509 | Hoof condition/overgrown hoofs | |
| 511 | Acute, chronic and local osteomyelitis, blood poisoning | |
| 524 | Periostal pigmentation, spot wise melanosis | Not welfare-related |
| 531 | Acute, infectious arthritis | Acute |
| 532 | Chronic arthritis, osteoarthritis | |
| 535 | Lameness, left front leg | Transport |
| 536 | Lameness, right front leg | Transport |
| 537 | Lameness, left rear leg | Transport |
| 538 | Lameness, right rear leg | Transport |
| 542 | Hip dislocation/joint dislocation | Transport |
| 551 | High and low degree of DFD (dry, farm and dry) | Not welfare-related |
| 560 | Cysticercus bovis, more than 10 | Not welfare-related |
| 561 | Cysticercus bovis, 10 or less (below 2 years) | Not welfare-related |
| 562 | Cysticercus bovis, 10 or less (above 2 years) | Not welfare-related |
| 563 | Sarcocystocis/sarcosporidia | Not welfare-related |
| 565 | Suspicion of notifiable disease, incl. bovine tuberculosis suspicion | Not welfare-related |
| 570 | Abscess in front/chest | |
| 572 | Muscle atrophy (with code 574) | |
| 574 | Muscle atrophy (with 572: 574 no longer used) | |
| 577 | Abdominal abscess, back to pelvis | |
| 580 | Abdominal abscess, pelvis and below | |
| 584 | Abscess in leg/hoof | |
| 585 | Abscess in head, incl. tongue (actinomycosis) | |
| 600 | Tail trauma/amputated tail | |
| 602 | Hock, hip, chest and thigh lesions and swellings | |
| 603 | Wound, inflammation, eczema, insect bite | |
| 604 | Neck, back, ischial, pinbone abrasions | |
| 631 | Scabies in cattle | |
| 641 | Ring worm | |
| 668 | Injection injury | |
| 807 | Ketosis | |
| 815 | Suspicion on poisoning or medical residues | Not welfare-related |
| 890 | Malignant tumour, benign, unspecific tumour | Not welfare-related |
References
- Anon. Forlig om Veterinærområdet (Settlement on the Veterinary Area); Case No. 17872, Doc. No. 455060; Danish Ministry for Food, Agriculture and Fisheries: Copenhagen, Denmark, 2012. [Google Scholar]
- Appleby, M.; Sandøe, P. Philosophical debate on the nature of well-being: Implications for animal welfare. Anim. Welf. 2002, 11, 283–294. [Google Scholar]
- Lassen, J.; Sandøe, P.; Forkman, B. Happy pigs are dirty!—Conflicting perspectives of animal welfare. Livest. Sci. 2006, 103, 221–230. [Google Scholar] [CrossRef]
- Ingemann, R.; Sandøe, P.; Enemark, P.; Forkman, B. Conflicting goals of welfare assessment schemes: A case study. Anim. Welf. 2009, 18, 487–495. [Google Scholar]
- Fraser, D. Assessing animal welfare at the farm and group level: The interplay of science and values. Anim. Welf. 2003, 12, 433–443. [Google Scholar]
- Bortreau, R.; Veissier, I.; Butterworth, A.; Bracke, M.B.M.; Keeling, L.J. Definition of criteria for overall assessment of animal welfare. Anim. Welf. 2007, 16, 225–228. [Google Scholar]
- Regulation (EC) No 854/2004 of the European Parliament and of the Council of 29 April 2004 Laying down Specific Rules for the Organisation of Official Controls on Products of Animal Origin Intended for Human Consumption. Available online: http://eur-lex.europa.eu/legal-content/EN/TXT/?uri=celex:32004R0854 (accessed on 6 December 2017).
- Anon. Cirkulære om Udøvelse af Kødkontrol. CIR1H nr 9611 af 19/12/2011. (Government Circular on Conduct of Meat Inspection in Denmark, in Danish); Danish Veterinary and Food Administration: Glostrup, Denmark, 2011. [Google Scholar]
- Enøe, C.; Christensen, G.; Andersen, S.; Willeberg, P. The need for built-in validation of surveillance data so that changes in diagnostic performance of post-mortem meat inspection can be detected. Prev. Vet. Med. 2003, 57, 117–125. [Google Scholar] [CrossRef]
- Nielsen, S.S.; Michelsen, A.M.; Jensen, H.E.; Barington, K.; Opstrup, K.V.; Agger, J.F. The apparent prevalence of skin lesions suspected to be human-inflicted in Danish finishing pigs at slaughter. Prev. Vet. Medicine 2014, 117, 200–206. [Google Scholar] [CrossRef] [PubMed]
- Nielsen, S.S.; Nielsen, G.B.; Denwood, M.J.; Haugegaard, J.; Houe, H. Comparison of recording of pericarditis and lung disorders at routine meat inspection with findings at systematic health monitoring in Danish finisher pigs. Acta Vet. Scand. 2015, 57. [Google Scholar] [CrossRef] [PubMed]
- R Core Team. R: A Language and Environment for Statistical Computing; R Foundation for Statistical Computing: Vienna, Austria, 2017; Available online: http://www.R-project.org/ (accessed on 21 September 2017).
- Denwood, M.J.; Houe, H.; Forkman, B.; Nielsen, S.S. Random effect selection in generalised linear models: A practical application to slaughterhouse surveillance data in Denmark. In Proceedings of the Society for Veterinary Epidemiology and Preventive Medicine annual meeting held in Ghent, SVEPM, Ghent, Belgium, 25–27 March 2015; pp. 135–145. [Google Scholar]
- Bates, D.; Maechler, M.; Bolker, B.; Walker, S. lme4: Linear Mixed-Effects Models Using Eigen and S4. R Package Version 1.1-6. Available online: http://CRAN.R-project.org/package=lme4 (accessed on 14 August 2017).
- Lewis, F.; Butler, A.; Gilbert, L. A unified approach to model selection using the likelihood ratio test. Methods Ecol. Evol. 2011, 2, 155–162. [Google Scholar] [CrossRef]
- Houe, H.; Vaarst, M.; Enevoldsen, C. Clinical parameters for assessment of udder health in Danish dairy herds. Acta Vet. Scand. 2002, 43, 173–184. [Google Scholar] [PubMed]
- Danish Veterinary and Food Administration. Udvikling af Nationale Dyrevelfærdsindekster for kvæg og svin (Development of National Animal Welfare Indices for Cattle and Pigs, in Danish); Danish Veterinary and Food Administration: Glostrup, Denmark, 2016; Available online: https://www.foedevarestyrelsen.dk/SiteCollectionDocuments/Dyrevelfaerd%20og%20veterinaermedicin/Slutrapport%20indeksprojekt%20FINAL%20VERSION.pdf and appendices: https://www.foedevarestyrelsen.dk/SiteCollectionDocuments/Dyrevelfaerd%20og%20veterinaermedicin/Bilag%20til%20rapport%20om%20dyrevelf%C3%A6rdsindekser.pdf; (accessed on 16 November 2017). [Google Scholar]
- Hansen, H.; Mühlen-Schulte, A. The power of numbers in global governance. J. Int. Relat. Dev. 2012, 15, 455–465. [Google Scholar] [CrossRef]


| Code/Category | S1 | S2 | S3 | S4 | S5 | S6 | S7 | S8 | S9 | |||||||||
|---|---|---|---|---|---|---|---|---|---|---|---|---|---|---|---|---|---|---|
| No. | % | No. | % | No. | % | No. | % | No. | % | No. | % | No. | % | No. | % | No. | % | |
| 120 | 1076 | 0.038 | 76 | 0.017 | 1177 | 0.043 | 207 | 0.014 | 450 | 0.066 | 483 | 0.074 | 1673 | 0.075 | 1744 | 0.038 | 736 | 0.042 |
| 131 | 15 | 0.001 | 24 | 0.005 | 414 | 0.015 | 181 | 0.012 | 127 | 0.019 | 42 | 0.006 | 22 | 0.001 | 640 | 0.014 | 105 | 0.006 |
| 132 | 999 | 0.035 | 26 | 0.006 | 77 | 0.003 | 307 | 0.021 | 267 | 0.039 | 264 | 0.040 | 701 | 0.031 | 997 | 0.022 | 820 | 0.047 |
| 141 | 1130 | 0.040 | 695 | 0.155 | 2442 | 0.089 | 274 | 0.019 | 370 | 0.054 | 256 | 0.039 | 974 | 0.044 | 2460 | 0.054 | 674 | 0.039 |
| 222 | 144,357 | 5.115 | 269 | 0.060 | 186 | 0.007 | 17,200 | 1.179 | 21,771 | 3.202 | 38 | 0.006 | 124,856 | 5.599 | 1199 | 0.026 | 35,780 | 2.061 |
| 230 | 108 | 0.004 | 9 | 0.002 | 59 | 0.002 | 71 | 0.005 | 23 | 0.003 | 14 | 0.002 | 123 | 0.006 | 50 | 0.001 | 76 | 0.004 |
| 250 | 32 | 0.001 | 0 | 0.000 | 19 | 0.001 | 307 | 0.021 | 99 | 0.015 | 10 | 0.002 | 315 | 0.014 | 635 | 0.014 | 65 | 0.004 |
| 258 | 606 | 0.021 | 163 | 0.036 | 558 | 0.020 | 81 | 0.006 | 179 | 0.026 | 7 | 0.001 | 202 | 0.009 | 573 | 0.013 | 415 | 0.024 |
| 325 | 23,299 | 0.826 | 26 | 0.006 | 337 | 0.012 | 853 | 0.058 | 198 | 0.029 | 671 | 0.102 | 5808 | 0.260 | 11,443 | 0.252 | 3067 | 0.177 |
| 336 | 598 | 0.021 | 26 | 0.006 | 1068 | 0.039 | 25 | 0.002 | 210 | 0.031 | 114 | 0.017 | 1419 | 0.064 | 748 | 0.016 | 324 | 0.019 |
| 352 | 8571 | 0.304 | 1787 | 0.399 | 50,966 | 1.856 | 10,631 | 0.729 | 8835 | 1.299 | 2975 | 0.453 | 23,951 | 1.074 | 21,634 | 0.477 | 18,736 | 1.079 |
| 361 | 35,679 | 1.264 | 9197 | 2.051 | 44,529 | 1.621 | 22,010 | 1.508 | 8490 | 1.249 | 12,063 | 1.839 | 23,201 | 1.040 | 27,088 | 0.597 | 16,647 | 0.959 |
| 432 | 1 | 0.000 | 0 | 0.000 | 9 | 0.000 | 15 | 0.001 | 3 | 0.000 | 0 | 0.000 | 10 | 0.000 | 13 | 0.000 | 3 | 0.000 |
| 446 | 15 | 0.001 | 0 | 0.000 | 0 | 0.000 | 0 | 0.000 | 0 | 0.000 | 0 | 0.000 | 1 | 0.000 | 13 | 0.000 | 1 | 0.000 |
| 472 | 0 | 0.000 | 1 | 0.000 | 0 | 0.000 | 0 | 0.000 | 0 | 0.000 | 0 | 0.000 | 1 | 0.000 | 0 | 0.000 | 0 | 0.000 |
| 511 | 7455 | 0.264 | 591 | 0.132 | 8208 | 0.299 | 2458 | 0.168 | 1575 | 0.232 | 1786 | 0.272 | 8028 | 0.360 | 12,295 | 0.271 | 5102 | 0.294 |
| 532 | 7168 | 0.254 | 869 | 0.194 | 6763 | 0.246 | 5422 | 0.372 | 2069 | 0.304 | 1025 | 0.156 | 6277 | 0.281 | 8631 | 0.190 | 5559 | 0.320 |
| 615 | 0 | 0.000 | 1 | 0.000 | 1 | 0.000 | 0 | 0.000 | 0 | 0.000 | 0 | 0.000 | 0 | 0.000 | 0 | 0.000 | 0 | 0.000 |
| 668 | 18 | 0.001 | 4 | 0.001 | 5 | 0.000 | 10 | 0.001 | 0 | 0.000 | 6 | 0.001 | 7 | 0.000 | 26 | 0.001 | 0 | 0.000 |
| 671 | 1538 | 0.054 | 0 | 0.000 | 5689 | 0.207 | 903 | 0.062 | 0 | 0.000 | 0 | 0.000 | 6 | 0.000 | 18,026 | 0.397 | 961 | 0.055 |
| 271289 | 577,000 | 20.44 | 26,789 | 5.97 | 324,914 | 11.83 | 340,360 | 23.33 | 145,978 | 21.47 | 145,853 | 22.23 | 556,686 | 24.96 | 1,056,773 | 23.30 | 417,572 | 24.06 |
| 331337 | 1065 | 0.038 | 52 | 0.012 | 1275 | 0.046 | 143 | 0.010 | 188 | 0.028 | 274 | 0.042 | 898 | 0.040 | 1253 | 0.028 | 788 | 0.045 |
| 379381 | 564 | 0.020 | 22 | 0.005 | 254 | 0.009 | 36 | 0.002 | 64 | 0.009 | 86 | 0.013 | 126 | 0.006 | 512 | 0.011 | 159 | 0.009 |
| 409412 | 14,333 | 0.508 | 3 | 0.001 | 1468 | 0.053 | 569 | 0.039 | 739 | 0.109 | 216 | 0.033 | 1460 | 0.065 | 1009 | 0.022 | 486 | 0.028 |
| 502503 | 5849 | 0.207 | 324 | 0.072 | 12,354 | 0.450 | 1636 | 0.112 | 1851 | 0.272 | 2179 | 0.332 | 6266 | 0.281 | 6011 | 0.133 | 3799 | 0.219 |
| 505507 | 3540 | 0.125 | 506 | 0.113 | 4924 | 0.179 | 4210 | 0.289 | 614 | 0.090 | 22 | 0.003 | 2567 | 0.115 | 17,251 | 0.380 | 3506 | 0.202 |
| 570577580584585 | 125,332 | 4.441 | 13,485 | 3.007 | 114,327 | 4.163 | 67,749 | 4.643 | 26,267 | 3.863 | 33,172 | 5.056 | 87,630 | 3.929 | 217,152 | 4.789 | 77,687 | 4.475 |
| 600601 | 35,958 | 1.274 | 1254 | 0.280 | 32,702 | 1.191 | 16,264 | 1.115 | 3823 | 0.562 | 8021 | 1.223 | 29,909 | 1.341 | 42,827 | 0.944 | 17,065 | 0.983 |
| Total slaughtered | 2,822,288 | 448,412 | 2,746,407 | 1,459,135 | 679,914 | 656,049 | 2,230,130 | 4,534,853 | 1,735,829 | |||||||||
| Code/Category | S10 | S11 | S12 | |||
|---|---|---|---|---|---|---|
| No. | % | No. | % | No. | % | |
| 120 | 5 | 0.052 | 583 | 0.263 | 103 | 0.101 |
| 131 | 7 | 0.073 | 500 | 0.226 | 4 | 0.004 |
| 132 | 10 | 0.104 | 396 | 0.179 | 143 | 0.140 |
| 141 | 24 | 0.250 | 521 | 0.235 | 108 | 0.106 |
| 222 | 4 | 0.042 | 300 | 0.135 | 781 | 0.766 |
| 230 | 0 | 0.000 | 148 | 0.067 | 31 | 0.030 |
| 250 | 0 | 0.000 | 0 | 0.000 | 2 | 0.002 |
| 258 | 3 | 0.031 | 41 | 0.018 | 11 | 0.011 |
| 325 | 2 | 0.021 | 4 | 0.002 | 124 | 0.122 |
| 336 | 1 | 0.010 | 27 | 0.012 | 22 | 0.022 |
| 352 | 112 | 1.168 | 4754 | 2.145 | 2999 | 2.940 |
| 361 | 21 | 0.219 | 160 | 0.072 | 84 | 0.082 |
| 432 | 14 | 0.146 | 1113 | 0.502 | 259 | 0.254 |
| 446 | 0 | 0.000 | 8 | 0.004 | 1 | 0.001 |
| 472 | 345 | 3.596 | 12,860 | 5.802 | 1721 | 1.687 |
| 511 | 95 | 0.990 | 4384 | 1.978 | 1815 | 1.779 |
| 532 | 18 | 0.188 | 1361 | 0.614 | 399 | 0.391 |
| 615 | 178 | 1.856 | 905 | 0.408 | 700 | 0.686 |
| 668 | 29 | 0.302 | 6180 | 2.788 | 219 | 0.215 |
| 671 | 0 | 0.000 | 0 | 0.000 | 2 | 0.002 |
| 271289 | 818 | 8.527 | 40,100 | 18.092 | 23,947 | 23.477 |
| 331337 | 1 | 0.010 | 82 | 0.037 | 18 | 0.018 |
| 379381 | 2 | 0.021 | 96 | 0.043 | 39 | 0.038 |
| 409412 | 0 | 0.000 | 71 | 0.032 | 125 | 0.123 |
| 502503 | 45 | 0.469 | 3076 | 1.388 | 1259 | 1.234 |
| 505507 | 39 | 0.407 | 218 | 0.098 | 70 | 0.069 |
| 570577580584585 | 649 | 6.765 | 25,012 | 11.285 | 11,383 | 11.160 |
| 600601 | 17 | 0.177 | 153 | 0.069 | 167 | 0.164 |
| Total slaughtered | 9593 | 221,645 | 102,002 | |||
| Code/Category | C1 | C2 | C3 | C4 | C5 | C6 | C7 | C8 | ||||||||
|---|---|---|---|---|---|---|---|---|---|---|---|---|---|---|---|---|
| No. | % | No. | % | No. | % | No. | % | No. | % | No. | % | No. | % | No. | % | |
| 120 | 3 | 0.0106 | 3 | 0.0055 | 7 | 0.0162 | 15 | 0.0306 | 4 | 0.0458 | 0 | 0 | 1 | 0.0294 | 2 | 0.0099 |
| 131 | 1 | 0.0035 | 5 | 0.0092 | 8 | 0.0185 | 1 | 0.002 | 0 | 0 | 1 | 0.0168 | 1 | 0.0294 | 0 | 0 |
| 141 | 19 | 0.0674 | 71 | 0.1311 | 17 | 0.0393 | 82 | 0.1673 | 1 | 0.0115 | 6 | 0.1006 | 0 | 0 | 9 | 0.0448 |
| 230 | 5 | 0.0177 | 10 | 0.0185 | 18 | 0.0416 | 26 | 0.053 | 2 | 0.0229 | 2 | 0.0335 | 0 | 0 | 2 | 0.0099 |
| 291 | 0 | 0 | 11 | 0.0203 | 5 | 0.0116 | 41 | 0.0836 | 0 | 0 | 0 | 0 | 0 | 0 | 0 | 0 |
| 325 | 12 | 0.0426 | 9 | 0.0166 | 35 | 0.0809 | 31 | 0.0632 | 0 | 0 | 3 | 0.0503 | 0 | 0 | 27 | 0.1343 |
| 336 | 0 | 0 | 0 | 0 | 1 | 0.0023 | 2 | 0.0041 | 0 | 0 | 0 | 0 | 0 | 0 | 0 | 0 |
| 361 | 3 | 0.0106 | 0 | 0 | 0 | 0 | 7 | 0.0143 | 3 | 0.0344 | 0 | 0 | 0 | 0 | 2 | 0.0099 |
| 412 | 11 | 0.039 | 83 | 0.1533 | 54 | 0.1247 | 94 | 0.1918 | 83 | 0.951 | 68 | 1.14 | 3 | 0.0882 | 6 | 0.0298 |
| 432 | 0 | 0 | 0 | 0 | 0 | 0 | 3 | 0.0061 | 0 | 0 | 0 | 0 | 0 | 0 | 0 | 0 |
| 446 | 0 | 0 | 0 | 0 | 0 | 0 | 0 | 0 | 0 | 0 | 0 | 0 | 0 | 0 | 0 | 0 |
| 509 | 13 | 0.0461 | 2 | 0.0037 | 3 | 0.0069 | 36 | 0.0734 | 0 | 0 | 0 | 0 | 1 | 0.0294 | 0 | 0 |
| 511 | 6 | 0.0213 | 20 | 0.0369 | 22 | 0.0508 | 30 | 0.0612 | 1 | 0.0115 | 1 | 0.0168 | 0 | 0 | 5 | 0.0249 |
| 532 | 94 | 0.3337 | 192 | 0.3546 | 311 | 0.7184 | 156 | 0.3183 | 44 | 0.5041 | 6 | 0.1006 | 6 | 0.1764 | 113 | 0.5619 |
| 572 | 0 | 0 | 1 | 0.0018 | 0 | 0 | 48 | 0.0979 | 0 | 0 | 0 | 0 | 0 | 0 | 0 | 0 |
| 600 | 6 | 0.0213 | 1 | 0.0018 | 2 | 0.0046 | 12 | 0.0245 | 0 | 0 | 0 | 0 | 0 | 0 | 0 | 0 |
| 603 | 1 | 0.0035 | 1 | 0.0018 | 0 | 0 | 6 | 0.0122 | 1 | 0.0115 | 0 | 0 | 3 | 0.0882 | 0 | 0 |
| 668 | 0 | 0 | 0 | 0 | 0 | 0 | 0 | 0 | 0 | 0 | 0 | 0 | 0 | 0 | 0 | 0 |
| 807 | 0 | 0 | 0 | 0 | 0 | 0 | 0 | 0 | 0 | 0 | 0 | 0 | 0 | 0 | 0 | 0 |
| 222223352 | 344 | 1.221 | 2230 | 4.1186 | 3758 | 8.6812 | 1420 | 2.8971 | 158 | 1.8103 | 129 | 2.1626 | 66 | 1.94 | 414 | 2.0587 |
| 271289 | 726 | 2.5769 | 4597 | 8.4903 | 5956 | 13.7587 | 6377 | 13.0103 | 104 | 1.1916 | 287 | 4.8114 | 103 | 3.0276 | 597 | 2.9687 |
| 374375377379381 | 2788 | 9.896 | 8381 | 15.4791 | 3418 | 7.8958 | 6282 | 12.8165 | 1313 | 15.0435 | 551 | 9.2372 | 220 | 6.4668 | 2876 | 14.3013 |
| 472476 | 0 | 0 | 2 | 0.0037 | 0 | 0 | 1 | 0.002 | 0 | 0 | 0 | 0 | 0 | 0 | 0 | 0 |
| 502503 | 12 | 0.0426 | 11 | 0.0203 | 23 | 0.0531 | 15 | 0.0306 | 8 | 0.0917 | 3 | 0.0503 | 3 | 0.0882 | 3 | 0.0149 |
| 505507 | 50 | 0.1775 | 133 | 0.2456 | 222 | 0.5128 | 149 | 0.304 | 20 | 0.2291 | 21 | 0.3521 | 1 | 0.0294 | 34 | 0.1691 |
| 570577580584585 | 161 | 0.5715 | 366 | 0.676 | 401 | 0.9263 | 539 | 1.0997 | 76 | 0.8708 | 22 | 0.3688 | 7 | 0.2058 | 218 | 1.084 |
| 602604 | 192 | 0.6815 | 571 | 1.0546 | 846 | 1.9543 | 331 | 0.6753 | 57 | 0.6531 | 138 | 2.3135 | 18 | 0.5291 | 282 | 1.4023 |
| 631641 | 0 | 0 | 158 | 0.2918 | 10 | 0.0231 | 18 | 0.0367 | 15 | 0.1719 | 0 | 0 | 0 | 0 | 0 | 0 |
| Total slaughtered | 28,173 | 54,144 | 43,289 | 49,015 | 8728 | 5965 | 3402 | 20,110 | ||||||||
| Code | C1 | C2 | C3 | C4 | C5 | C6 | C7 | C8 | ||||||||
|---|---|---|---|---|---|---|---|---|---|---|---|---|---|---|---|---|
| No. | % | No. | % | No. | % | No. | % | No. | % | No. | % | No. | % | No. | % | |
| 120 | 18 | 0.0486 | 58 | 0.115 | 30 | 0.0747 | 158 | 0.2694 | 10 | 0.0661 | 13 | 0.0964 | 12 | 0.1211 | 11 | 0.0462 |
| 131 | 20 | 0.054 | 67 | 0.1328 | 30 | 0.0747 | 79 | 0.1347 | 0 | 0 | 11 | 0.0816 | 9 | 0.0908 | 18 | 0.0756 |
| 141 | 87 | 0.2351 | 125 | 0.2478 | 87 | 0.2167 | 233 | 0.3973 | 4 | 0.0265 | 39 | 0.2893 | 42 | 0.4237 | 44 | 0.1847 |
| 230 | 64 | 0.173 | 77 | 0.1526 | 91 | 0.2266 | 147 | 0.2507 | 2 | 0.0132 | 15 | 0.1113 | 26 | 0.2623 | 40 | 0.168 |
| 291 | 2 | 0.0054 | 27 | 0.0535 | 10 | 0.0249 | 633 | 1.0794 | 1 | 0.0066 | 0 | 0 | 0 | 0 | 2 | 0.0084 |
| 325 | 44 | 0.1189 | 60 | 0.1189 | 133 | 0.3312 | 293 | 0.4996 | 2 | 0.0132 | 32 | 0.2374 | 3 | 0.0303 | 42 | 0.1764 |
| 336 | 0 | 0 | 0 | 0 | 4 | 0.01 | 1 | 0.0017 | 0 | 0 | 1 | 0.0074 | 0 | 0 | 0 | 0 |
| 361 | 2 | 0.0054 | 0 | 0 | 1 | 0.0025 | 2 | 0.0034 | 1 | 0.0066 | 1 | 0.0074 | 0 | 0 | 0 | 0 |
| 412 | 65 | 0.1757 | 240 | 0.4757 | 162 | 0.4035 | 193 | 0.3291 | 329 | 2.1756 | 351 | 2.6037 | 34 | 0.343 | 23 | 0.0966 |
| 432 | 12 | 0.0324 | 37 | 0.0733 | 19 | 0.0473 | 23 | 0.0392 | 4 | 0.0265 | 11 | 0.0816 | 4 | 0.0404 | 3 | 0.0126 |
| 446 | 1 | 0.0027 | 1 | 0.002 | 0 | 0 | 5 | 0.0085 | 0 | 0 | 0 | 0 | 0 | 0 | 0 | 0 |
| 509 | 102 | 0.2757 | 10 | 0.0198 | 1 | 0.0025 | 450 | 0.7674 | 1 | 0.0066 | 0 | 0 | 0 | 0 | 0 | 0 |
| 511 | 30 | 0.0811 | 87 | 0.1724 | 59 | 0.1469 | 168 | 0.2865 | 3 | 0.0198 | 17 | 0.1261 | 21 | 0.2119 | 24 | 0.1008 |
| 532 | 93 | 0.2513 | 142 | 0.2815 | 263 | 0.655 | 304 | 0.5184 | 63 | 0.4166 | 36 | 0.267 | 17 | 0.1715 | 138 | 0.5794 |
| 572 | 0 | 0 | 4 | 0.0079 | 0 | 0 | 875 | 1.4921 | 0 | 0 | 0 | 0 | 0 | 0 | 1 | 0.0042 |
| 600 | 6 | 0.0162 | 1 | 0.002 | 5 | 0.0125 | 76 | 0.1296 | 1 | 0.0066 | 0 | 0 | 0 | 0 | 0 | 0 |
| 603 | 6 | 0.0162 | 8 | 0.0159 | 7 | 0.0174 | 69 | 0.1177 | 1 | 0.0066 | 1 | 0.0074 | 9 | 0.0908 | 0 | 0 |
| 668 | 3 | 0.0081 | 2 | 0.004 | 3 | 0.0075 | 15 | 0.0256 | 0 | 0 | 0 | 0 | 0 | 0 | 1 | 0.0042 |
| 807 | 0 | 0 | 14 | 0.0277 | 15 | 0.0374 | 36 | 0.0614 | 0 | 0 | 11 | 0.0816 | 1 | 0.0101 | 0 | 0 |
| 222223352 | 617 | 1.6674 | 3721 | 7.3752 | 3249 | 8.092 | 3049 | 5.1993 | 418 | 2.7642 | 543 | 4.0279 | 560 | 5.6497 | 1091 | 4.581 |
| 271289 | 419 | 1.1323 | 2773 | 5.4962 | 1933 | 4.8143 | 3454 | 5.89 | 86 | 0.5687 | 485 | 3.5977 | 202 | 2.0379 | 486 | 2.0406 |
| 374375377379381 | 2539 | 6.8616 | 8480 | 16.8077 | 3226 | 8.0347 | 7403 | 12.6241 | 2414 | 15.9635 | 1341 | 9.9473 | 664 | 6.699 | 3775 | 15.8507 |
| 472476 | 218 | 0.5891 | 183 | 0.3627 | 10 | 0.0249 | 148 | 0.2524 | 2 | 0.0132 | 10 | 0.0742 | 2 | 0.0202 | 1 | 0.0042 |
| 502503 | 57 | 0.154 | 34 | 0.0674 | 57 | 0.142 | 60 | 0.1023 | 21 | 0.1389 | 24 | 0.178 | 8 | 0.0807 | 17 | 0.0714 |
| 505507 | 314 | 0.8486 | 758 | 1.5024 | 968 | 2.4109 | 1048 | 1.7871 | 136 | 0.8994 | 147 | 1.0904 | 109 | 1.0997 | 282 | 1.1841 |
| 570577580584585 | 578 | 1.562 | 988 | 1.9583 | 1169 | 2.9115 | 2302 | 3.9255 | 201 | 1.3292 | 235 | 1.7432 | 144 | 1.4528 | 602 | 2.5277 |
| 602604 | 1527 | 4.1267 | 3551 | 7.0382 | 4308 | 10.7295 | 3372 | 5.7501 | 297 | 1.964 | 1323 | 9.8138 | 377 | 3.8035 | 1902 | 7.9862 |
| 631641 | 0 | 0 | 10 | 0.0198 | 0 | 0 | 10 | 0.0171 | 1 | 0.0066 | 0 | 0 | 0 | 0 | 0 | 0 |
| Total slaughtered | 37,003 | 50,453 | 40,151 | 58,642 | 15,122 | 13,481 | 9912 | 23,816 | ||||||||
| Group | Model Fit | Codes & Code Combinations |
|---|---|---|
| Pigs | No model fit | 432, 446, 451, 472, 572, 615, 634 |
| Poor model fit | 230, 250, 258, 668 | |
| Acceptable model fit | 120, 131, 132, 141, 222, 325, 336, 352, 361, 511, 532, 671, 271289, 331337, 379381, 409412, 502503, 505507, 570577580584585, 600601 | |
| Sows | No model fit | 250, 336, 446, 451, 572, 634, 671 |
| Poor model fit | 258, 361, 331337 | |
| Acceptable model fit | 120, 131, 132, 141, 222, 230, 325, 352, 432, 472, 511, 532, 615, 668, 271289, 379381, 409412, 502503, 505507, 570577580584585, 600601 |
| Animal Group | Model Fit | Codes & Code Combinations |
|---|---|---|
| Calves | No model fit | 120, 131, 291, 336, 361, 432, 446, 509, 572, 600, 603, 668, 807, 472476 |
| Poor model fit | 230, 325, 511, 502503, 505507, 631641 | |
| Acceptable model fit | 141, 412, 532, 271289, 222223352, 374375377379381, 570577580584585, 602604 | |
| Cows | No model fit | 336, 361, 446, 668, 631641 |
| Poor model fit | 120, 131, 141, 230, 432, 511, 600, 603, 807, 472476, 502503 | |
| Acceptable model fit | 291, 325, 412, 509, 532, 572, 271289, 222223352, 374375377379381, 570577580584585, 505507, 602604 |
| Animal Group | Abattoir Effect | Individual or Category | Intervals 1 | Number of Codes | Codes |
|---|---|---|---|---|---|
| Pigs | No | None | NA | 0 | |
| Yes | 12 individual | <|1| | 4 | 120; 361; 511; 532 | |
| |1|–|2| | 5 | 131; 132; 141; 336; 352 | |||
| >|2| | 3 | 222; 325; 671 | |||
| 19 codes in 8 categories | <|1| | 11 (4) | 331337; 502503; 600601; 570577580584585 | ||
| |1|–|2| | 4 (2) | 271289; 379381 | |||
| >|2| | 4 (2) | 409412; 505507 | |||
| Sows | No | 2 individual | NA | 2 | 132; 230 |
| 4 codes in 2 categories | NA | 4 (2) | 379381; 600601 | ||
| Yes | 12 individual | <|1| | 8 | 120; 141; 352; 432; 472; 511; 532; 615 | |
| |1|–|2| | 2 | 222; 668 | |||
| >|2| | 2 | 131; 325 | |||
| 13 codes in 5 categories | <|1| | 9 (3) | 271289; 502503; 570577580584585 | ||
| |1|–|2| | 4 (2) | 409412; 505507 | |||
| >|2| | 0 | ||||
| Cattle < 18 months | No | None | NA | 0 | |
| Yes | 4 individual | <|1| | 2 | 141; 532 | |
| |1|–|2| | 1 | 412 | |||
| >|2| | 0 | ||||
| 17 codes in 5 categories | <|1| | 12 (3) | 374375377379381; 570577580584585; 602604 | ||
| |1|–|2| | 5 (2) | 222223352; 271289 | |||
| >|2| | 0 | ||||
| Cattle ≥ 18 months | No | 1 individual | 1 | 532 | |
| Yes | 7 individual | <|1| | 0 | ||
| |1|–|2| | 2 | 325; 412 | |||
| >|2| | 3 | 291; 509; 572 | |||
| 19 codes in 6 categories | <|1| | 17 (5) | 222223352; 505507; 374375377379381; 570577580584585; 602604 | ||
| |1|–|2| | 2 (1) | 271289 | |||
| >|2| | 0 |
| Swine Code | Cattle Code | Description | Useful in |
|---|---|---|---|
| 120 | Circulatory system disturbances (poor bleeding); anaemia; dropsy; oedema | pigs; sows | |
| 132 | Skinny | sows | |
| 141 | Pyemia; septicaemia; pyemic lung abscesses; splenitis-septicaemia; nephritis-septicaemia; | sows | |
| 141 | Pyemia; septicaemia; pyemic lung abscesses; splenitis-septicaemia; nephritis-septicaemia; pyemic hepatic abscesses | calves | |
| 222223352 | Chronic pericarditis; Traumatic reticulitis-pericarditis; Chronic peritonitis; peritoneal abscess incl. subphrenic abscesses | cows | |
| 230 | Endocarditis (acute or healed) | sows | |
| 271289 | Chronic pneumonia or pleuritis; aeronic abscesses; serositis | sows | |
| 331337 | Rectal prolapse; rectal stricture | pigs | |
| 352 | Chronic peritonitis; peritoneal abscess; discoloured peritoneum (from splenic torsion) | sows | |
| 361 | Hernia (umbilical; inguinal) | pigs | |
| 374375377379381 | Fatty liver; acute, subacute, chronic hepatic abscesses and non-pyemic abscesses; chronic hepatitis with necrosis; chronic parasitic hepatitis; liver cirrhosis; jaundice | calves; cows | |
| 379381 | Chronic hepatitis; hepatic necrosis; jaundice | sows | |
| 432 | Chronic metritis; retained placenta; incomplete parturition; uterine prolapse | sows | |
| 472 | Chronic mastitis | sows | |
| 502503 | Old fracture; infected fracture; open fracture >6 h old | pigs; sows | |
| 511 | Acute, chronic, local, healed osteomyelitis; abscesses following wound | pigs; sows | |
| 505507 | Tail fracture; rib fracture, healed | cows | |
| 532 | 532 | Chronic arthritis; arthrosis | All |
| 570577580 584585 | Abscesses in front, mid or rear part; in the leg or toe; in the head; blood ear | pigs; sows | |
| 570577580584585 | Abscesses in front, mid or rear part; in the leg or toe; in the head; tongue incl. actinomycosis | calves; cows | |
| 600601 | Tail-bite, local; tail-bite incl. Infection | pigs; sows | |
| 602604 | Hock, hip; chest, thigh, pinbone, ischial abrasions | calves; cows | |
| 615 | Shoulder wounds | sows |
© 2017 by the authors. Licensee MDPI, Basel, Switzerland. This article is an open access article distributed under the terms and conditions of the Creative Commons Attribution (CC BY) license (http://creativecommons.org/licenses/by/4.0/).
Share and Cite
Nielsen, S.S.; Denwood, M.J.; Forkman, B.; Houe, H. Selection of Meat Inspection Data for an Animal Welfare Index in Cattle and Pigs in Denmark. Animals 2017, 7, 94. https://doi.org/10.3390/ani7120094
Nielsen SS, Denwood MJ, Forkman B, Houe H. Selection of Meat Inspection Data for an Animal Welfare Index in Cattle and Pigs in Denmark. Animals. 2017; 7(12):94. https://doi.org/10.3390/ani7120094
Chicago/Turabian StyleNielsen, Søren Saxmose, Matthew James Denwood, Björn Forkman, and Hans Houe. 2017. "Selection of Meat Inspection Data for an Animal Welfare Index in Cattle and Pigs in Denmark" Animals 7, no. 12: 94. https://doi.org/10.3390/ani7120094
APA StyleNielsen, S. S., Denwood, M. J., Forkman, B., & Houe, H. (2017). Selection of Meat Inspection Data for an Animal Welfare Index in Cattle and Pigs in Denmark. Animals, 7(12), 94. https://doi.org/10.3390/ani7120094