3.1. Cold Weather
During loading in cold weather, average internal trailer temperature was colder when 2.4 m3 of bedding were used (4.10 ± 0.60 °C) compared to when 1.2 m3 of bedding were used (6.30 ± 0.53 °C; P < 0.05). When 0.6 m3 of bedding were used, however, average internal trailer temperature (5.90 ± 0.90 °C) was not different from 1.2 m3 or 2.4 m3 (P > 0.05). Relative humidity inside the trailer was lower when 0.6 m3 of bedding were used compared to when 1.2 m3 and 2.4 m3 were used (56.10 ± 4.38, 75.00 ± 2.56, and 81.60 ± 2.93% for 0.6 m3, 1.2 m3, and 2.4 m3, respectively) (P < 0.05). Moisture percentage inside the trailer did not differ when 1.2 m3 and 2.4 m3 were used (P > 0.05).
During transport in cold weather, internal trailer temperature was greatest when 0.6 m
3 of bedding were used (11.80 ± 0.76 °C) compared with when 1.2 m
3 (6.20 ± 0.69 °C) or 2.4 m
3 (5.90 ± 0.58 °C) were used. Temperatures when 1.2 m
3 and 2.4 m
3 were used did not differ from each other (
P > 0.05). A similar pattern was found for RH (53.10 ± 2.68, 71.50 ± 2.44, and 73.10 ± 2.03% for 0.6 m
3, 1.2 m
3, and 2.4 m
3, respectively) during transport in cold weather.
Table 3 presents the pattern (linear, quadratic, or non-significant) in which temperature and RH change depending on bedding level and compartments in the trailer.
P > 0.05 was considered non-significant.
Table 3.
Linear (L), quadratic (Q) or non-significant (NS) change in temperature and relative humidity (RH) over time while loading in cold weather for 0.6 m3, 1.2 m3 and 2.4 m3 of bedding (n = 33 trailers).
Table 3.
Linear (L), quadratic (Q) or non-significant (NS) change in temperature and relative humidity (RH) over time while loading in cold weather for 0.6 m3, 1.2 m3 and 2.4 m3 of bedding (n = 33 trailers).
| Bedding volume (m3) |
| 0.6 | 1.2 | 2.4 |
| BF1 | BR1 | TF1 | TR1 | BF1 | BR1 | TF1 | TR1 | BF1 | BR1 | TF1 | TR1 |
| Temperature [°C] | NS | NS | NS | NS | NS | NS | NS | Q | NS | NS | L | NS |
| RH [%] | NS | NS | L | NS | L | NS | L | NS | NS | NS | NS | NS |
3.3. Variable Interactions
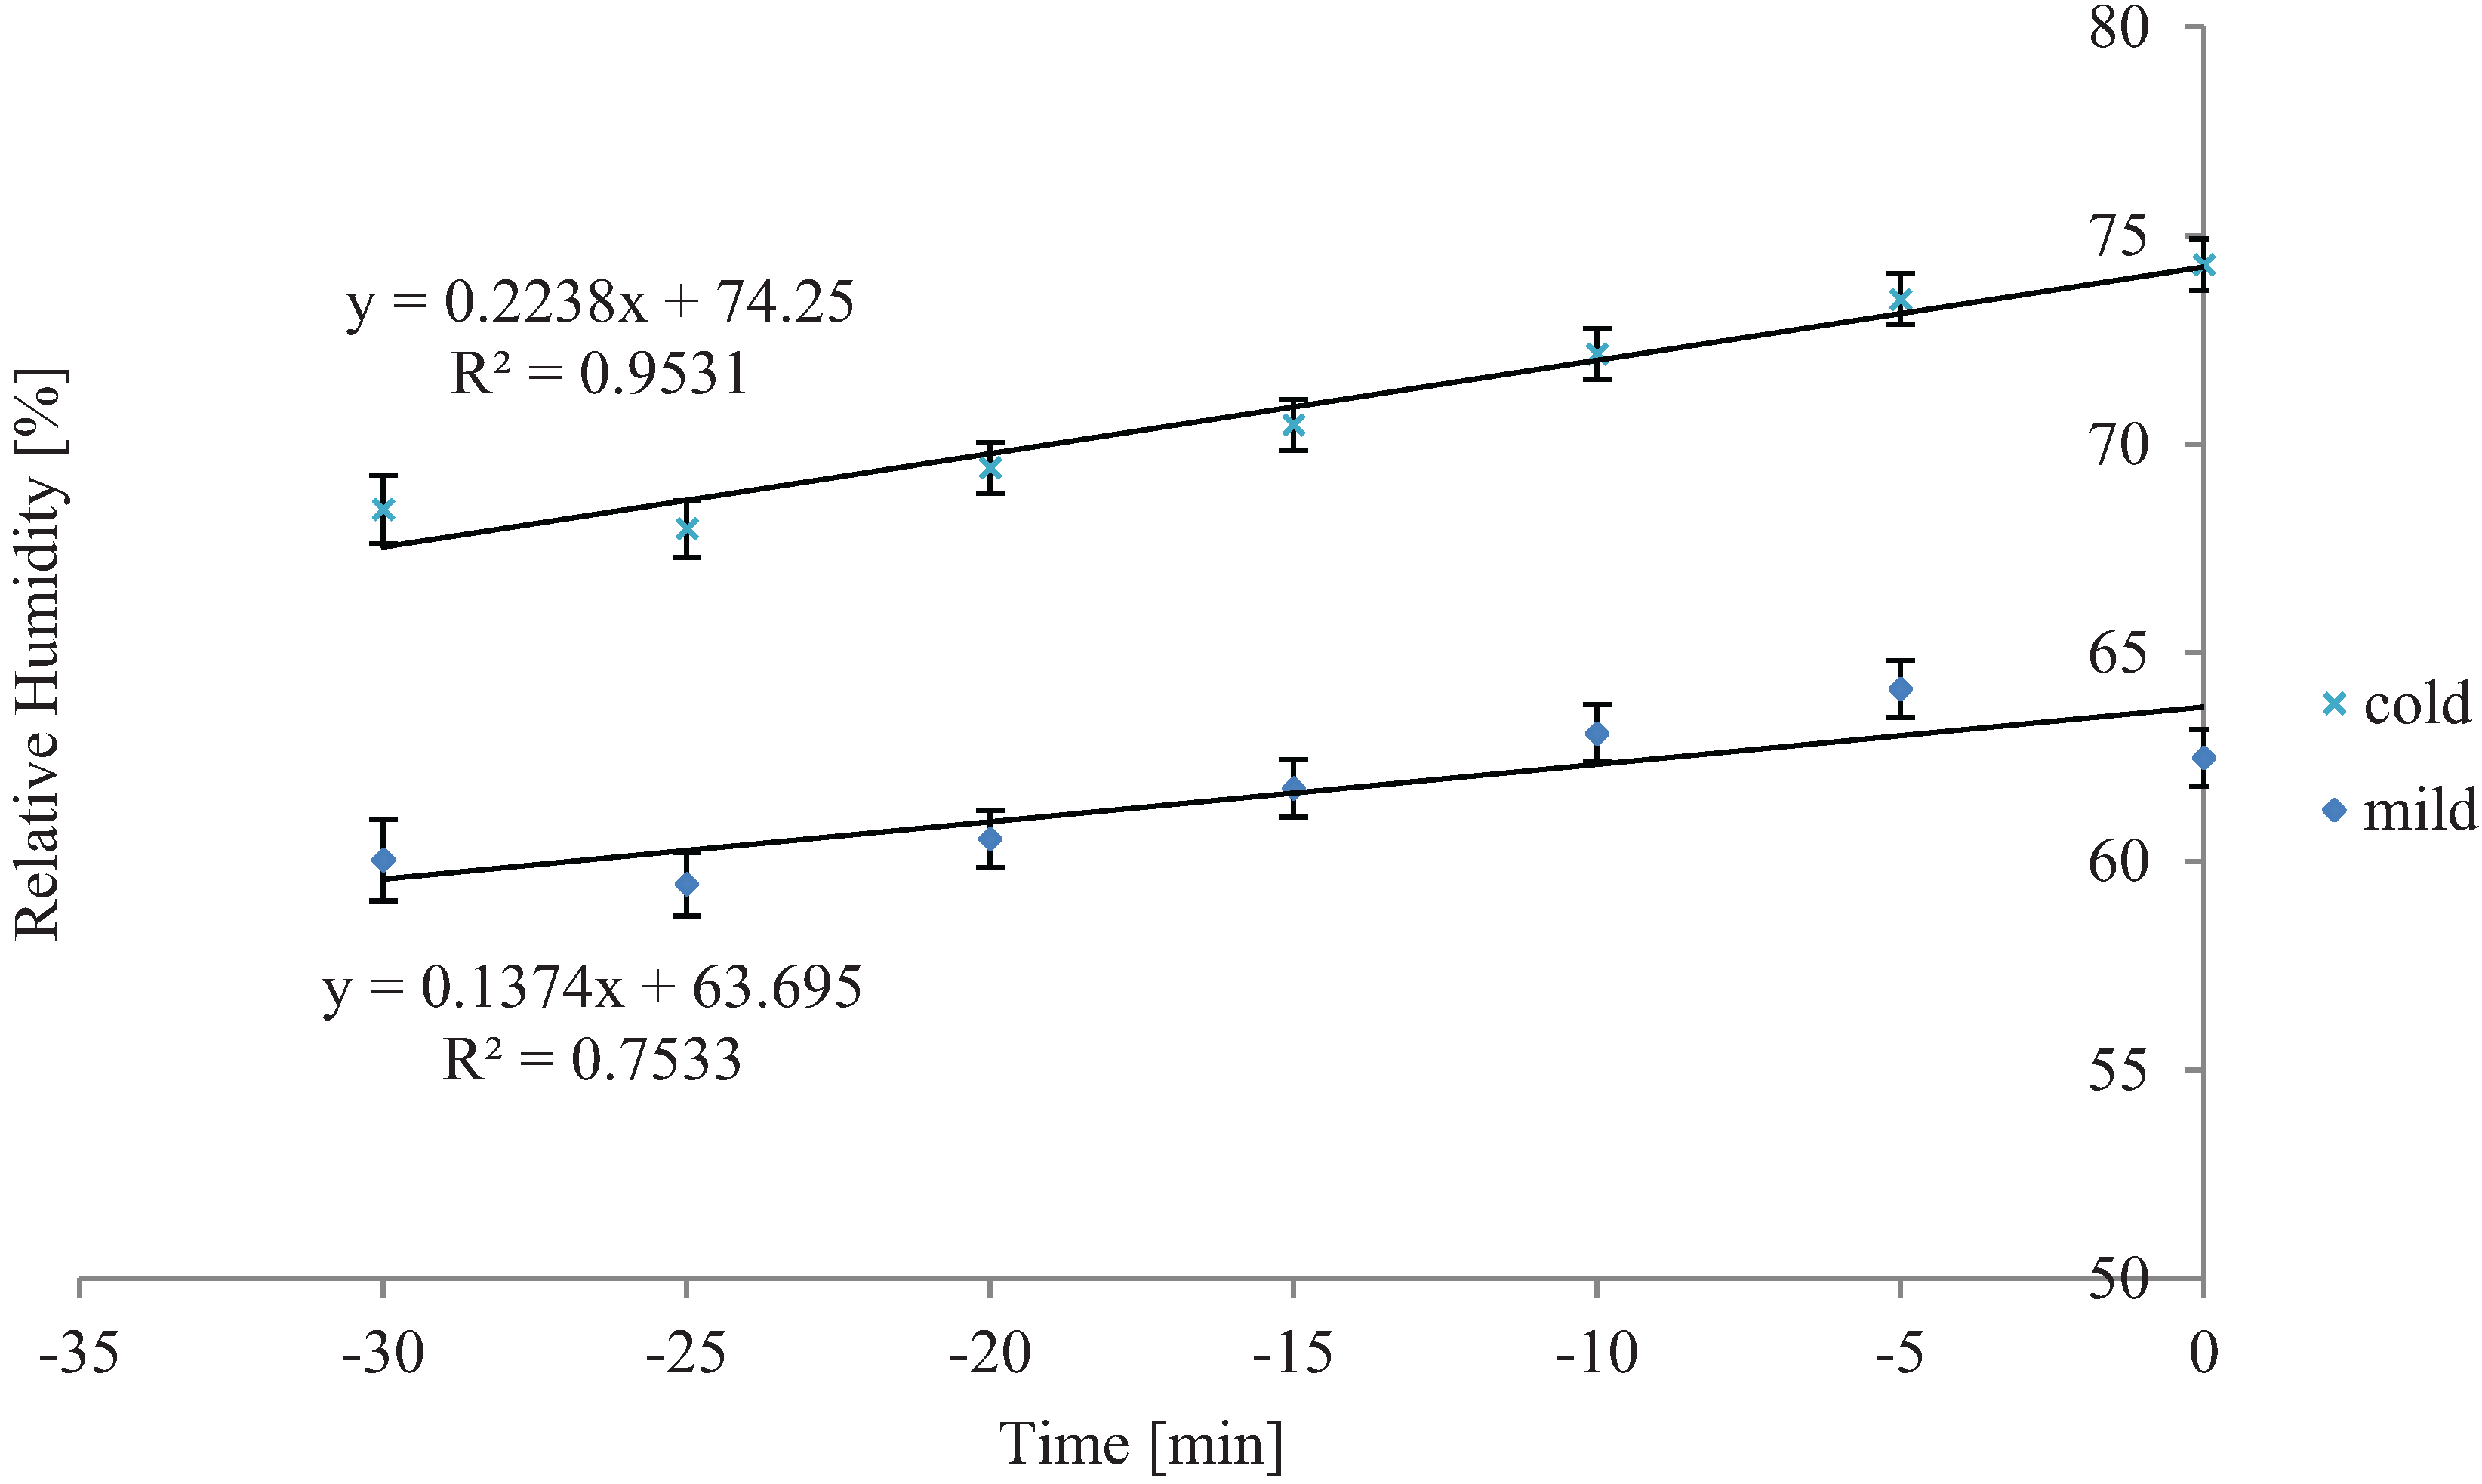
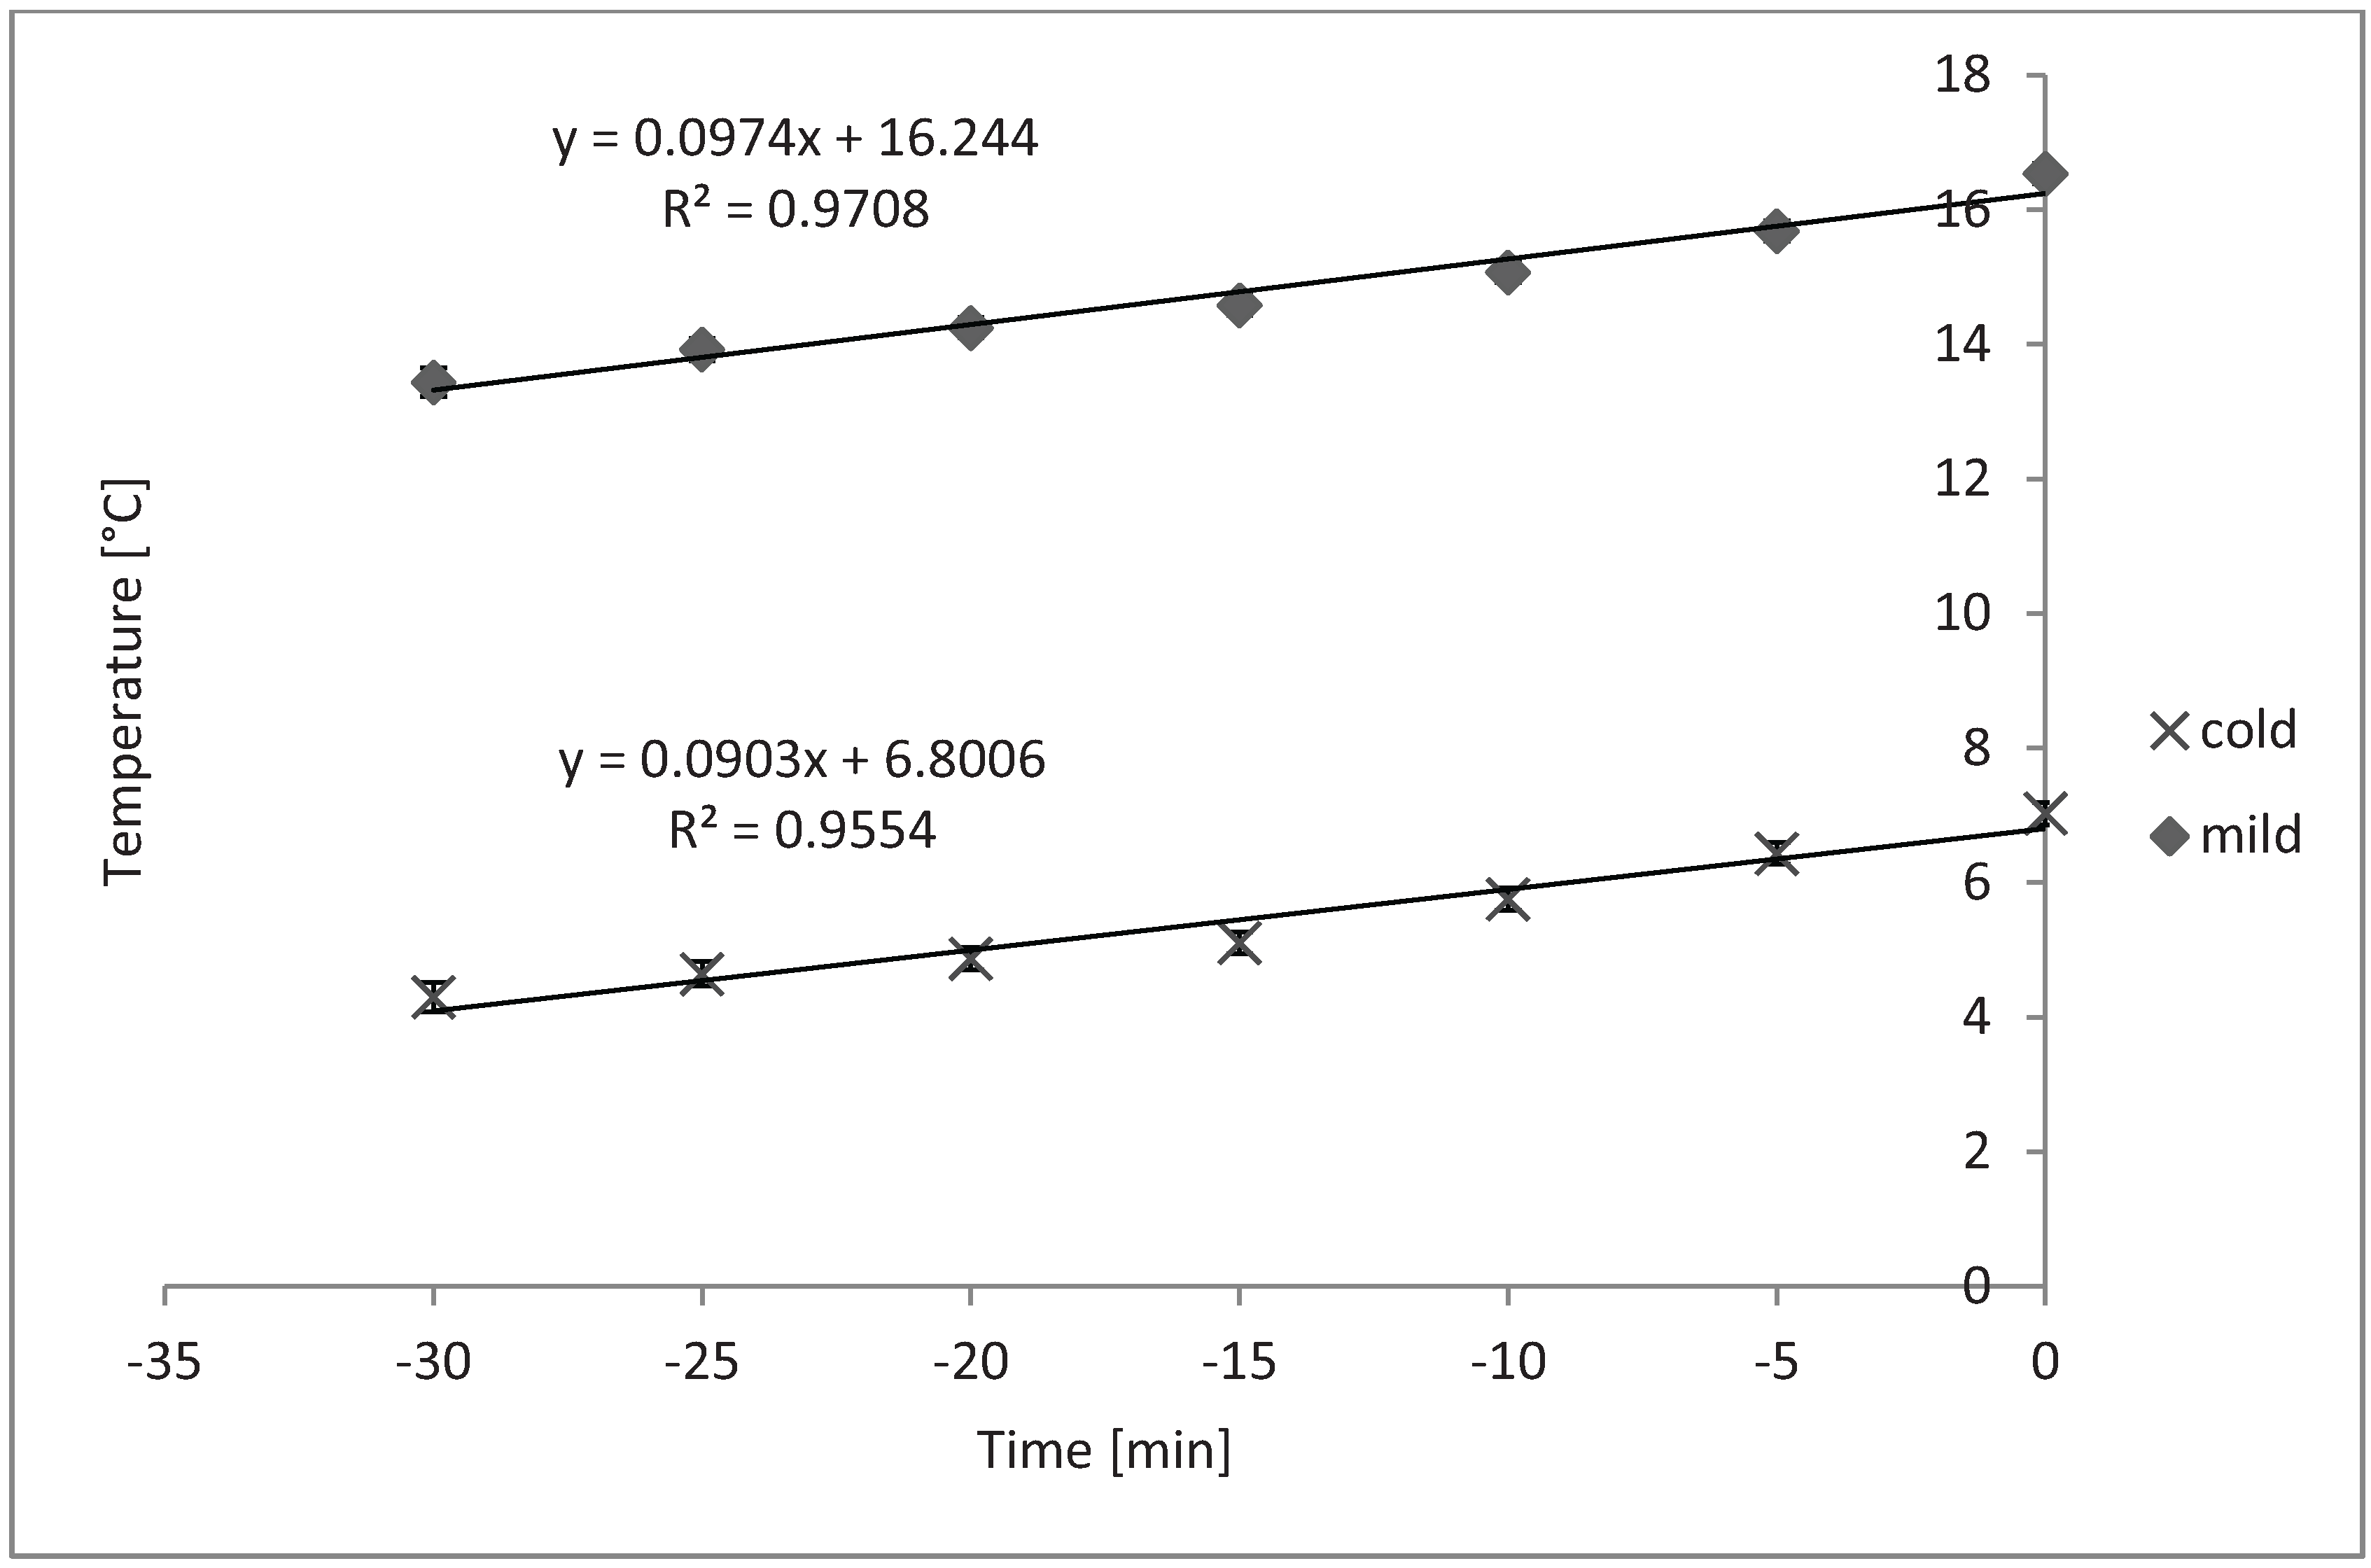
Average internal trailer temperature and RH increased linearly over time during loading in cold weather, and the slopes of these did not differ from each other (
Figure 1 and
Figure 2, respectively;
P < 0.05). Trailers increase internal air temperature about 0.1 °C per minute in a linear fashion during loading (
Figure 1). Likewise, trailer internal RH increased from 0.13% to 0.22% per minute during loading (
Figure 2).
Figure 1.
Overall linear time effect on average internal trailer temperature while loading during cold and mild weather (P < 0.01 and P < 0.01, respectively). Cold SEb = 0.06, n = 33 trailers; Mild SEb = 0.10, n = 21 trailers. Although slopes differed from zero, they did not differ between cold and mild seasons/temperatures (P = 0.56).
Figure 2.
Overall time effect on average internal trailer relative humidity inside while loading during winter and mild weather (P < 0.01 and P < 0.01, respectively). Cold SEb = 0.02, n = 33 trailers; Mild SEb = 0.02, n = 21 trailers. While slopes differed from zero, they did not differ between cold and mild seasons/temperatures (P = 0.50). Time zero represents when the trailer departed and −30 minutes is the time loading began.
Figure 3.
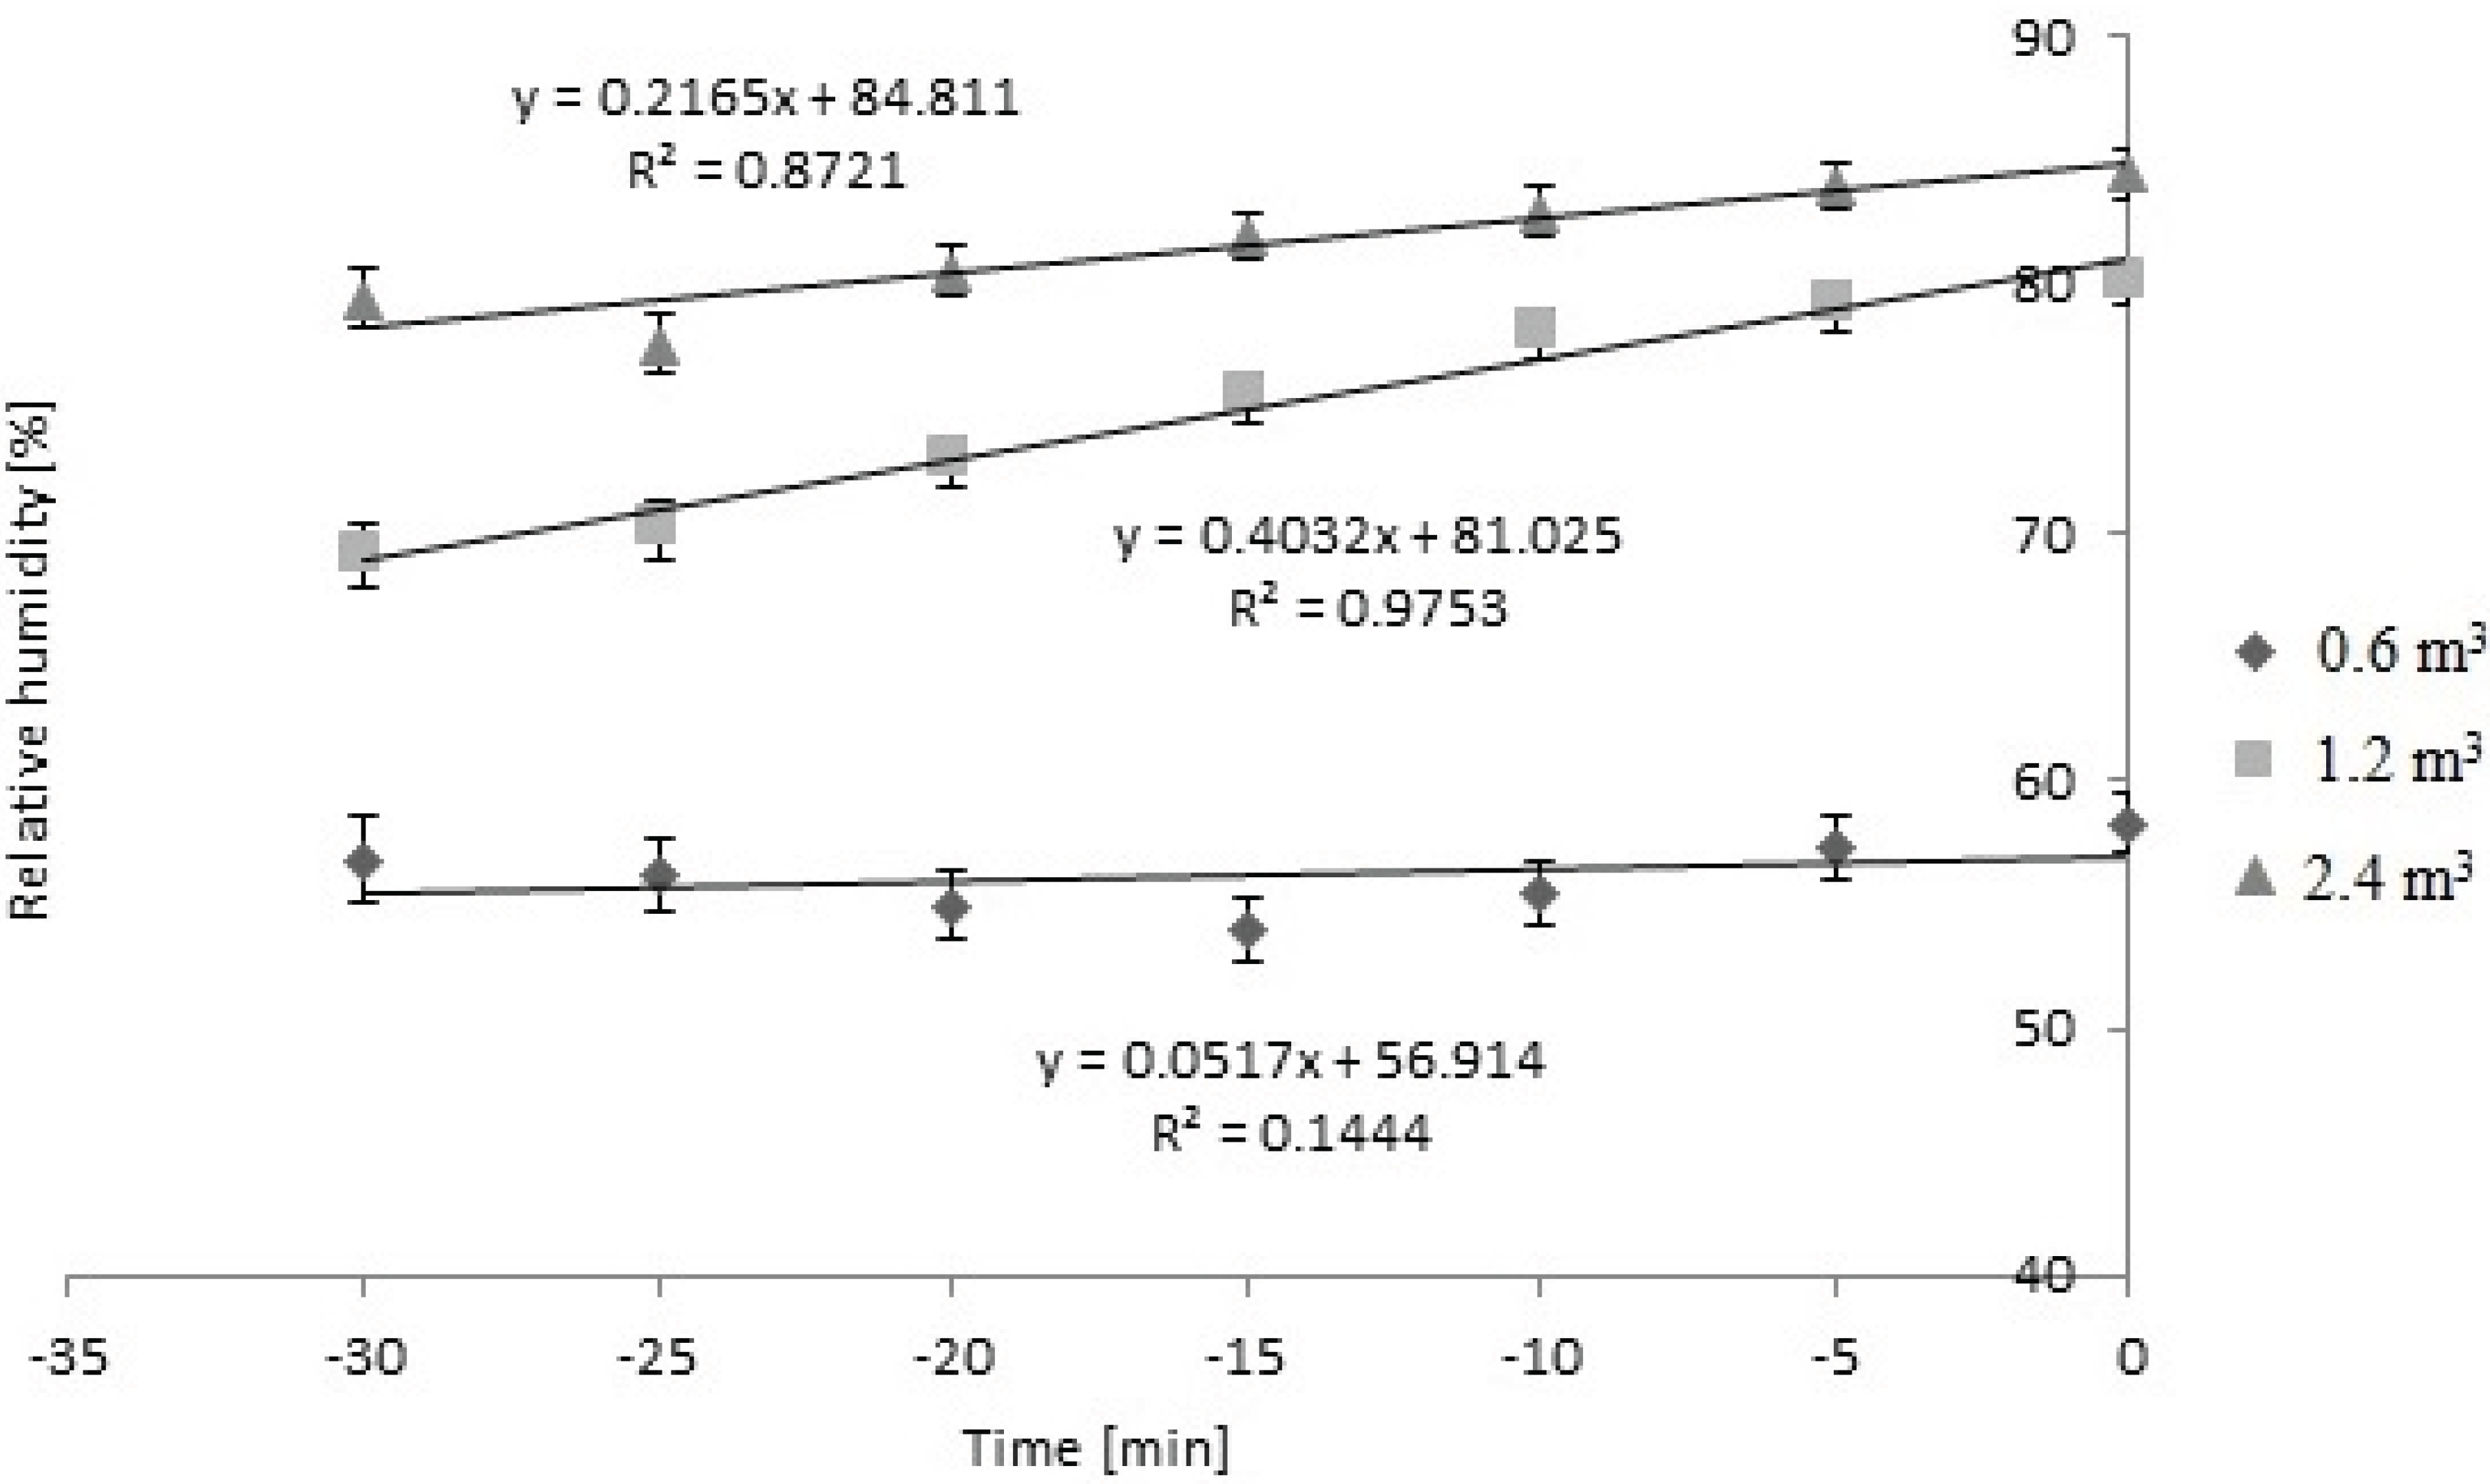
Bedding × time effect on relative humidity while loading during cold weather (P < 0.01). Three levels (0.6 m3, 1.2 m3, and 2.4 m3) of bedding were used. Slope was 0 when 0.6 m3 of bedding were used. Slopes differed from 0 when 1.2 m3, and 2.4 m3 of bedding were used (P < 0.05). 1.2 m3 SEb = 0.03, n = 14 trailers; 2.4 m3 SEb = 0.06, n = 12 trailers. Slopes of 1.2 m3 and 2.4 m3 did not differ from each other (P > 0.05).
Figure 3.
Bedding × time effect on relative humidity while loading during cold weather (P < 0.01). Three levels (0.6 m3, 1.2 m3, and 2.4 m3) of bedding were used. Slope was 0 when 0.6 m3 of bedding were used. Slopes differed from 0 when 1.2 m3, and 2.4 m3 of bedding were used (P < 0.05). 1.2 m3 SEb = 0.03, n = 14 trailers; 2.4 m3 SEb = 0.06, n = 12 trailers. Slopes of 1.2 m3 and 2.4 m3 did not differ from each other (P > 0.05).
As shown in
Figure 3, there was a bedding × time effect on RH while loading in cold weather (
P < 0.01).
Relative humidity inside the trailer did not change during loading in the winter season when 0.6 m3 of bedding were used (P > 0.05); however, RH increased linearly when 1.2 m3 and 2.4 m3 were used during loading (P < 0.05). The slopes did not differ from each other (P > 0.05).
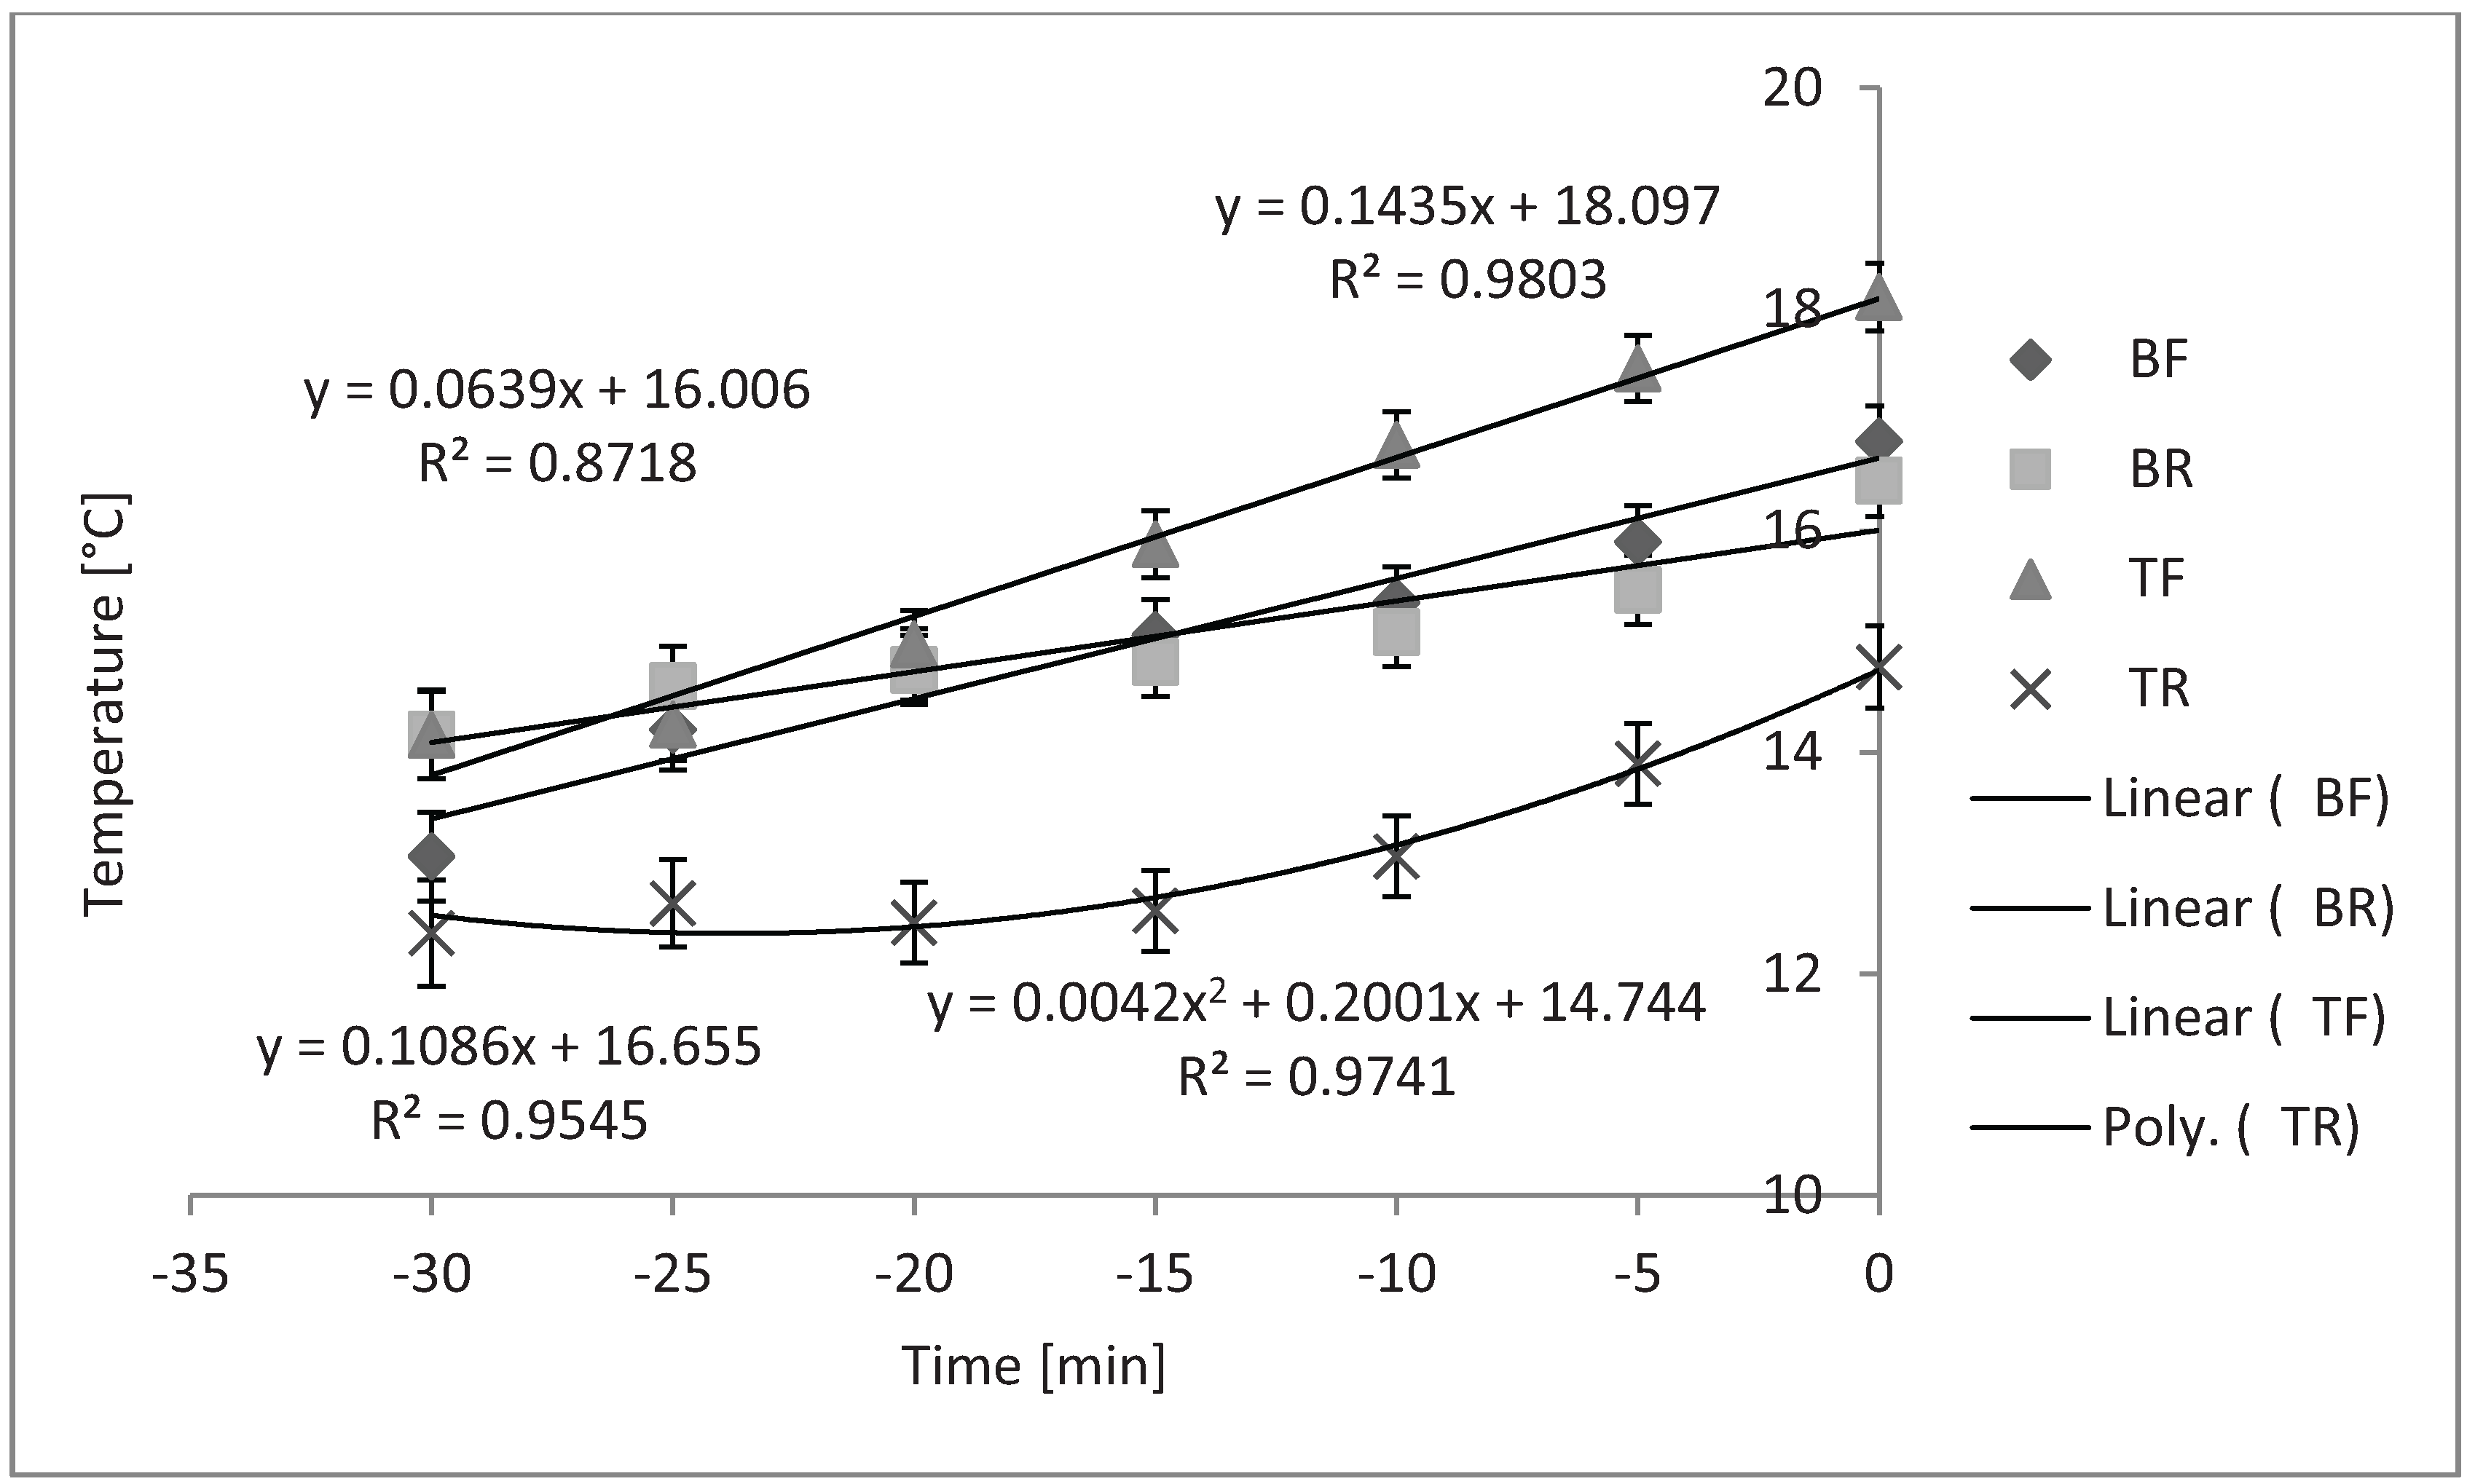
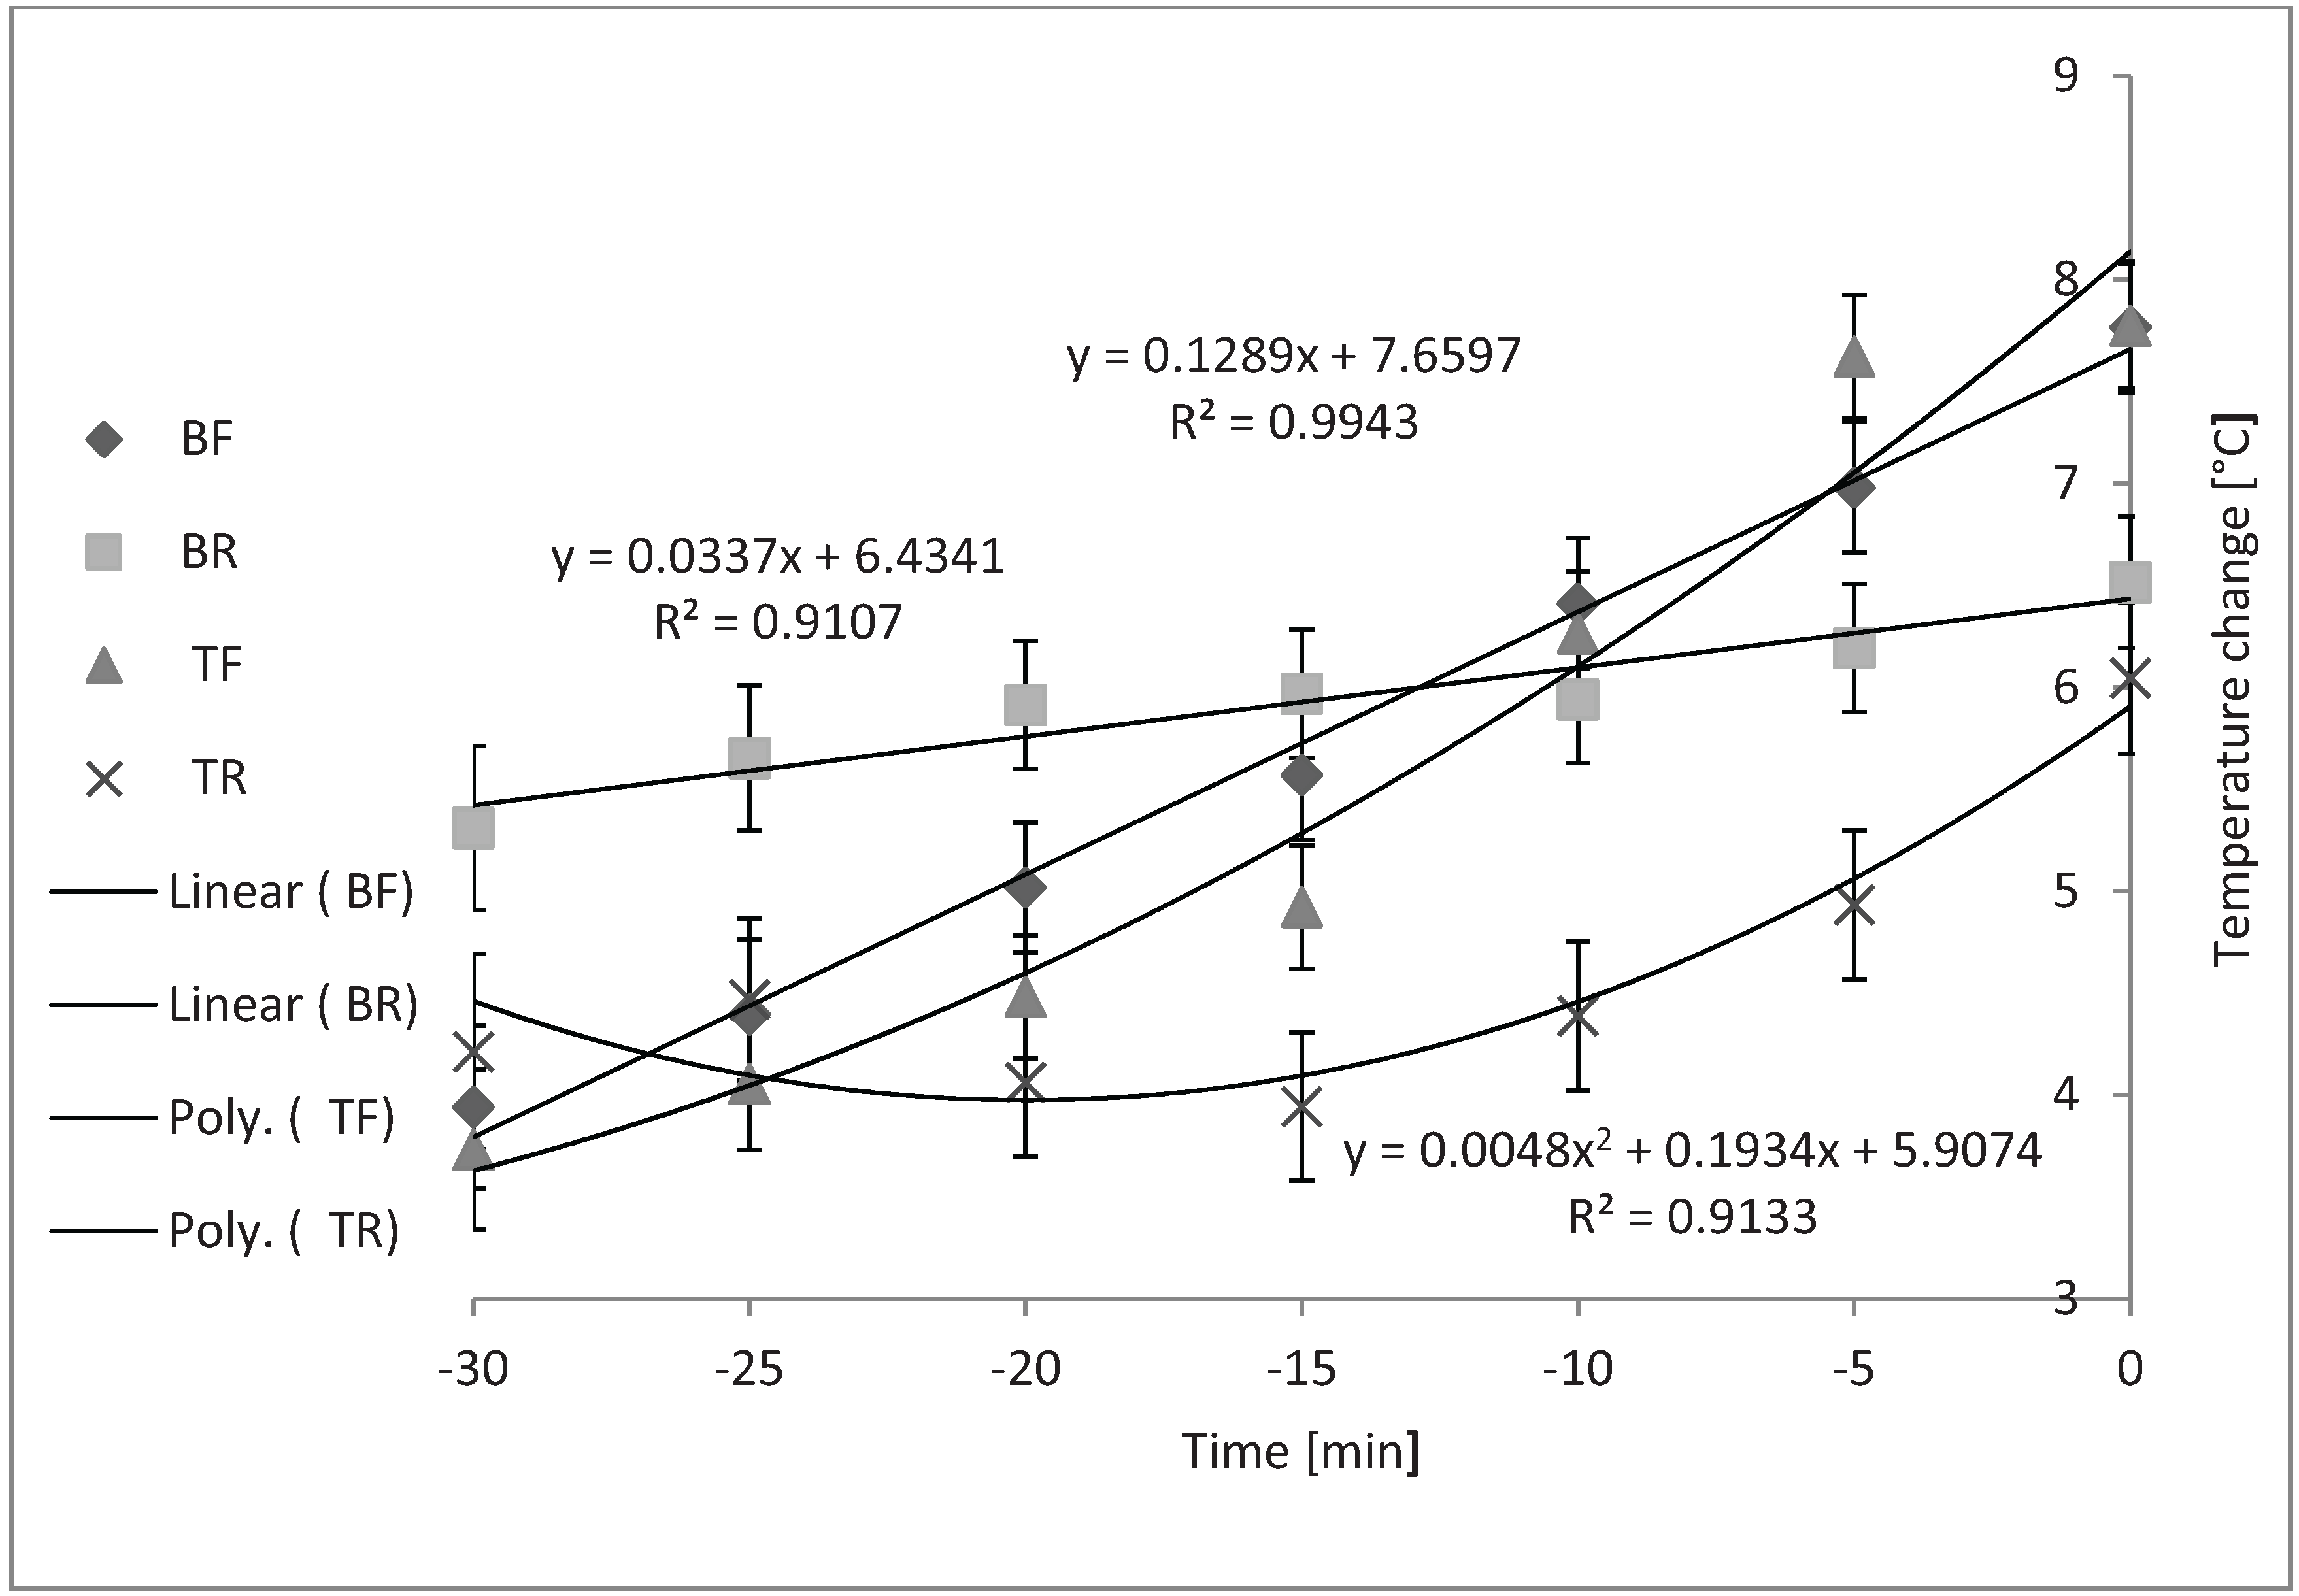
Figure 4 shows that the compartment × time effect was also significant while loading in the winter season (
P < 0.01). Slopes and correlations were found to be: y = 0.1289x + 7.6597, R
2 = 0.9943 (BF); y = 0.0337x + 6.4341, R
2 = 0.9107 (BR); and y = 0.0048x
2 + 0.1934x + 5.9074, R
2 = 0.9133 (TR).
Figure 4.
Compartment × time effect on average internal trailer temperature while loading during cold weather (P < 0.01; n = 33). Slopes of BF and BR were not different from zero. Slopes of TF (SEb < 0.01) and TR (SEb < 0.05), differed from zero, but were not different from each other.
Figure 4.
Compartment × time effect on average internal trailer temperature while loading during cold weather (P < 0.01; n = 33). Slopes of BF and BR were not different from zero. Slopes of TF (SEb < 0.01) and TR (SEb < 0.05), differed from zero, but were not different from each other.
BF = bottom front, BR = bottom rear, TF = top front, TR = top rear compartments.
Temperatures in the BF and BR compartments did not change over time. Temperatures in the TF and TR compartments changed in quadratic fashion, but the slopes did not differ from each other.
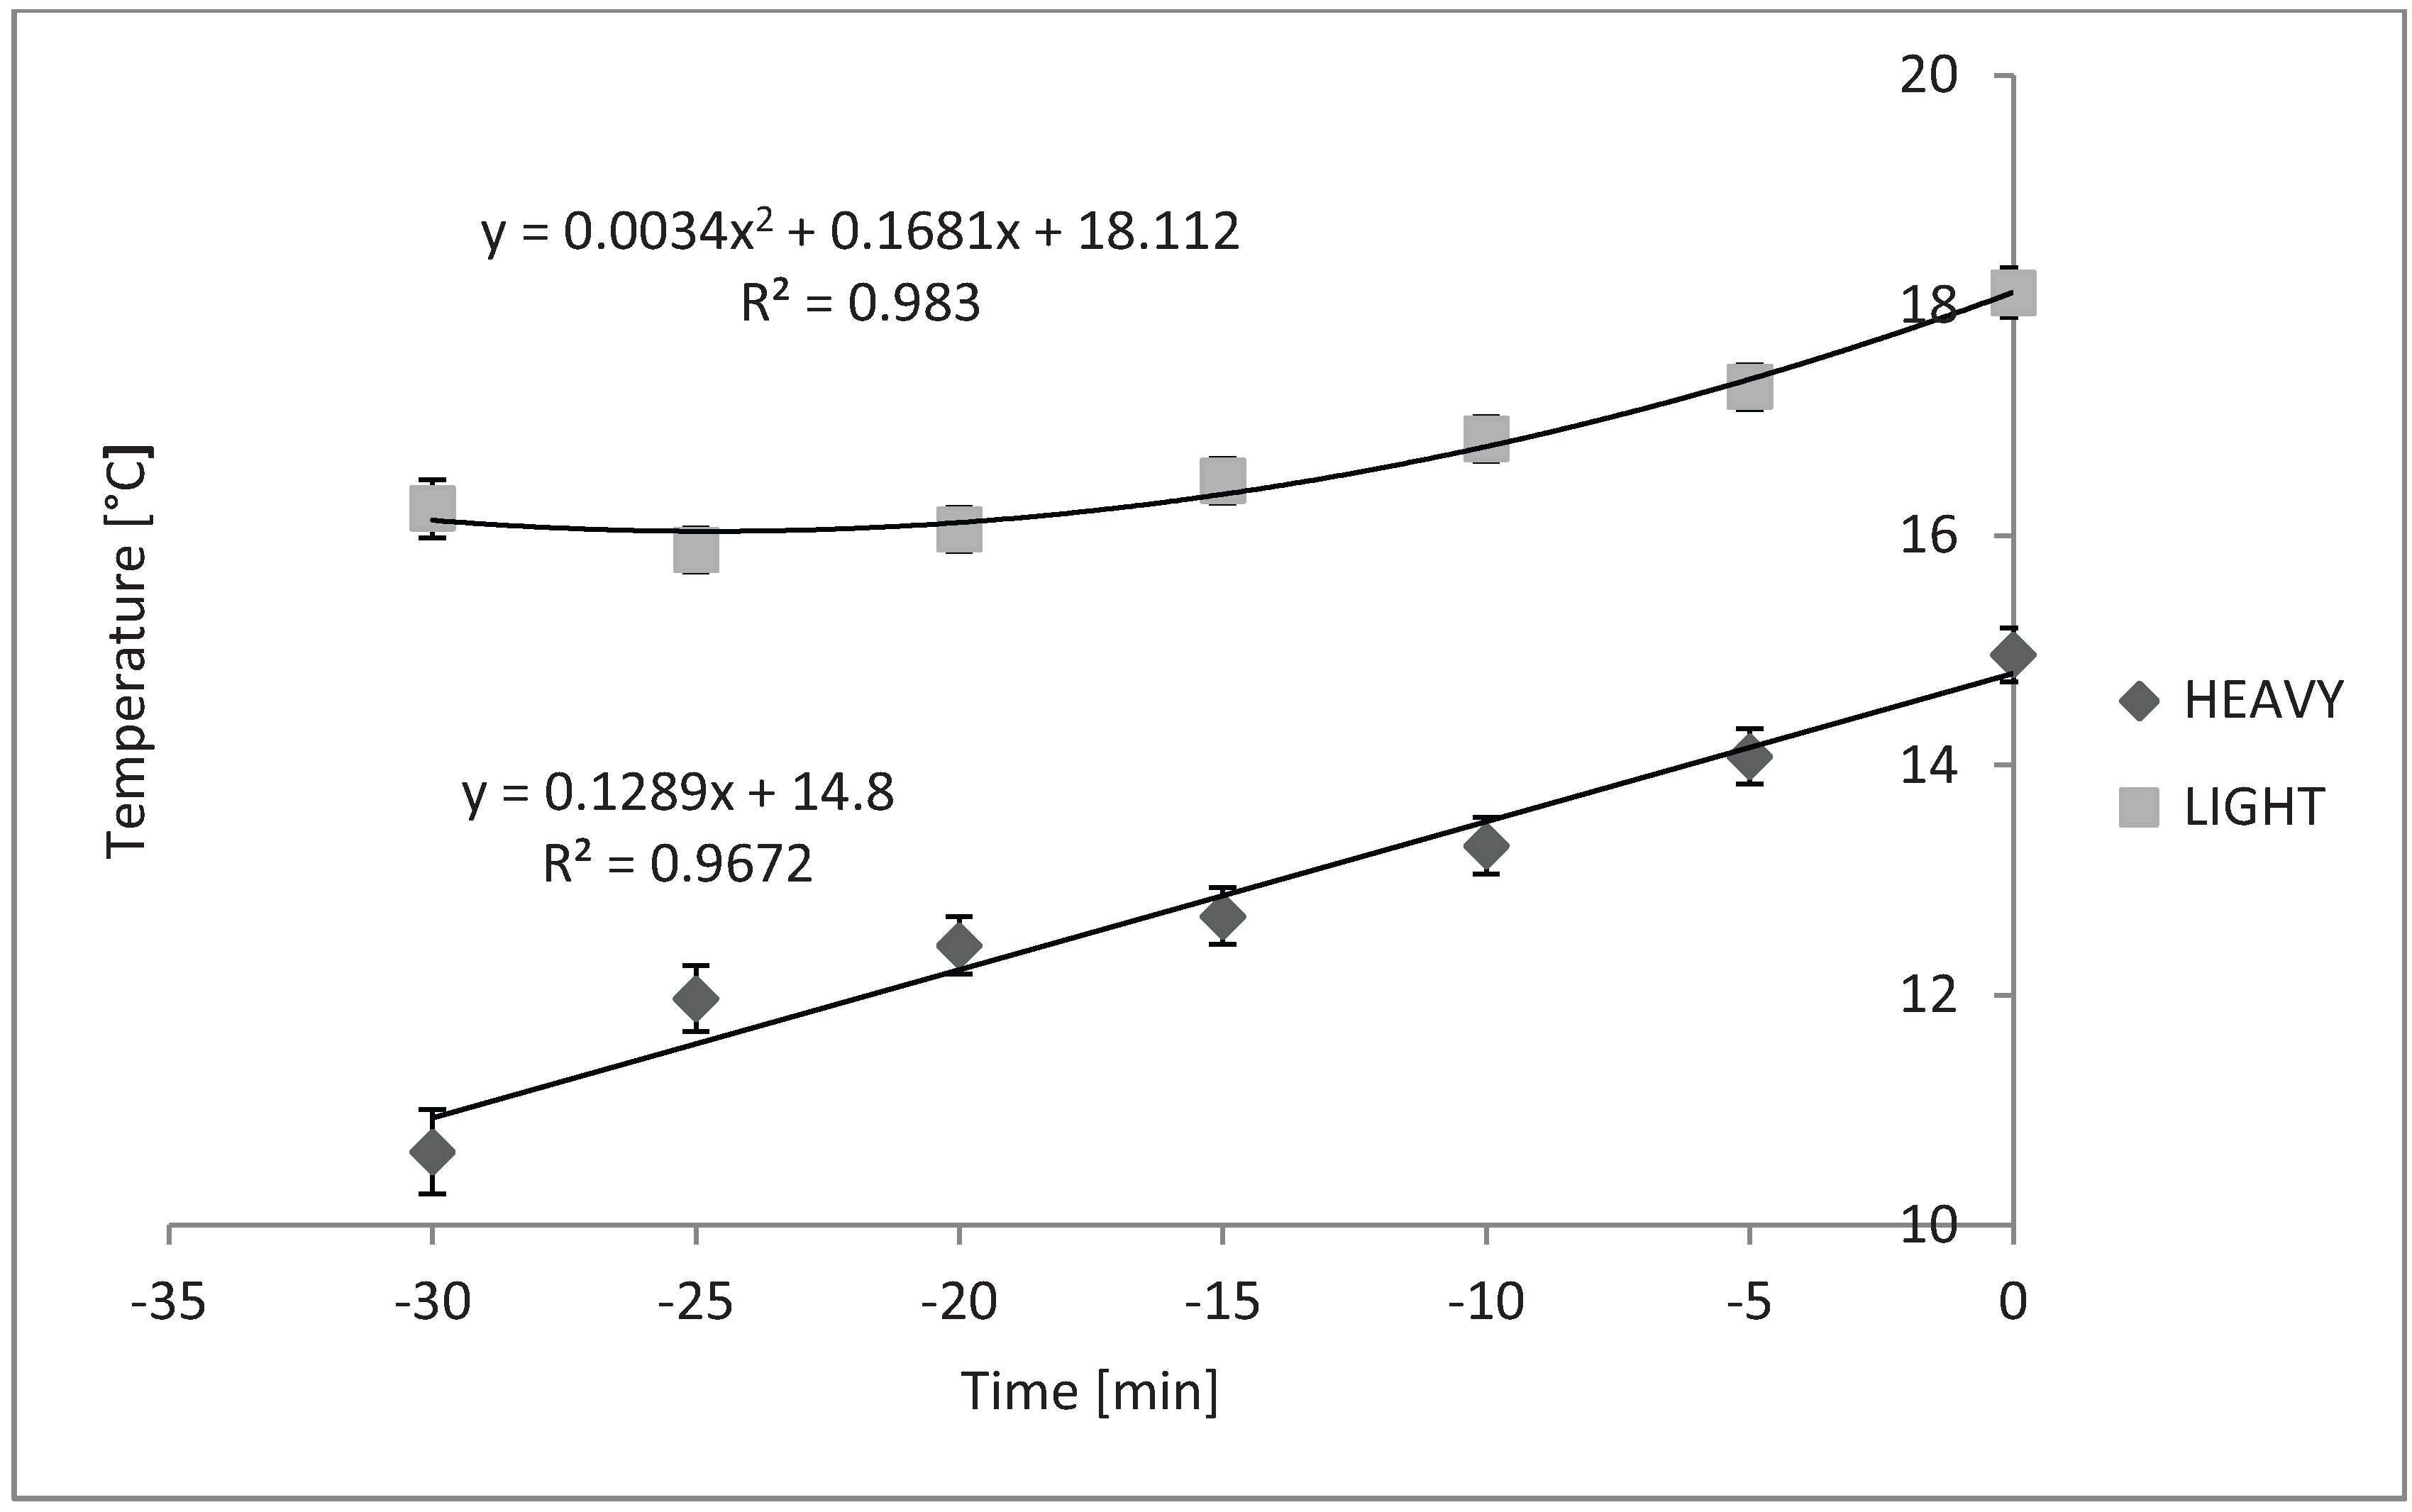
Figure 5 shows the time × bedding level effect on internal trailer temperature in mild weather (
P < 0.01).
Internal trailer temperature changed in a quadratic fashion when 0.6 m
3 were used and in a linear fashion when 1.2 m
3 or 2.4 m
3 were used in the trailers. The compartment × time effect was also significant during loading in mild weather, as shown in
Figure 6 (
P = 0.02).
Figure 5.
Time × bedding level effect on temperature while loading during mild weather (P < 0.01). 0.6 m3 (n = 13 trailers) and 1.2 m3 or 2.4 m3 (n = 9 trailers) bedding levels were used. 0.6 m3 SEb < 0.01 and 1.2 m3 or 2.4 m3 = 0.11. There was a quadratic change in internal trailer temperature when light bedding was used and linear increase in internal trailer temperature when heavy bedding was used during loading in mild season/temperatures (P = 0.04 and P < 0.01, respectively).
Figure 6.
Compartment × time effect on internal trailer temperature while loading during mild weather (n = 21). Slopes of BF, BR and TR did not differ over time. Slope of TF was linear over time while loading in mild weather (P = 0.02, SEb = 0.14).
Figure 6.
Compartment × time effect on internal trailer temperature while loading during mild weather (n = 21). Slopes of BF, BR and TR did not differ over time. Slope of TF was linear over time while loading in mild weather (P = 0.02, SEb = 0.14).
BF = bottom front, BR = bottom rear, TF = top front, TR = top rear compartments.
The regression slope for the BF, BR, and TR compartments did not differ from zero while slopes for the TF compartment was linear (
P = 0.02).
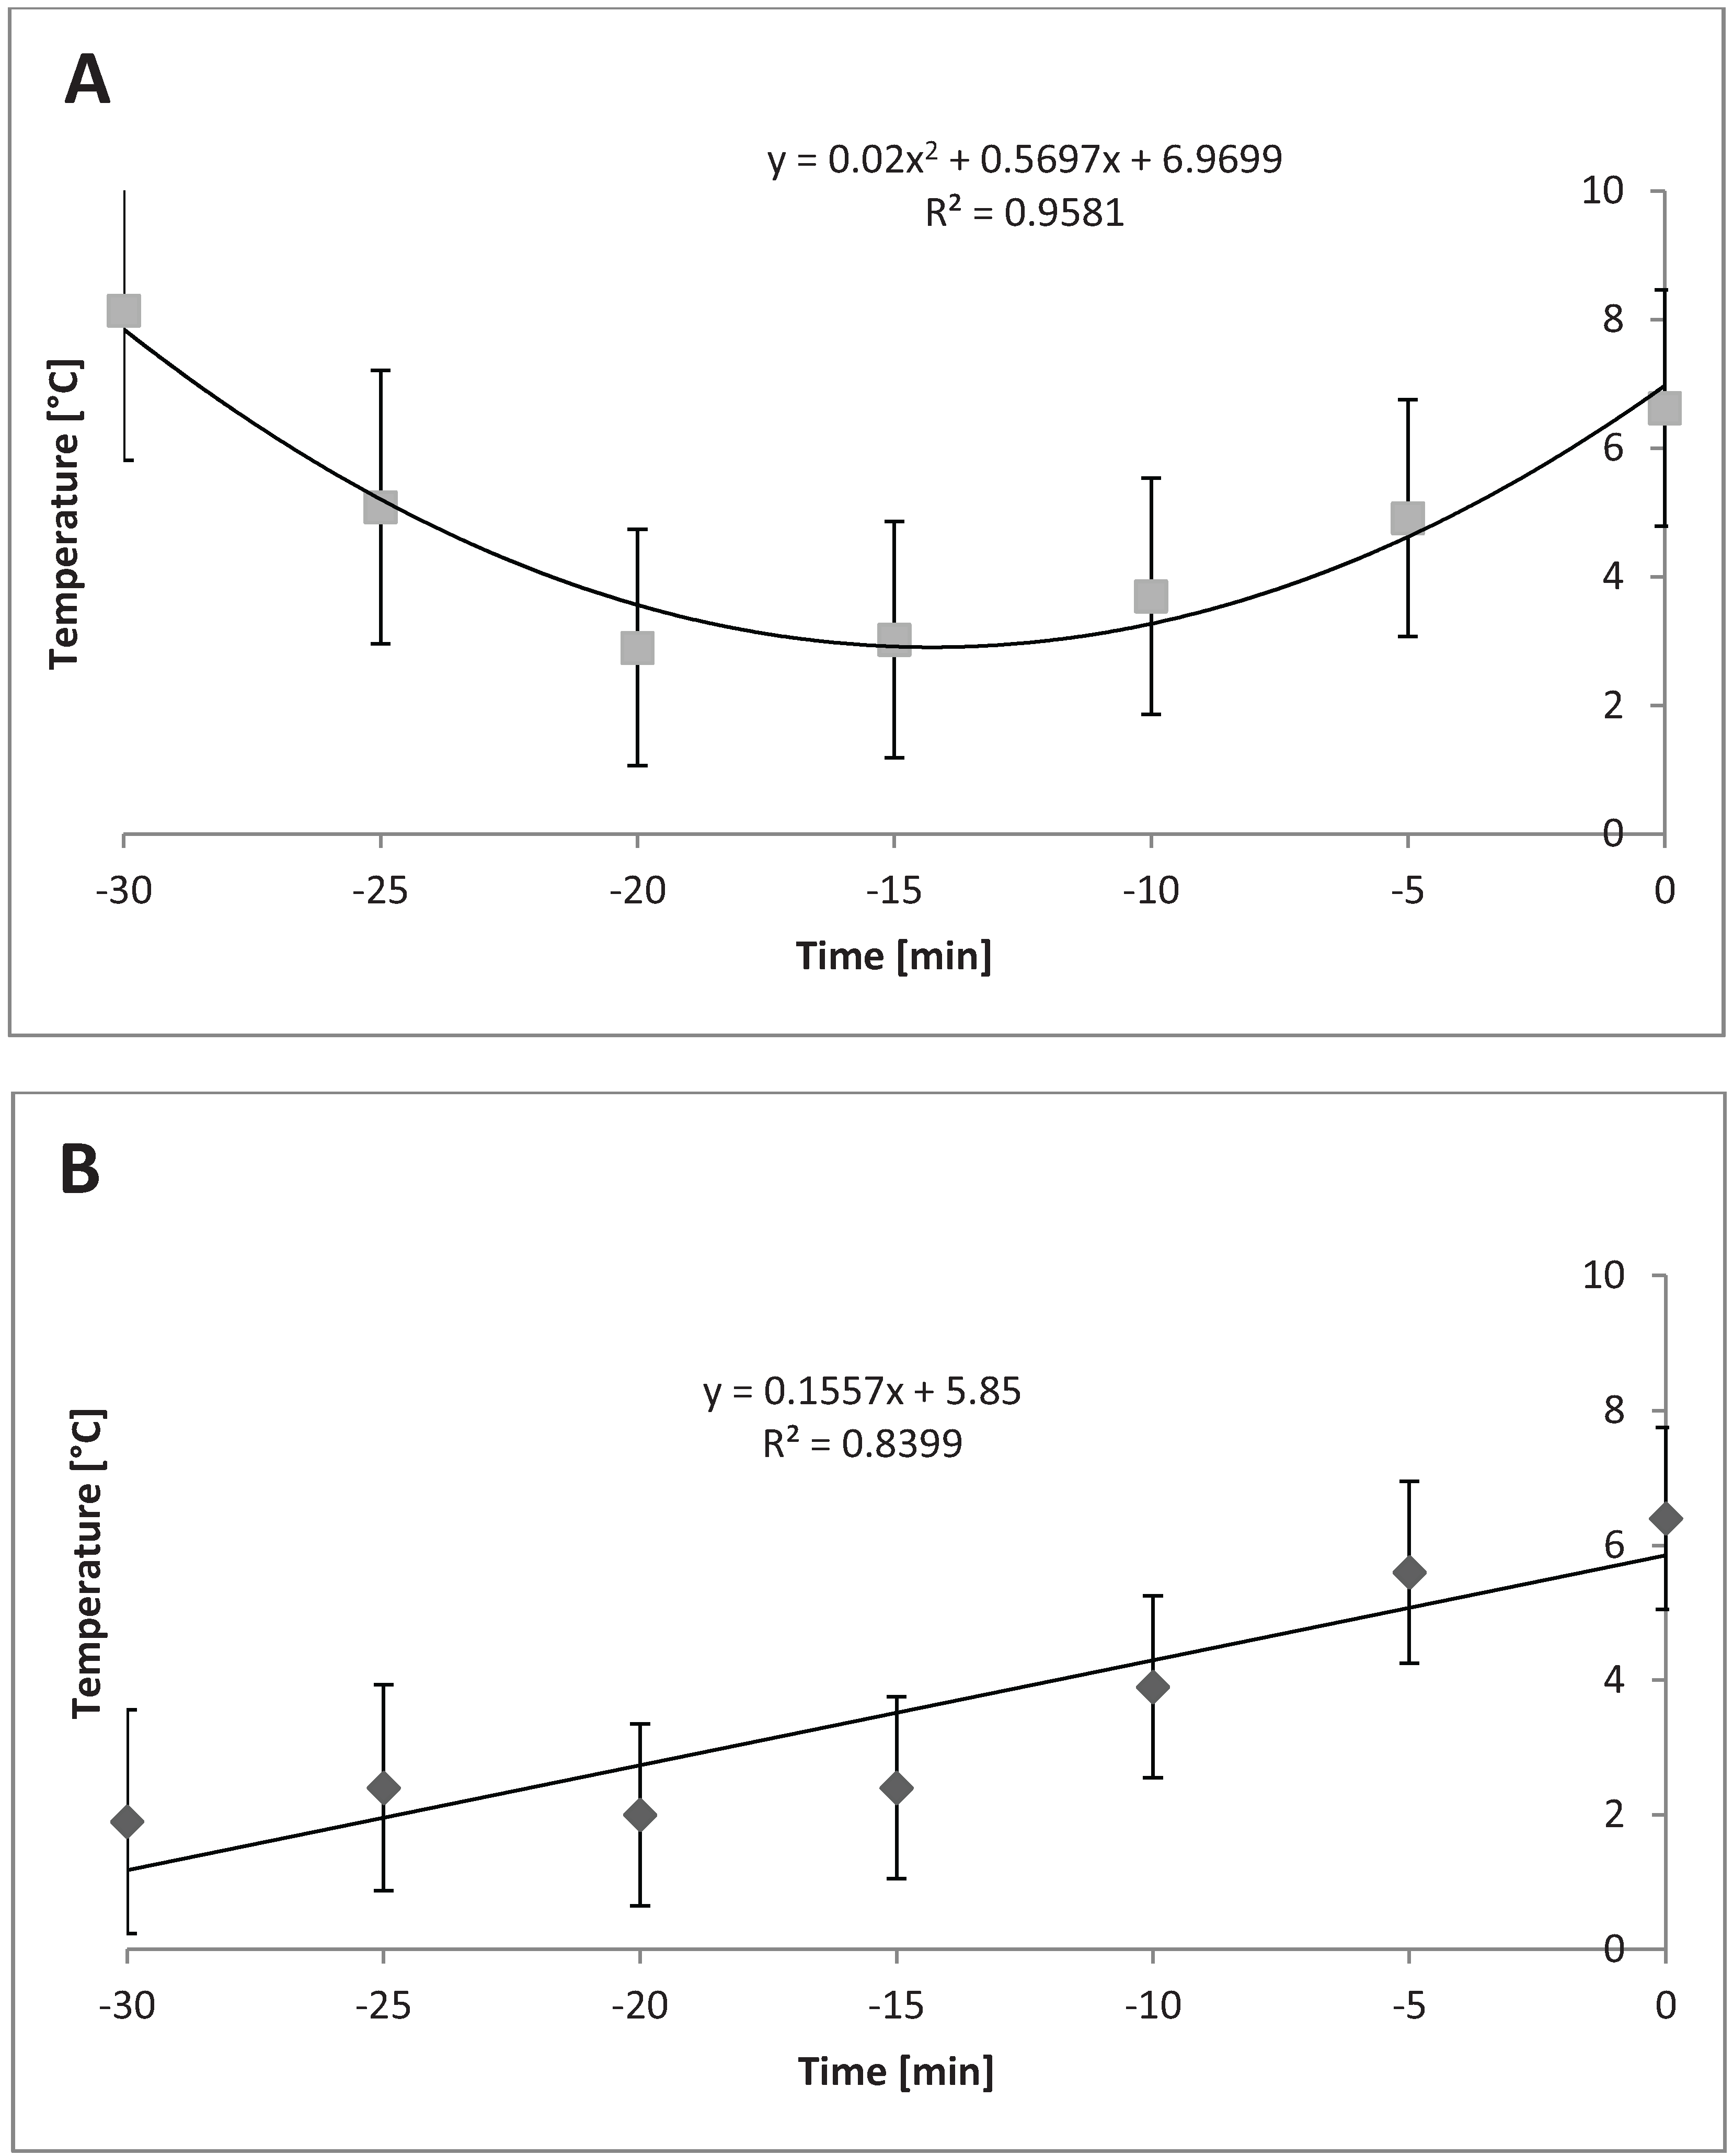
Figure 7A shows the quadratic change in temperature in the TR compartment during loading over time when 1.2 m
3 of bedding were used in cold weather (
P = 0.02). Temperature in the TF compartment changed linearly over time when 2.4 m
3 of bedding were used, as shown in
Figure 7B (
P < 0.01).
Figure 7.
Temperature in cold weather in different compartments of trailer when different levels of bedding are used (n = 33 trailers). (A) Quadratic change in temperature in top rear compartment over time when using 1.2 m3 of bedding during cold (P = 0.02, SEb < 0.01). (B) Linear change in temperature in top front compartment when using 2.4 m3 of bedding during cold (P < 0.01, SEb = 0.18).
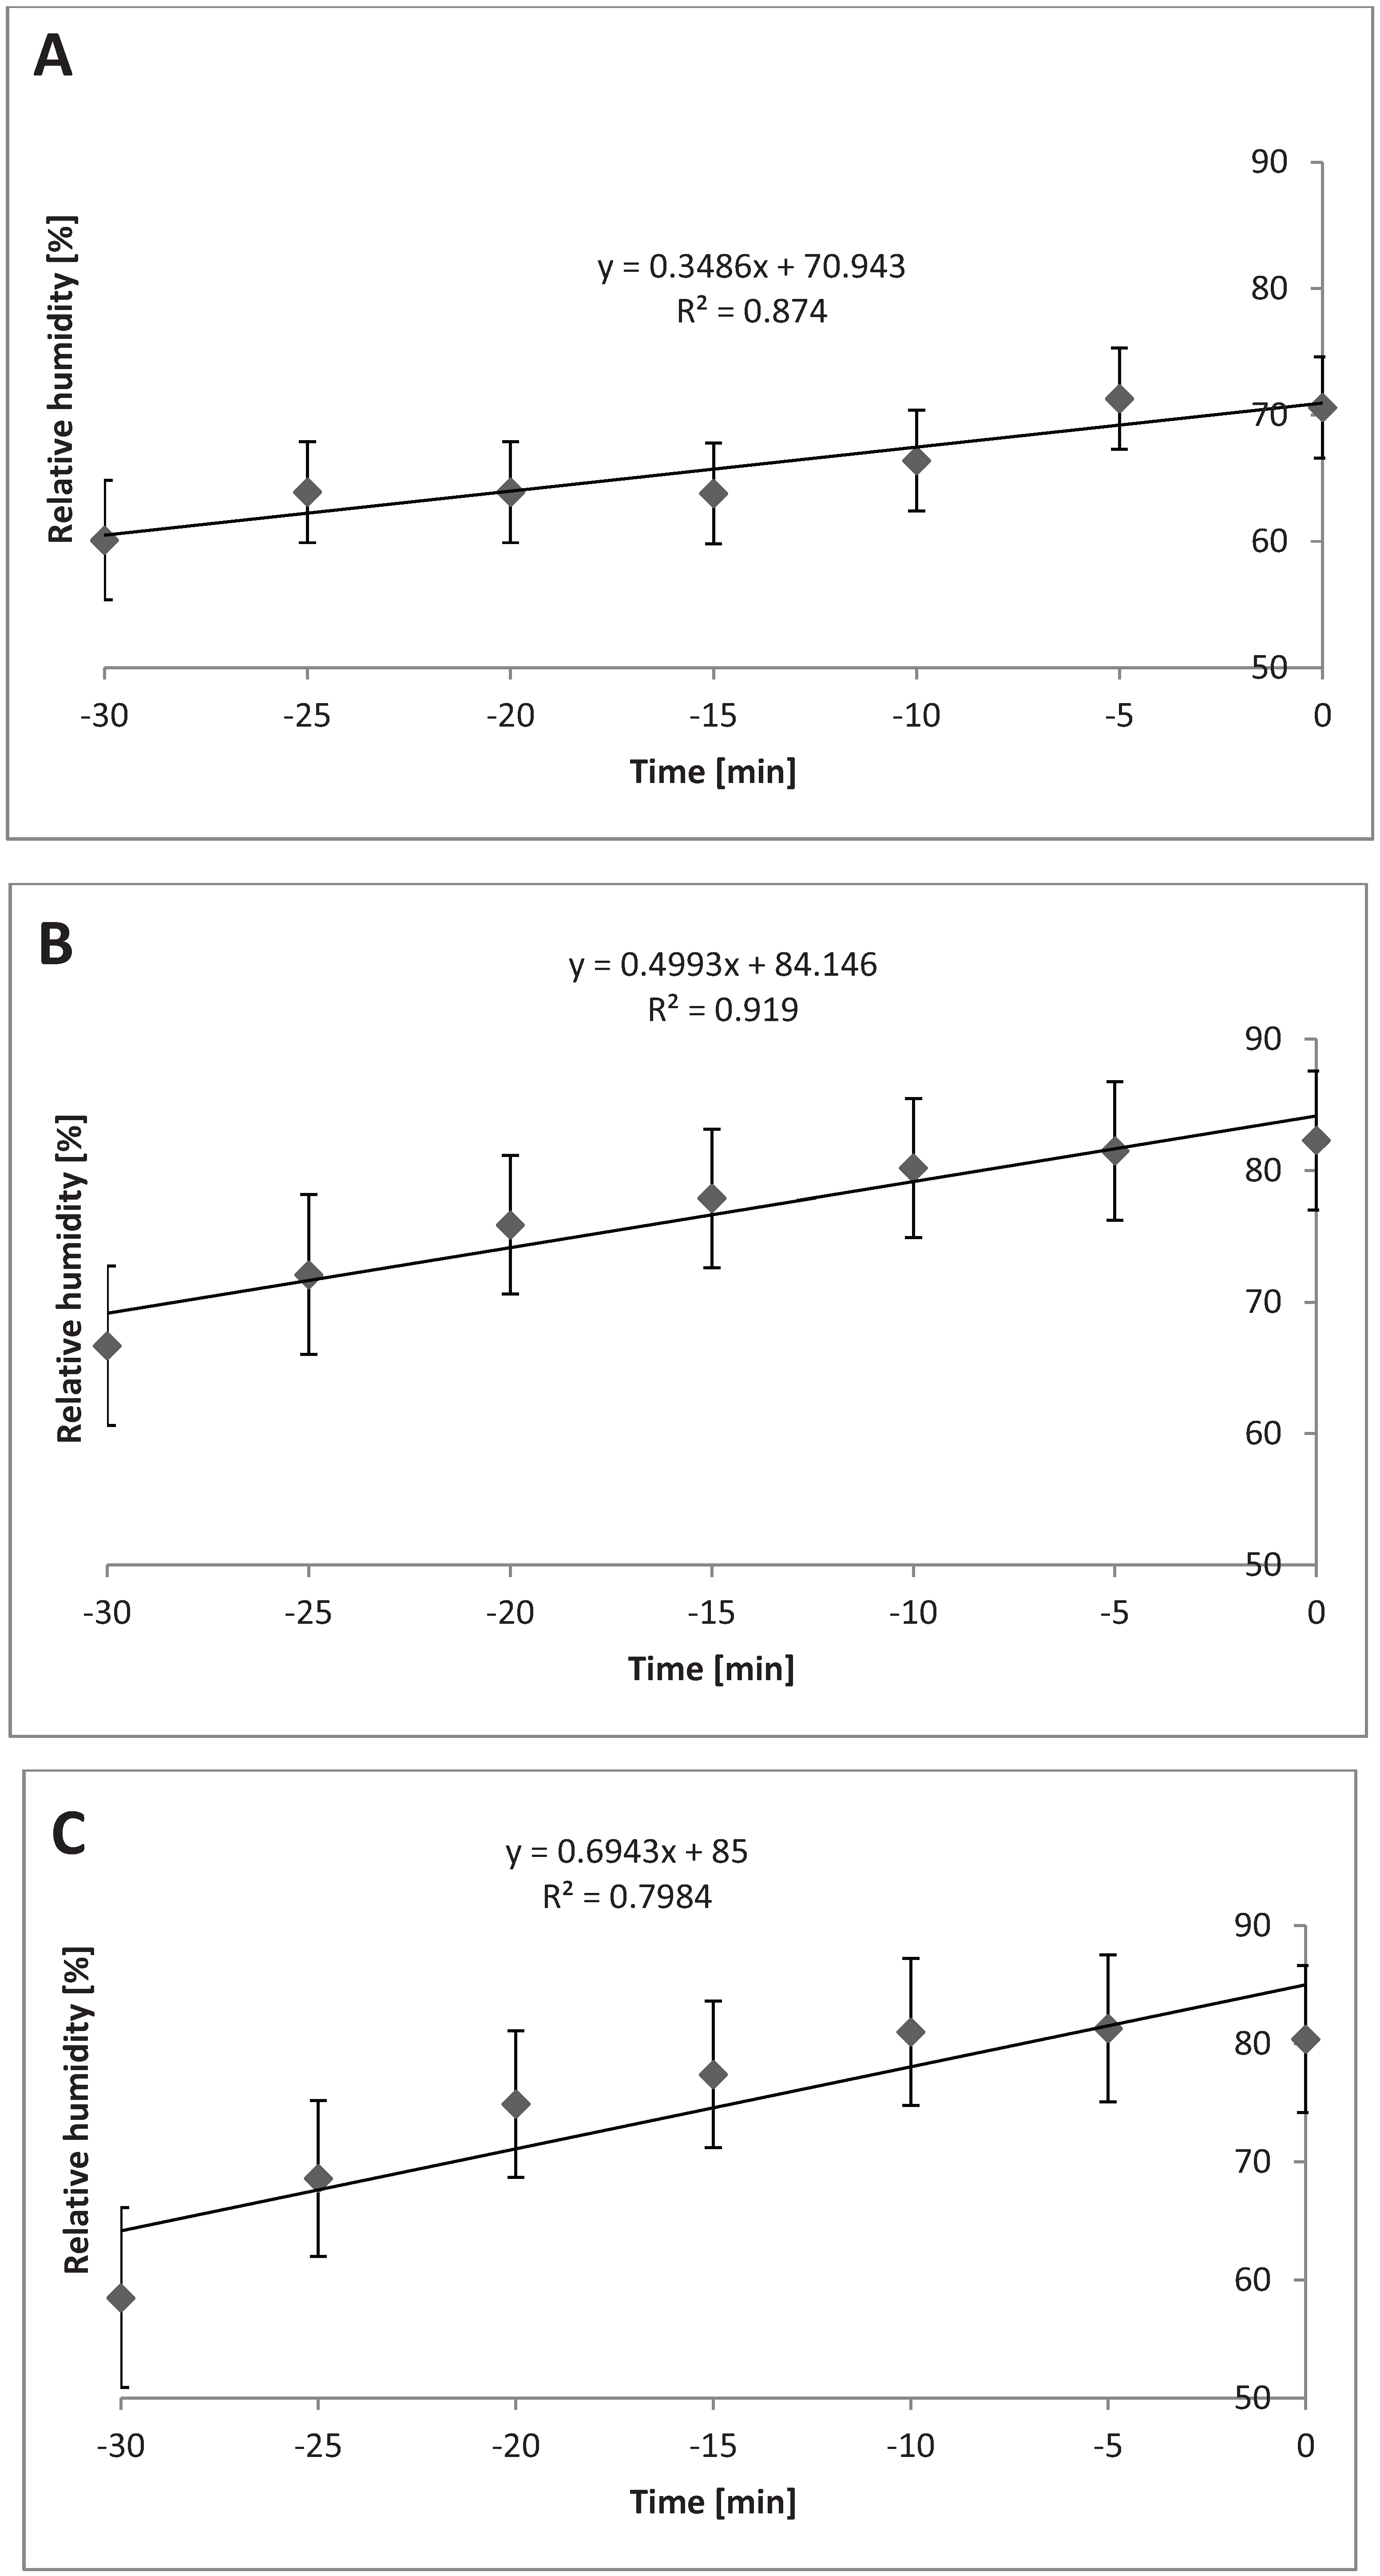
Relative humidity in the compartments at different bedding levels in cold season/temperatures changed linearly over time during loading in the following scenarios: TF with 0.6 m
3 of bedding (
P = 0.03); BF with 1.2 m
3 (
P = 0.02); and TF with 1.2 m
3 (
P = 0.01).
Figures 8A, 8B, and 8C show each of these relationships.
Figure 8.
Relative humidity in cold weather (n = 33 trailers) in different compartments of trailer when different levels of bedding are used. (A) Linear change in relative humidity in top front compartment while using 0.6 m3 bedding during cold (P = 0.03, SEb = 0.54). (B) Linear change in relative humidity in bottom front compartment when using 1.2 m3 bedding during cold (P = 0.02, SEb = 0.70). (C) Linear change in relative humidity in top front compartment when using 1.2 m3 bedding during cold (P = 0.01, SEb = 0.84).
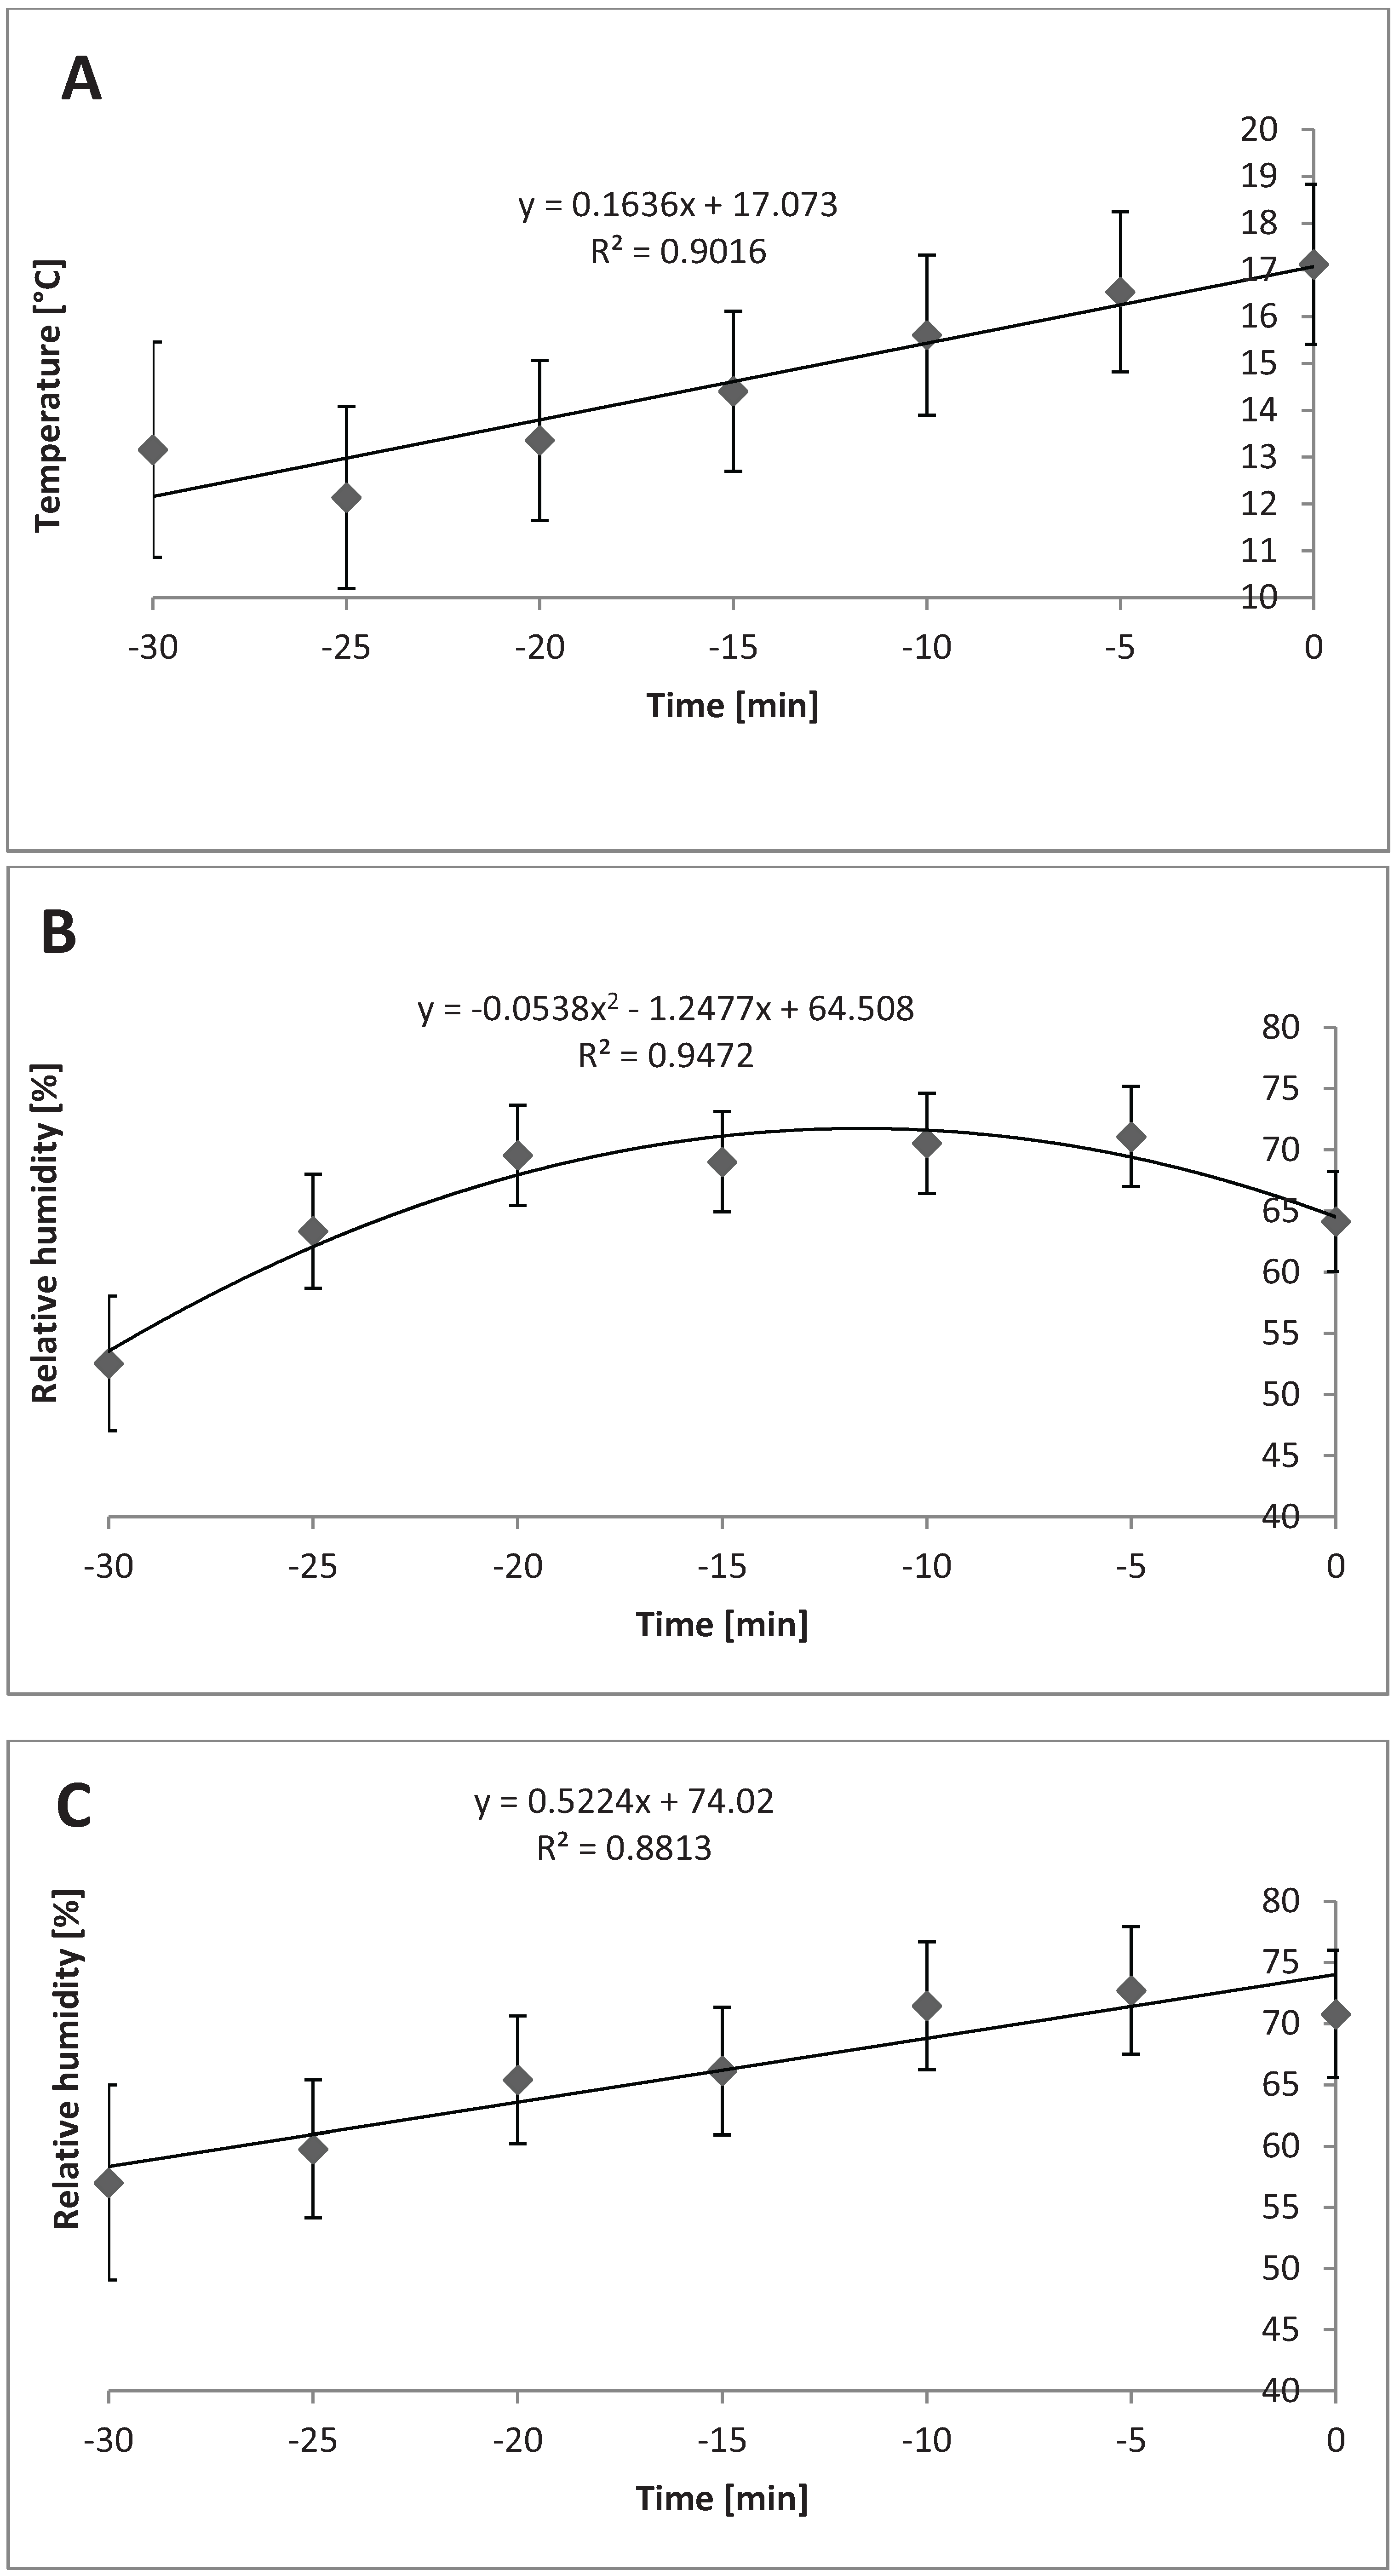
In mild weather, temperature in the TF compartment increased linearly over time when 1.2 m
3 or 2.4 m
3 were used (
P = 0.02), as shown in
Figure 9A.
Figure 9B shows the quadratic change in relative humidity in the TF compartment when heavy bedding was used (
P < 0.01). Relative humidity changed linearly in the TR compartment when 1.2 m
3 or 2.4 m
3 were used, shown in
Figure 9C (
P = 0.03).
Figure 9.
Temperature and relative humidity in mild weather (n = 21 trailers) in different compartments when different levels of bedding are used. (A) Linear change in temperature in top front compartment when 1.2 m3 or 2.4 m3 are used during mild weather (P = 0.02; SEb = 0.23). (B) Quadratic change in relative humidity in top front compartment when 1.2 m3 or 2.4 m3 are used during mild weather (P < 0.01; SEb = 0.02). (C) Linear change in relative humidity in top rear compartment when 1.2 m3 or 2.4 m3 are used during mild weather (P = 0.03; SEb = 0.72).


