Effect of Time (Within and Between Days), and Dairy Production Factors on the Impedance Value at 24 Acupuncture Points in Dairy Cows

Simple Summary:
Abstract:
1. Introduction
2. Experimental Section


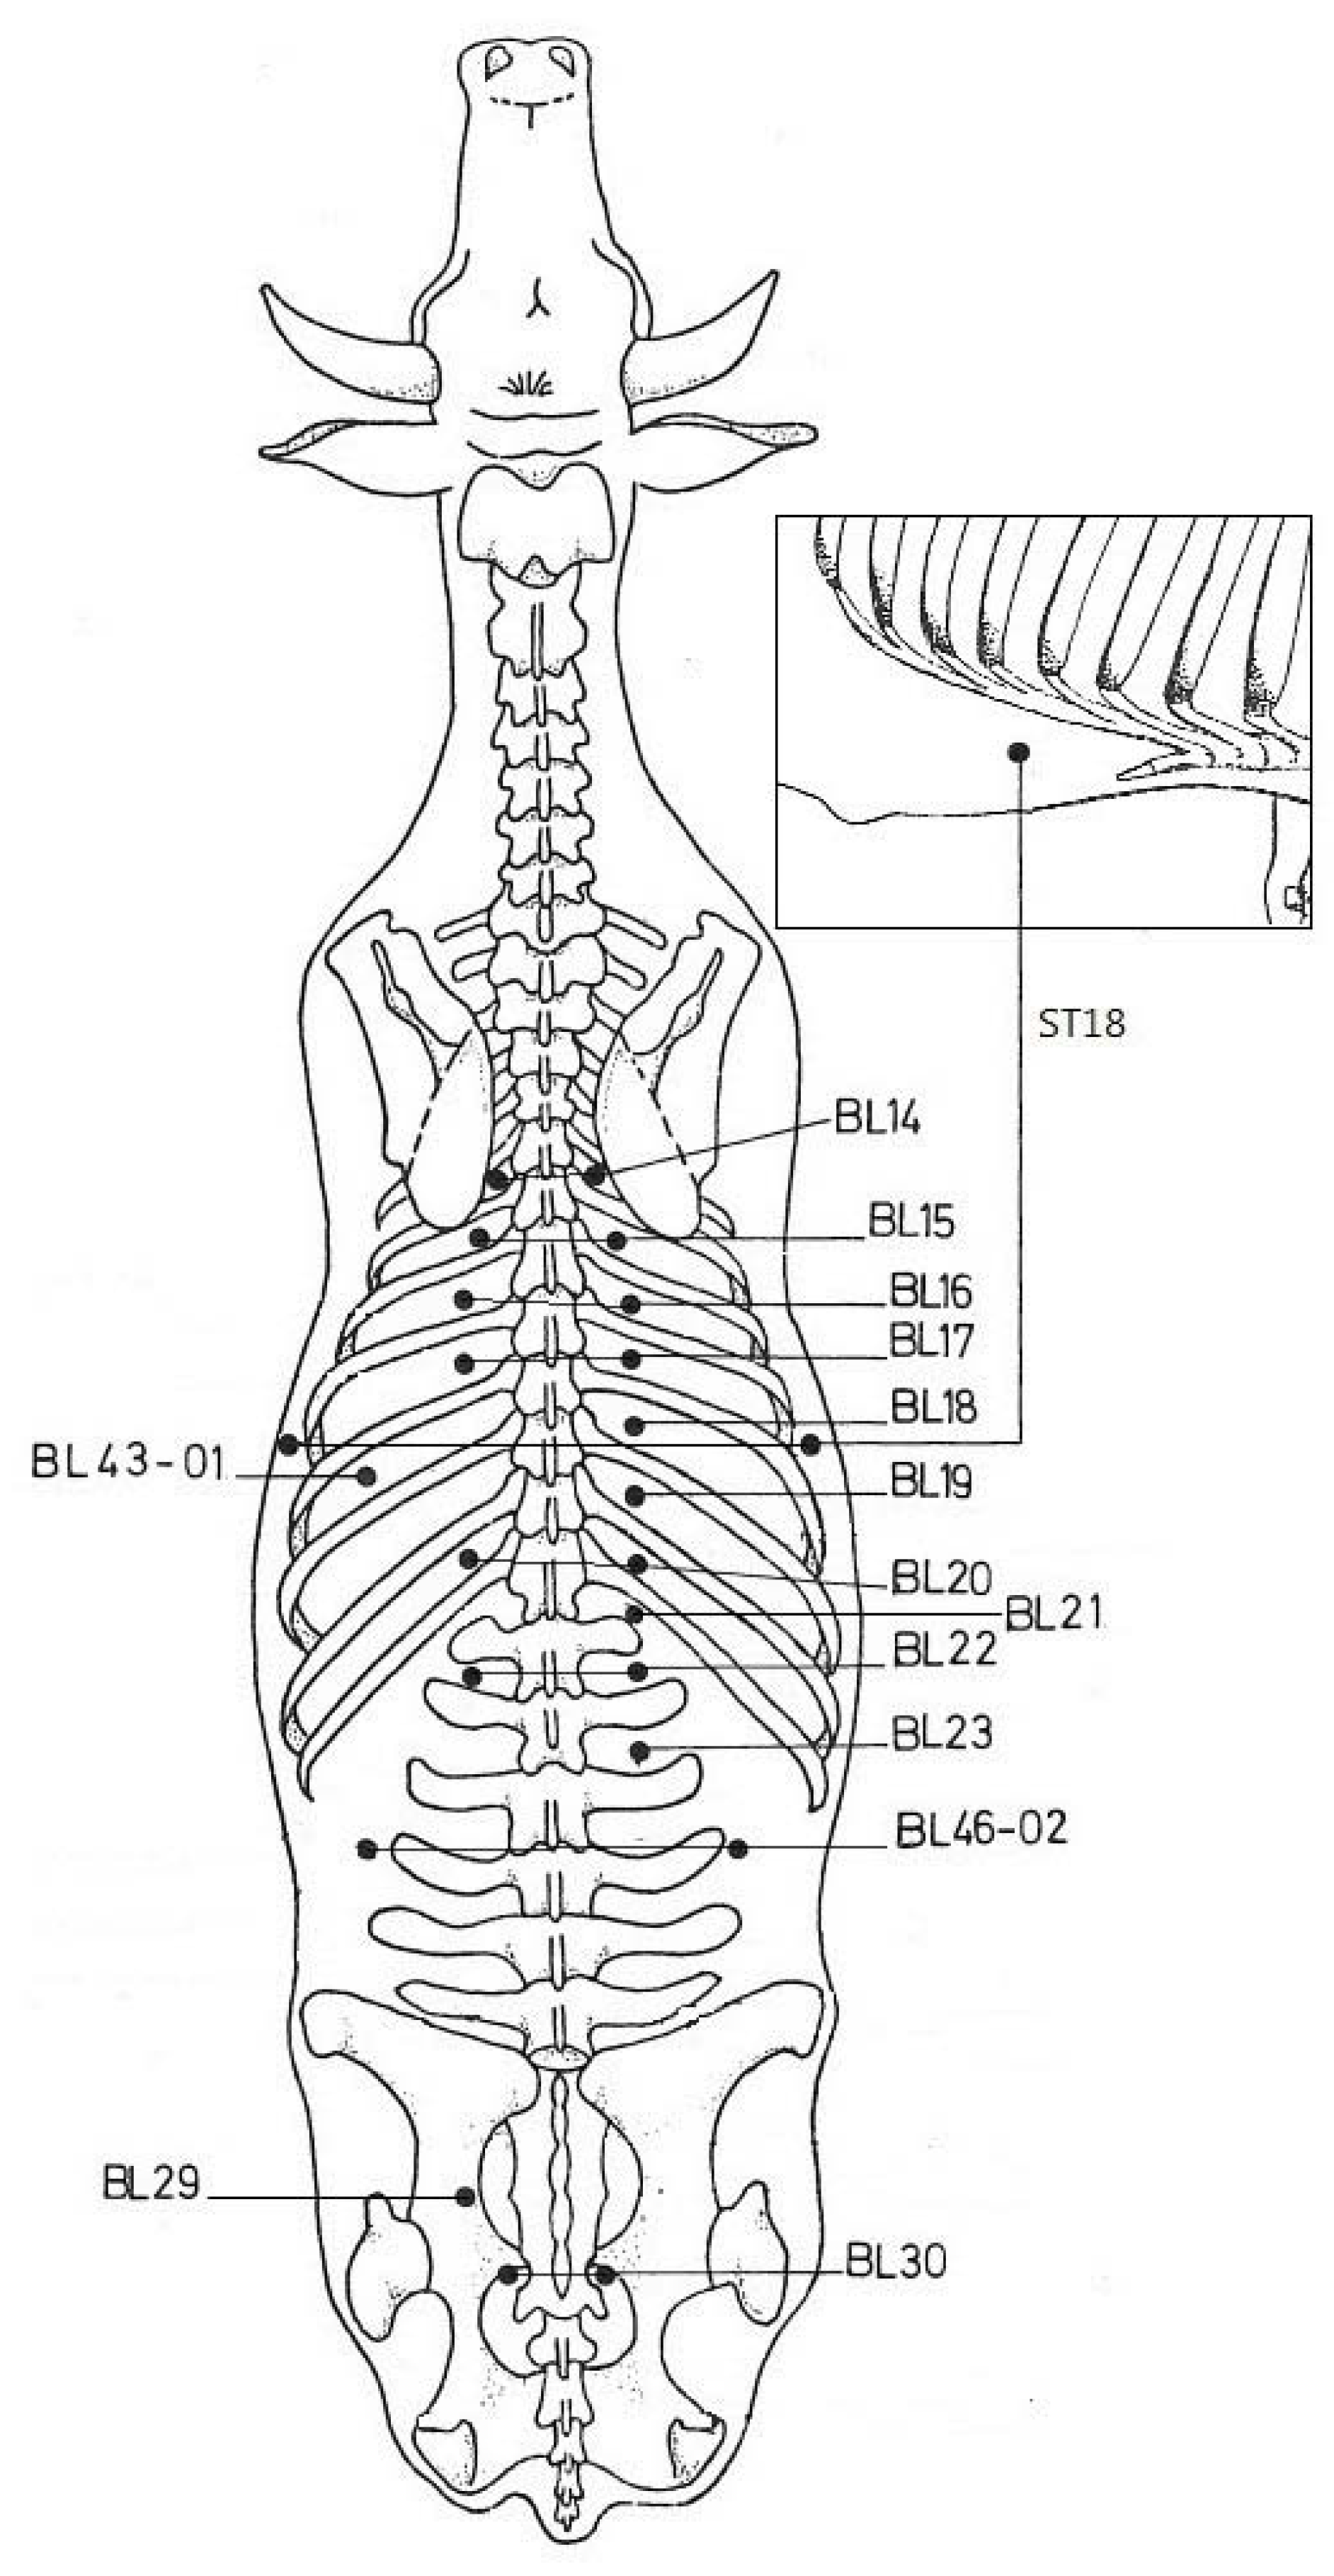
| Right sequence | 1 | 2 | 3 | 4 | 5 | 6 | 7 | 8 | 9 | 10 | 11 | 12 | 13 |
| BL21 | BL20 | BL19 | BL18 | BL17 | BL16 | BL15 | BL14 | BL22 | BL23 | BL46-02 | ST 18 | BL30 | |
| Left sequence | 14 | 15 | 16 | 17 | 18 | 19 | 20 | 21 | 22 | 23 | 24 | ||
| BL20 | BL43-01 | BL17 | BL16 | BL15 | BL14 | BL22 | BL46-02 | ST 18 | BL30 | BL29 |
2.1. Experimental Design
2.2. Statistical Analysis
3. Results and Discussion
3.1. Within-Day and Between-Day Effects on the Impedance Values at Acupuncture Points
| Impedance values (kΩ) | |||||
| AP | Mean | Median | SEM | Lowest | Highest |
| BL21R | 1,845 | 1,299 | 234.4 | 416 | 17,586 |
| BL20R | 1,971 | 1,389 | 215.7 | 357 | 13,450 |
| BL19R | 1,651 | 1,365 | 145.1 | 324 | 10,688 |
| BL18R | 1,318 | 1,143 | 102.9 | 419 | 10,102 |
| BL17R | 1,387 | 1,115 | 113.1 | 519 | 8,920 |
| BL16R | 1,710 | 1,133 | 173.6 | 269 | 12,042 |
| BL15R | 1,613 | 1,376 | 162.5 | 436 | 17,687 |
| BL14R | 1,757 | 1,281 | 153.4 | 57 | 9,674 |
| BL22R | 2,070 | 1,516 | 213.8 | 107 | 13,539 |
| BL23R | 1,554 | 1,084 | 197.6 | 107 | 13,555 |
| BL46-02R | 1,533 | 1,141 | 185.9 | 136 | 18,467 |
| ST18L | 3,618 | 1,833 | 403.6 | 584 | 18,358 |
| BL30R | 868 | 731 | 59.1 | 76 | 3,713 |
| R overall | 1,761 | 1,262 | 293 | 12,906 | |
| BL20L | 2,495 | 1,548 | 331.5 | 292 | 18,267 |
| BL43-01L | 2,973 | 1,843 | 323.9 | 303 | 16,517 |
| BL17L | 1,899 | 1,359 | 215.6 | 259 | 14,829 |
| BL16L | 1,737 | 1,155 | 224.0 | 141 | 16,381 |
| BL15L | 1,605 | 1,300 | 164.9 | 155 | 16,800 |
| BL14L | 1,498 | 1,197 | 106.8 | 190 | 6,765 |
| BL22L | 1,775 | 1,285 | 186.3 | 297 | 16,431 |
| BL46-02L | 1,765 | 1,488 | 159.3 | 303 | 13,245 |
| ST18L | 4,179 | 1,918 | 417.8 | 589 | 17,814 |
| BL30L | 827 | 753 | 38.7 | 230 | 3,280 |
| BL29L | 856 | 739 | 53.8 | 235 | 3,485 |
| L overall | 1,965 | 1,326 | 272 | 13,075 | |
| Overall | 1,854 | 1,291 | 283 | 12,984 | |
| Variables | ||||
| AP | Mean ± SEM | Cow | Hr | Days |
| BL21R | 7.24 ± 0.073 | <0.01 | - | - |
| BL20R | 7.29 ± 0.070 | - | - | - |
| BL19R | 7.23 ± 0.072 | <0.05 | - | - |
| BL18R | 7.05 ± 0.056 | <0.05 | <0.1 | - |
| BL17R* | 7.08 ± 0.083 | - | - | - |
| BL16R | 7.17 ± 0.105 | <0.05 | - | - |
| BL15R | 7.23 ± 0.063 | <0.1 | - | - |
| BL14R | 7.22 ± 0.104 | <0.001 | <0.01 | <0.1 |
| BL22R | 7.36 ± 0.095 | <0.001 | <0.01 | <0.05 |
| BL23R | 7.02 ± 0.119 | <0.01 | <0.1 | - |
| BL46-02R | 7.07 ± 0.095 | <0.001 | <0.01 | <0.05 |
| ST18R | 7.75 ± 0.116 | - | <0.1 | - |
| BL30R | 6.57 ± 0.101 | <0.01 | <0.1 | - |
| BL20L* | 7.44 ± 0.099 | <0.05 | - | - |
| BL43-01L | 7.65 ± 0.072 | <0.1 | <0.05 | <0.05 |
| BL17L | 7.27 ± 0.066 | <0.1 | - | - |
| BL16L | 7.12 ± 0.104 | <0.05 | - | - |
| BL15L | 7.18 ± 0.076 | <0.05 | - | - |
| BL14L | 7.13 ± 0.099 | <0.001 | - | - |
| BL22L | 7.24 ± 0.093 | <0.01 | <0.1 | - |
| BL46-02L | 7.31 ± 0.050 | - | - | - |
| ST18L | 7.93 ± 0.084 | <0.05 | <0.05 | - |
| BL30L | 6.62 ± 0.066 | <0.001 | <0.05 | <0.01 |
| BL29L | 6.60 ± 0.094 | <0.01 | - | <0.1 |
3.2. Effect of Dairy Production Factors on the Impedance Values at 24 Acupuncture Points
| Impedance values (kΩ) | |||||
| AP | Mean | Median | SEM | Lowest | Highest |
| BL21R | 1,940 | 1,498 | 132.4 | 319 | 16,716 |
| BL20R | 2,087 | 1,534 | 145.0 | 189 | 17,426 |
| BL19R | 2,098 | 1,549 | 141.3 | 162 | 17,448 |
| BL18R | 1,734 | 1,506 | 93.8 | 160 | 16,365 |
| BL17R | 1,799 | 1,446 | 127.1 | 216 | 18,427 |
| BL16R | 1,610 | 1,414 | 85.2 | 201 | 15,123 |
| BL15R | 1,675 | 1,417 | 87.5 | 319 | 15,365 |
| BL14R | 1,698 | 1,396 | 99.6 | 245 | 16,086 |
| BL22R | 1,930 | 1,468 | 142.5 | 170 | 18,211 |
| BL23R | 1,867 | 1,441 | 128.6 | 199 | 18,140 |
| BL46-02R | 2,238 | 1,523 | 162.1 | 324 | 17,858 |
| ST18R | 3,427 | 1,860 | 209.7 | 490 | 18,217 |
| BL30R | 1,204 | 1,014 | 77.4 | 232 | 16,451 |
| R overall | 1,939 | 1,467 | 248 | 17,064 | |
| BL20L | 2,145 | 1,618 | 139.6 | 294 | 17,505 |
| BL43-01L | 2,720 | 1,683 | 186.4 | 326 | 18,264 |
| BL17L | 1,741 | 1,509 | 91.3 | 226 | 13,559 |
| BL16L | 1,854 | 1,469 | 119.2 | 133 | 17,467 |
| BL15L | 1,779 | 1,444 | 110.7 | 172 | 17,457 |
| BL14L | 1,928 | 1,403 | 137.9 | 132 | 16,622 |
| BL22L | 1,682 | 1,416 | 93.0 | 233 | 15,318 |
| BL46-02L | 2,493 | 1,541 | 180.0 | 363 | 16,907 |
| ST18L | 3,804 | 1,876 | 234.2 | 468 | 18,118 |
| BL30L | 1,315 | 1,081 | 82.9 | 200 | 15,468 |
| BL29L | 1,269 | 1,005 | 92.0 | 190 | 13,598 |
| L overall | 2,057 | 1,459 | 248 | 16,389 | |
| Overall | 1,993 | 1,463 | 248 | 16,755 | |
3.3. Acupuncture Points Recommended for Future Use and Study
| APs | Associated organs right | Associated organs left |
| BL14 | Pericardium | Pericardium |
| BL15 | Heart | Heart |
| BL16 | Lung | Lung |
| BL17 | Lung, udder (right front) | Lung, udder (left front) |
| BL18 | Liver, abomasum, omasum | - |
| BL19 | Diaphragm, liver | Diaphragm |
| BL20 | Spleen, pancreas | Spleen, pancreas |
| BL21 | Ovary, indigestion | |
| BL22 | Ovary, endocrine | Ovary, endocrine |
| BL23 | Kidney, ovary, testis | - |
| BL29 | - | Bladder |
| BL30 | Udder (right back) | Udder (left back) |
| BL43-01 | Rumen | Rumen |
| BL46-02 | Small intestine | Large intestine |
| ST18 | Udder (milk yield) | Udder (milk yield) |
| Recommended for: | APs on the right | APs on the center | |||||||
| Reference | BL19R | BL20R | BL46-02L | ||||||
| Diagnostics | BL14L | BL16L | BL17L | ||||||
| Further study | BL16R | BL17R | BL18R | BL23R | BL30R | BL15L | BL20L | BL22L | BL29L |
4. Conclusions
Acknowledgments
Conflict of Interest
References and Notes
- Bosma, R.H.; Savelkoul, H.F.J.; Frankena, K.; Baars, T.; Laarakker, E. Dairy herd health, impedance on six acupuncture points and immune response factors in milk: A pilot study. Livestock Prod. Sci. 2006, 99, 285–290. [Google Scholar] [CrossRef]
- Boonstra, A.; Baert, M.; van Oudenaren, A.; An, L.; Leenen, P.J.M.; Garssen, J.; Savelkoul, H.F.J. UVB irradiation suppress the production of immunoglobulin isotypes associated with Th1 and Th2 responses: the involvement of CD4+ T cells and IL-10. Int. Immun. 2000, 12, 1531–1538. [Google Scholar] [CrossRef]
- Voll, R. Topographische Lage der Messpunkte der Electro-Acupunktur nach Voll, 2ten Auflage (in German); Medizinisch-Literarischer Verlag: Uelzen, Germany, 1976. [Google Scholar]
- Soh, K.S. Bonghan Circulatory System as an Extension of Acupuncture Meridians. J. Acupunct. Meridian Stud. 2009, 2, 93–106. [Google Scholar]
- Sagrjadski, W.A.; Slokasow, W.; Rosanow, A.; Bystrow, J. Computer Supported Electro-Acupuncture Diagnostics (in Russian); Academy of Technical/Medical Science: Moscow, Russia, 1996. [Google Scholar]
- Background information, technology and principles of the i-HEALTH® Systems modules. 1. EDA: Electro-Dermal Assessment: the Diagnostic Aid. Available online: www.i-health.com/en/ (accessed on 28 May 2012).
- Treugut, H.; Görner, C.; Lüdtke, R.; Burghardt, V. Energetische Meridianmessung mit Prognos-A: Relabilität. In Jahrbuch der Karl und Veronica Carstens-Stiftung, Band 5 (in German); Albrecht, H., Frühwald, M., Eds.; KVC: Essen, Germany, 1998; pp. 167–186. [Google Scholar]
- Kothbauer, O. Veterinary Acupuncture. Basic Principles and Their Clinical Applications with Ear Acupuncture on Cattle and Some References to the Horse; Zweimühlen Verlag: Munchen, Germany, 1999. [Google Scholar]
- Helms, J.M. Acupuncture Energetics, a Clinical Approach for Physicians; Redwing Book Co.: Taos, NM, USA, 1996. [Google Scholar]
- Rogers, P.A.M. Veterinary Acupuncture. Available online: http://homepage.tinet.ie/~progers/pt.htm#intro (accessed on 28 May 2012).
- SAS, User’s Guide: Statistics, Version 6.12; SAS Inst.: Cary, NC, USA, 1996.
- Hosmer, D.W.; Lemeshow, S. Applied Logistic Regression; Wiley: New York, NY, USA, 1989. [Google Scholar]
© 2012 by the authors; licensee MDPI, Basel, Switzerland. This article is an open access article distributed under the terms and conditions of the Creative Commons Attribution license (http://creativecommons.org/licenses/by/3.0/).
Share and Cite
Bosma, R.H.; Kalkers-van de Ven, S.C.G.; Den Boer, M.M.J. Effect of Time (Within and Between Days), and Dairy Production Factors on the Impedance Value at 24 Acupuncture Points in Dairy Cows. Animals 2012, 2, 415-425. https://doi.org/10.3390/ani2030415
Bosma RH, Kalkers-van de Ven SCG, Den Boer MMJ. Effect of Time (Within and Between Days), and Dairy Production Factors on the Impedance Value at 24 Acupuncture Points in Dairy Cows. Animals. 2012; 2(3):415-425. https://doi.org/10.3390/ani2030415
Chicago/Turabian StyleBosma, Roel H., Shirley C. G. Kalkers-van de Ven, and Mauk M. J. Den Boer. 2012. "Effect of Time (Within and Between Days), and Dairy Production Factors on the Impedance Value at 24 Acupuncture Points in Dairy Cows" Animals 2, no. 3: 415-425. https://doi.org/10.3390/ani2030415
APA StyleBosma, R. H., Kalkers-van de Ven, S. C. G., & Den Boer, M. M. J. (2012). Effect of Time (Within and Between Days), and Dairy Production Factors on the Impedance Value at 24 Acupuncture Points in Dairy Cows. Animals, 2(3), 415-425. https://doi.org/10.3390/ani2030415