Article

Identification of CYP450 Family Members and Their Gonadal Expression Profiles in Exopalaemon carinicauda

1
State Key Laboratory of Mariculture Biobreeding and Sustainable Goods, Yellow Sea Fisheries Research Institute, Chinese Academy of Fishery Sciences, Qingdao 266071, China
2
Laboratory for Marine Fisheries Science and Food Production Processes, Laoshan Laboratory, Qingdao 266237, China
3
National Experimental Teaching Demonstration Center for Aquatic Sciences, Shanghai Ocean University, Shanghai 201306, China
*
Author to whom correspondence should be addressed.
Animals 2026, 16(8), 1201; https://doi.org/10.3390/ani16081201
Submission received: 4 January 2026 / Revised: 7 April 2026 / Accepted: 8 April 2026 / Published: 15 April 2026
(This article belongs to the Section Animal Genetics and Genomics)

Simple Summary

Exopalaemon carinicauda is an important aquaculture species that belongs to Arthropoda, Crustacea, Decapoda, and Palaemonidae. It is popular among consumers due to its delicious taste and high nutritional value. Cytochrome P450 family members play pivotal roles in various biological processes including metabolism, growth, reproduction, hormone synthesis, lipid oxidation and environmental adaptation. However, there are no reports on the CYP450 family members in E. carinicauda. In this study, we identified 58 CYP450 gene family members in E. carinicauda and investigated their expression pattern in the gonads via transcriptomic data. These findings offered potential molecular targets for elucidating the core regulatory networks underlying reproduction and development in E. carinicauda.

Abstract

The cytochrome P450 (CYP450) superfamily plays important roles in a wide range of biological processes. The classification of CYP450 family members has been studied in some plants and animals; however, there are no reports on CYP450 family members in Exopalaemon carinicauda. Based on publicly available whole-genome data for E. carinicauda, we identified 58 CYP450 family members based on the genome-wide alignment and analyzed their domains, gene structures and chromosomal locations, as well as physicochemical properties of the encoded proteins. The results revealed that CYP450 family members, widely distributed across multiple chromosomes, exhibit diverse protein properties, gene structures, and conserved motifs. Phylogenetic analysis indicated that these members are primarily clustered into subfamilies 2, 3, and 4, and the mitochondrial clan, showing close genetic relationships with homologous genes from other crustaceans. In this study, we revealed the genetic structural characteristics of the CYP450 family in E. carinicauda. We identified candidate genes for future research on the molecular mechanisms of CYP450 in development and reproduction. These findings are expected to serve as a foundation for further studies in this field.

1. Introduction

The cytochrome P450 superfamily comprises a class of heme-containing monooxygenases that play pivotal roles in various life processes including metabolism, growth, reproduction, hormone synthesis, lipid oxidation and adaptation [1]. Recently, as omics sequencing technologies have matured, systematic studies of CYP450 genes across various species have been conducted, including studies on gene identification, functional elucidation, and evolutionary mechanisms.
In plants, CYP450 family members mainly function in metabolic pathways, especially in the functionalization of triterpene skeletons, for example, by hydroxylation and carboxylation. For instance, CYP716A179 can mediate triterpene C-28 oxidation, participating in the biosynthesis of oleanolic acid and betulinic acid in Glycyrrhiza uralensis [2]. Some family members such as CYP97 are involved in plant hormone metabolism, for example, in the synthesis of zeaxanthin and as a precursor to abscisic acid. In vertebrates, CYP450 genes also exhibit remarkable diversity. For example, 94 CYP450 genes belonging to 18 families have been identified in zebrafish [3]. CYP1B1 participates in steroid and retinoic acid metabolism and its deficiency leads to metabolic disturbances, causing observable behavioral abnormalities in larvae and social deficits in adults. CYP11A2 can regulate sex differentiation and gametogenesis by catalyzing pregnenolone production, while CYP26B1/D1 is involved in hindbrain development through degrading retinoic acid. CYP1A2 is linked to the metabolic detoxification of xenobiotics such as cadmium ions and dioxins [4]. Furthermore, CYP21A2 deletion is associated with human congenital adrenal hyperplasia [5]. These findings underscore the functional diversity and species-specificity of CYP450 family members. Meanwhile, the functional differentiation provides important references for understanding the potential roles of CYP450 genes in other species.
CYP450 family members also exhibit diversity in crustaceans. Lafontaine et al. found that the pesticide chlordane inhibited 20-hydroxyecdysone levels and chitinase activity in Macrobrachium rosenbergii, suggesting the involvement of CYP450 family members in molting and environmental responses [6]. Humble et al. identified 25 CYP450 family members in Lepeophtheirus salmonis, among which some were linked to the development of drug resistance [7]. Nelson noted that the expansion of the CYP450 family in animals is closely related to substrate specificity differentiation through phylogenetic analysis [8]. For instance, the Halloween genes including CYP302A1, CYP306A1, CYP307A1, etc., are predominantly involved in ecdysteroid synthesis, while CYP3 family gene mainly functions in xenobiotic detoxification in insects and crustaceans. Research on CYP450 genes in crustaceans is limited but growing, with several genes including CYP302a1 and CYP330a1 having been cloned in species such as Portunus trituberculatus, Carcinus maenas, and M. rosenbergii [9,10,11]. The functions of CYP307a1 and CYP306a1 have also been examined for its roles in ecdysone regulation in Macrobrachium nipponense [12,13].
Recent high-throughput sequencing has enabled systematic CYP450 identification across species: 187 members in Ginkgo biloba [14], 48 in Fritillaria unibracteata [15], and 86 each in Bombyx mori, Drosophila melanogaster, and 75 in Daphnia magna [16,17,18], with over 60% of B. mori members belonging to CYP4 and CYP6 families. In crustaceans, 14 CYP450 members were identified in Qinghai Gammarus lacustris [19]. However, no systematic classification of CYP450 genes has been reported in Exopalaemon carinicauda.
E. carinicauda is an important aquaculture species [20] that belongs to arthropoda, crustacea, decapoda, and palaemonidae. It is a common polyculture species in Chinese prawn farming and holds high market value due to its delicious taste and nutritional richness. As a kind of small crustacean, it has many advantages for research, including strong adaptability, a transparent body, and a short reproductive cycle. Based on data of the E. carinicauda genome [21], our study aims to systematically identify CYP450 family members by integrating bioinformatics methods. Basic information on the family members including gene structures, conserved motifs, chromosomal localization, and phylogenetic characteristics is analyzed. Furthermore, by combining existing transcriptomic data from the testes and ovaries, gene expression profiles in male and female gonads are analyzed with the aim of screening key candidate genes potentially involved in reproductive development regulation. The aim of this is to provide a theoretical foundation for in-depth exploration of these genes’ molecular mechanisms in reproductive processes.

2. Materials and Methods

2.1. Ethical Statement

The research presented in this article is entirely based on genome data, transcriptome data analysis, and publicly available datasets. No experimental procedures were performed on live vertebrates or higher invertebrates. Consequently, this work falls outside the scope of regulations requiring formal ethical approval for animal experimentation.

2.2. Characteristics of the CYP450 Family Members

To identify the CYP450 gene family members in E. carinicauda, whole-genome protein sequences were retrieved from the NCBI database [21]. We aligned the sequences of CYP450 family members from multiple species, including medaka, house mouse, yellow catfish, Drosophila melanogaster, Diaphanosoma celebensis, Cyprinus carpio, Penaeus vannamei, Homo sapiens, Leishmania braziliensis. Based on the protein sequence of CYP450 family members from the reference species, the CDS sequence was extracted from the E. carinicauda genome using TBtools-II and subsequently translated into protein sequences. Then the BLASTP program within TBtools-II was employed to perform sequence alignment of these candidate proteins against the E. carinicauda genome to identify its CYP450 gene family members. A total of 58 CYP450 family members were identified in the E. carinicauda genome. The parameters were set as follows: an E-value threshold of 1 × 10⁻⁵, the BLOSUM62 scoring matrix, a word size of 3, gap penalties set to 11 for existence and 1 for extension, and a maximum of 50 target sequences. Domain analysis was conducted using the NCBI CDD database (https://www.ncbi.nlm.nih.gov/Structure/cdd, accessed on 15 May 2025), and only sequences containing a canonical CYP450 domain were retained as final family members. The properties of the family members, including their molecular weight, and, isoelectric point, were predicted using the ExPASy ProtParam tool (https://www.expasy.org/) [22]. Finally, the signal peptides and subcellular localization were predicted using the TMHMM2.0 (https://services.healthtech.dtu.dk/services/TMHMM-2.0/, accessed on 15 May 2025) and the PSORTII online tool (https://psort.hgc.jp/form2.html, accessed on 15 May 2025) [23].

2.3. Phylogenetic Analysis of CYP450 Family Members in E. carinicauda

To investigate the evolutionary relationships of the CYP450 family members in E. carinicauda, we conducted a phylogenetic analysis. The full-length protein sequences of CYP450 family members were downloaded from the NCBI database and combined with homologous sequences from other reference species. Sequences were aligned using ClustalX (Version 2.1) with the auto strategy. Poorly aligned regions and segments with excessive gaps either internally or at the terminals were removed by trimAI to obtain high-quality conserved blocks for phylogenetic tree construction. A maximum likelihood tree was constructed using the One Step Build a ML Tree function by TBtools-II [24], using the UltraFast BootStrap model with bootstrap analysis set to 5000 replicates to assess node support. The resulting tree was visualized and refined using the iTOL online tool. Clades were annotated and named based on evolutionary branching and the known functions of reference genes to systematically interpret the evolutionary relationships and potential functional differentiation within this gene family.

2.4. Analysis of Structural Characteristics of CYP450 Genes

To characterize the structures of the identified E. carinicauda CYP450 genes, their coding sequences were aligned with genomic sequences to determine exon–intron structures using locally installed gene structure display server software: TBtools-II. Exon–intron boundaries were analyzed to determine the number, position, and length of exons in each gene, and the distribution patterns and phases of introns were visualized with the GFF3 annotation files provided by the genome sequencing project. In addition, upstream promoter sequences of each CYP450 gene were downloaded from the genome database, and cis-acting elements were systematically scanned using the CIS-BP database and the promoter regions were defined as the 2000 bp upstream of the translation start site (ATG). Core elements related to hormone, stress, and light responses were identified to preliminarily infer the transcriptional regulatory mechanisms.

2.5. Transcriptome Data Sources and Analysis

Transcriptomic data of the testis and ovaries of E. carinicauda were obtained in our previous experiments [20] and are available from the NCBI SRA database under BioProject ID: PRJNA856985. Transcriptomic data from different ovarian developmental stages in E. carinicauda after eyestalk ablation [25], deposited in the NCBI database under BioProject ID: PRJNA863229, were also obtained from our prior studies. The raw data were trimmed using SeqPrep (https://github.com/jstjohn/SeqPrep, accessed on 20 July 2025), Sickle (https://github.com/najoshi/sickle, accessed on 24 July 2025) for quality control, and Trinity2.0 (http://trinityrnaseq.sourceforge.net/, accessed on 31 July 2025) for de novo assembly of clean data, and the assembled transcripts were used as the reference for subsequent expression analysis. The transcripts were annotated using BLAST2GO (http://www.blast2go.com/b2ghome, accessed on 5 August 2025). The gene expression levels were quantified using RSEM (v1.3.1) with the Trinity-assembled transcripts as reference. RPKM values were generated by RSEM, and no additional inter-sample normalization was applied beyond the built-in RPKM normalization method. Each group included three biological replicates. Differential expression analysis was performed using DESeq2 (v1.34.0) with an adjusted p-value (FDR) < 0.05 and |log2 fold change| ≥ 1 as the threshold for significantly differentially expressed genes. Statistical analyses were performed using GraphPad Prism 9 software and analyzed using Student’s t-test.

3. Results

3.1. Identification of CYP450 Gene Family Members and Protein Characterization

A total of 58 CYP450 gene family members were identified in the genome of E. carinicauda, the properties of which are shown in Table 1. The protein sequence lengths within the CYP450 family ranged from 129 to 892 amino acids, with molecular weights ranging from 14.59 to 100.75 kDa. The protein sequence of CYP450_2L1_5 was the longest, consisting of 892 aa, while the protein sequence of CYP450_3A19 was the shortest, consisting of 129 aa. The protein pI values ranged from 5.35 to 9.51, with CYP450_4c1_1 having the lowest pI and CYP450_302a1_2 having the highest. There were 38 proteins with an instability index greater than 40. Hydrophobicity analysis indicated that all proteins exhibited some degree of hydrophilicity, except for CYP450_3A41_3, which was hydrophobic.
The subcellular localization results for the CYP450 gene family members are shown in Table 2. There are four genes—CYP450_18a1, CYP450_4c1_1, CYP450_3A24 and CYP450_12A2—that are localized to the nucleus. All the other members are localized to the cytoplasm.

3.2. Phylogenetic Analysis of CYP450 Family Members

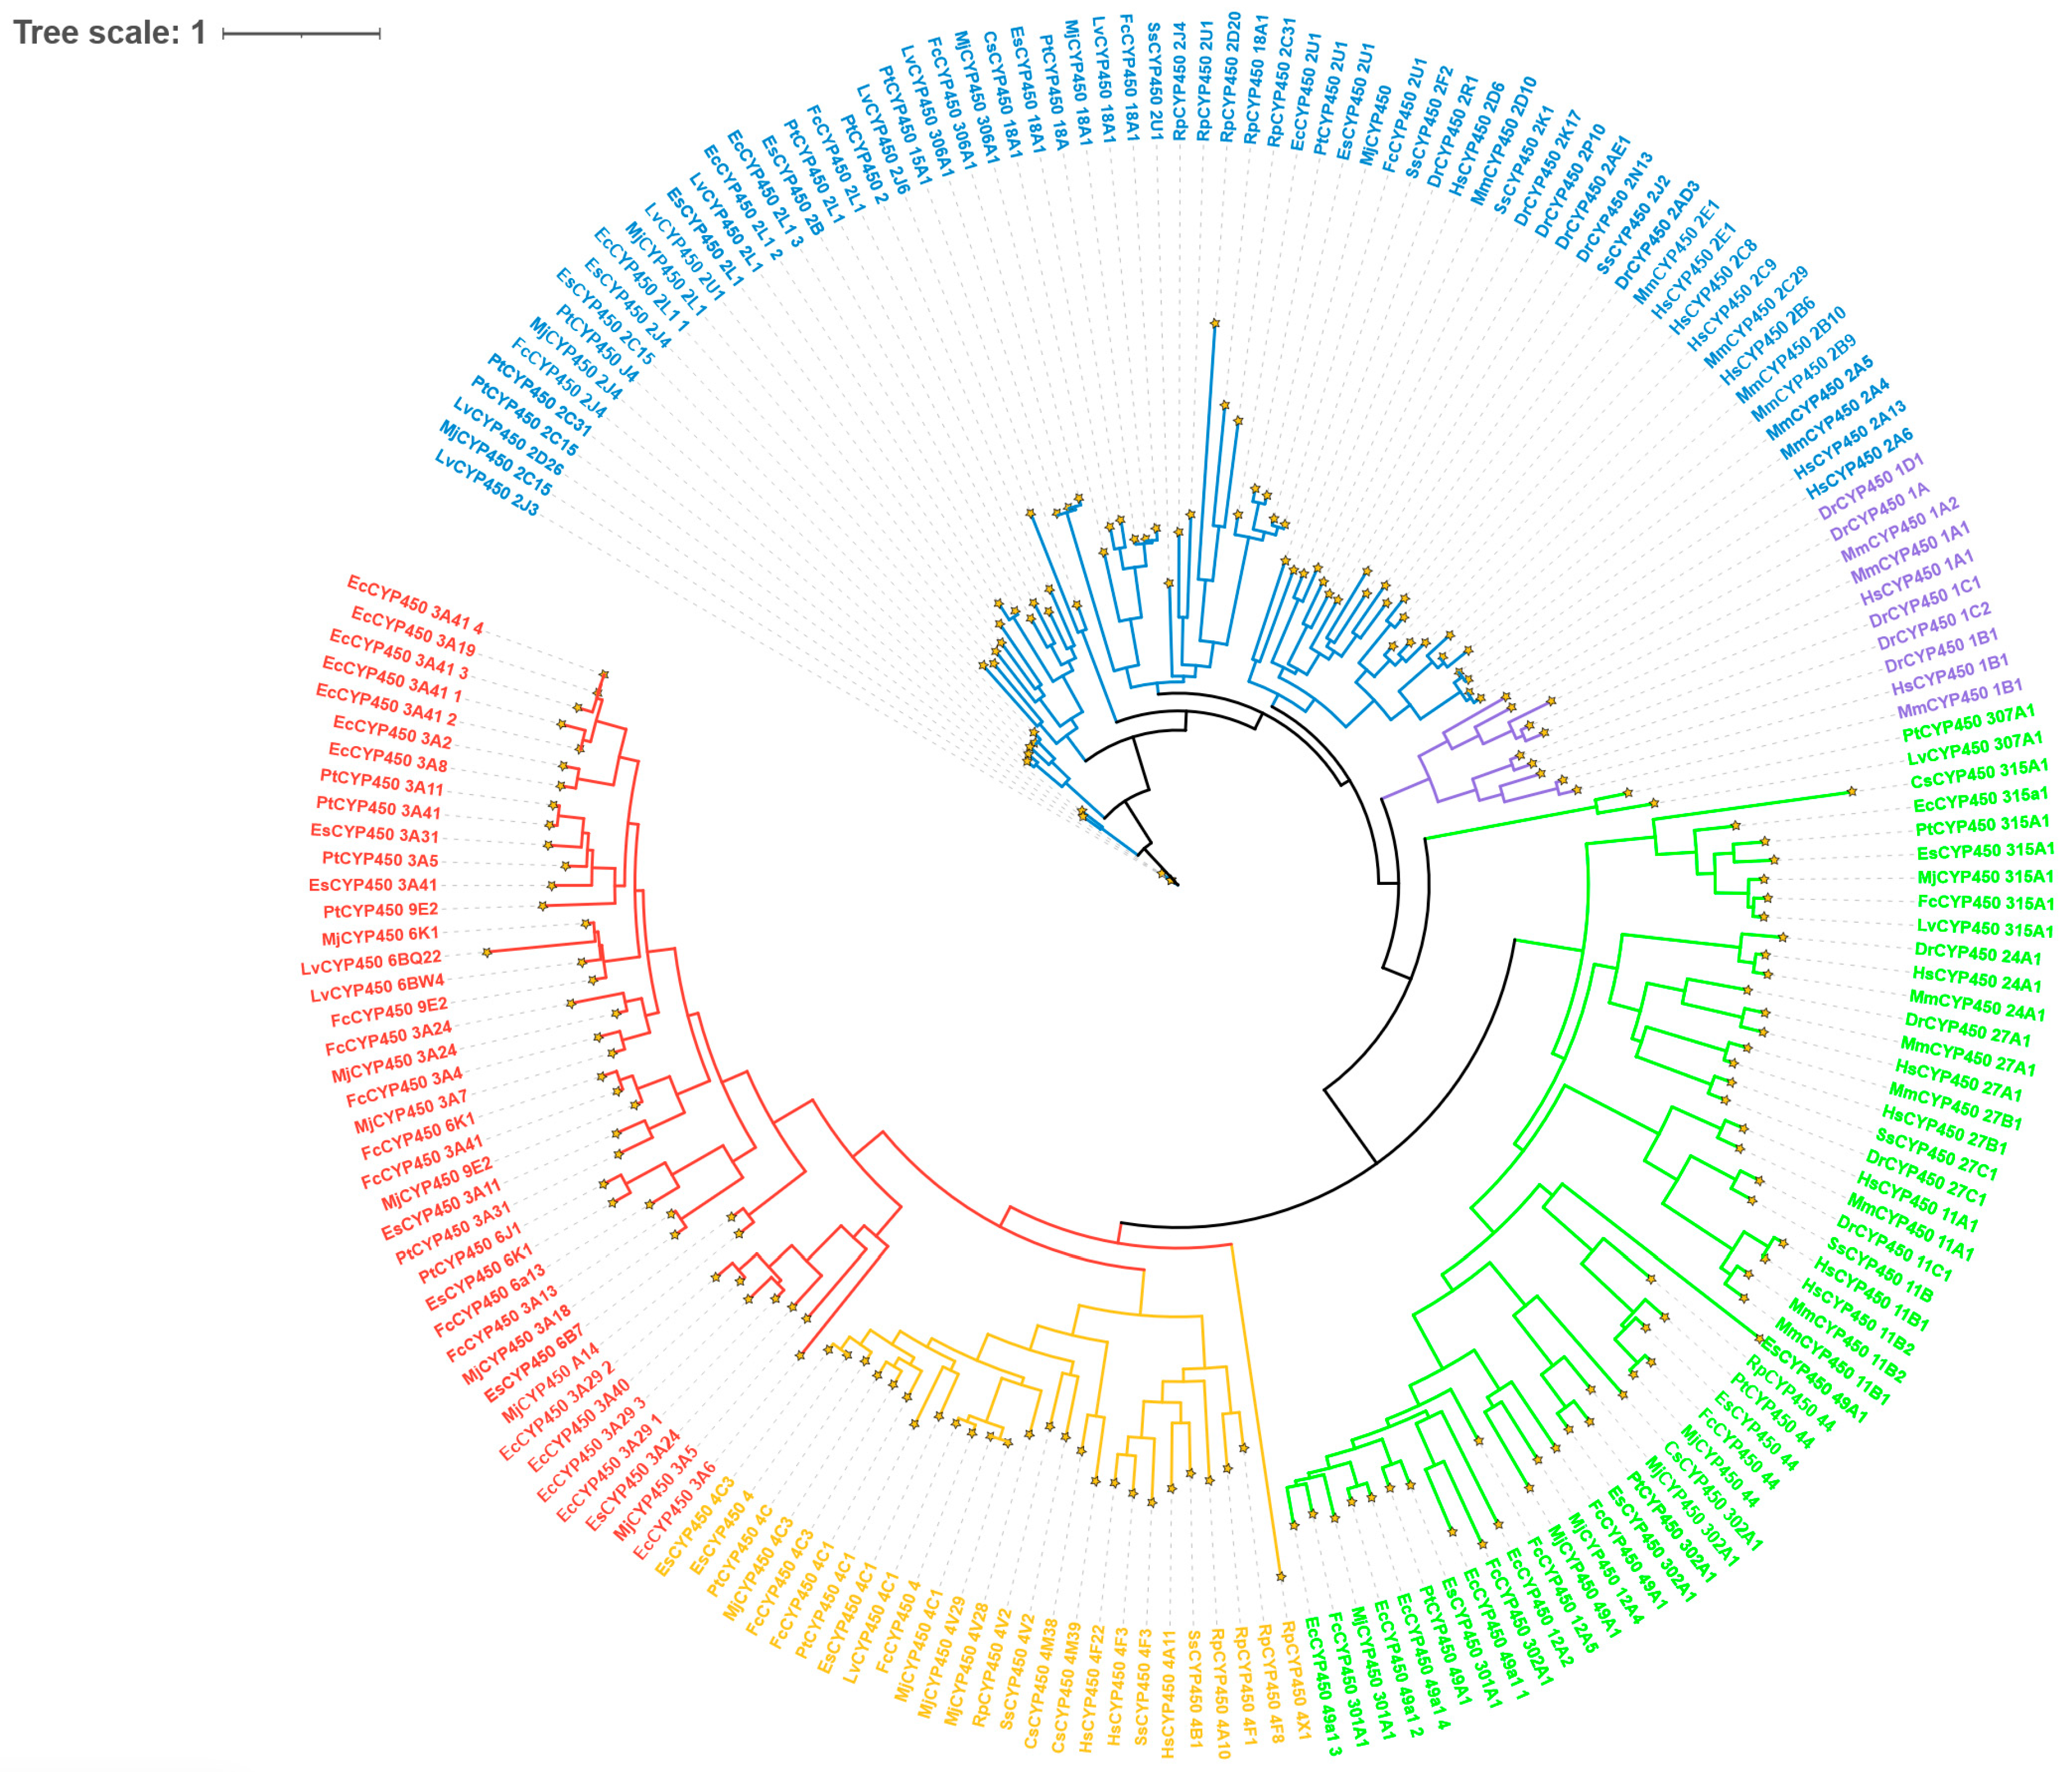
The phylogenetic tree was constructed based on multiple sequence alignment of CYP450 protein sequences (Figure 1). The results indicate that the CYP450 family members are broadly clustered into five groups, corresponding to subfamilies 1, 2, 3, 4, and the mitochondrial clan. We now specify that among the five identified groups, Clan 2 contains the largest number of CYP450 genes (42 members), followed by Clan 3 (28 members) and Clan 4 (15 members). And Clan 2 and Clan 4 exhibit significant gene expansion, which may be associated with specific metabolic adaptations.

3.3. Gene Structure Analysis

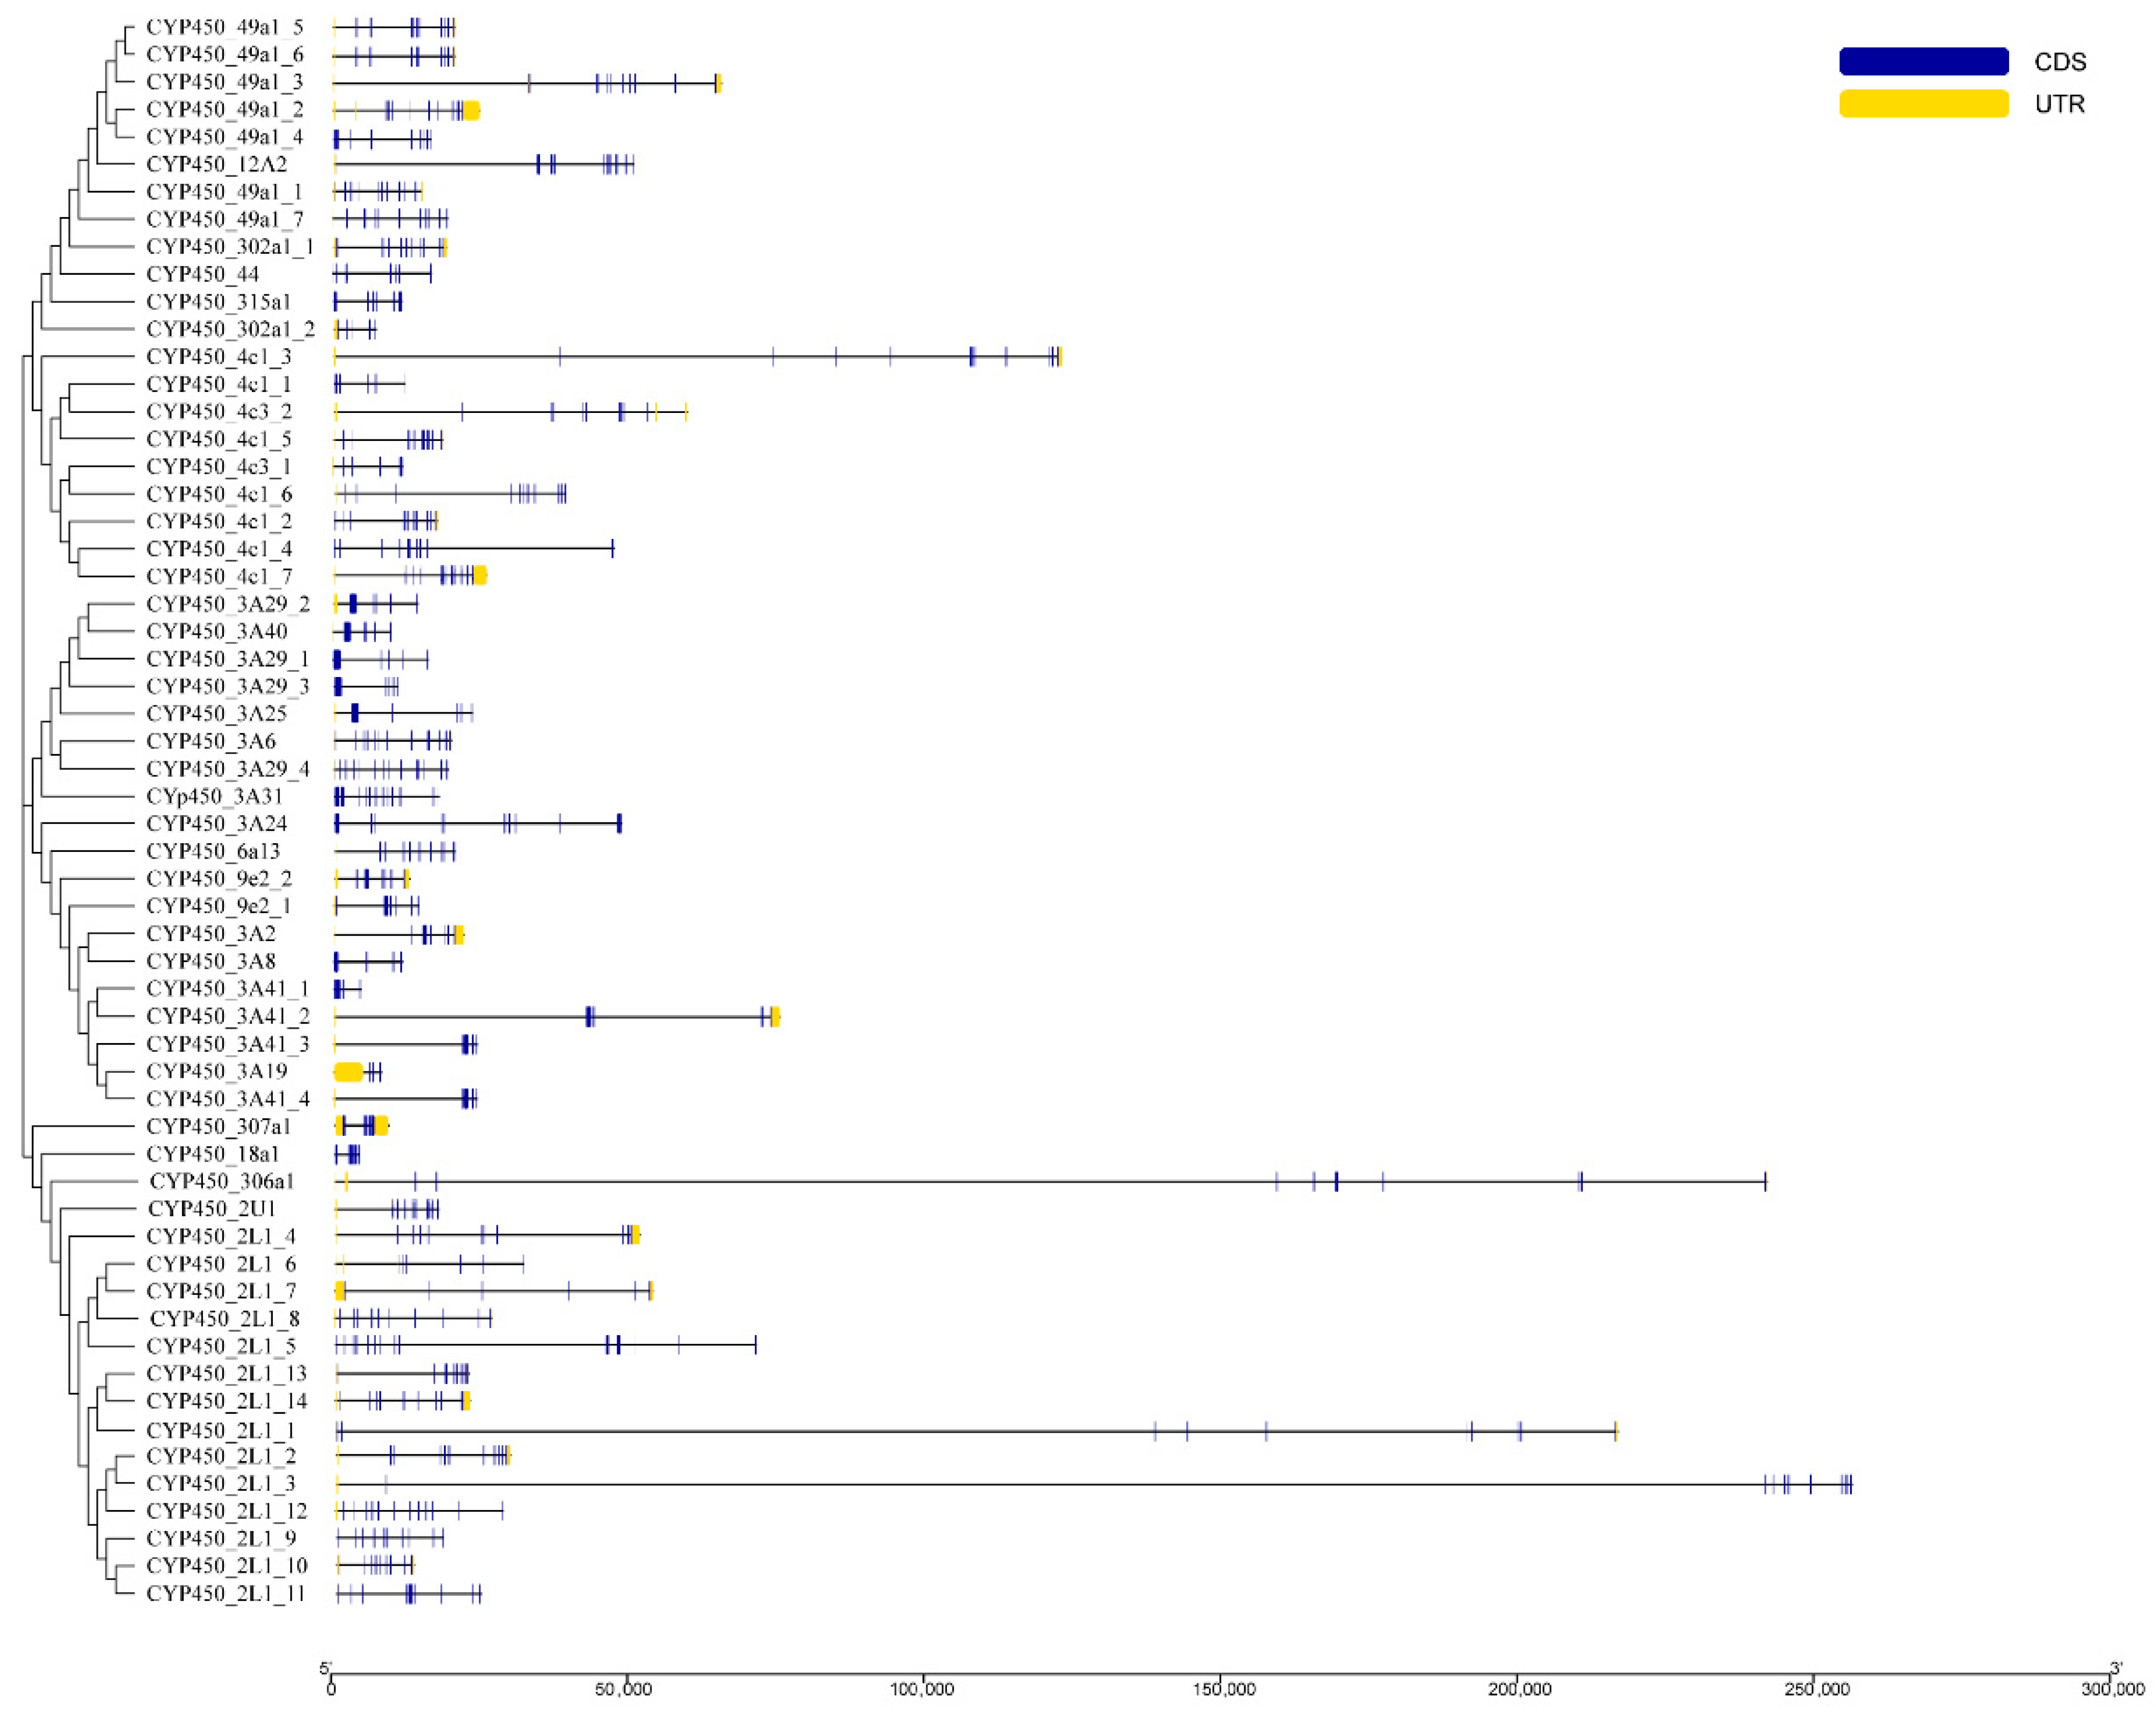
The gene structures of the 58 CYP450 family members are shown in Figure 2. Their length varied, and differences were observed in exon length and number. Among the 58 CYP450 family members, CYP450_3A29_4 consists of the most exons with 12, followed by CYP450_3A31 and CYP450_4c1_4, both containing 11 exons, while CYP450_3A19 contained the fewest exons.

3.4. Protein Motif and Domain Analysis

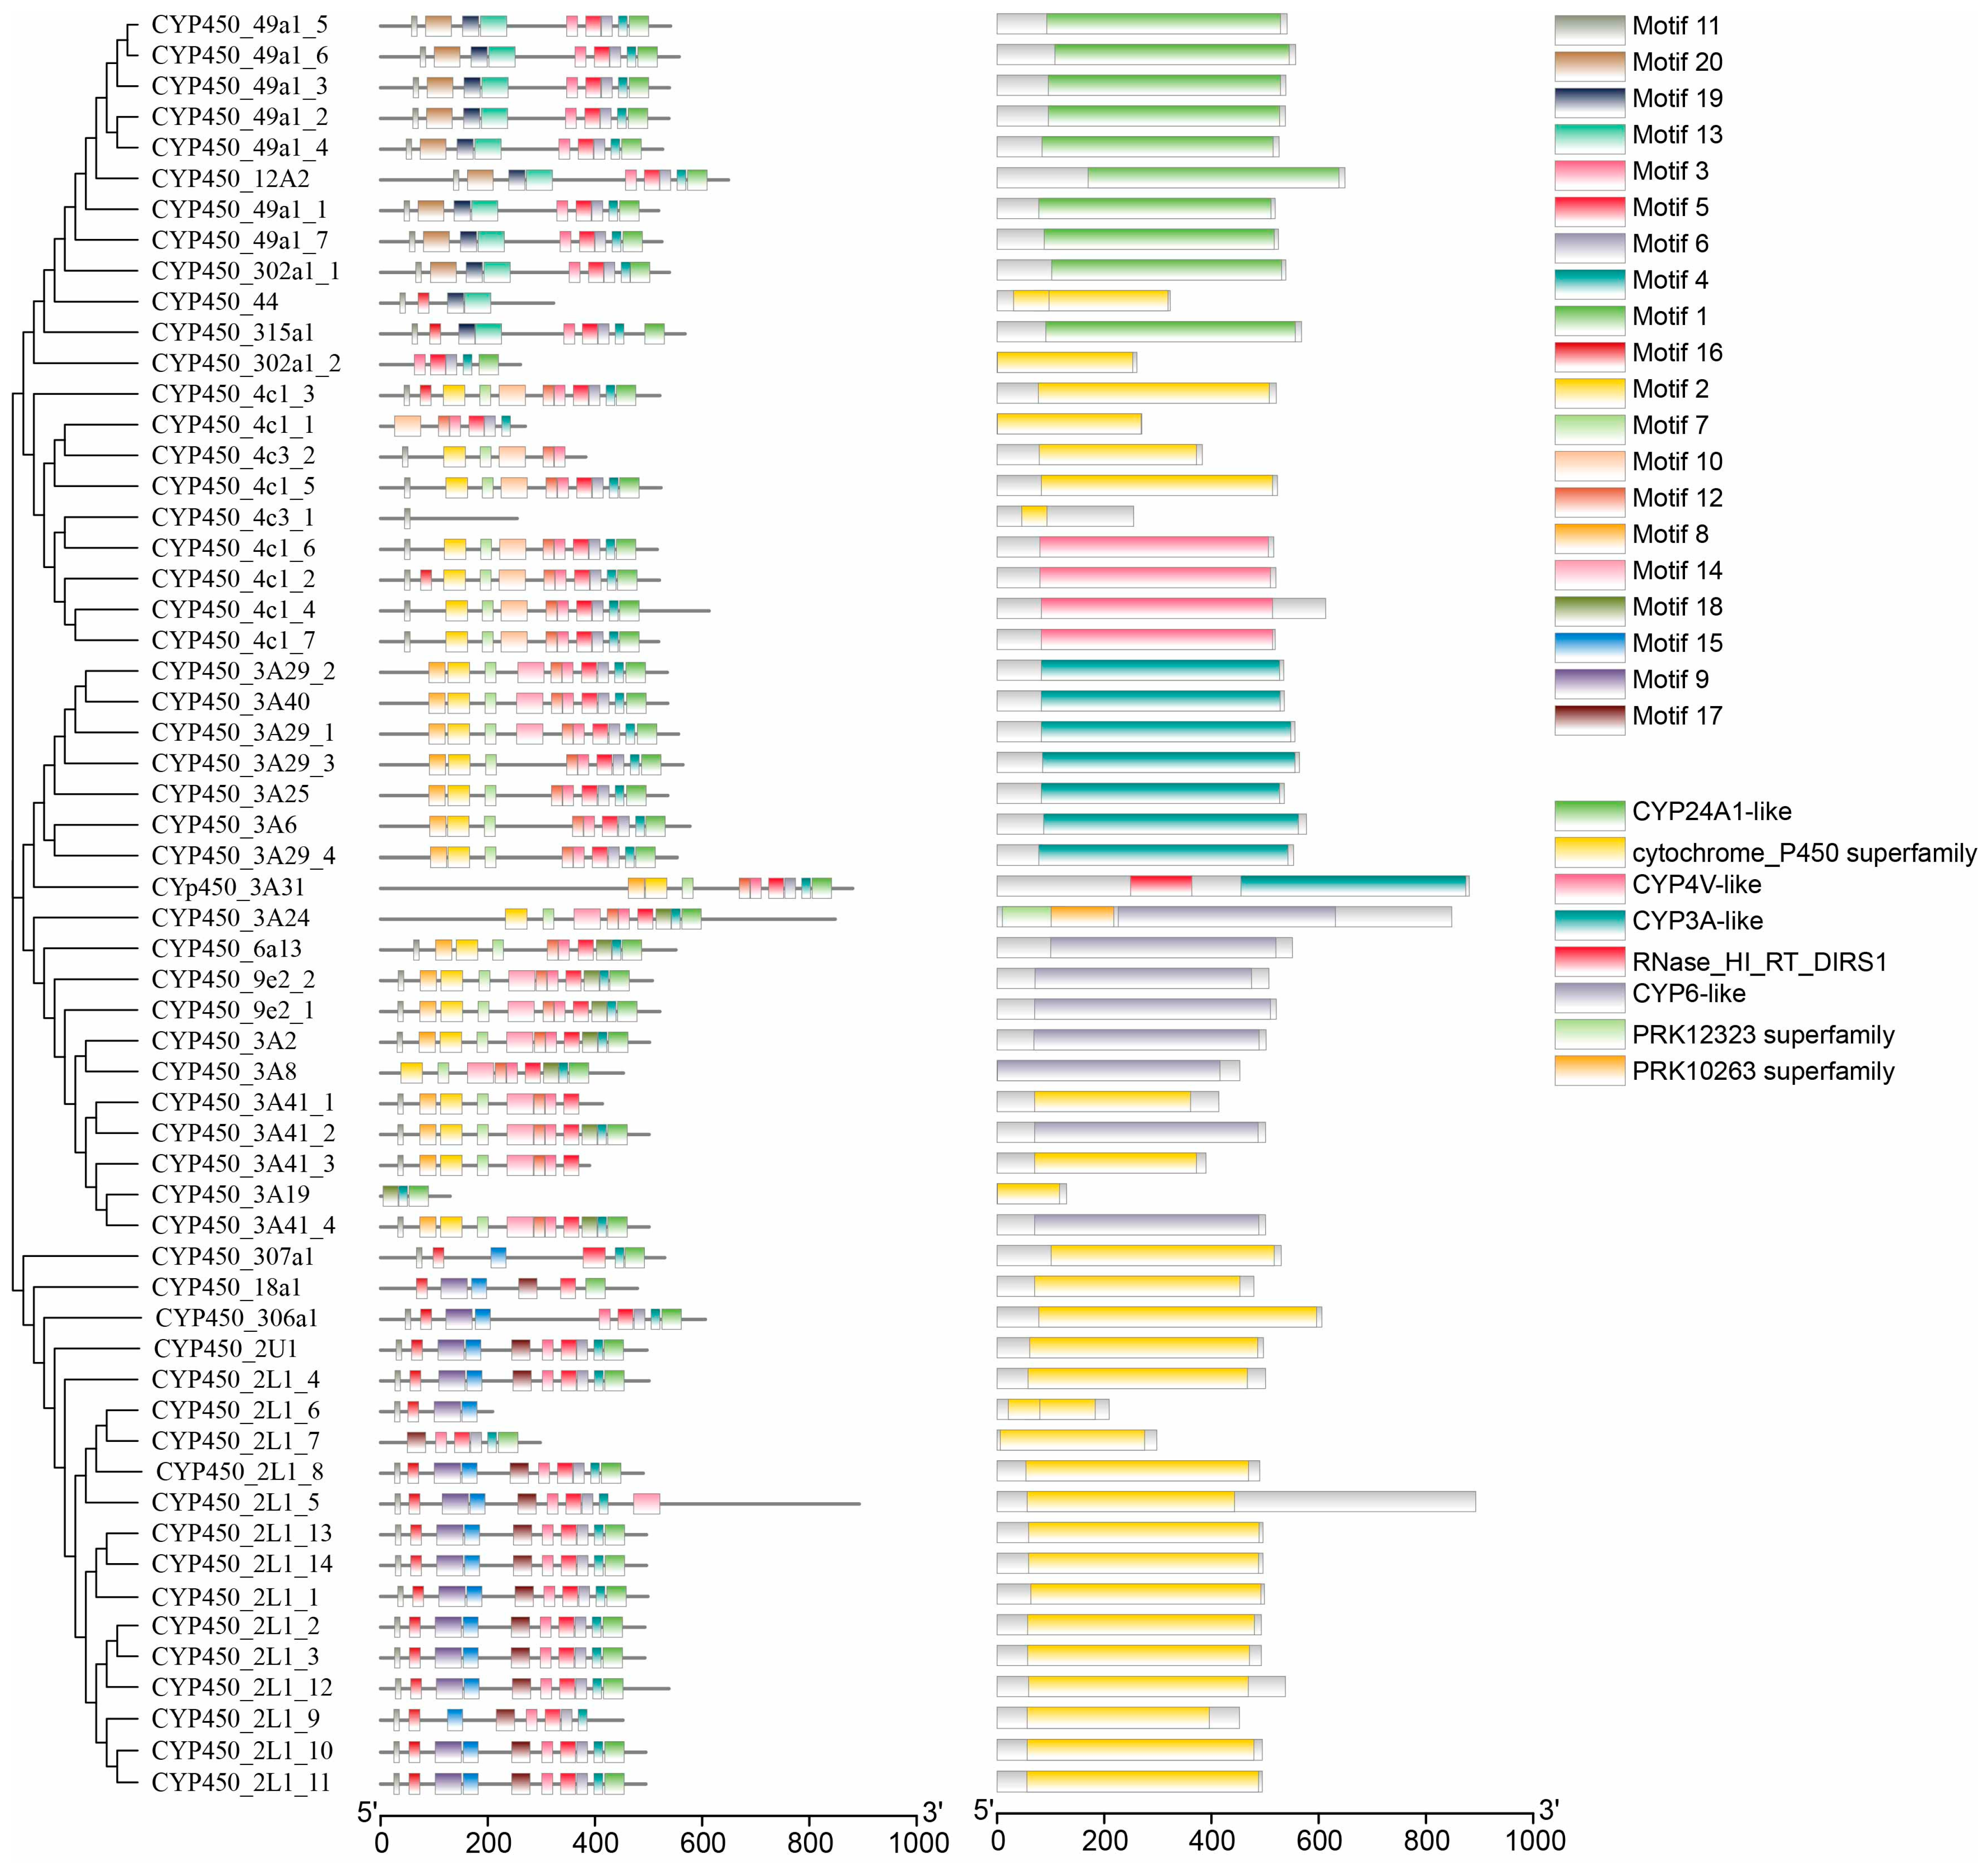
Based on the motif analysis results (Figure 3), the CYP450 protein family could be roughly divided into three subfamilies. The order and number of motifs were similar within subfamilies but differed significantly between them. Subfamily 1 primarily consisted of nine motifs: motif 11, motif 20, motif 19, motif 13, motif 3, motif 5, motif 6, motif 4, and motif 1. Subfamily 2 primarily consisted of 10 motifs: motif 11, motif 2, motif 7, motif 10, motif 12, motif 3, motif 5, motif 6, motif 4, and motif 1. Finally, subfamily 3 primarily consisted of 9 motifs: motif 11, motif 9, motif 15, motif 17, motif 14, motif 16, motif 6, motif 4, and motif 1. The specific motif sequences are shown in Table 3.
The domain architecture analysis of CYP450 family members revealed that most contain a single conserved domain, while a few exhibit multi-domain structures. Specifically, 11 members contain only the CYP24A1-like domain, and 27 members possess solely the cytochrome_P450 superfamily domain. Additionally, 4, 7, and 7 members exclusively harbor CYP4V-like, CYP3A-like, and CYP6-like domains, respectively. In contrast, two members show complex domain compositions: CYP450_3A31 contains both CYP3A-like and RNase_HI_RT_DIRS1 domains, and CYP450_3A24 includes PRK12323, PRK10263, and CYP6-like domains.

3.5. Chromosomal Localization Analysis

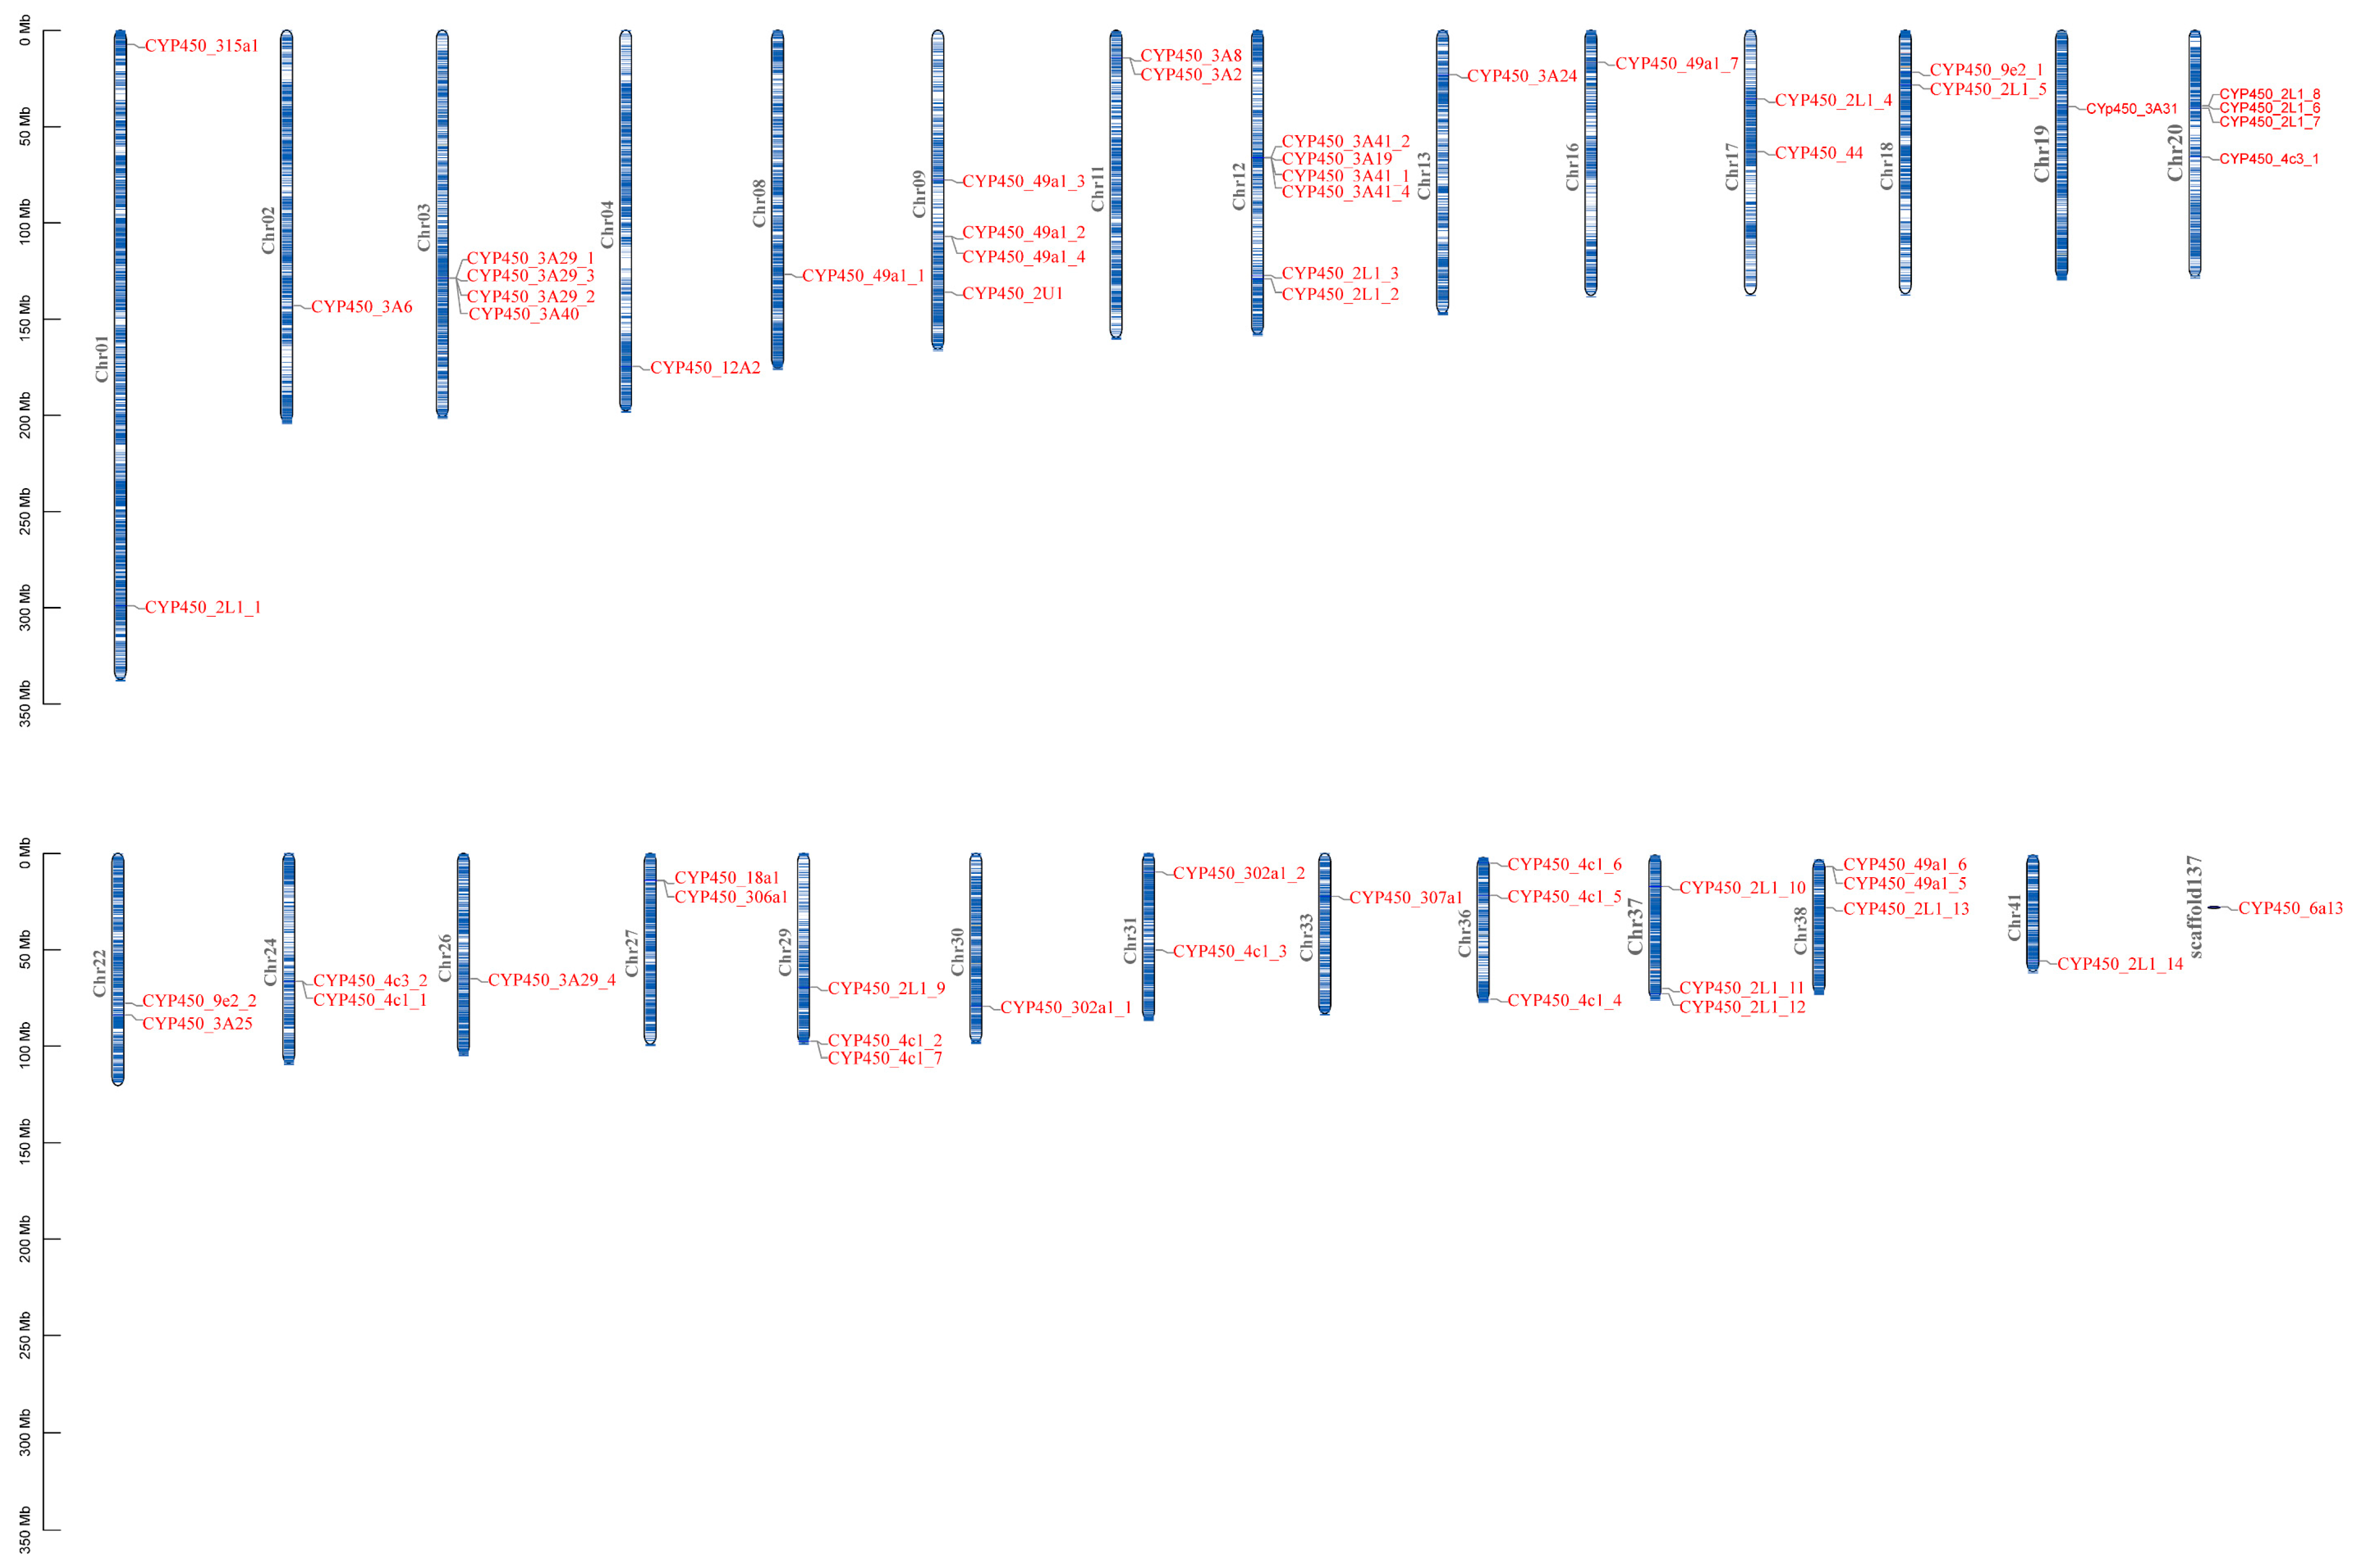
The chromosomal localization of 58 CYP450 family members within the genome is shown in Figure 4. The results show that these genes are widely distributed across multiple chromosomes. Specifically, the majority of the genes are scattered across chromosomes 1 to 41, while only CYP450_6a13 is located on scaffold137. Regarding distribution density, some chromosomes harbor a relatively higher number of genes, such as Chr12 (6 genes), Chr38 (5 genes), Chr20 (4 genes), and Chr3, Chr9, and Chr31, each containing 3–4 genes. In contrast, most other chromosomes (e.g., Chr2, Chr4, Chr8) carry only 1–2 genes. This pattern indicates that the CYP450 gene family exhibits an uneven and regional distribution across the genome.

3.6. Differentially Expressed CYP450 Family Members Between Testes and Ovaries

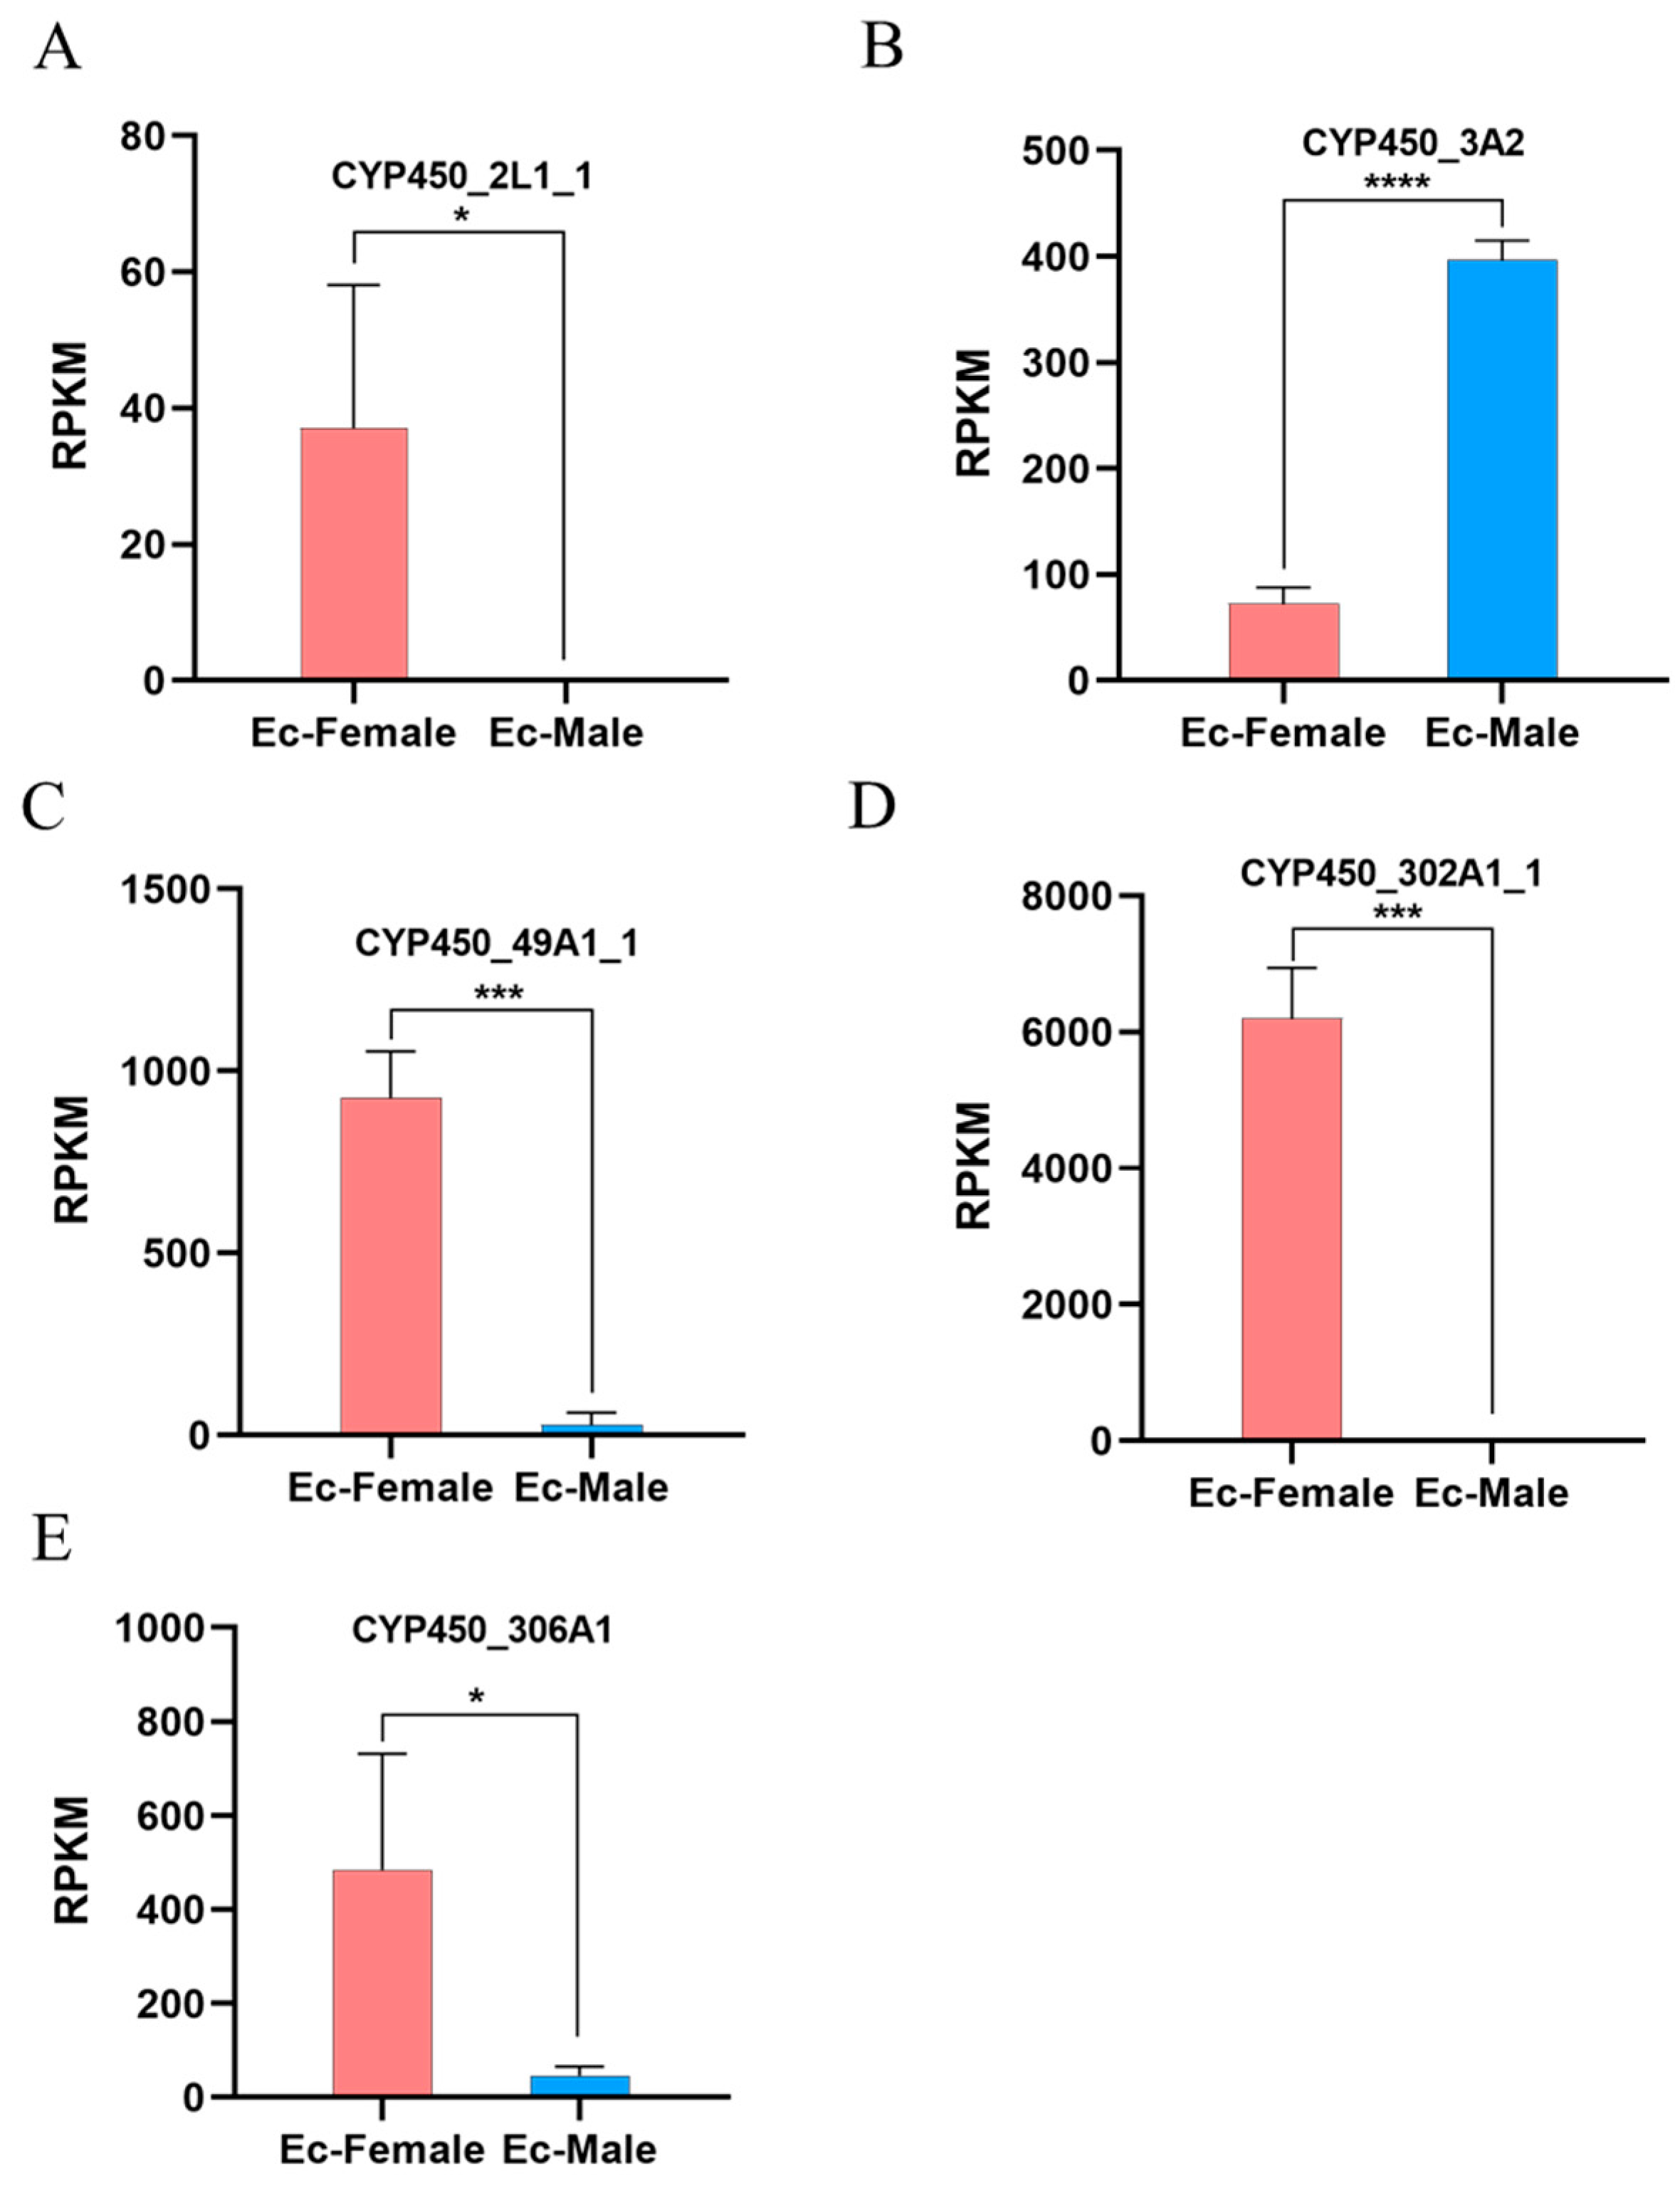
To identify CYP450 family members exhibiting differential expressions, we referred to our previous transcriptome sequencing data from these organs in E. carinicauda. Five CYP450 family members (CYP450_2L1_1, CYP450_3A2, CYP450_49a1_1, CYP450_302A1_1, and CYP450_306A1) were differentially expressed between the testes and ovaries (Figure 5). Among them, CYP450_2L1_1, CYP450_49a1_1, CYP450_302A1_1, and CYP450_306A1 were highly expressed in the ovaries, while CYP450_3A2 was highly expressed in the testes. These distinct expression patterns may suggest potential sex-specific roles for these CYP450 family members in reproductive processes and gonadal development, although confirmation by qPCR is required.

3.7. Expression Trends of CYP450 Members After Eyestalk Ablation

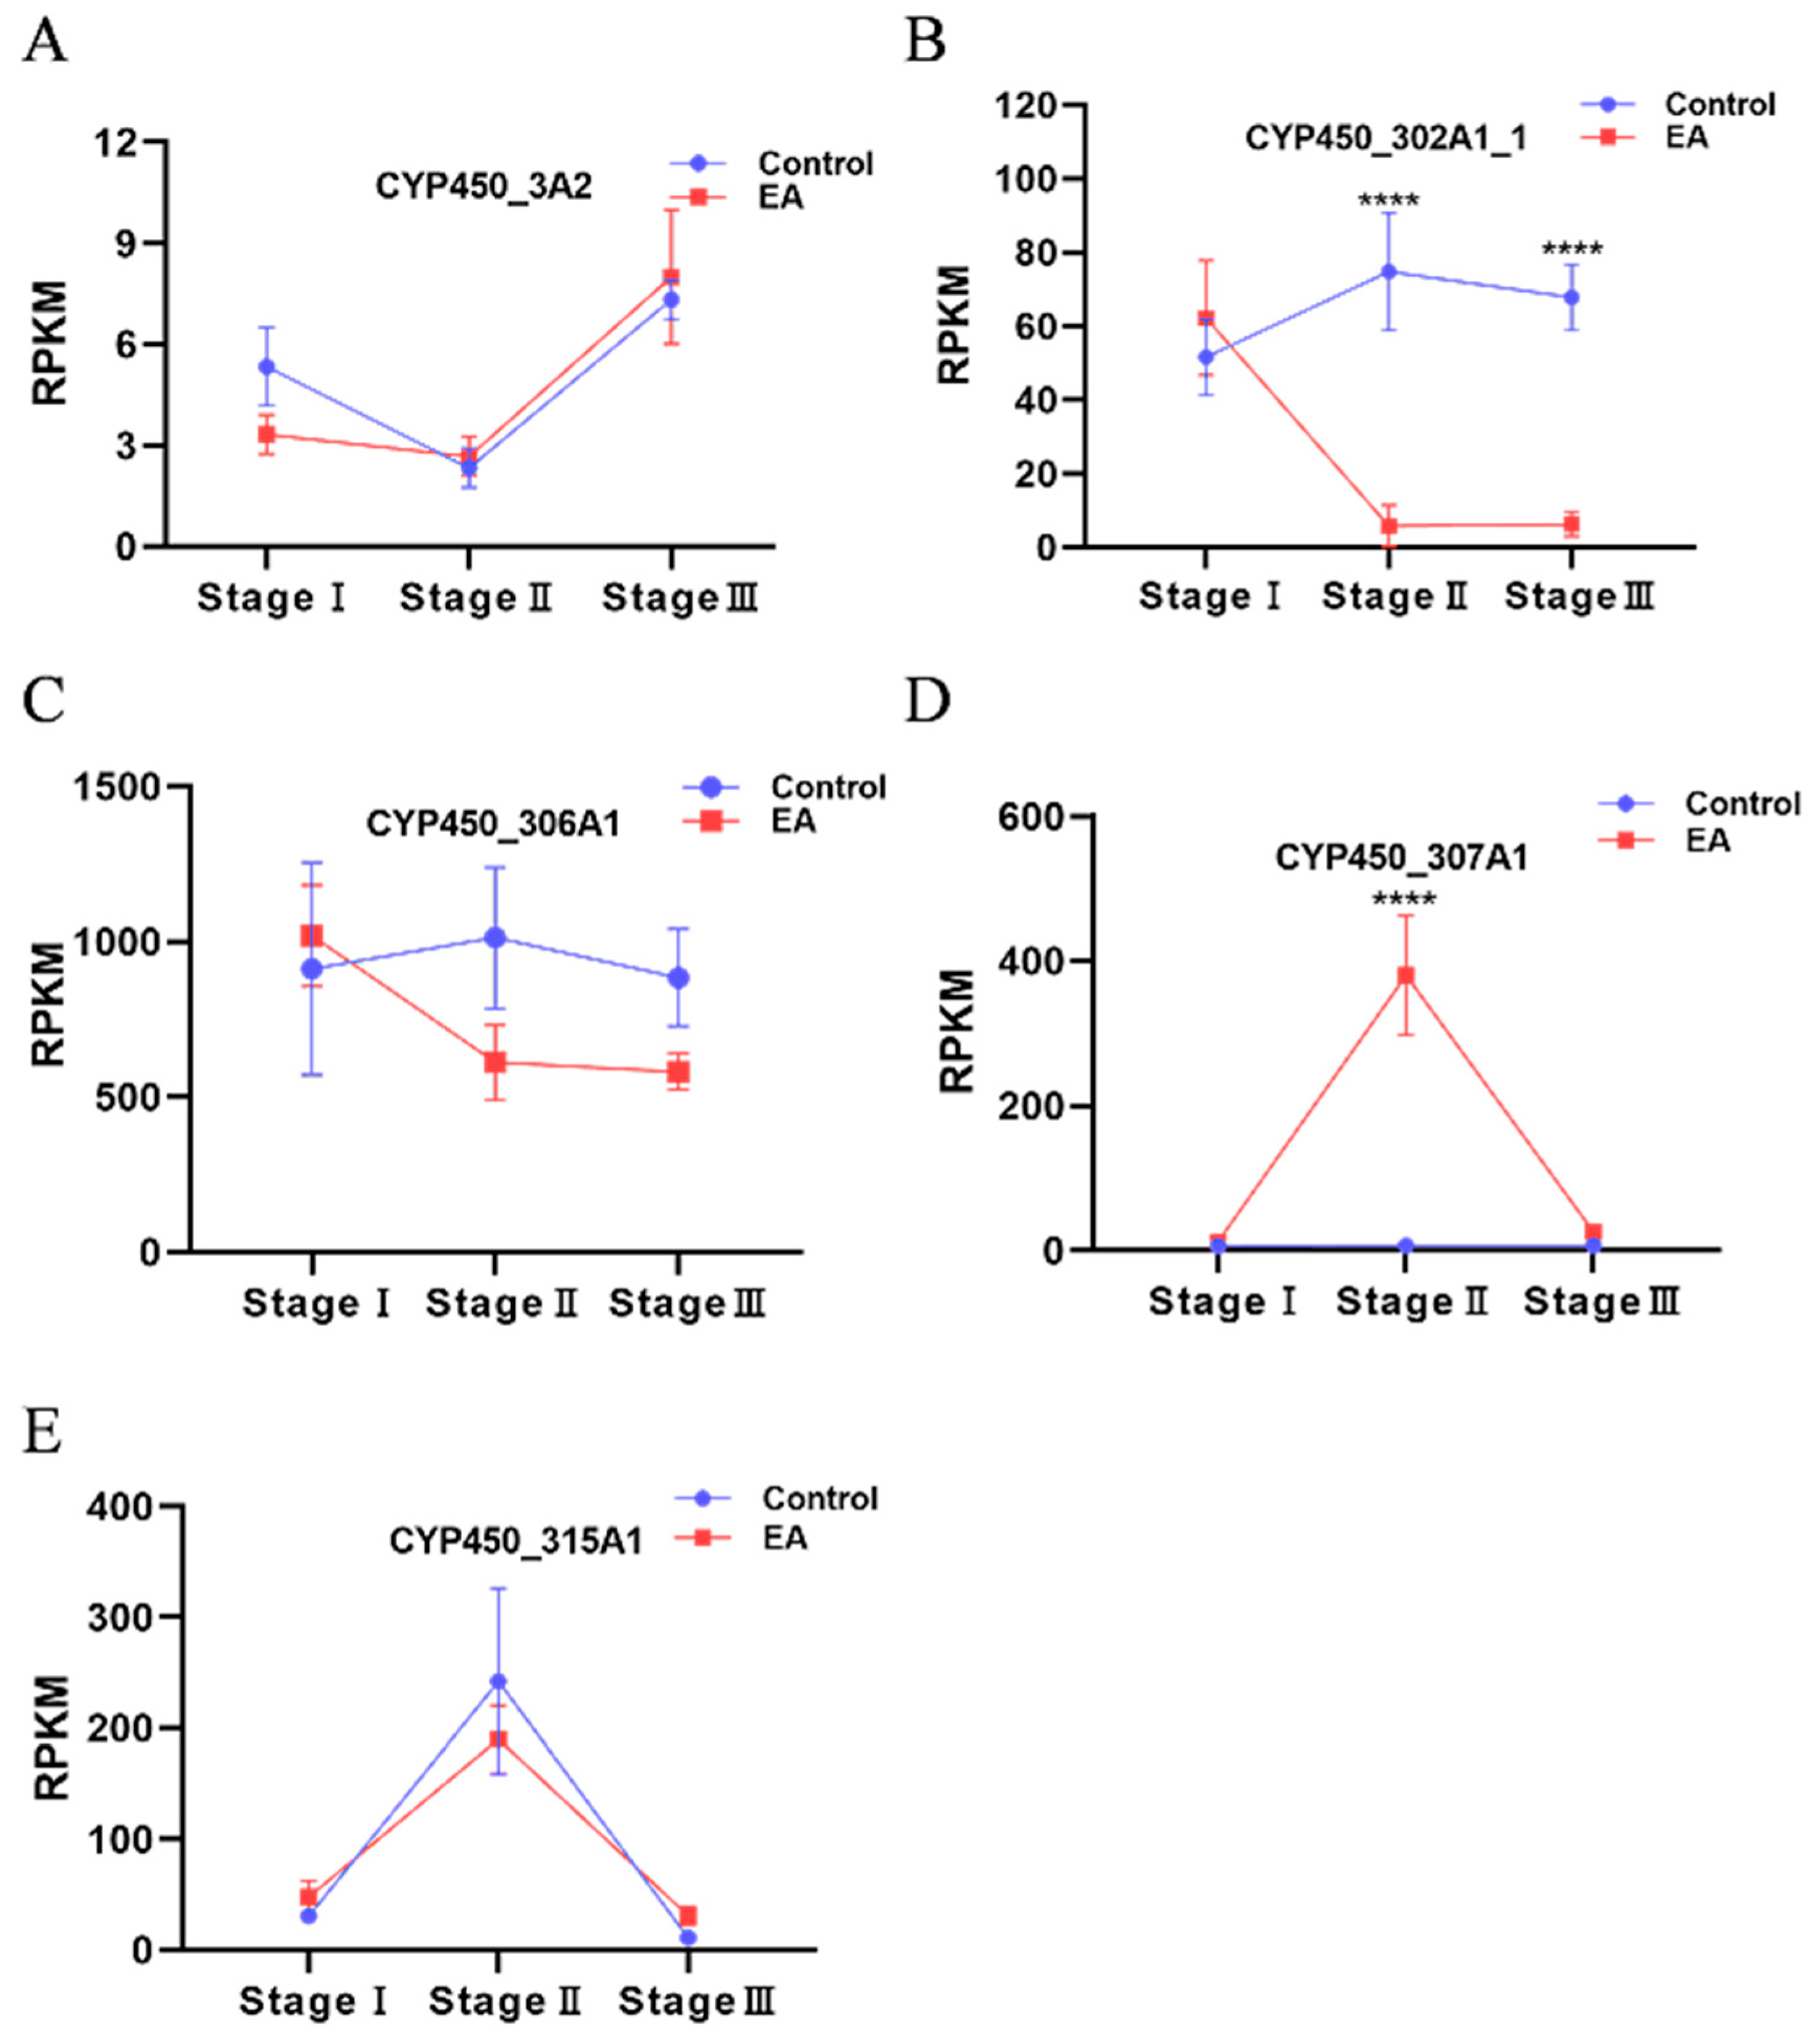
To examine potential involvement in hormonal regulation pathways, we referred to our previous transcriptome sequencing data from eyestalk ablation experiments. Based on this data, we found five CYP450 family members with representative expression trends (Figure 6). The expression patterns of the five CYP450 family members varied over time. Among them, CYP450_302A1_1 and CYP450_307A1 exhibited significant differences from the control group (p < 0.0001), with the former showing an initial increase followed by a slight decrease, and the latter showing a rapid increase followed by a sharp decrease. In contrast, CYP450_3A2, CYP450_306A1, and CYP450_315A1 showed no significant differences from the control group (p > 0.05), although they displayed varying trends of initial increase or decrease. These expression patterns in response to eyestalk ablation suggest that CYP450_302A1_1 and CYP450_307A1, might be potential involved in hormonal regulation pathways. Given that these findings are based solely on RNA-seq data, qPCR confirmation is needed in future studies.

4. Discussion

In this study, we identified 58 CYP450 members in E. carinicauda through bioinformatics analysis and constructed a phylogenetic framework, confirming the significant diversity of this gene family within crustaceans. Meanwhile, the profile of this gene family was comprehensively studied, and several specific genes such as CYP450_307A1 and CYP450_302A1_1, might be linked to gonad development and the molting process through transcriptomic data analysis. This study presents molecular targets for elucidating the core regulatory networks underlying reproduction and development in E. carinicauda, holding significant implications for understanding the environmental adaptability of aquatic organisms.

4.1. The CYP450 Family in E. carinicauda Is Evolutionarily Conserved, with Significant Expansion in Specific Subfamilies

The CYP450 family members in E. carinicauda are evolutionarily conserved. Phylogenetic analysis revealed that CYP450 members primarily cluster into four major clades: CYP2, CYP3, CYP4, and the mitochondrial clan. This distribution pattern is highly conserved and resembles that reported in other crustaceans including Macrobrachium nipponense and Panulirus ornatus [26,27]. This phenomenon supports the notion that these ancient subfamilies play indispensable, fundamental roles in basic animal life processes [8]. Some family members have undergone lineage-specific expansions. For instance, the CYP2L subfamily showed significant expansion in E. carinicauda. The abundance of members within this subfamily suggests that it might have experienced gene duplication events, which is typically an evolutionary response to specific environmental pressures. Considering the ecological context of E. carinicauda as a coastal species frequently exposed to complex pollutant stress, this raises the hypothesis that the expansion of the CYP2L subfamily might have conferred enhanced detoxification capabilities for xenobiotic compounds, a possibility that requires functional validation [1].
Beyond evolutionary conservation, key differentially expressed members identified in gonads exhibit expression patterns suggestive of specialized functions. CYP302A1, a conserved gene in the ecdysteroid synthesis pathway in other species [11,28], was highly expressed in the ovaries. This observation suggests a potential role for this gene in reproductive regulation in crustaceans, extending its known functions beyond ecdysteroid synthesis. Conversely, CYP3A2 was highly expressed in the testes, which may represent a species-specific adaptation in E. carinicauda male reproductive physiology. These distinct expression patterns indicate that while some CYP450 members retain evolutionarily conserved functions, others may have acquired specialized roles in gonadal development and reproduction.

4.2. CYP450 Family Members in E. carinicauda Might Play Important Roles in Crustacean Reproduction

By analyzing the specific expression patterns of the CYP450 family in E. carinicauda across gonads and at different developmental stages following eyestalk ablation, we provide critical clues for the family’s core functions within the crustacean reproductive regulatory network. From the expression profile analysis, we know that multiple CYP450 members, such as CYP302A1, are expressed highly in tissues related to reproduction, which suggests they might be involved in finely tuned reproductive regulation. In Scylla paramamosain, researchers found that CYP302A1 is a key enzyme in the ecdysteroid biosynthesis pathway, catalyzing the conversion of ponasterone A to 20-hydroxyecdysone [28]. In E. carinicauda, the high expression of CYP302A1 in the ovaries suggests that it might also play roles in female reproductive processes such as oocyte maturation and vitellogenesis. Similar findings have also been reported in M. rosenbergii [29], which may provide molecular evidence for understanding how ecdysteroids coordinate growth, development and reproduction.
In the experiment analyzing ovarian expression profiles after eyestalk ablation, CYP307A1 expression showed a rapid response pattern—sharply increasing initially and then declining. This pattern closely aligns with the physiological processes of disinhibition from eyestalk neurohormones such as the gonad-inhibiting hormone, and the subsequent initiation of vitellogenesis. Previous studies indicate that CYP307A1 is a rate-limiting enzyme in the early steps of ecdysteroid synthesis [30]. The observed expression changes in CYP307A1 may reflect broader endocrine shifts resulting from eyestalk ablation. Our preliminary research also identified higher expression levels of CYP307A1 during early ovarian development [25].
Several limitations of this study should be acknowledged. Our findings are based on transcriptomic analysis, and it is important to emphasize that mRNA expression levels are correlative in nature and do not necessarily reflect protein abundance, protein function, or enzymatic activity. While the observed expression patterns are suggestive of specific biological roles, functional validation at the protein level (e.g., Western blotting or immunohistochemistry) and direct enzyme activity assays were not performed. Therefore, these results lay the groundwork for but do not replace such validation. Future studies incorporating these approaches will be necessary to conclusively determine the functional roles of the identified CYP450 genes.
The results show that CYP450 family members in E. carinicauda are far from being solely involved in detoxification. Instead, its core members are deeply embedded within the regulatory network governing the synthesis and metabolism of reproductive hormones. It is important to specifically knockdown CYP302A1 or CYP307A1 using methods like RNA interference, which could verify whether they indeed play roles in ovarian development and maturation. Our findings provide target genes for elucidating the molecular mechanisms of reproductive regulation in crustaceans.

5. Conclusions

In conclusion, our study details the genome-wide identification and characterization of CYP450 family members in E. carinicauda. We identified 58 CYP450 family members and located them on 27 chromosomes. Most proteins were predicted to be hydrophilic and localized in the cytoplasm, consistent with typical characteristics of CYP450 enzymes. Phylogenetic analysis indicated that the CYP450 family members of E. carinicauda were primarily clustered within subfamilies 2, 3, and 4, and the mitochondrial clan. Five CYP450 family members exhibited differential expression between the testes and ovaries, and several CYP450 members showed expression patterns suggesting potential roles in endocrine regulation. These findings provide a detailed description of the structural characteristics and expression patterns of the CYP450 family in E. carinicauda, offering candidate genes for future investigations into crustacean reproductive biology and endocrine regulation.

Author Contributions

J.L. (Jitao Li) designed the study. S.J. and Y.S. performed the experiments. Y.H., K.G. and X.P. analyzed the data. S.J. wrote the manuscript. J.L. (Jianjian Lv) and J.L. (Jitao Li) assisted in revising the manuscript. All authors have read and agreed to the published version of the manuscript.

Funding

This research was made possible due to the ZR2022QC013 project, supported by Shandong Provincial Natural Science Foundation, the Central Public-interest Scientific Institution Basal Research Fund, CAFS (No: 2023TD50) and the China Agriculture Research System of MOF and MARA (No: CARS-48).

Institutional Review Board Statement

Ethical review and approval were waived for this study due to this study is based on previously published genomic and transcriptomic data.

Informed Consent Statement

Not applicable.

Data Availability Statement

The original contributions presented in this study are included in the article. Further inquiries can be directed to the corresponding author.

Conflicts of Interest

The authors declare no conflicts of interest.

References

  1. Manikandan, P.; Nagini, S. Cytochrome P450 Structure, Function and Clinical Significance: A Review. Curr. Drug Targets 2018, 19, 38–54. [Google Scholar] [CrossRef] [PubMed]
  2. Tamura, K.; Seki, H.; Suzuki, H.; Kojoma, M.; Saito, K.; Muranaka, T. CYP716A179 functions as a triterpene C-28 oxidase in tissue-cultured stolons of Glycyrrhiza uralensis. Plant Cell Rep. 2016, 36, 437–445. [Google Scholar] [CrossRef] [PubMed]
  3. Goldstone, J.V.; McArthur, A.G.; Kubota, A.; Zanette, J.; Parente, T.; Jönsson, M.E.; Nelson, D.R.; Stegeman, J.J. Identification and developmental expression of the full complement of Cytochrome P450 genes in Zebrafish. BMC Genom. 2010, 11, 643. [Google Scholar] [CrossRef] [PubMed]
  4. Diliberto, J.J.; Burgin, D.; Birnbaum, L.S. Role of CYP1A2 in hepatic sequestration of dioxin: Studies using CYP1A2 knock-out mice. Biochem. Biophys. Res. Commun. 1997, 236, 431–433. [Google Scholar] [CrossRef]
  5. Simonetti, L.; Bruque, C.D.; Fernández, C.S.; Benavides-Mori, B.; Delea, M.; Kolomenski, J.E.; Espeche, L.D.; Buzzalino, N.D.; Nadra, A.D.; Dain, L. CYP21A2 mutation update: Comprehensive analysis of databases and published genetic variants. Hum. Mutat. 2018, 39, 5–22. [Google Scholar] [CrossRef]
  6. Lafontaine, A.; Gismondi, E.; Boulangé-Lecomte, C.; Geraudie, P.; Dodet, N.; Caupos, F.; Lemoine, S.; Lagadic, L.; Thomé, J.-P.; Forget-Leray, J. Effects of chlordecone on 20-hydroxyecdysone concentration and chitobiase activity in a decapod crustacean, Macrobrachium rosenbergii. Aquat. Toxicol. 2016, 176, 53–63. [Google Scholar] [CrossRef]
  7. Humble, J.L.; Carmona-Antoñanzas, G.; McNair, C.M.; Nelson, D.R.; Bassett, D.I.; Egholm, I.; Bron, J.E.; Bekaert, M.; Sturm, A. Genome-wide survey of cytochrome P450 genes in the salmon louse Lepeophtheirus salmonis (Krøyer, 1837). Parasites Vectors 2019, 12, 563. [Google Scholar] [CrossRef]
  8. Nelson, D.R. Cytochrome P450 diversity in the tree of life. Biochim. Biophys. Acta (BBA)—Proteins Proteom. 2018, 1866, 141–154. [Google Scholar] [CrossRef]
  9. Liu, Z.Y.; Zhu, D.F.; Xie, X.; Qiu, X.; Zhou, Y.; Shen, X. Molecular cloning expression analysis of CYP302a1 from Portunus trituberculatus. J. Fish. China 2015, 39, 628–637. [Google Scholar]
  10. Rewitz, K.; Styrishave, B.; Andersen, O. CYP330A1 and CYP4C39 enzymes in the shore crab Carcinus maenas: Sequence and expression regulation by ecdysteroids and xenobiotics. Biochem. Biophys. Res. Commun. 2003, 310, 252–260. [Google Scholar] [CrossRef]
  11. Yang, G.; Qin, Z.; Zhao, L.; Zhan, F.; Shen, H.; Zhang, M.; Lu, Z.; Ye, C.; Li, F.; Pan, G. Cloning and characterization of cytochrome P450 302a1 (CYP 302a1) during molting stages in Macrobrachium rosenbergii. J. Fish. China 2020, 44, 562–574. Available online: http://china-fishery.cn/en/article/doi/10.11964/jfc.20190711868 (accessed on 12 November 2025).
  12. Yuan, H.; Qiao, H.; Fu, Y.; Fu, H.; Zhang, W.; Jin, S.; Gong, Y.; Jiang, S.; Xiong, Y.; Hu, Y.; et al. RNA interference shows that Spook, the precursor gene of 20-hydroxyecdysone (20E), regulates the molting of Macrobrachium nipponense. J. Steroid Biochem. Mol. Biol. 2021, 213, 105976. [Google Scholar] [CrossRef] [PubMed]
  13. Pan, F.; Fu, Y.; Zhang, W.; Jiang, S.; Xiong, Y.; Yan, Y.; Gong, Y.; Qiao, H.; Fu, H. Characterization, expression and functional analysis of CYP306a1 in the oriental river prawn, Macrobrachium nipponense. Aquac. Rep. 2022, 22, 101009. [Google Scholar] [CrossRef]
  14. Liu, X.-M.; Zhang, X.-X.; He, X.; Yang, K.; Huang, X.-R.; Ye, J.-B.; Zhang, W.-W.; Xu, F. Identification and analysis of CYP450 family members in Ginkgo biloba reveals the candidate genes for terpene trilactone biosynthesis. Sci. Hortic. 2022, 301, 111103. [Google Scholar] [CrossRef]
  15. Li, R.; Xiao, M.; Li, J.; Zhao, Q.; Wang, M.; Zhu, Z. Transcriptome Analysis of CYP450 Family Members in Fritillaria cirrhosa, D. Don and Profiling of Key CYP450s Related to Isosteroidal Alkaloid Biosynthesis. Genes 2023, 14, 219. [Google Scholar] [CrossRef]
  16. Baldwin, W.S.; Marko, P.B.; Nelson, D.R. The cytochrome P450 (CYP) gene superfamily in Daphnia pulex. BMC Genom. 2009, 10, 169. [Google Scholar] [CrossRef]
  17. Chung, H.; Sztal, T.; Pasricha, S.; Sridhar, M.; Batterham, P.; Daborn, P.J. Characterization of Drosophila melanogaster cytochrome P450 genes. Proc. Natl. Acad. Sci. USA 2009, 106, 5731–5736. [Google Scholar] [CrossRef]
  18. Li, B. Analysis of cytochrome P450 genes in silkworm genome (Bombyx mori). Sci. China Ser. C 2005, 48, 414–418. [Google Scholar] [CrossRef]
  19. Zheng, Z.; Chen, Q.; Liu, D.; Zhang, Z.; Chao, Y.; Qi, D. Identification of cytochrome P450 family members of Gammarus suifunensis using transcriptome data. J. Qinghai Univ. 2020, 38, 26–32. [Google Scholar] [CrossRef]
  20. Jia, S.; Jin, L.; Lv, J.; Wang, J.; Li, J.; Liu, P.; Li, J. Comparative transcriptomic analysis and validation of the ovary and testis in the ridgetail white prawn (Exopalaemon carinicauda). Front. Mar. Sci. 2022, 9, 995790. [Google Scholar] [CrossRef]
  21. Wang, J.; Lv, J.; Shi, M.; Ge, Q.; Wang, Q.; He, Y.; Li, J.; Li, J. Chromosome-level genome assembly of ridgetail white shrimp Exopalaemon carinicauda. Sci. Data 2024, 11, 576. [Google Scholar] [CrossRef] [PubMed]
  22. Gasteiger, E.; Hoogland, C.; Gattiker, A.; Duvaud, S.E.; Wilkins, M.R.; Appel, R.D.; Bairoch, A. Protein identification and analysis tools on the ExPASy server. In The Proteomics Protocols Handbook; Humana Press: Totowa, NJ, USA, 2005; pp. 571–607. [Google Scholar]
  23. Nakai, K.; Imai, K. Prediction of Protein Localization Encyclopedia of Bioinformatics and Computational Biology; Academic Press: Oxford, UK, 2019; pp. 53–59. [Google Scholar]
  24. Chen, C.; Wu, Y.; Li, J.; Wang, X.; Zeng, Z.; Xu, J.; Liu, Y.; Feng, J.; Chen, H.; He, Y. TBtools-II: A “one for all, all for one” bioinformatics platform for biological big-data mining. Mol. Plant 2023, 16, 1733–1742. [Google Scholar] [CrossRef]
  25. Jia, S.; Li, J.; Lv, J.; Ren, X.; Wang, J.; Wang, Q.; Liu, P.; Li, J. Molecular Characterization Related to Ovary Early Development Mechanisms after Eyestalk Ablation in Exopalaemon carinicauda. Biology 2023, 12, 596. [Google Scholar] [CrossRef]
  26. Lewis, C.L.; Fitzgibbon, Q.P.; Smith, G.G.; Elizur, A.; Ventura, T. Ontogeny of the Cytochrome P450 Superfamily in the Ornate Spiny Lobster (Panulirus ornatus). Int. J. Mol. Sci. 2024, 25, 1070. [Google Scholar] [CrossRef]
  27. Wu, X.; Chen, Z.; Fan, Y.; Feng, J.; Li, J. Genome-wide identification and expression analysis of cytochrome P450 gene family in Macrobrachium nipponense. Aquac. Fish. 2025, 10, 228–237. [Google Scholar] [CrossRef]
  28. Jin, X.; Ma, L.; Zhang, F.; Zhang, L.; Yin, J.; Wang, W.; Zhao, M. Identification and Evolution Analysis of the Genes Involved in the 20-Hydroxyecdysone Metabolism in the Mud Crab, Scylla paramamosain: A Preliminary Study. Genes 2024, 15, 1586. [Google Scholar] [CrossRef] [PubMed]
  29. Zheng, Y.; Zhang, W.; Xiong, Y.; Wang, J.; Jin, S.; Qiao, H.; Jiang, S.; Fu, H. Dual roles of CYP302A1 in regulating ovarian maturation and molting in Macrobrachium nipponense. J. Steroid Biochem. Mol. Biol. 2023, 232, 106336. [Google Scholar] [CrossRef]
  30. Namiki, T.; Niwa, R.; Sakudoh, T.; Shirai, K.-I.; Takeuchi, H.; Kataoka, H. Cytochrome P450 CYP307A1/Spook: A regulator for ecdysone synthesis in insects. Biochem. Biophys. Res. Commun. 2005, 337, 367–374. [Google Scholar] [CrossRef] [PubMed]
Figure 1. Phylogenetic tree of CYP450 family members. Different colored texts represent different clans in the figure. Purple: clan 1; blue: clan 2; red: clan 3; yellow: clan 4; green: mitochondrial clan. Species abbreviations are as follows: Hs: Homo sapiens; Mm: Mus musculus; Dr: Danio rerio; Cs: Chilo suppressalis; Dm: Daphnia magna; Lv: Litopenaeus vannamei; Fc: Fenneropenaeus chinensis; Pt: Portunus trituberculatus; Mj: Marsupenaeus japonicus; Rp: Ruditapes philippinarum; Ss: Solea senegalensis; Es: Eriocheir sinensis; Ec: Exopalaemon carinicauda.
Animals 16 01201 g001
Figure 2. Gene structure of CYP450 family members.
Animals 16 01201 g002
Figure 3. Motifs and domains of CYP450 family members.
Animals 16 01201 g003
Figure 4. Chromosomal location of CYP450 family members. The blue vertical bars represent different chromosomes.
Animals 16 01201 g004
Figure 5. Expression of selected CYP450 family members in testes and ovaries. (A) The expression of CYP450_2L1_1; (B) The expression of CYP450_3A2; (C) The expression of CYP450_49A1_1; (D) The expression of CYP450_302A1_1; (E) The expression of CYP450_305A1. (* p < 0.05; *** p < 0.001; **** p < 0.0001).
Animals 16 01201 g005
Figure 6. Expression trends of CYP450 family members after eyestalk ablation. Stage I: 1 day after eyestalk ablation; Stage II: 6 days after eyestalk ablation; Stage III: 11 days after eyestalk ablation. (A) The expression trend of CYP450_3A2; (B) The expression trend of CYP450_302A1_1; (C) The expression trend of CYP450_306A1; (D) The expression trend of CYP450_307A1; (E) The expression trend of CYP450_315A1. (**** p < 0.0001).
Animals 16 01201 g006
Table 1. Protein composition and physicochemical properties of the CYP450 gene family.
Gene IDGene NameProtein LengthMolecular Weight/kDaPIInstability IndexGrand Average of HydropathicityAliphatic Index
Chr01.g04253.m1CYP450_2L1_149857.315.7143.16−0.18089.66
Chr12.g35711.m1CYP450_2L1_249256.415.9545.41−0.14595.67
Chr12.g35690.m1CYP450_2L1_349256.675.7354.64−0.19893.90
Chr17.g46067.m1CYP450_2L1_450057.086.5934.62−0.18588.36
Chr18.g48525.m1CYP450_2L1_5892100.758.3248.26−0.49080.78
Chr20.g53478.m1CYP450_2L1_620824.069.4657.15−0.02391.88
Chr20.g53494.m1CYP450_2L1_729734.155.3539.37−0.18085.72
Chr20.g53477.m1CYP450_2L1_848956.565.5844.46−0.15190.72
Chr29.g71751.m1CYP450_2L1_945152.016.1537.76−0.28388.82
Chr37.g84839.m1CYP450_2L1_1049456.405.5944.90−0.19993.72
Chr37.g86113.m1CYP450_2L1_1149457.166.7841.84−0.20289.39
Chr37.g86193.m1CYP450_2L1_1253761.836.5139.56−0.29887.19
Chr38.g86722.m1CYP450_2L1_1349556.696.6935.81−0.17396.30
Chr41.g91361.m1CYP450_2L1_1449557.076.3635.91−0.20888.22
Chr09.g28246.m1CYP450_2U149657.667.7739.05−0.29287.00
Chr27.g67194.m1CYP450_306A160569.375.8344.47−0.29490.41
Chr33.g78411.m1CYP450_307A152960.386.3040.00−0.26185.29
Chr27.g67191.m1CYP450_18A147854.009.3752.48−0.31679.14
Chr11.g31708.m1CYP450_3A250157.026.4045.28−0.09187.64
Chr02.g07043.m1CYP450_3A657665.308.8231.93−0.21487.57
Chr11.g31707.m1CYP450_3A845251.735.5048.44−0.12087.59
Chr12.g34874.m1CYP450_3A1912914.595.9133.78−0.11897.52
Chr13.g36729.m1CYP450_3A2484792.886.7361.84−0.31679.98
Chr22.g58734.m1CYP450_3A2553561.296.4038.51−0.10594.06
Chr03.g10506.m1CYP450_3A29_155563.908.0134.01−0.15796.45
Chr03.g10508.m1CYP450_3A29_253461.028.7235.91−0.09496.93
Chr03.g10507.m1CYP450_3A29_356364.388.8637.47−0.16291.58
Chr26.g66158.m1CYP450_3A29_455262.778.8044.62−0.23193.04
Chr19.g50915.m1CYP450_3A3188098.486.1647.50−0.38983.07
Chr03.g10509.m1CYP450_3A4053561.568.5536.49−0.10199.98
Chr12.g34876.m1CYP450_3A41_141347.039.0343.09−0.10185.71
Chr12.g34871.m1CYP450_3A41_250056.878.3840.29−0.08989.72
Chr12.g34879.m1CYP450_3A41_338943.998.0441.380.02792.52
Chr12.g34879.m1CYP450_3A41_450056.847.5339.89−0.10288.96
scaffold137.g98188.m1CYP450_6A1355061.918.8748.07−0.00894.71
Chr18.g48378.m1CYP450_9E2_152059.358.5742.29−0.15688.69
Chr22.g58666.m1CYP450_9E2_250658.286.4532.47−0.10884.01
Chr24.g62201.m1CYP450_4C1_126931.075.3540.98−0.49986.69
Chr29.g72426.m1CYP450_4C1_251959.776.8842.98−0.25093.53
Chr31.g75635.m1CYP450_4C1_352060.246.3639.07−0.39986.98
Chr36.g84414.m2CYP450_4C1_461270.357.2343.98−0.41888.09
Chr36.g83447.m1CYP450_4C1_552260.358.6536.65−0.22792.26
Chr36.g83037.m1CYP450_4C1_651559.317.5843.01−0.23096.78
Chr29.g72429.m1CYP450_4C1_751959.677.1639.28−0.21795.39
Chr20.g53902.m1CYP450_4C3_125429.579.4351.40−0.11696.77
Chr24.g62199.m1CYP450_4C3_238244.426.1835.60−0.29286.75
Chr04.g14492.m1CYP450_12A264874.319.1854.47−0.45183.81
Chr17.g46655.m1CYP450_4432236.846.5744.50−0.18292.30
Chr08.g25434.m1CYP450_49A1_151859.589.3840.03−0.33387.70
Chr09.g27757.m1CYP450_49A1_253761.348.6741.46−0.24691.25
Chr09.g27435.m1CYP450_49A1_353861.558.9649.34−0.38281.34
Chr09.g27758.m1CYP450_49A1_452560.058.8943.54−0.22193.92
Chr38.g86333.m1CYP450_49A1_554062.208.6244.34−0.38479.46
Chr38.g86332.m1CYP450_49A1_655664.138.5748.54−0.36578.72
Chr16.g43710.m1CYP450_49A5_752460.118.8245.51−0.39085.04
Chr30.g74098.m2CYP450_302A1_153861.138.7245.30−0.32191.51
Chr31.g74724.m1CYP450_302A1_226029.139.5157.62−0.07995.69
Chr01.g00149.m1CYP450_315A156763.299.2849.58−0.32283.05
Table 2. The subcellular localization of CYP450 family members.
Gene IDLocalization
CYP450_18A1, CYP450_4C1_1, CYP450_3A24, CYP450_12A2Nucleus
CYP450_2L1_2, CYP450_2L1_3, CYP450_2L1_6, CYP450_2L1_7, CYP450_2L1_8, CYP450_2L1_9, CYP450_2L1_10, CYP450_2L1_11, CYP450_3A31, CYP450_2L1_14, CYP450_9E2_1, CYP450_3A8, CYP450_3A19, CYP450_44, CYP450_49A1_1, CYP450_49A1_2, CYP450_49A1_3, CYP450_49A1_4, CYP450_49A1_5, CYP450_49A1_6, CYP450_49A5_7, CYP450_302A1_1, CYP450_302A1_2, CYP450_315A1Cytoplasm
CYP450_2L1_1, CYP450_2L1_4, CYP450_2L1_5, CYP450_2L1_12, CYP450_2L1_13, CYP450_2U1, CYP450_306A1, CYP450_307A1, CYP450_3A2, CYP450_3A6, CYP450_3A25, CYP450_3A29_1, CYP450_3A29_2, CYP450_3A29_3, CYP450_3A29_4, CYP450_3A40, CYP450_3A41_1, CYP450_3A41_2, CYP450_3A41_3, CYP450_3A41_4, CYP450_6A13, CYP450_9E2_2, CYP450_4C1_2, CYP450_4C1_3, CYP450_4C1_4, CYP450_4C1_5, CYP450_4C1_6, CYP450_4C1_7, CYP450_4C3_1, CYP450_4C3_2, Cytomembrane
Table 3. Protein motif information of CYP450 family members.
MotifProtein SequenceNo. of AA
Motif 1NKKDIHPYAYLPFGAGPRNCIGERFARMELKIFLARL37
Motif 2DPWMNTMLLNLRGQKWKSVRSLLTPTFSSGKMKDMFHLVNE41
Motif 3DTTSTTLAWTLYLLAKHPEIQ21
Motif 4DPKYWPDPEEFDPERFL17
Motif 5GPLTYEDLMELKYLEAVIKEVLRLYPPVP29
Motif 6GVGRELTEDTVLGGYRIPKGT21
Motif 7TLDVICECAFGLECNAQRDEN21
Motif 8YMGLKPFLVVCDPELIRQILIKDFDHFTNRP31
Motif 9EAGIIGSNGDVWVNNRRFALRHLRDLGMGKSSLEEAIQEEARILVEDFKK50
Motif 10QQRQARPWLQPDILFKLLGYAKEHDACLKVLHDMSYKCIRERRKQYQERK50
Motif 11PGPPGLPILGS11
Motif 12KKVLTDEEIIANVDLFMLAGY21
Motif 13MDQVTLEFMERISSFQDEHGEMPEDFQVELYKWALESVSLVALNRRLGCL50
Motif 14GLSLFPKETQFFKNVVEETLAARRKGTKRGDFLDLLLEAQSGEDLGDPSK50
Motif 15GKPVEIPWSLNVAVLNVIWKMVAGKRYDM29
Motif 16KYGDIFSWKLGGQIFVFICDY21
Motif 17EIIDEHKKNFDPDNPKDYIDAYLIEMKKKTNEAGS35
Motif 18CTKDYKIPGTNLTVPKGLSVQVPVYSIHH29
Motif 19GLLIENGEEWKRVRSRVQTPMMKPKNVNAYL31
Motif 20HKFWRKMVEEYGPIVRLDMPGMPPLVFITDPEDCEMLVRSTMDNPTRPG49
Disclaimer/Publisher’s Note: The statements, opinions and data contained in all publications are solely those of the individual author(s) and contributor(s) and not of MDPI and/or the editor(s). MDPI and/or the editor(s) disclaim responsibility for any injury to people or property resulting from any ideas, methods, instructions or products referred to in the content.