Article

Mitogenome Characteristics and Phylogenetic Analysis of Six Apistogramma Species

College of Life Sciences, Nanjing Forestry University, Nanjing 210037, China
*
Authors to whom correspondence should be addressed.
These authors contributed equally to this work.
Animals 2026, 16(8), 1178; https://doi.org/10.3390/ani16081178
Submission received: 20 March 2026 / Revised: 9 April 2026 / Accepted: 10 April 2026 / Published: 12 April 2026

Simple Summary

We characterized the mitogenomes of six Apistogramma species, revealing highly conserved genomes with significant AT bias. All 13 protein-coding genes were under purifying selection. The genes nad5, cox1, and nad4, containing higher proportions of variable sites, could be ideal molecular markers for rapid species identification. Phylogenetic analysis confirmed the monophyly of Apistogramma and revealed closer relationships between A. nijsseni and A. baenschi and between A. cacatuoides and A. agassizii. These findings provide a basis for rapid species identification and evolutionary studies within this genus.

Abstract

The Neotropical cichlid genus Apistogramma represents one of the most taxonomically diverse and ecologically significant groups of South American freshwater fishes, yet its evolutionary history and species boundaries remain poorly understood due to a lack of comprehensive genomic resources. To address this gap, this study investigated the complete mitogenomic characteristics of six representative Apistogramma species (A. agassizii, A. allpahuayo, A. baenschi, A. nijsseni, A. resticulosa, and A. cacatuoides) to establish a robust molecular framework for species identification and phylogenetic reconstruction. The results showed that Apistogramma mitogenomes are highly conserved. All six Apistogramma species exhibited significant AT bias. Selection pressure analysis revealed that the Ka/Ks ratios for all 13 protein-coding genes were between 0 and 1, indicating that these genes were under purifying selection. Differential site analysis identified nad5, cox1, and nad4 as ideal molecular markers for rapid Apistogramma species identification owing to higher proportions of variable sites. Phylogenetic analysis recovered Apistogramma as a strongly supported monophyletic clade (BP = 100, PP = 1.00), within which A. nijsseni clustered with A. baenschi and A. cacatuoides with A. agassizii. These internal phylogenetic relationships are consistent with the calculated genetic distances and previous morphological groupings. These findings provide an important theoretical basis and data support for rapid species identification, genetic evolutionary research, and divergence time estimation within Apistogramma.

1. Introduction

Dwarf cichlids (Family: Cichlidae) represent a diverse assemblage of small-bodied fishes, typically defined by a maximum standard length of 10–12 cm. Widely distributed across South America and Africa, these teleosts are characterized by vibrant sexual dichromatism and complex behavioral traits [1,2]. Previous studies have highlighted their remarkable life-history strategies, particularly their rapid reproductive cycles and high adaptability to fluctuating freshwater environments [3]. While traditional research has extensively documented their ethology and morphology, recent molecular investigations have increasingly focused on resolving the complex phylogenetic patterns and cryptic diversity within species-rich genera [4]. However, genomic resources for many lineages remain limited, hindering a comprehensive understanding of their evolutionary history.
South American dwarf cichlids encompass 11 genera, including Apistogramma Regan 1913, Dicrossus Steindachner 1875, Nannacara Regan 1905, Laetacara Kullander 1986, and Microgeophagus Meulengracht-Madsen 1968. Apistogramma, the predominant genus, comprises over 100 species. Six representative species are particularly significant for phylogenetic and ecological studies: A. agassizii (Steindachner, 1875) (widely distributed across the Amazon, serving as a model for speciation); A. trifasciata (Eigenmann & Kennedy, 1903) (noted for its distinct sexual dimorphism); A. borellii (Regan, 1906) (exhibiting high tolerance for lower subtropical temperatures); and A. cacatuoides Hoedeman 1951 (frequently used in behavioral studies regarding harem-based social structures). A. nijsseni Kullander 1979 and A. macmasteri Kullander 1979 are also included, which represent distinct lineages within the Orinoco and Amazon drainages, respectively. Distributed across approximately two-thirds of South America, they primarily occupy the Amazon, Orinoco, and Paraná River basins, adapting to water conditions of pH 4.5–6.8 and temperature 26–28 °C. In contrast, West African dwarf cichlids, or West African kribs, constitute the genera Pelvicachromis Thys van den Audenaerde 1968 and Nanochromis Pellegrin 1904, which encompass a dozen varieties. Among them, Pelvicachromis pulcher (Boulenger 1901) is the most common and affordable species in the aquarium industry. High-end species commanding premium prices include Pelvicachromis taeniatus (Boulenger 1901), Nanochromis nudiceps (Boulenger 1899), and Nanochromis transvestitus Stewart & Roberts 1984. These demanding species require stringent environmental conditions and present considerable husbandry challenges for aquarists [5,6].
The fish exhibit mitochondrial DNA (mtDNA) sequences that are nearly identical to those of other vertebrates [7], containing no intronic sequences, except for a small segment related to mtDNA replication and transcription. Owing to their characteristics, including highly conserved coding regions, maternal inheritance, rapid evolutionary rate, and high copy number [8], mitochondrial genomes are widely applied in population genetics, biogeographical studies, and phylogeography [9,10]. Unlike shorter single-gene fragments, such as cytochrome c oxidase subunit I (coxl) and 12S ribosomal RNA (12S rRNA), which may reduce phylogenetic confidence due to uneven evolutionary rates and limited sequence length, complete mitochondrial genomes enable a more comprehensive phylogenetic reconstruction.
Neotropical cichlid fish exhibit extraordinary diversity; however, their morphological similarities and polymorphisms pose taxonomic challenges. This is particularly evident in the genus Apistogramma, which comprises more than 100 species with complex distribution patterns and unresolved chromosomal evolution mechanisms. South American Apistogramma species present substantial identification difficulties, necessitating the clarification of species boundaries, evolutionary relationships, and conservation status. Notably, female mate choice may drive sympatric speciation in this group. To address this, Quérouil et al. [11] developed highly polymorphic microsatellite markers (screening 7567 candidate loci to establish 13 polymorphic markers), which were validated across 47 specimens of 9 species for evolutionary genetics and conservation studies. Cytogenetic analyses by Wagner et al. [12] revealed that this genus possesses unique karyotypic features, including reduced chromosome numbers and an increased number of acrocentric chromosomes. Significant karyotype reorganization (involving B chromosomes and rDNA dynamics) suggests that chromosomal changes may act as barriers to post-zygotic isolation in sympatric species. Tougard et al. [13] analyzed 31 species using mitochondrial and nuclear markers, confirming monophyly, with four clades corresponding to three morphological lineages. Molecular dating has traced its origin to the Eocene (~50 mya), with differentiation driven by marine incursions. Although the Quaternary glaciation triggered speciation events, the genus maintains a persistently low and constant diversification rate.
Despite the ecological and commercial importance of Apistogramma, genomic resources for this genus remain notably deficient. While none of the species studied here are currently listed in the CITES Appendices, and most are categorized as ‘Least Concern’ (LC) or ‘Not Evaluated’ (NE) by the IUCN, their wild populations face mounting pressure from habitat degradation and over-collection for the aquarium trade [1,2]. Consequently, there is an urgent need for high-resolution molecular markers to monitor these genetic resources. Previous mitogenomic research has been largely restricted to isolated species descriptions, which often suffer from inadequate taxon sampling and low phylogenetic reliability. This fragmentation has hindered systematic comparative analyses of genomic architecture, such as nucleotide bias, codon usage, and potential gene rearrangement events. Leveraging the cost-effectiveness and efficiency of high-throughput sequencing (HTS) [14,15,16], this study performs a comprehensive genome survey—a recognized prerequisite for molecular research in non-model species [17]—to establish a robust phylogenomic framework and resolve the evolutionary history of Apistogramma.
In this study, we sequenced and characterized the complete mitochondrial genomes of six Apistogramma species (A. agassizii (Steindachner, 1875); A. allpahuayo Römer et al., 2012; A. baenschi Römer et al., 2004; A. nijsseni Kullander, 1979; A. resticulosa Kullander, 1980; and A. cacatuoides Hoedeman, 1951). Unlike previous studies that predominantly relied on short, single-gene fragments—which often lack sufficient phylogenetic signal to resolve the rapid radiation and cryptic diversity within Apistogramma—our mitogenomic approach provides an unprecedented level of resolution. By analyzing genome-wide structural features and utilizing multi-gene-concatenated datasets, we not only screened for high-resolution molecular markers for rapid species identification but also addressed long-standing taxonomic uncertainties and clarified the deep evolutionary relationships within the genus. This work establishes a robust molecular framework that facilitates a more accurate understanding of the diversification history of these Neotropical cichlids.

2. Materials and Methods

2.1. Sample Collection, Preservation, and Genomic DNA Extraction

All specimens were acquired as live individuals through the commercial ornamental fish trade from the Fangcun Flower, Bird, Fish, and Insect Market (23.06° N, 113.20° E), Liwan District, Guangzhou, China. Upon acquisition, the specimens were morphologically identified following the diagnostic keys. To ensure taxonomic accuracy, the identity of each species was further validated through subsequent mitogenomic sequencing and phylogenetic analysis in this study. The fish were anesthetized using an aquatic anesthetic (MS-222; tricaine mesylate) and immediately dissected. Dorsal muscle tissues were aseptically collected, flash-frozen in liquid nitrogen, transported to the laboratory, and stored at −80 °C until DNA extraction.
The specimen voucher numbers (stored at the Nanjing Forestry University Zoology Laboratory) and corresponding sequencing IDs for the five species sequenced de novo in this study are as follows: A. resticulosa (GDGZFC-Y36, PV692065), A. nijsseni (GDGZFC-Y37, PV739306), A. baenschi (GDGZFC-Y38, PV741065), A. agassizii (GDGZFC-Y39, PV747861), and A. allpahuayo (GDGZFC-S10, PV872131). Additionally, the complete mitochondrial genome sequence of A. cacatuoides was retrieved from the National Center for Biotechnology Information (NCBI) GenBank database (Accession No. KR150874) to facilitate comparative mitogenomic and phylogenetic analyses. For the five newly sampled species, total genomic DNA was extracted from approximately 30 mg of muscle tissue using the TIANamp Marine Animal DNA Kit (Tiangen Biotech, Beijing, China). The extraction followed the manufacturer’s optimized protocol for fibrous tissues, involving overnight lysis with proteinase K at 56 °C followed by purification via silica gel columns. The concentration and purity of the extracted DNA were quantified using a NanoDrop 2000 spectrophotometer (Thermo Scientific, Wilmington, DE, USA). Only samples with a ratio between 1.8 and 2.0 and a concentration exceeding 50 ng/μL were used for library construction. DNA integrity was further confirmed by 1% agarose gel electrophoresis, ensuring a sharp band of high-molecular-weight DNA without significant degradation [18].
Species were identified through a combination of morphological and molecular analyses. Morphological identification was performed by examining diagnostic characteristics, including caudal fin shape (rounded, truncate, lanceolate, or lyrate); the extension of dorsal fin spine membranes; and specific color patterns such as vertical stripes, lateral bands, and dots. A dichotomous key (see Table S1) was constructed and used according to published taxonomic revisions. For molecular validation, fragments of rrnL, rrnS, cox1, and cytb were sequenced. However, due to the paucity of species-specific sequences for Apistogramma in the NCBI database, molecular data were primarily utilized to confirm genus-level placement, with morphological characters serving as the primary diagnostic tool for species-level assignment.

2.2. Mitogenome Sequencing

DNA samples meeting quality standards were submitted to Shanghai Personal Biotechnology Co., Ltd. (Shanghai, China) for high-throughput sequencing. Qualified DNA samples were randomly fragmented, and paired-end libraries with an insert size of 500 bp were constructed using the Novogene NGS DNA Library Prep Kit (Novogene, Beijing, China). Following the manufacturer’s protocol, libraries were subjected to 150 bp paired-end sequencing on the Illumina NovaSeq platform (Illumina, San Diego, CA, USA) at Novogene (Beijing, China). Raw sequences were subjected to quality trimming and filtering with Trimmomatic v0.39 (http://www.usadellab.org/cms/index.php?page=trimmomatic, accessed on 9 April 2026) to generate high-quality clean data.

2.3. Mitogenome Assembly and Annotation

Clean sequencing data were assembled using GetOrganelle v1.7.1a (https://github.com/Kinggerm/GetOrganelle, accessed on 9 April 2026) [19] to generate contigs and scaffolds. The assembled sequences were aligned against the sequences in the NCBI NT database (accessed on 9 April 2026) using BLASTn v2.13.0, with mitochondrial sequences extracted from each assembly. Gap closure was performed on contigs using GapFiller v2.1.1 (https://sourceforge.net/projects/gapfiller/, accessed on 9 April 2026), followed by sequence polishing with Pilon v1.23 to obtain the final mitochondrial genome sequences. Structural and functional annotations were performed using the web application MitoFish (https://mitofish.aori.u-tokyo.ac.jp/, accessed on 9 April 2026) [20].

2.4. Mitogenome Sequence Analysis

The mitochondrial genome sequence of A. cacatuoides was retrieved from GenBank (KR150874). For gene-specific analyses, protein-coding gene (PCG) alignment was performed. Briefly, 13 PCGs from six Apistogramma species were aligned using MAFFT 7.505 [21]. For codon usage analysis, relative synonymous codon usage (RSCU) was calculated for each amino acid using PhyloSuite 1.2.3 [22]. For selection pressure assessment, synonymous (Ks) and nonsynonymous (Ka) substitution rates were computed using KaKs_calculator 2.0 [23], applying the vertebrate mitochondrial genetic code. For comparative genomics analysis, DnaSP 6 [24] and MEGA X [25] were employed for polymorphism analysis of the 13 PCGs and 2 rRNA genes, with the variables analyzed comprising total sites, conserved sites, variable sites, singleton variable sites, parsimony-informative sites, and proportion of variable sites. Genetic distances (Dxy) and their standard errors (SEs) were calculated using the Kimura 2-parameter (K2P) model in MEGA X [25], with 1000 bootstrap replicates to estimate the SE for each pairwise comparison.

2.5. Phylogenetic Analysis

For concatenated dataset construction, the 13 PCGs were aligned individually and then concatenated using MEGA X [20]. The mitochondrial genome sequences of 42 New World cichlid species were retrieved from GenBank and combined with those of five newly sequenced and annotated Apistogramma species (Table 1), which were strategically selected based on a combination of taxonomic breadth, phylogenetic relevance, and data integrity. Specifically, we included representatives from all major tribes within the subfamily Cichlinae (e.g., Geophagini, Cichlasomatini, Heroini, and Astronotini) to ensure broad evolutionary coverage of Neotropical lineages. To enhance the resolution of intergenic relationships, priority was given to all available complete mitogenomes of closely related ‘Geophagines’ groups. Furthermore, a rigorous quality filter was applied, selecting only high-quality mitochondrial genomes that contained a complete set of 13 PCGs, thereby ensuring the reliability of the subsequent phylogenomic reconstruction. We employed the midpoint-rooting method to polarize the phylogeny, as this approach is widely used when a clear, closely related outgroup is either unavailable or may introduce long-branch attraction (LBA) artifacts [26]. The stability of this rooting was further verified by its consistency with previous higher-level molecular studies of New World cichlids [27,28]
The PCGs of all 47 New World cichlids were aligned using MAFFT 7.505 and optimized using MACSE. The optimized data were processed using Gblocks [29] to remove unreliable sequences. Gene concatenation was performed using the built-in pipeline of PhyloSuite 1.2.3 [22], and the optimal nucleotide substitution model was estimated using ModelFinder 2.2.0 [30]. The best-fit substitution models for each partition were selected using ModelFinder 2.2.0 [30] based on the Bayesian Information Criterion (BIC). For Bayesian inference (BI), the selected models were GTR+F+I+G4 for atp6, atp8, cox1–3, cytb, nad1–3, nad4L, and nad5; GTR+F+I+G4 for nad4; and HKY+F+I+G4 for nad6. For maximum likelihood (ML) analysis, the models included TVM+F+I+G4 for most PCGs and K3Pu+F+I+G4 for nad6. Evolutionary relationships of New World cichlids were reconstructed using both ML and BI methods; the ML analysis was executed in IQ-TREE 2.2.0 [31], with 50,000 bootstrap replicates (Ultrafast Bootstrap). The branch support was evaluated using bootstrap probability (BP). The BI analysis [32] employed two independent Markov Chain Monte Carlo approaches set to run a total of 100,000,000 generations. Sampling was performed once every 1000 generations. The first 25% of the samples were discarded as aging samples. The posterior probability (PP) was calculated according to the remaining samples, and the Bayesian PP value of each node was calculated. The final phylogenetic trees (ML and BI) were visualized with iTOL v6 [33].

3. Results

3.1. Mitogenome Characteristics

The mitochondrial genomes of the six Apistogramma species have a double-stranded circular structure, encoding 37 genes: 13 PCGs, 2 rRNAs, and 22 tRNAs. The genome lengths range from 16,767 to 17,439 bp, with A. allpahuayo possessing the largest genome and A. baenschi having the smallest (Table 1). These values are consistent with the mitogenome sizes previously reported for other Neotropical cichlids. Comparative genomic arrangement analysis revealed a highly conserved gene order across the 47 New World cichlid mitochondrial genomes. Nucleotide composition analysis (Table 1) demonstrated a universal AT bias across all 47 genomes; Bujurquina mariae (Eigenmann 1922) showed the highest AT content (58.8%), while Crenicichla regani (Ploeg 1989) (incomplete genome) has the lowest (51.6%). Base composition heterogeneity assessed via nucleotide skew indices (AT-skew and GC-skew) revealed positive AT-skew values (indicating higher A than T) in all species except Andinoacara rivulatus (Günther 1860), A. allpahuayo, Dicrossus filamentosus (Ladiges 1958), and Taeniacara candidi Myers 1935. Negative GC-skew values (indicating higher C than G) were observed in all species except A. allpahuayo.

3.2. PCG Analysis

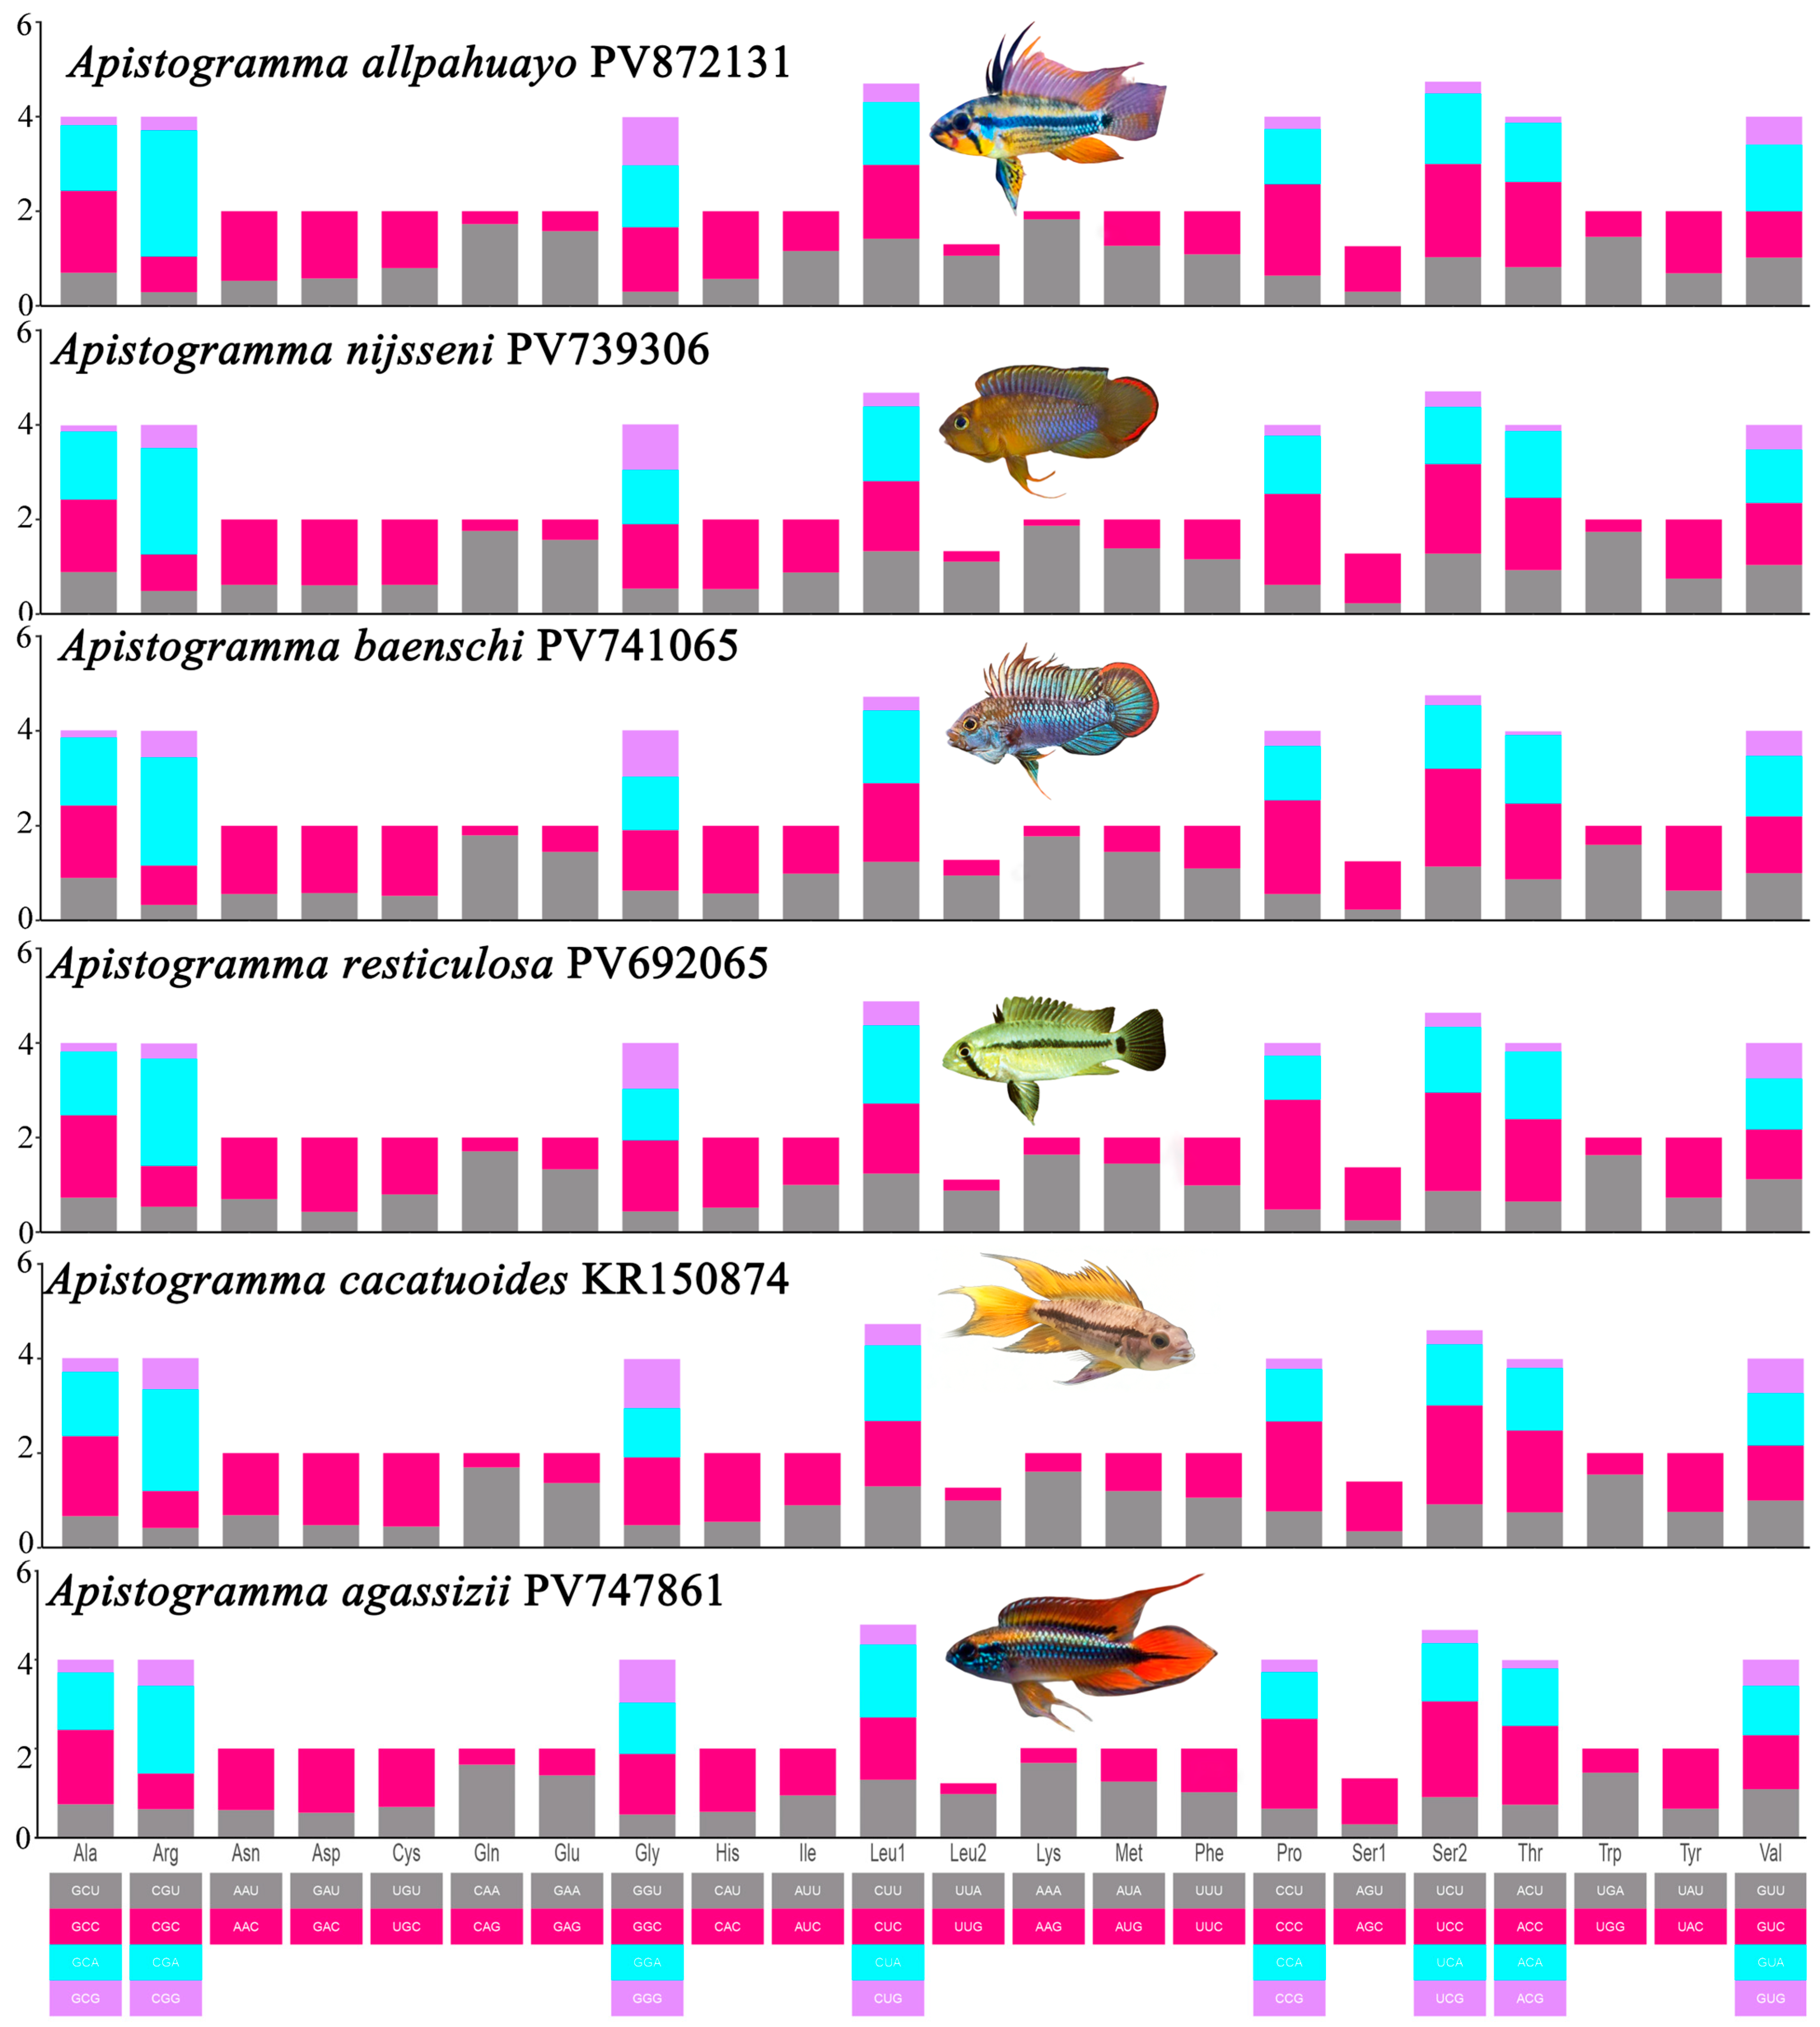
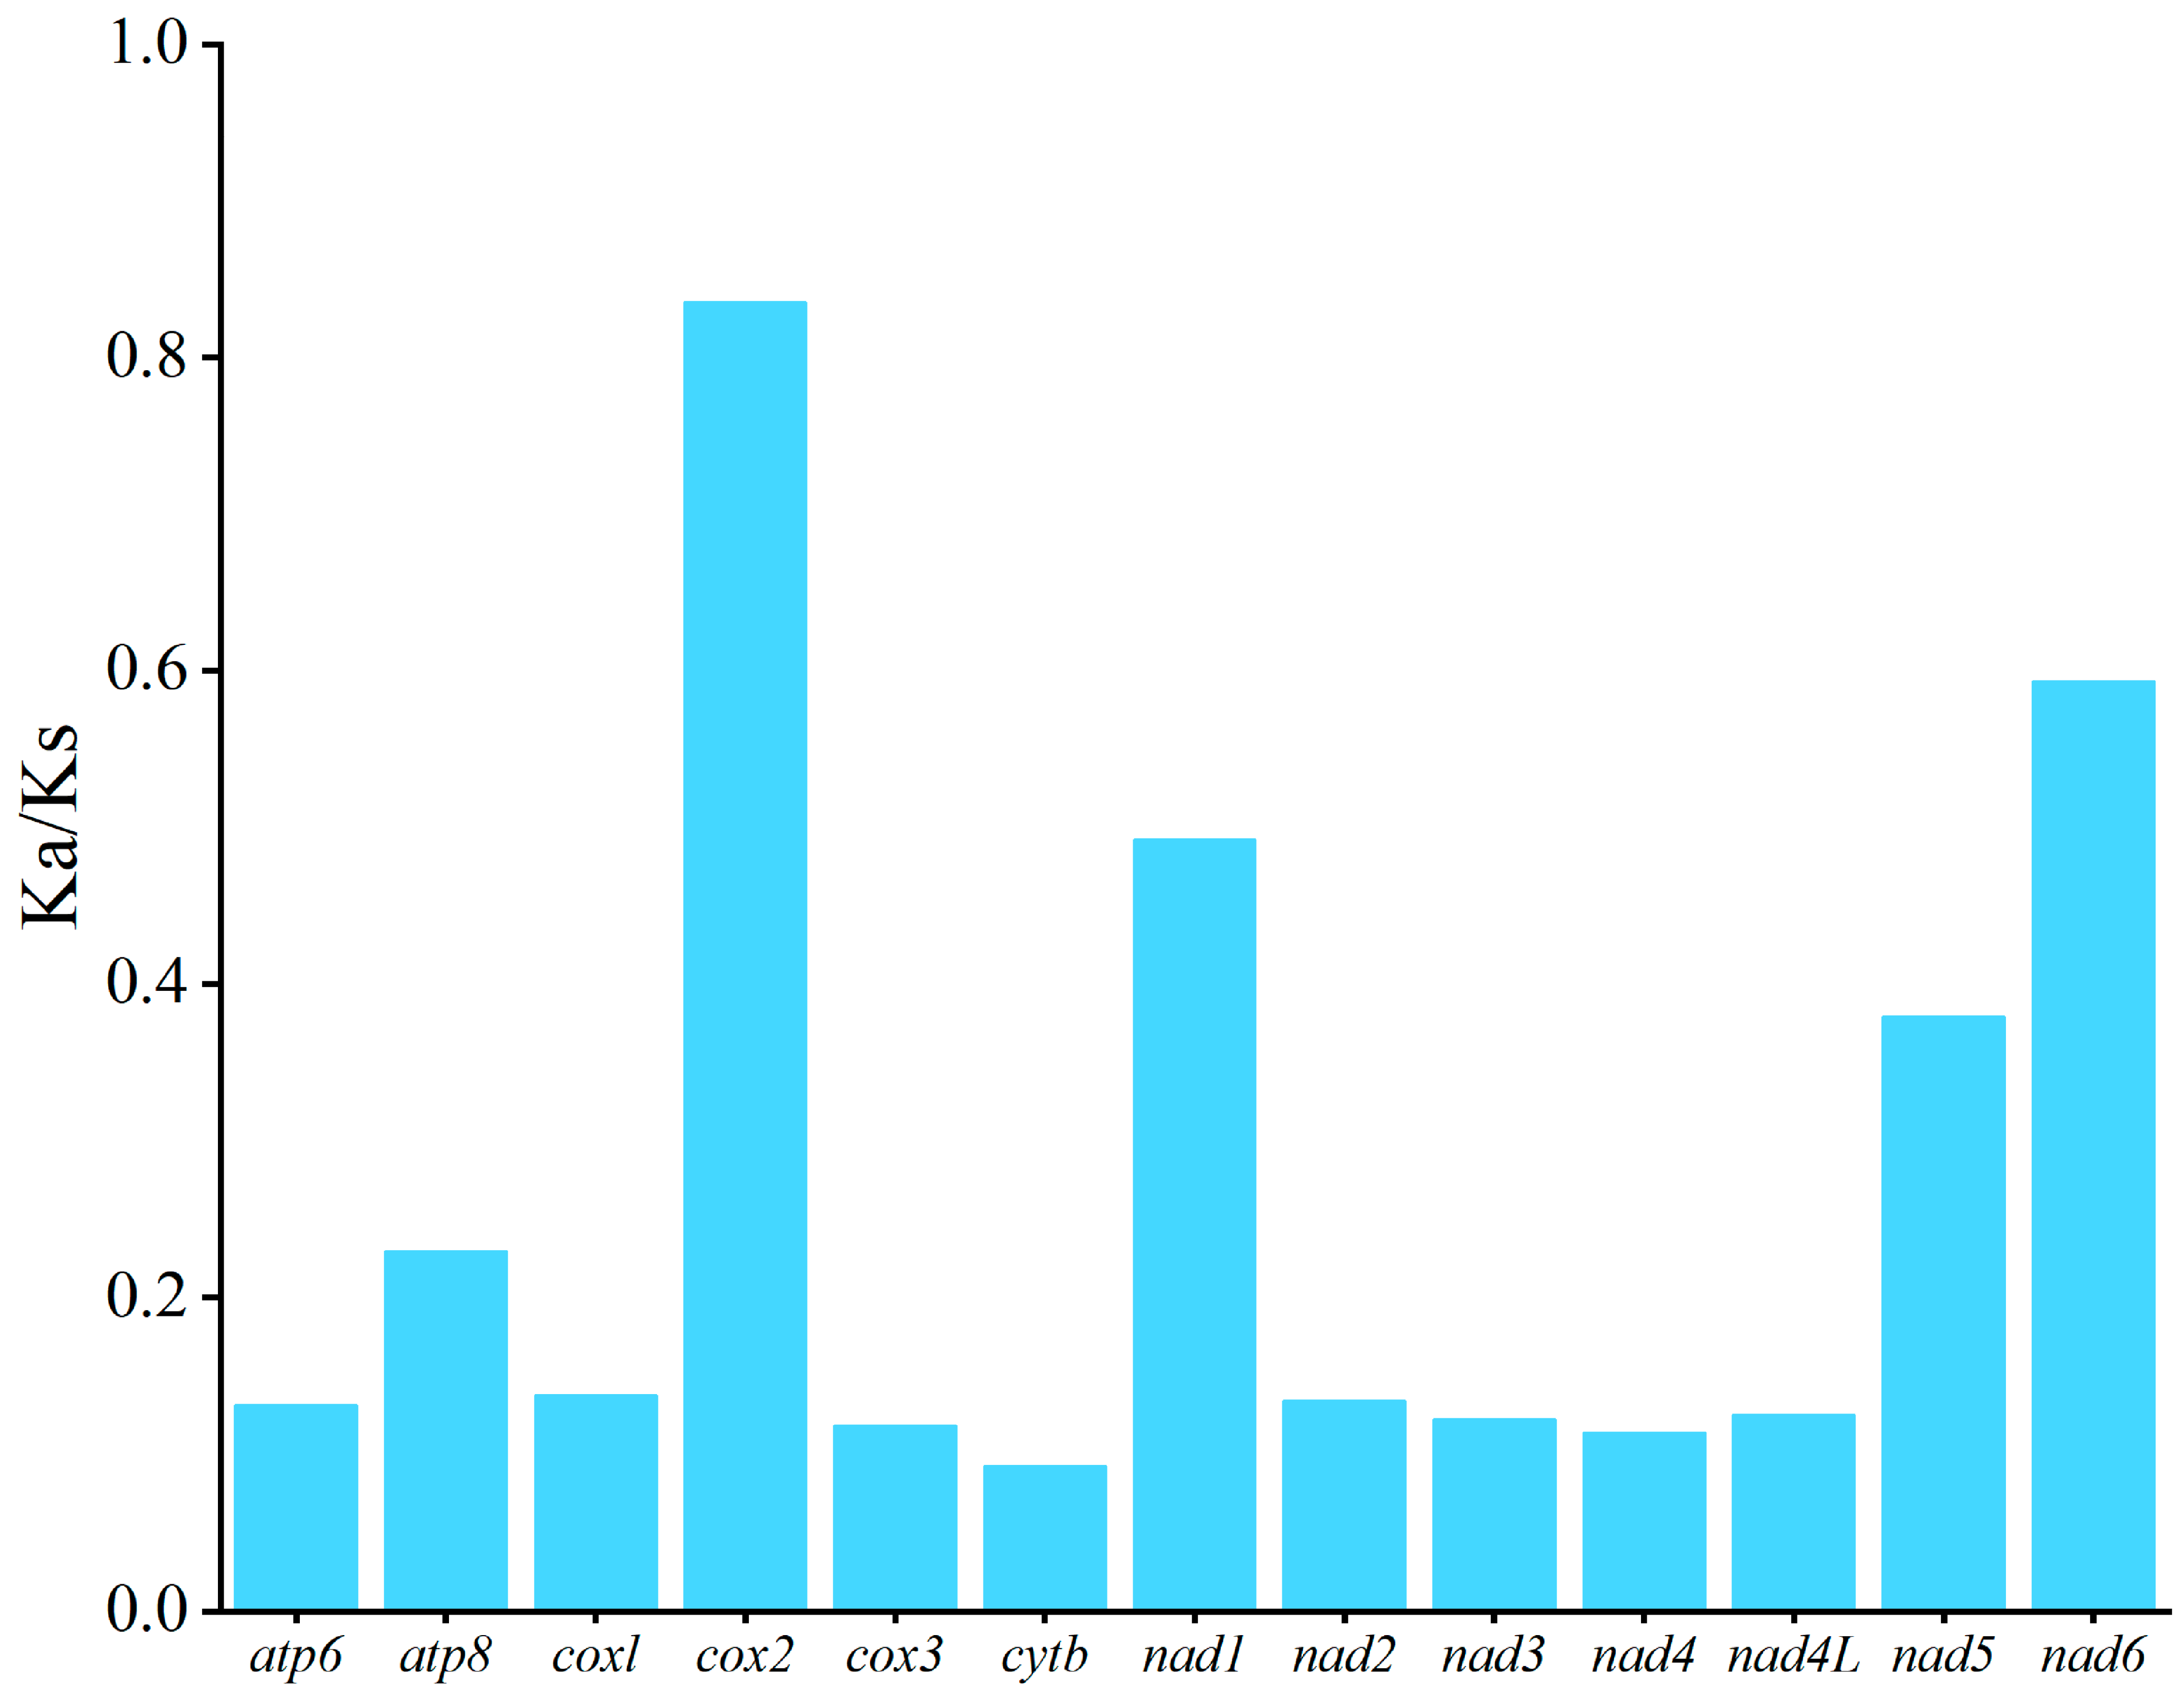
The RSCU analysis of the six Apistogramma mitochondrial genomes (Figure 1) revealed that all amino acids are encoded by two or more synonymous codons. Among the 60 vertebrate genetic codons (excluding stop codons), 24 high-frequency codons (RSCU > 1.00 in all six species) were identified. These codons exhibited a strong bias toward A or C at the third codon position: 12 codons ended with A, 11 codons ended with C, and only 1 codon ended with U. To assess evolutionary conservation across Apistogramma species, evolutionary rates of PCGs were evaluated using the Ka/Ks ratio (Figure 2). All 13 PCGs showed Ka/Ks < 1, indicating pervasive purifying selection. The evolutionary rates varied among the genes, with cytb exhibiting the strongest purifying selection (Ka/Ks = 0.091). Notably, cox2 displayed a relatively high Ka/Ks ratio (0.934) compared to other PCGs. This elevated value suggests a relaxation of selective pressure or potential adaptive evolution within specific lineages of Apistogramma, a phenomenon that has been occasionally observed in rapidly diversifying cichlids. However, all genes remain under negative selection overall, maintaining the functional integrity of the mitochondrial respiratory chain.

3.3. Molecular Marker Screening and Evaluation

The nucleotide polymorphism analysis of mitochondrial genes across the six Apistogramma species revealed significant variations in gene conservation (Table 2). rrnS exhibited the lowest conservation (nucleotide variation rate: 19.50%), being the only gene with variation below 20.00%, and nad6 showed the highest number of polymorphisms (variation rate: 50.28%). Sequence characteristics further revealed candidate molecular markers: nad5 had the longest sequence (1848 bp), followed by rrnL (1733 bp), cox1 (1573 bp), and nad4 (1381 bp). The top three genes by variable sites included nad5 (620 sites), cox1 (526 sites), and nad4 (450 sites). Given their high variation proportions, it was inferred that nad5, cox1, and nad4 would be ideal molecular markers for the rapid identification of six Apistogramma species.

3.4. Phylogenetic Relationships

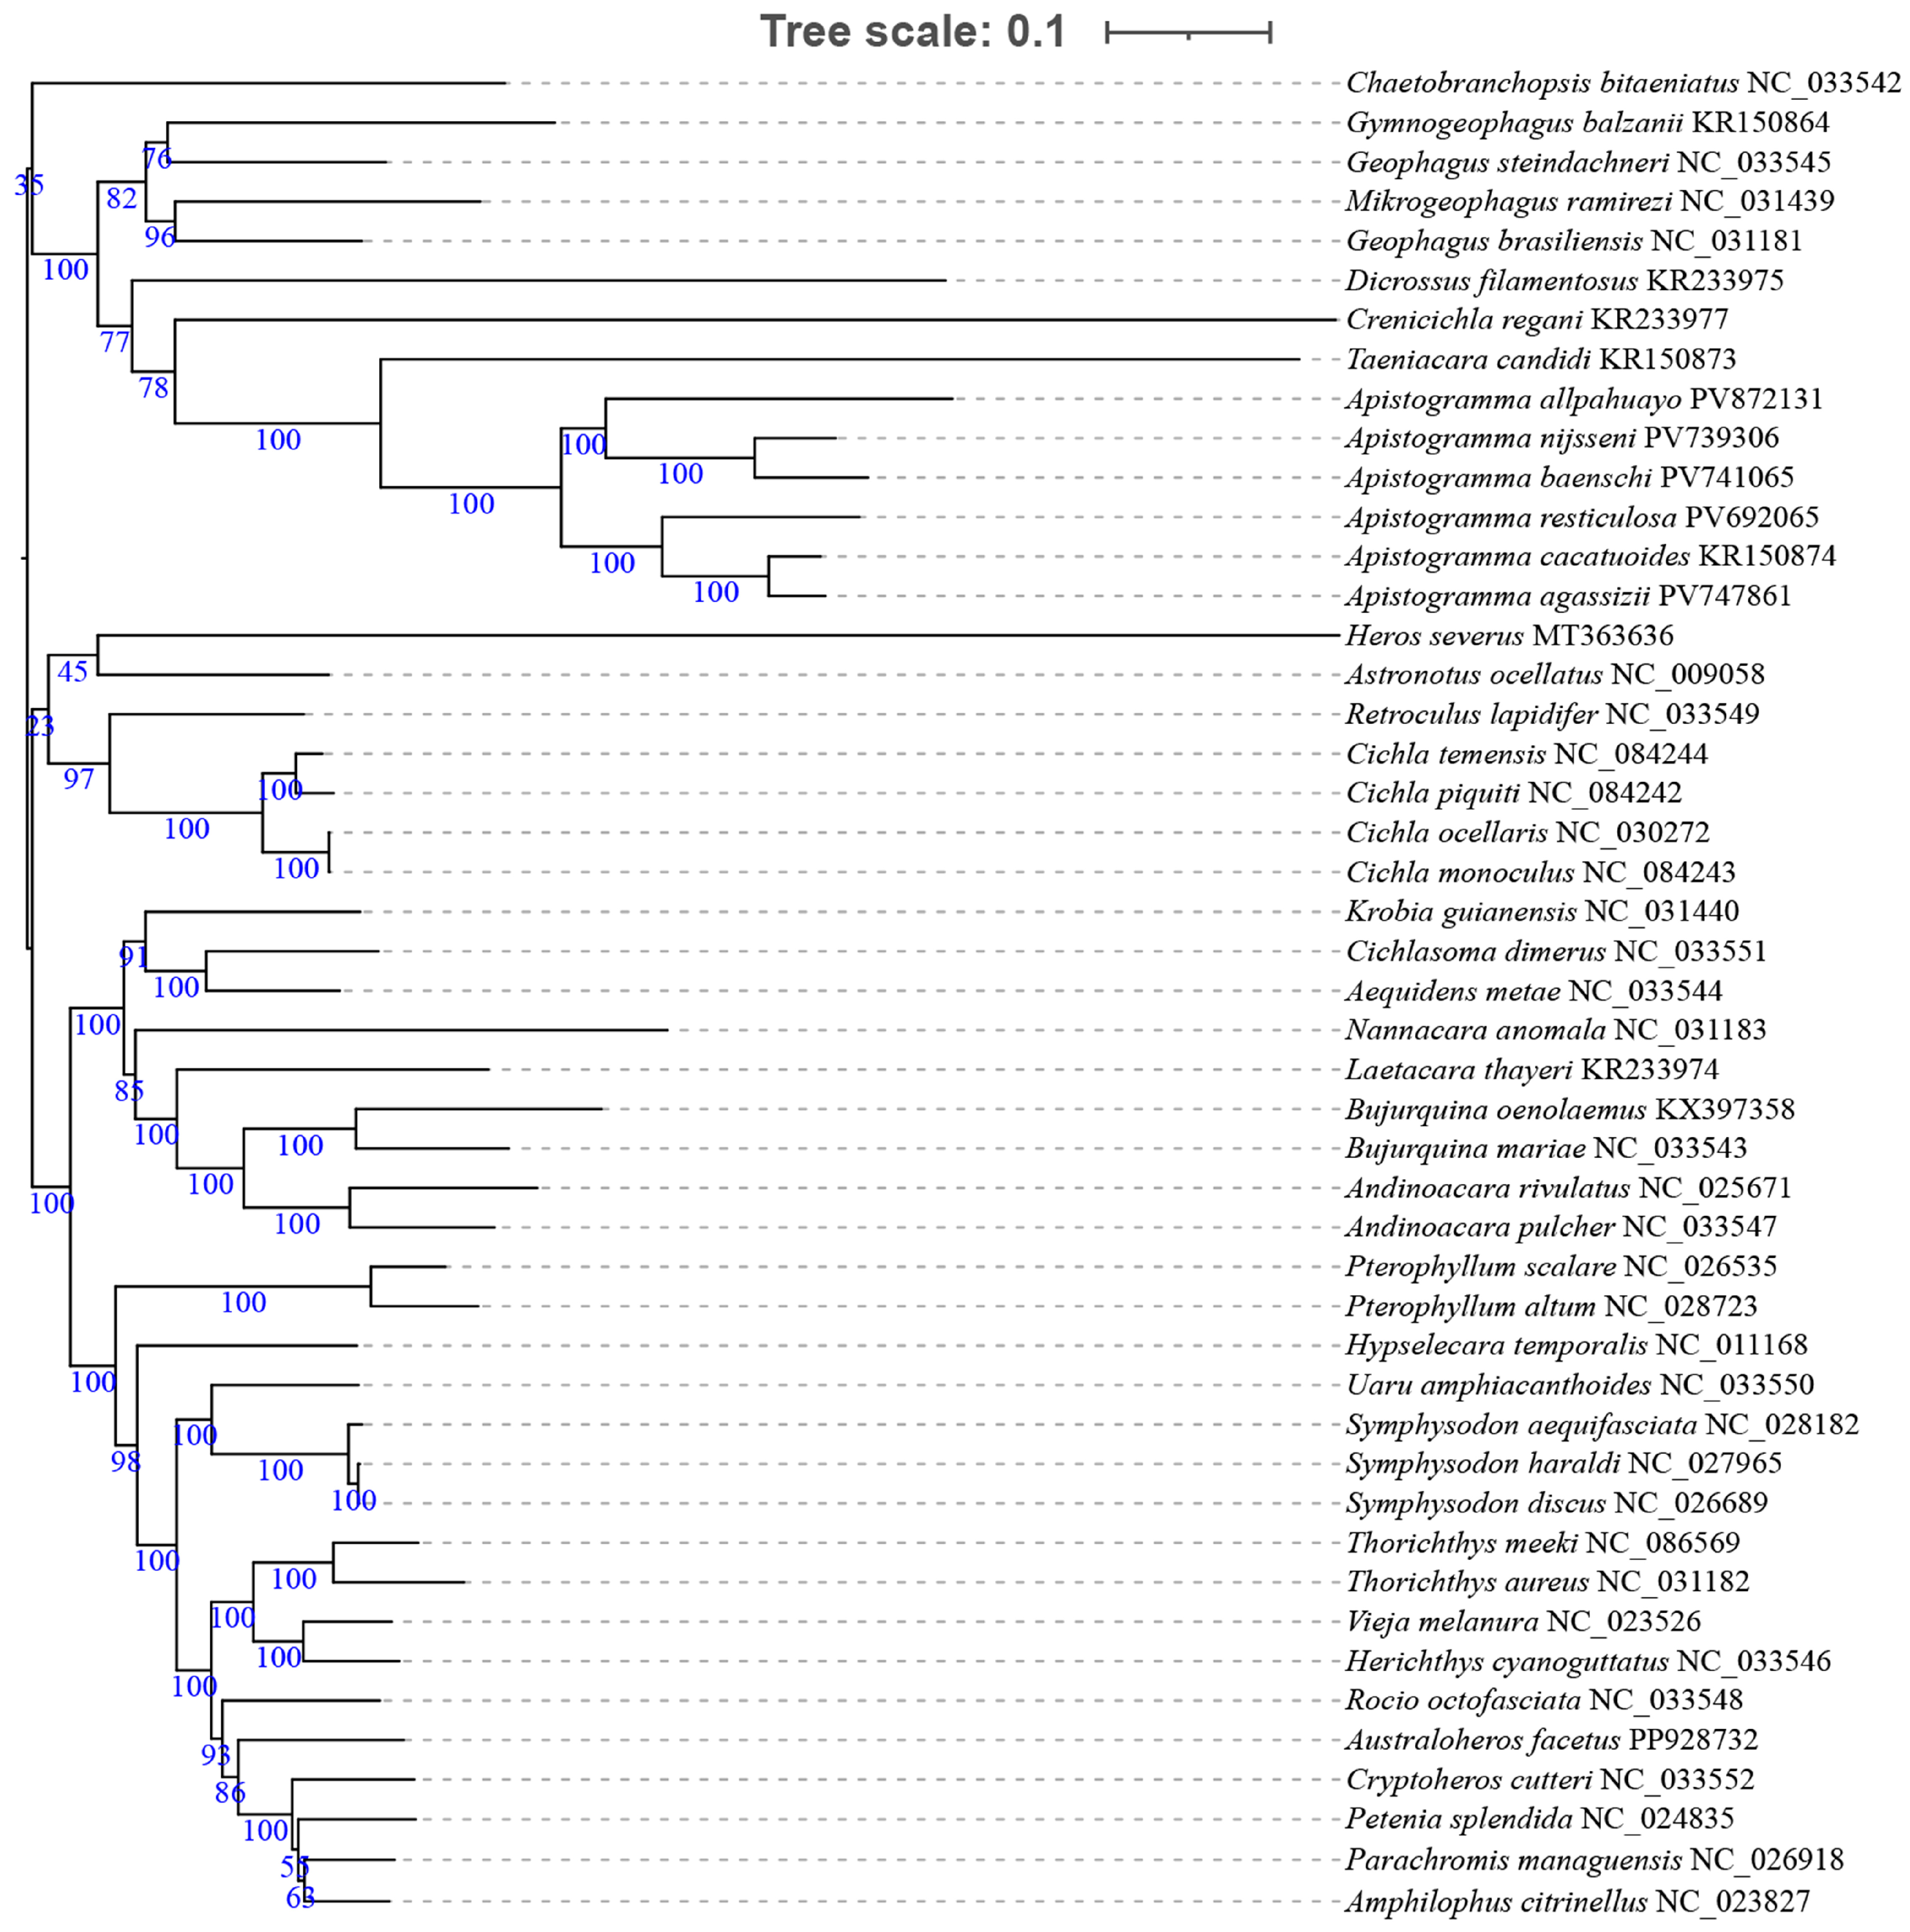
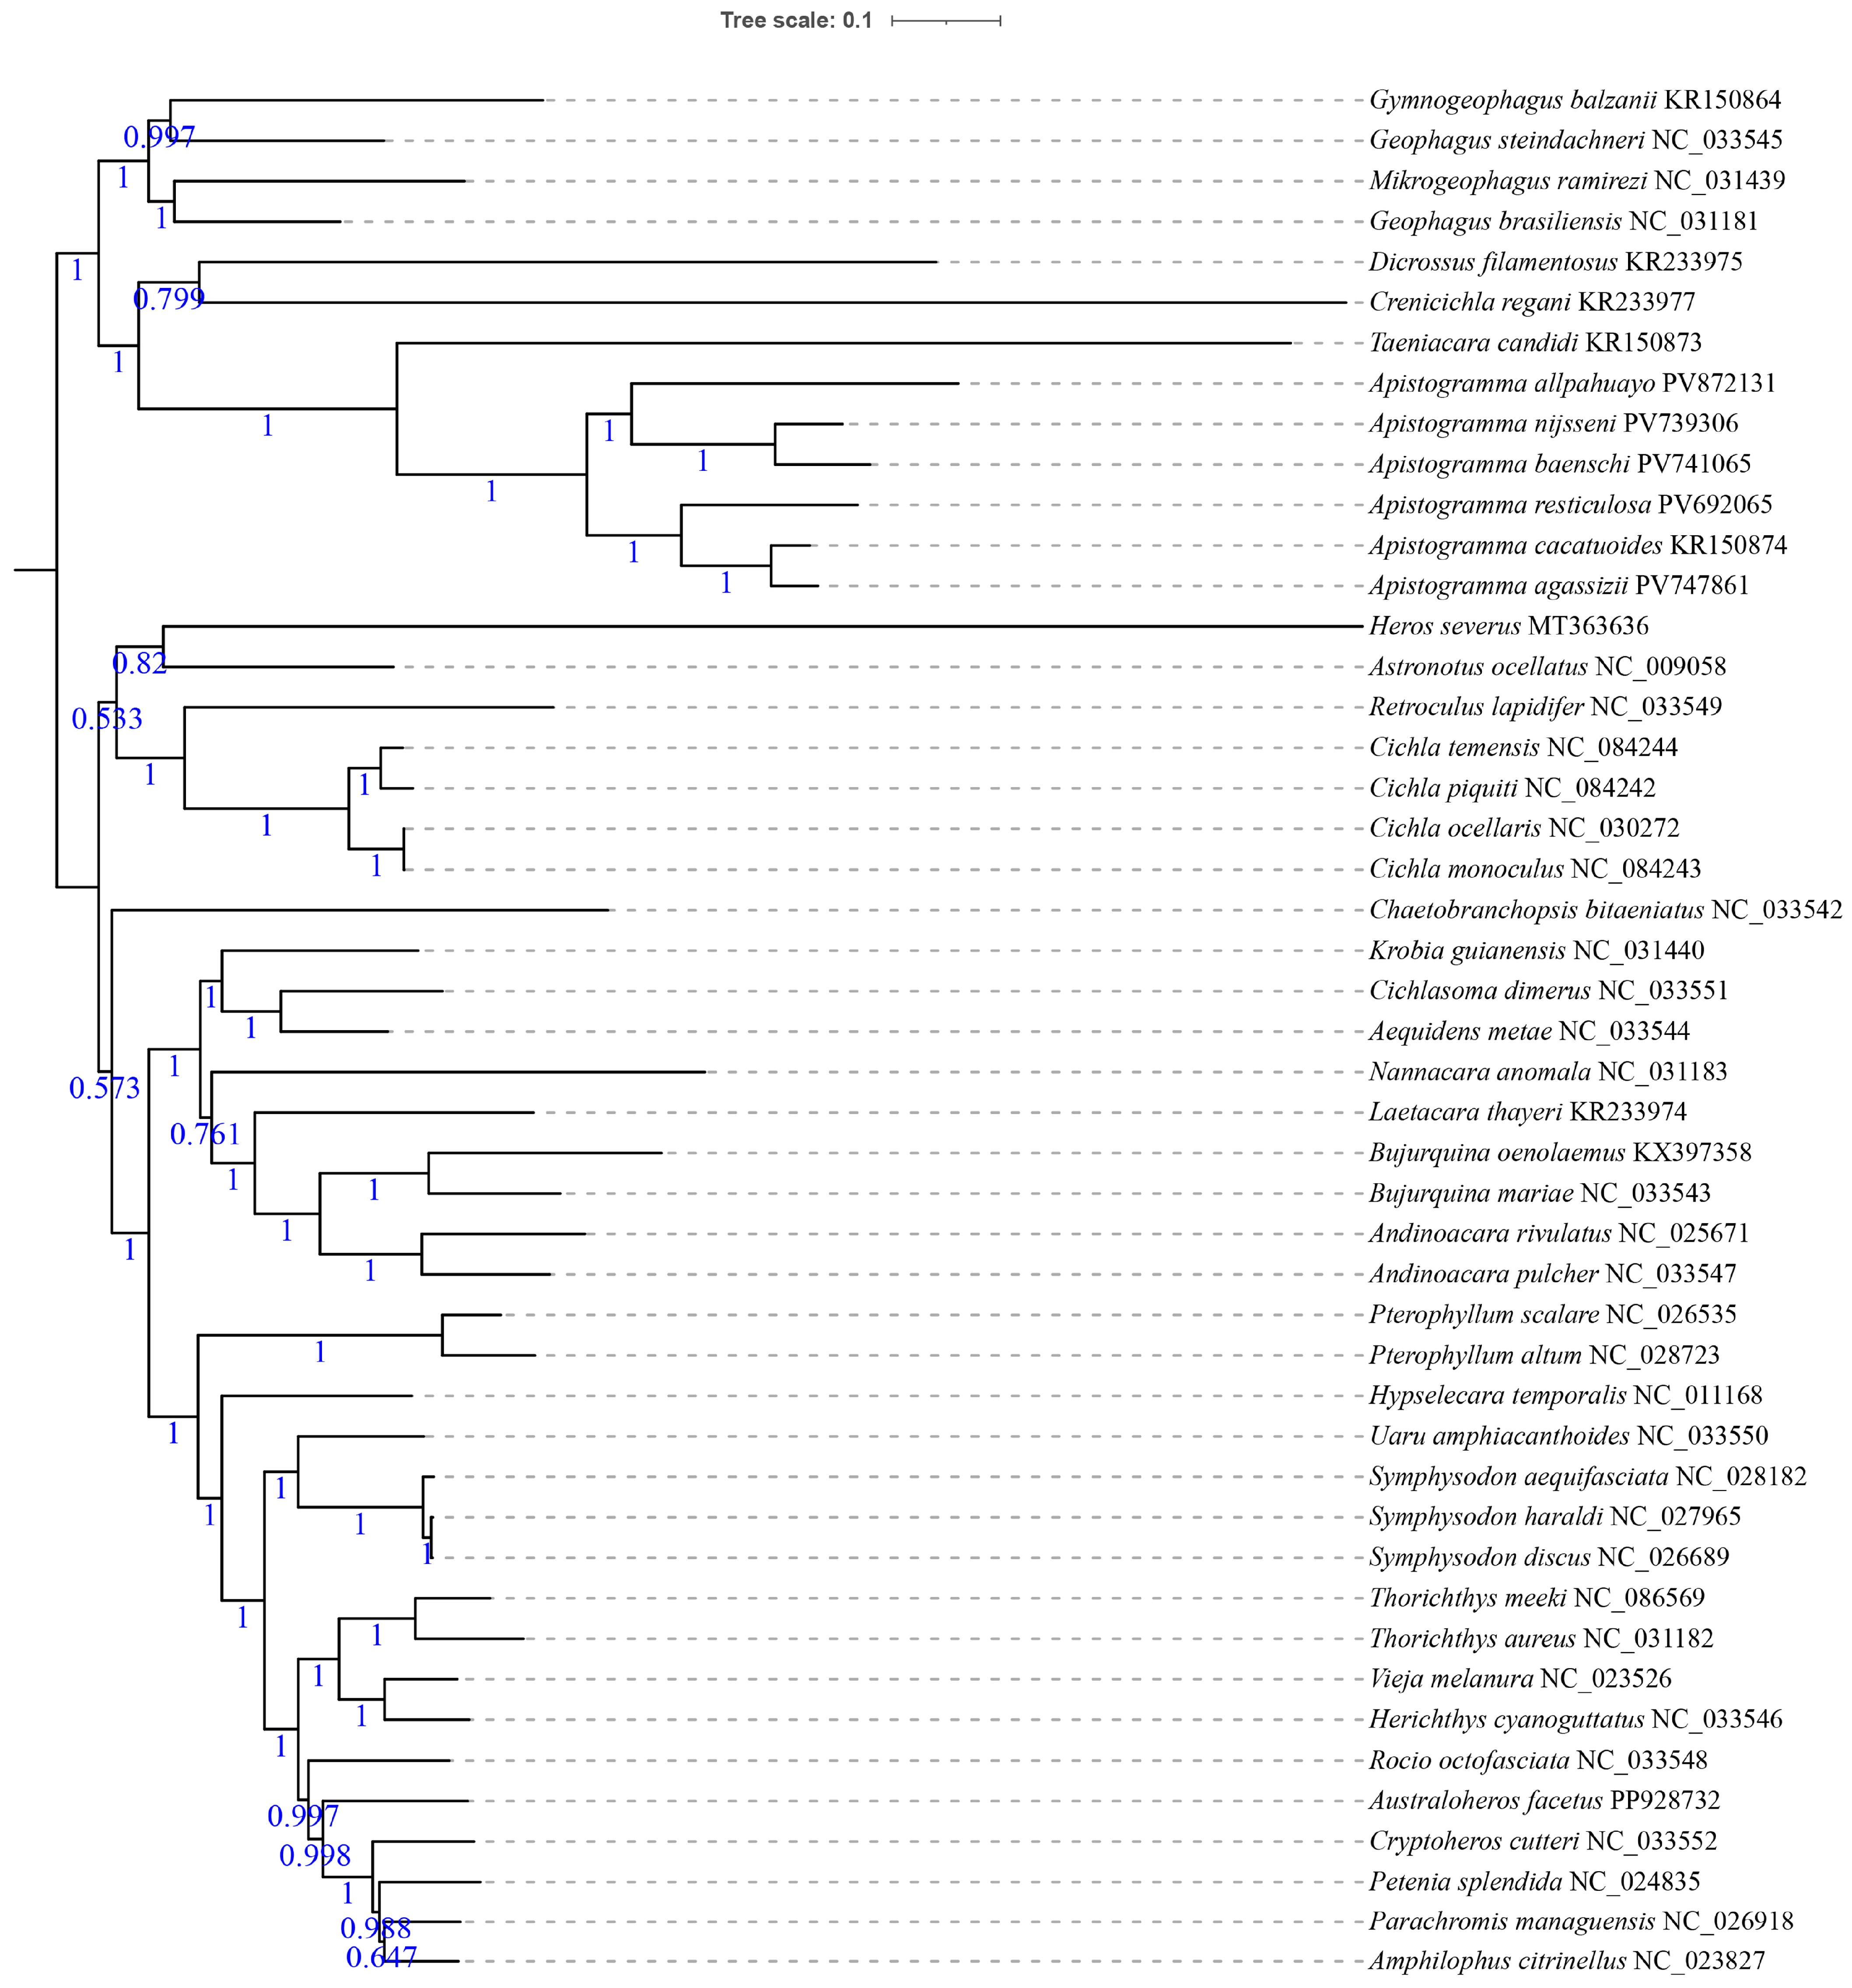
Phylogenetic trees of New World cichlids were reconstructed based on the concatenated dataset of 13 PCGs using both BI and ML methods. The two topologies exhibited broad congruence (Figure 3 and Figure 4), with discordance observed only during the placement of Chaetobranchopsis bitaeniatus (Steindachner 1875). In our mitogenomic analysis, most major groups within the New World cichlids were recovered as non-monophyletic; specifically, both Cichlasomatinae and Geophaginae failed to form monophyletic clades in both BI and ML trees. This is evidenced by the placement of Heros severus, which was recovered outside the primary Cichlasomatinae lineage, and the division of Geophaginae into two distinct major clades. Similarly, Cichlinae and Astronotinae were also confirmed as non-monophyletic groups, highlighting the complex evolutionary history and potential mitonuclear discordance within Neotropical cichlids.
Among eight multi-species genera (≥2 species), only Geophagus Heckel 1840 was non-monophyletic. Monophyly was confirmed in Apistogramma, Cichla Bloch & Schneider 1801, Andinoacara Musilová, Říčan & Novák 2009, Bujurquina Kullander 1986, Pterophyllum Heckel 1840, Symphysodon Heckel 1840, and Thorichthys Meek 1904. Within Apistogramma (strongly monophyletic: BS = 100%, PP = 1), A. nijsseni and A. baenschi formed a clade, while A. cacatuoides and A. agassizii formed another clade, with the following observed relationships: (A. allpahuayo + (A. nijsseni + A. baenschi)) + (A. resticulosa + (A. cacatuoides + A. agassizii)).

3.5. Genetic Distance Analysis

Pairwise genetic distances (Dxy ± SE) based on the 13 concatenated PCGs revealed significant divergence among the six Apistogramma species (Table 3). The genetic distances ranged from 0.059 ± 0.002 (between A. cacatuoides and A. agassizii) to 0.233 ± 0.005 (between A. allpahuayo and A. agassizii). The observed genetic distances are highly congruent with the recovered phylogenetic topologies. The minimum distance (0.059) was identified between A. cacatuoides and A. agassizii, which formed a well-supported sister clade in our trees, suggesting a relatively recent speciation event. In contrast, A. allpahuayo exhibited consistently high divergence values (all > 0.219) when compared to the other five congeners. This high level of genetic differentiation (exceeding 20%) not only aligns with its basal/distinct position in the phylogenetic trees but also provides strong molecular evidence for its status as a distinct species, potentially representing a deeply diverged lineage within the genus.

4. Discussion

A comparative analysis of the mitogenomes of six Apistogramma species confirmed a conserved gene composition and arrangement consistent with those in most teleost fishes while also revealing nuanced features of their genomic evolutionary dynamics [34]. All six Apistogramma species displayed a moderate AT bias (51.6–58.8%), which is highly consistent with the typical range reported for teleost mitochondrial genomes (50–60%). This compositional bias is primarily attributed to strand-specific mutational pressure occurring during the asymmetric replication of mitochondrial DNA [35]. To ensure a robust estimation of evolutionary pressure, Ka/Ks ratios were calculated by accounting for common sequence-related biases following the methodological framework described by Del Amparo et al. [36]. Our results indicated strong purifying selection across all PCGs, underscoring the functional constraint of mitochondrial genes as core components of cellular energy production [37]. This pattern aligns with the “energetic functional constraint” hypothesis observed across teleost fishes, which suggests that the mitochondrial genome is under stringent selection to maintain high metabolic efficiency [38]. Notably, selective pressure varied among genes: cytb, nad4, and cox3 exhibited very low Ka/Ks values. The extreme conservation of these genes likely reflects their indispensable roles in the assembly and electron-transfer efficiency of OXPHOS complexes (Complex III, IV, and I, respectively). Mutations in these core subunits could lead to mitochondrial dysfunction and significant fitness costs, a phenomenon also documented in other specialized fish groups like Salmonids, where maintaining oxidative capacity is vital for survival [39]. Compared to the adaptive evolution often identified in migratory or cold-adapted fishes (e.g., Salmonidae), the relatively uniform and low Ka/Ks ratios in Apistogramma suggest an evolutionary strategy focused on stabilizing the existing metabolic machinery within their tropical freshwater niches [40]. This study establishes a comparative mitogenomic framework for Apistogramma, providing a basis for evaluating interspecific genetic diversity.
Apistogramma is valuable in evolutionary and biogeographic research, where suitable molecular markers are essential for taxonomic precision. Although cytb and cox1 have been the most frequently utilized traditional markers for species identification in this genus [13,41], their resolution is often limited when distinguishing closely related or recently diverged taxa. To address the limited resolution of these conventional markers, we systematically assessed variations across the complete mitogenome. Our screening revealed—for the first time—that nad5 and nad4 show higher proportions of interspecific variation than the conventional markers cytb and cox1. This finding suggests that incorporating nad5 or nad4 could substantially improve the identification of morphologically similar or recently diverged species within the genus. These results offer important data and new candidate markers for developing a high-resolution DNA barcoding system for Apistogramma, moving beyond reliance on single-gene approaches. The candidate markers will enable robust biodiversity assessment and support rapid species identification across the genus.
Phylogenetic trees reconstructed from 13 PCGs yielded largely congruent topologies with high statistical support, aligning with earlier studies [13] and confirming the close relationship between A. nijsseni and A. baenschi. From a molecular perspective (DNA influence), the transition from single-gene markers to complete mitogenomes significantly increased information density, providing the necessary resolution to distinguish these closely related taxa. However, these DNA-level divergences are intrinsically linked to ‘other influences,’ such as the complex hydrogeological history of the Amazon Basin [13]. For instance, the high genetic distance (Dxy > 0.2) and unique gene rearrangement observed in A. allpahuayo suggest a prolonged period of evolutionary isolation, potentially driven by vicariant events or river dynamics that restricted gene flow. Furthermore, the pervasive purifying selection (Ka/Ks < 1) identified across all PCGs reflects the functional constraints on DNA to maintain metabolic efficiency in varying ecological niches. While our mitogenomic framework establishes a robust maternal backbone, the potential for mitonuclear discordance—often caused by incomplete lineage sorting or ancient hybridization during rapid radiation—remains a factor. Therefore, these DNA-based findings provide a primary framework that integrates genomic architecture with the known biogeographic patterns of Apistogramma, offering a reliable foundation for future studies incorporating nuclear data and ecological parameters.

5. Conclusions

This study characterized the complete mitochondrial genomes of six Apistogramma species, revealing highly conserved genomic structures and universal purifying selection across all protein-coding genes. Our comparative analysis identifies nad5, cox1, and nad4 as promising molecular markers that hold potential for rapid species identification, given their higher interspecific divergence compared to the traditional cytb gene. exhibit higher interspecific divergence than the traditional cytb gene. Furthermore, phylogenomic reconstruction confirms the monophyly of Apistogramma and clarifies key sister-species relationships, including those between A. nijsseniA. baenschi and A. cacatuoidesA. agassizii. Future studies incorporating broader taxonomic sampling and intraspecific data are warranted to further validate the effectiveness of these markers and the presence of a distinct barcoding gap.

Supplementary Materials

The following supporting information can be downloaded at: https://www.mdpi.com/article/10.3390/ani16081178/s1, Table S1: Identification Key for Six Common Species of the Genus Apistogramma. Refs. [42,43,44] are cited in the Supplementary Materials.

Author Contributions

Conceptualization, C.-H.S.; methodology, C.-H.S. and C.-H.L.; software, X.-D.C. and C.-H.S.; formal analysis, X.-D.C. and W.H.; investigation, W.H. and X.M.; writing—original draft preparation, X.-D.C. and C.-H.S.; writing—review and editing, X.-D.C., W.H., X.M., C.-H.S. and C.-H.L.; supervision, C.-H.S.; project administration, C.-H.S.; funding acquisition, C.-H.L. All authors have read and agreed to the published version of the manuscript.

Funding

This research was funded by the Priority Academic Program Development of Jiangsu Higher Education Institutions (PAPD).

Institutional Review Board Statement

The animal study protocol was approved by the Animal Welfare and Ethics Committee of Nanjing Forestry University (protocol approval code: 2025001; date of approval: 25 February 2025).

Informed Consent Statement

Not applicable.

Data Availability Statement

The complete mitochondrial genome sequences and annotations are available in the National Center for Biotechnology Information (NCBI) GenBank database (https://www.ncbi.nlm.nih.gov/genbank/, accessed on 9 April 2026) under accession numbers PV747861, PV872131, PV741065, PV739306, and PV692065.

Acknowledgments

We kindly acknowledge the anonymous reviewers for their critical comments.

Conflicts of Interest

The authors declare no conflicts of interest.

Abbreviations

The following abbreviations are used in this manuscript:
BIBayesian Inference
BPBootstrap Probability
MLMaximum Likelihood
mtDNAMitochondrial DNA
PCGProtein-Coding Gene
PPPosterior Probability
RSCURelative Synonymous Codon Usage

References

  1. Varella, H.R.; Sabaj Pérez, M.H. A titan among dwarfs: Apistogramma kullanderi, new species (Teleostei: Cichlidae). Ichthyol. Explor. Freshw. 2014, 25, 243–258. [Google Scholar]
  2. Römer, U.; Hahn, I. Apistogramma barlowi sp. n.-description of a new facultative mouth-brooding cichlid species (Teleostei: Perciformes: Geophaginae) from Northern Peru. Vertebr. Zool. 2008, 58, 49–66. [Google Scholar] [CrossRef]
  3. Kullander, S.O. Family Cichlidae (Cichlids). In Check List of the Freshwater Fishes of South and Central America; Reis, R.E., Kullander, S.O., Ferraris, C.J., Jr., Eds.; EDIPUCRS: Porto Alegre, Brazil, 2003; pp. 605–654. [Google Scholar]
  4. Chen, X.D.; Sun, C.H.; Hu, W.; Zhao, L.; Liu, J.; Zhang, Y.P. Complete mitochondrial genomes of five Geophagus species: Insights into phylogenetic relationships and taxonomic paraphyly. Mol. Genet. Genom. 2024, 301, 79. [Google Scholar] [CrossRef]
  5. Sparks, J.S. Molecular phylogeny and biogeography of the Malagasy and South Asian cichlids (Teleostei: Perciformes: Cichlidae). Mol. Phylogenetics Evol. 2004, 30, 599–614. [Google Scholar] [CrossRef]
  6. Sparks, J.S.; Smith, W.L. Phylogeny and biogeography of cichlid fishes (Teleostei: Perciformes: Cichlidae). Cladistics 2004, 20, 501–517. [Google Scholar] [CrossRef]
  7. Satoh, T.P.; Miya, M.; Mabuchi, K.; Nishida, M. Structure and variation of the mitochondrial genome of fishes. BMC Genom. 2016, 17, 719. [Google Scholar] [CrossRef]
  8. Ruan, H.T.; Li, M.; Li, Z.H.; Huang, J.; Chen, W.; Sun, J.; Liu, L.; Zou, K. Comparative analysis of complete mitochondrial genomes of three Gerres fishes (Perciformes: Gerreidae) and primary exploration of their evolution history. Int. J. Mol. Sci. 2020, 21, 1874. [Google Scholar] [CrossRef]
  9. Min-Shan Ko, A.M.S.; Zhang, Y.; Yang, M.A.; Hu, Y.; Cao, P.; Feng, X.; Zhang, L.; Wei, F.; Fu, Q. Mitochondrial genome of a 22,000-year-old giant panda from southern China reveals a new panda lineage. Curr. Biol. 2018, 28, R693–R694. [Google Scholar] [CrossRef] [PubMed]
  10. Zeng, L.; Wen, J.; Fan, S.G.; Chen, Z.; Xu, Y.; Sun, Y.; Chen, D.; Zhao, J. Species identification of fish maw (Porcupinefish) products sold on the market using DNA sequencing of 16S rRNA and COI genes. Food Control 2018, 86, 159–162. [Google Scholar] [CrossRef]
  11. Quérouil, S.; Vela Diaz, A.; García-Dávila, C.; Römer, U.; Renno, J.-F. Development and characterization of polymorphic microsatellite markers in Neotropical fish of the genus Apistogramma (Perciformes: Labroidei: Cichlidae). J. Appl. Ichthyol. 2015, 31, 52–56. [Google Scholar] [CrossRef]
  12. Wagner Werneck Félix da Costa, G.; de Bello Cioffi, M.; Liehr, T.; Feldberg, E.; Antonio Carlos Bertollo, L.; Franco Molina, W. Extensive chromosomal reorganization in Apistogramma fishes (Cichlidae, Cichlinae) fits the complex evolutionary diversification of the genus. Int. J. Mol. Sci. 2019, 20, 4077. [Google Scholar] [CrossRef] [PubMed]
  13. Tougard, C.; García Dávila, C.R.; Römer, U.; Duponchelle, F.; Cerqueira, F.; Paradis, E.; Guinand, B.; Angulo Chávez, C.; Salas, V.; Quérouil, S.; et al. Tempo and rates of diversification in the South American cichlid genus Apistogramma (Teleostei: Perciformes: Cichlidae). PLoS ONE 2017, 12, e0182618. [Google Scholar] [CrossRef]
  14. Lu, M.; An, H.M.; Li, L.L. Genome survey sequencing for the characterization of the genetic background of Rosa roxburghii tratt and leaf ascorbate metabolism genes. PLoS ONE 2016, 11, e0147530. [Google Scholar] [CrossRef]
  15. Xu, S.Y.; Zhang, H.; Gao, T.X. Comprehensive whole genome survey analyses of male and female brown-spotted flathead fish Platycephalus sp.1. Genomics 2020, 112, 4742–4748. [Google Scholar] [CrossRef]
  16. Huang, W.W.; Lai, J.; Liang, W.Q.; Ye, S.; Li, J.; Zhou, J.; Zhang, Y.; Peng, S.; Zhan, H.; Zheng, P.; et al. Identification of sex-specific DNA markers in the army fish (Spinibarbus hollandi) by whole genome re-sequencing method. Aquaculture 2024, 583, 740605. [Google Scholar] [CrossRef]
  17. Kim, E.B.; Fang, X.D.; Fushan, A.A.; Huang, Z.; Lobanov, A.V.; Han, L.; Marino, S.M.; Sun, X.; Turanov, A.A.; Yang, P.; et al. Genome sequencing reveals insights into physiology and longevity of the naked mole rat. Nature 2011, 479, 223–227. [Google Scholar] [CrossRef]
  18. Oosting, T.; Hilario, E.; Wellenreuther, M.; Ritchie, P.A. DNA Degradation in Fish: Practical Solutions and Guidelines to Improve DNA Preservation for Genomic Research. Ecol. Evol. 2020, 10, 8643–8651. [Google Scholar] [CrossRef] [PubMed]
  19. Jin, J.J.; Yu, W.B.; Yang, J.B.; Song, Y.; dePamphilis, C.W.; Yi, T.S.; Li, D.Z. GetOrganelle: A fast and versatile toolkit for accurate de novo assembly of organelle genomes. Genome Biol. 2020, 21, 241. [Google Scholar] [CrossRef]
  20. Zhu, T.; Sato, Y.; Sado, T.; Miya, M.; Iwasaki, W. MitoFish, MitoAnnotator, and MiFish Pipeline: Updates in 10 years. Mol. Biol. Evol. 2023, 40, msad035. [Google Scholar] [CrossRef] [PubMed]
  21. Katoh, K.; Standley, D.M. MAFFT multiple sequence alignment software version 7: Improvements in performance and usability. Mol. Biol. Evol. 2013, 30, 772–780. [Google Scholar] [CrossRef]
  22. Zhang, D.; Gao, F.L.; Jakovlić, I.; Zou, H.; Zhang, J.; Li, W.X.; Wang, G.T. PhyloSuite: An integrated and scalable desktop platform for streamlined molecular sequence data management and evolutionary phylogenetics studies. Mol. Ecol. Resour. 2020, 20, 348–355. [Google Scholar] [CrossRef]
  23. Zhang, Z.; Li, J.; Zhao, X.-Q.; Wang, J.; Wong, G.K.-S.; Yu, J. Ka/Ks Calculator: Calculating Ka and Ks through model selection and model averaging. Genom. Proteom. Bioinform. 2006, 4, 259–263. [Google Scholar] [CrossRef] [PubMed]
  24. Rozas, J.; Ferrer-Mata, A.; Sánchez-DelBarrio, J.C.; Guirao-Rico, S.; Librado, P.; Ramos-Onsins, S.E.; Sánchez-Gracia, A. DnaSP 6: DNA sequence polymorphism analysis of large data sets. Mol. Biol. Evol. 2017, 34, 3299–3302. [Google Scholar] [CrossRef]
  25. Kumar, S.; Stecher, G.; Li, M.; Knyaz, C.; Tamura, K. MEGA X: Molecular evolutionary genetics analysis across computing platforms. Mol. Biol. Evol. 2018, 35, 1547–1549. [Google Scholar] [CrossRef] [PubMed]
  26. Swofford, D.L.; Olsen, G.J.; Waddell, P.J.; Hillis, D.M. Phylogeny inference. In Molecular Systematics, 2nd ed.; Hillis, D.M., Moritz, C., Mable, B.K., Eds.; Sinauer Associates: Sunderland, MA, USA, 1996; pp. 407–514. [Google Scholar]
  27. Chen, W.J.; Santini, F.; Carnevale, G.; Chen, J.N.; Liu, S.H.; Lavoué, S.; Mayden, R.L. New Insights on Early Evolution of Spiny-Rayed Fishes (Teleostei: Acanthomorpha). Front. Mar. Sci. 2014, 1, 53. [Google Scholar] [CrossRef]
  28. Ilves, K.L.; Torti, D.; López-Fernández, H. Exon-based phylogenomics of Neotropical cichlids: Historical biogeography and diversification. Mol. Phylogenet. Evol. 2018, 124, 83–99. [Google Scholar] [CrossRef]
  29. Talavera, G.; Castresana, J. Improvement of phylogenies after removing divergent and ambiguously aligned blocks from protein sequence alignments. Systemat. Biol. 2007, 56, 564–577. [Google Scholar] [CrossRef]
  30. Kalyaanamoorthy, S.; Minh, B.Q.; Wong, T.K.F.; von Haeseler, A.; Jermiin, L.S. ModelFinder: Fast model selection for accurate phylogenetic estimates. Nat. Methods 2017, 14, 587–589. [Google Scholar] [CrossRef]
  31. Nguyen, L.-T.; Schmidt, H.A.; von Haeseler, A.; Minh, B.Q. IQ-TREE: A fast and effective stochastic algorithm for estimating maximum-likelihood phylogenies. Mol. Biol. Evol. 2015, 32, 268–274. [Google Scholar] [CrossRef]
  32. Ronquist, F.; Teslenko, M.; Van der Mark, P.; Ayres, D.L.; Darling, A.; Höhna, S.; Larget, B.; Liu, L.; Suchard, M.A.; Huelsenbeck, J.P. MrBayes, 3.2: Efficient Bayesian phylogenetic inference and model choice across a large model space. Syst. Biol. 2012, 61, 539–542. [Google Scholar] [CrossRef]
  33. Letunic, I.; Bork, P. Interactive tree of life (iTOL) v6: Recent updates to the phylogenetic tree display and annotation tool. Nucleic Acids Res. 2024, 52, W78–W82. [Google Scholar] [CrossRef]
  34. Boore, J.L. Animal mitochondrial genomes. Nucleic Acids Res. 1999, 27, 1767–1780. [Google Scholar] [CrossRef]
  35. Falkenberg, M.; Larsson, N.G.; Gustafsson, C.M. Replication and transcription of human mitochondrial DNA. Annu. Rev. Biochem. 2024, 93, 47–77. [Google Scholar] [CrossRef]
  36. Del Amparo, R.; Branco, C.; Arenas, J.; Vicens, A.; Arenas, M. Analysis of selection in protein-coding sequences accounting for common biases. Brief. Bioinform. 2021, 22, bbaa431. [Google Scholar] [CrossRef]
  37. Han, C.; Li, Q.; Lin, J.F.; Zhang, Z.; Huang, J. Characterization of complete mitochondrial genomes of Mastacembelus erythrotaenia and Mastacembelus armatus (Synbranchiformes: Mastacembelidae) and phylogenetic studies of Mastacembelidae. Conserv. Genet. Resour. 2018, 10, 295–299. [Google Scholar] [CrossRef]
  38. Sun, Y.B.; Shen, Y.Y.; Irwin, D.M.; Zhang, Y.P. Evaluating the Roles of Energetic Functional Constraints on Teleost Mitochondrial-Encoded Protein Evolution. Mol. Biol. Evol. 2011, 28, 39–44. [Google Scholar] [CrossRef]
  39. Wang, Y.; Xiong, F.; Song, Z. Molecular Phylogeny and Adaptive Mitochondrial DNA Evolution of Salmonids (Pisces: Salmonidae). Front. Genet. 2022, 13, 903240. [Google Scholar] [CrossRef] [PubMed]
  40. Zhang, K.; Sun, J.; Xu, T.; Qiu, J.-W.; Qian, P.-Y. Phylogenetic relationships and adaptation in deep-sea mussels: Insights from mitochondrial genomes. Int. J. Mol. Sci. 2021, 22, 1900. [Google Scholar] [CrossRef] [PubMed]
  41. Lefébure, T.; Douady, C.J.; Gouy, M.; Gibert, J. Relationship between morphological taxonomy and molecular divergence within Crustacea: Proposal of a molecular threshold to help species delimitation. Mol. Phylogenet. Evol. 2006, 40, 435–447. [Google Scholar] [CrossRef]
  42. Kullander, S.O. A Taxonomical Study of the Genus Apistogramma Regan, with a Revision of Brazilian and Peruvian Species (Teleostei: Percoidei: Cichlidae); Bonner Zoologische Monographien; Zoologisches Forschungsinstitut und Museum Alexander Koenig: Bonn, Germany, 1980; Volume 14, pp. 1–152. [Google Scholar]
  43. Römer, U. Cichlid Atlas 1: Natural History of South American Dwarf Cichlids; Mergus Verlag: Melle, Germany, 2001. [Google Scholar]
  44. Römer, U.; Beninde, J.; Duponchelle, F.; García-Dávila, C.R.; Díaz, A.C.; Hahn, I. Description of Apistogramma allpahuayo sp. n., a new dwarf cichlid species (Teleostei: Perciformes: Geophaginae) from in and around the Reserva Nacional Allpahuayo Mishana, Loreto, Peru. Vertebr. Zool. 2012, 62, 189–212. [Google Scholar] [CrossRef]
Figure 1. Relative synonymous codon usage (RSCU) distribution of the mitochondrial genome codons in six Apistogramma species.
Animals 16 01178 g001
Figure 2. Selection pressure analysis of the mitochondrial genome in six Apistogramma species.
Animals 16 01178 g002
Figure 3. Maximum likelihood (ML) phylogenetic tree of 47 New World cichlid species based on the 13 PCG nucleotide sequences. The values on the branches represent bootstrap support, and the numbers following the species names are GenBank accession numbers. The ML tree is midpoint-rooted, with the root representing the hypothetical common ancestor of the studied taxa.
Animals 16 01178 g003
Figure 4. Bayesian inference (BI) phylogenetic tree of 47 New World cichlid species based on 13 PCG nucleotide sequences. The values on the branches represent posterior probabilities, and the numbers following the species names are GenBank accession numbers. The BI tree is midpoint-rooted, with the root representing the hypothetical common ancestor of the studied taxa.
Animals 16 01178 g004
Table 1. Basic characteristics of the mitogenome in Apistogramma.
SubfamilyOrganismIDFull Length (bp)A+T (%)AT SkewGC Skew
AstronotinaeAstronotus ocellatusNC_00905816,56955.00.049−0.342
AstronotinaeChaetobranchopsis bitaeniatusNC_03354216,61058.40.042−0.351
CichlasomatinaeAequidens metaeNC_03354416,54153.60.037−0.315
CichlasomatinaeAmphilophus citrinellusNC_02382716,52254.20.054−0.340
CichlasomatinaeAndinoacara pulcherNC_03354716,51356.80.011−0.299
CichlasomatinaeAndinoacara rivulatusNC_02567116,58556.9−0.019−0.259
CichlasomatinaeAustraloheros facetusPP92873216,55654.60.036−0.323
CichlasomatinaeBujurquina mariaeNC_03354316,54058.80.004−0.286
CichlasomatinaeBujurquina oenolaemusKX39735816,53257.50.012−0.301
CichlasomatinaeCichlasoma dimerusNC_03355116,61754.50.041−0.327
CichlasomatinaeCryptoheros cutteriNC_03355216,52852.90.040−0.328
CichlasomatinaeHerichthys cyanoguttatusNC_03354616,54053.40.059−0.344
CichlasomatinaeHeros severusMT36363616,57756.90.030−0.221
CichlasomatinaeHypselecara temporalisNC_01116816,54453.90.021−0.316
CichlasomatinaeKrobia guianensisNC_03144016,53954.30.045−0.324
CichlasomatinaeLaetacara thayeriKR23397414,31556.00.003−0.303
CichlasomatinaeNannacara anomalaNC_03118316,50253.40.025−0.301
CichlasomatinaeParachromis managuensisNC_02691816,52653.60.049−0.339
CichlasomatinaePetenia splendidaNC_02483516,51853.20.053−0.338
CichlasomatinaePterophyllum altumNC_02872316,49554.20.014−0.325
CichlasomatinaePterophyllum scalareNC_02653516,49154.20.016−0.317
CichlasomatinaeRocio octofasciataNC_03354816,53954.40.041−0.340
CichlasomatinaeSymphysodon aequifasciataNC_02818216,54554.90.049−0.335
CichlasomatinaeSymphysodon discusNC_02668916,54454.90.052−0.337
CichlasomatinaeSymphysodon haraldiNC_02796516,54354.90.051−0.336
CichlasomatinaeThorichthys aureusNC_03118216,53052.10.042−0.325
CichlasomatinaeThorichthys meekiNC_08656916,52653.20.052−0.339
CichlasomatinaeUaru amphiacanthoidesNC_03355016,54954.40.044−0.326
CichlasomatinaeVieja melanuraNC_02352616,54352.60.058−0.335
CichlinaeCichla monoculusNC_08424316,52654.40.076−0.350
CichlinaeCichla ocellarisNC_03027216,52654.30.076−0.350
CichlinaeCichla piquitiNC_08424216,53654.30.079−0.354
CichlinaeCichla temensisNC_08424416,53054.10.087−0.358
CichlinaeCrenicichla reganiKR23397711,46151.60.030−0.313
GeophaginaeApistogramma agassiziiPV74786116,94154.30.025−0.302
GeophaginaeApistogramma allpahuayoPV87213117,43955.5−0.0380.325
GeophaginaeApistogramma baenschiPV74106516,76755.00.055−0.344
GeophaginaeApistogramma cacatuoidesKR15087416,87054.30.025−0.302
GeophaginaeApistogramma nijsseniPV73930616,80355.60.037−0.326
GeophaginaeApistogramma resticulosaPV69206516,90954.00.040−0.313
GeophaginaeDicrossus filamentosusKR23397511,88753.0−0.002−0.308
GeophaginaeGeophagus brasiliensisNC_03118116,55954.10.044−0.319
GeophaginaeGeophagus steindachneriNC_03354516,59453.80.063−0.339
GeophaginaeGymnogeophagus balzaniiKR15086416,58756.00.018−0.306
GeophaginaeMikrogeophagus ramireziNC_03143916,52655.40.033−0.294
GeophaginaeTaeniacara candidiKR15087316,58157.2−0.005−0.290
RetroculinaeRetroculus lapidiferNC_03354916,53752.80.058−0.314
Table 2. Differential analysis of mitochondrial genes in six Apistogramma species.
Parametersatp6atp8coxlcox2cox3cytbnad1nad2nad3nad4nad4Lnad5nad6rrnLrrnS
Total number of sites683168157369178311409751045346138129718485311733954
Invariable sites43895104742254677564969123393120212282641368768
Variable sites2457352626923736532635411345095620267365186
Singleton variable sites113452181691291811631685020838296108205109
Parsimony informative sites13228308100108184163186632425732415916077
Ratio of variable sites/%35.8743.4533.4438.9330.2732.0233.4433.8832.6632.5931.9933.5550.2821.0619.50
Table 3. Pairwise genetic distances (Dxy ± SE) of the 13 mitochondrial protein-coding genes (PCGs) among species of the six Apistogramma species.
A. agassiziiA. allpahuayoA. baenschiA. cacatuoidesA. nijsseniA. resticulosa
A. agassizii
A. allpahuayo0.233 ± 0.005
A. baenschi0.214 ± 0.0050.229 ± 0.005
A. cacatuoides0.059 ± 0.0020.230 ± 0.0060.215 ± 0.005
A. nijsseni0.211 ± 0.0050.219 ± 0.0050.098 ± 0.0030.213 ± 0.005
A. resticulosa0.158 ± 0.0040.240 ± 0.0050.222 ± 0.0050.155 ± 0.0040.217 ± 0.005
Disclaimer/Publisher’s Note: The statements, opinions and data contained in all publications are solely those of the individual author(s) and contributor(s) and not of MDPI and/or the editor(s). MDPI and/or the editor(s) disclaim responsibility for any injury to people or property resulting from any ideas, methods, instructions or products referred to in the content.