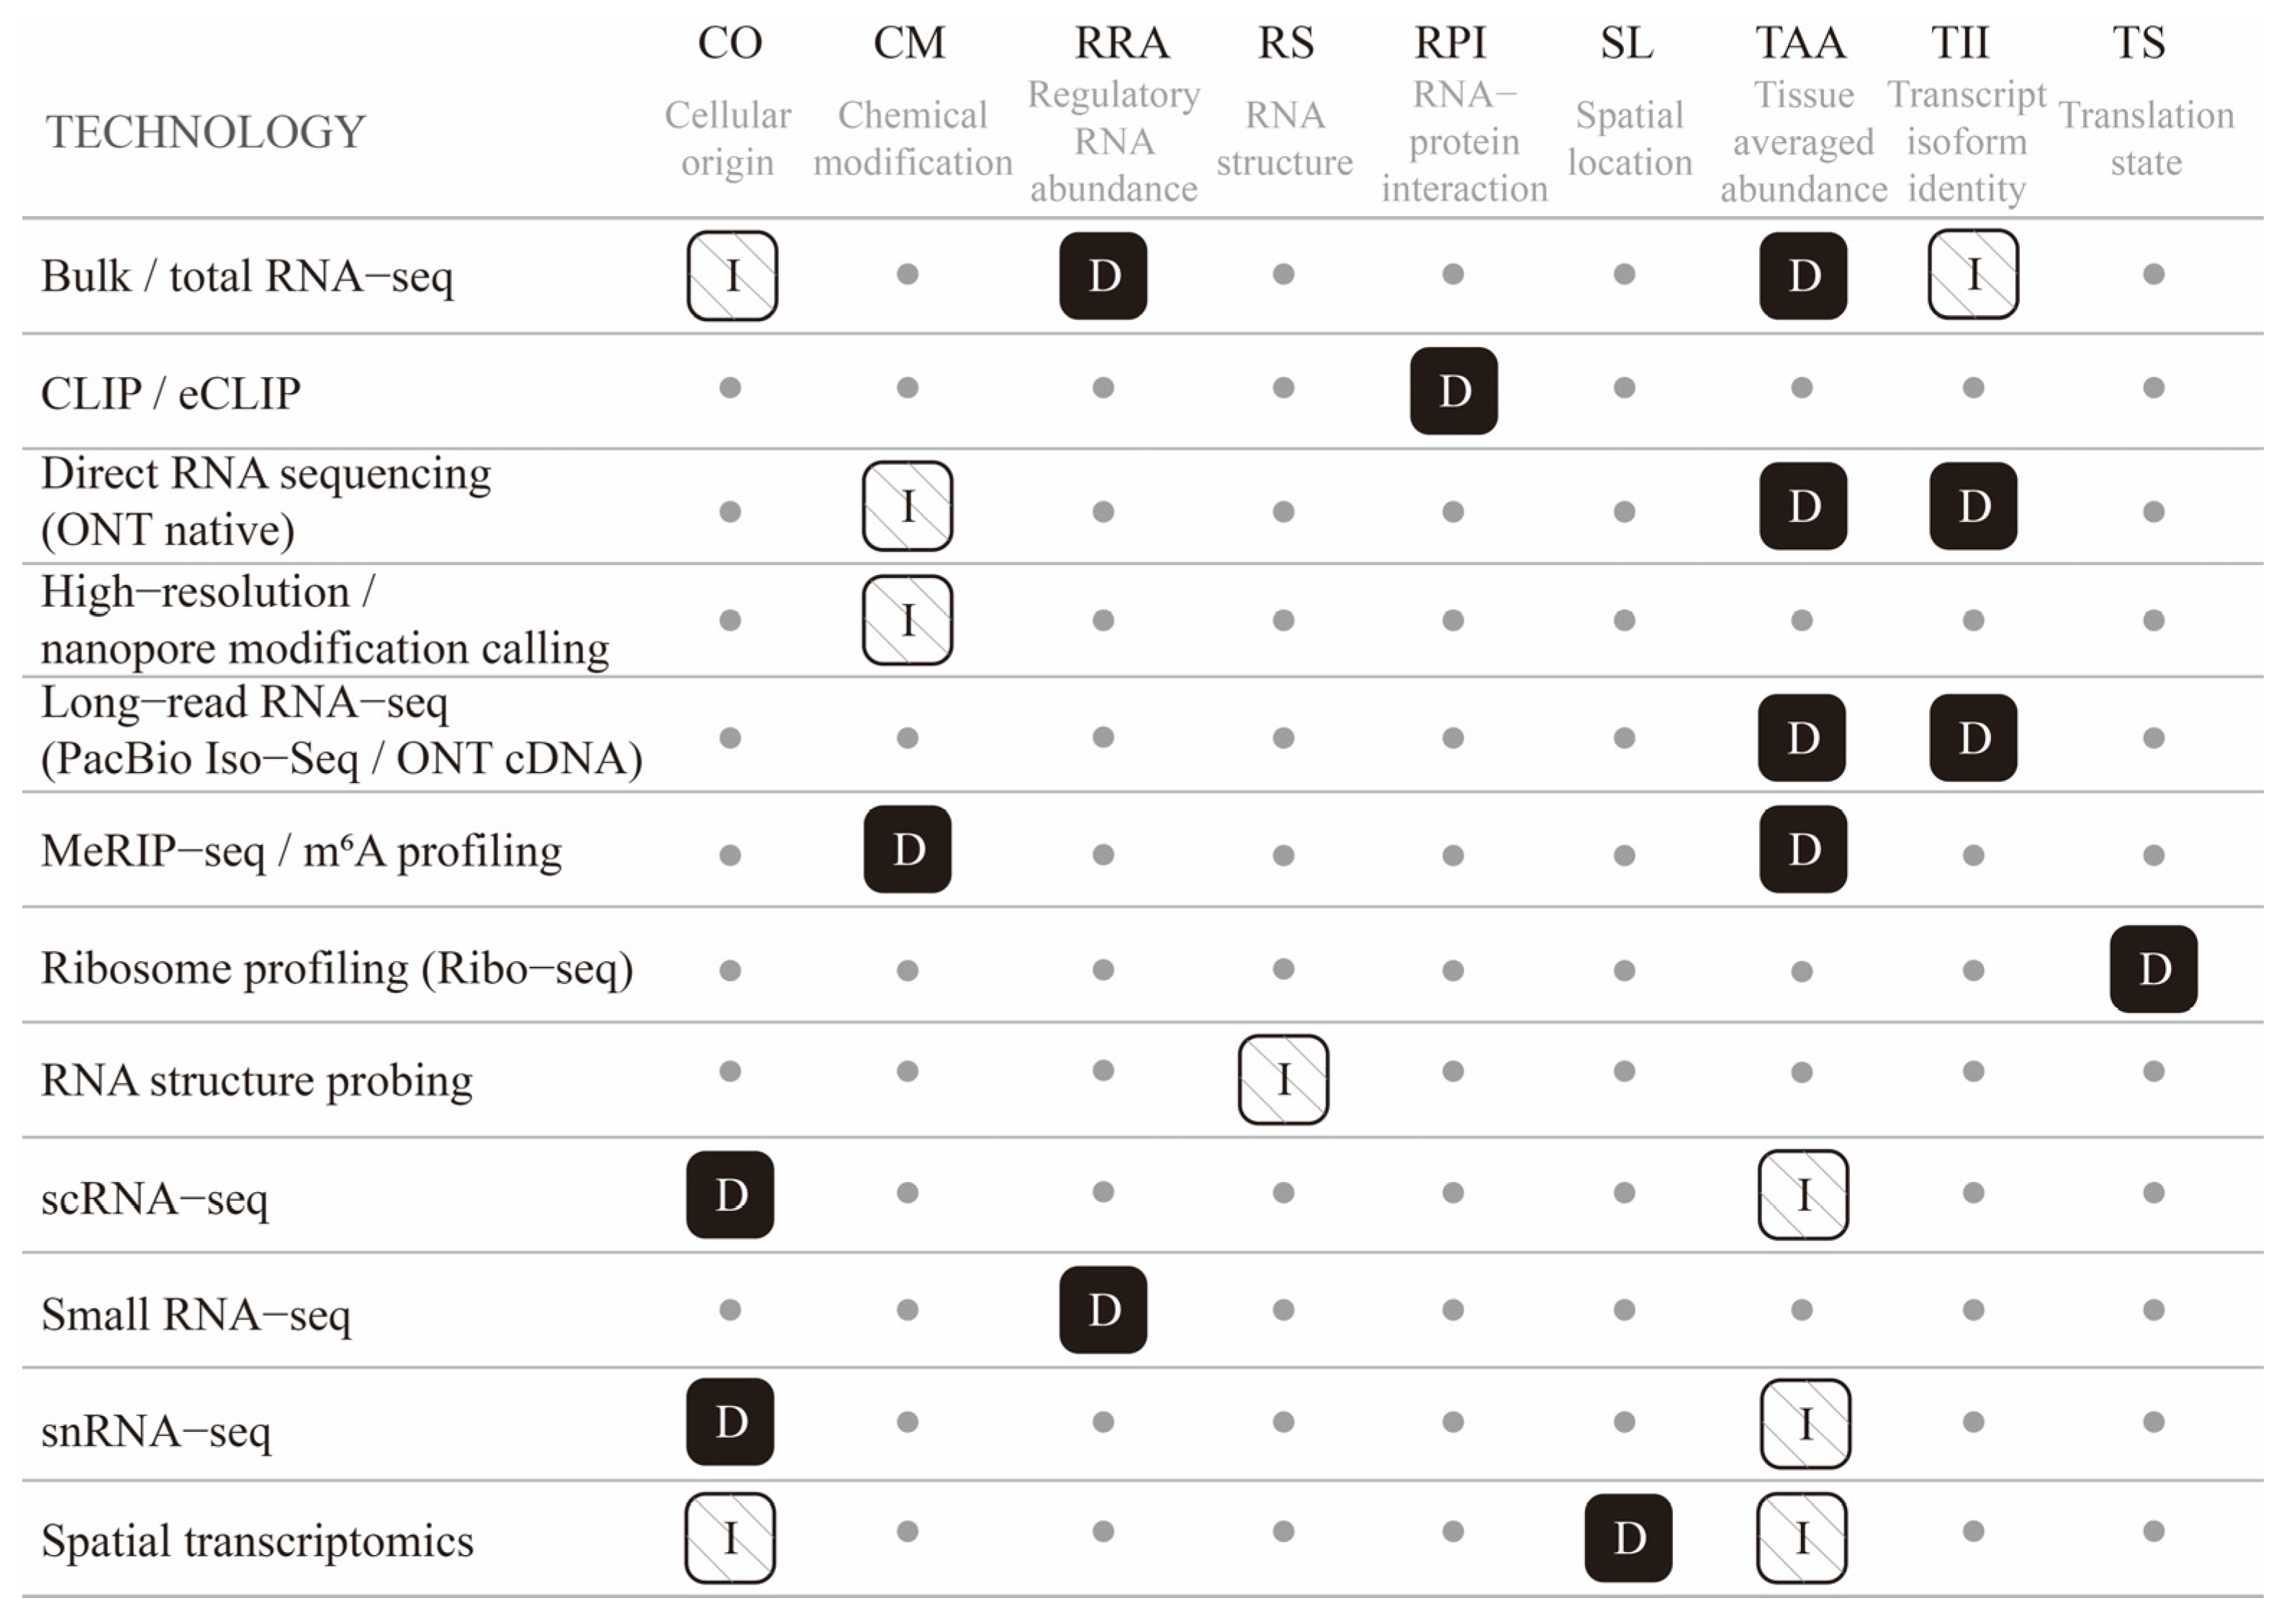
The technologies discussed here provide complementary RNA information rather than forming a unidirectional, simple-to-complex technological pathway (
Figure 1). The order of presentation below follows how widely each technology is used in poultry, not how advanced it is, and it is not a recommended sequence: which technology is appropriate is set by the biological question and the RNA feature it requires, so a well-replicated bulk experiment can be the correct design where a single-cell experiment would answer a different question expensively. Short-read RNA sequencing quantifies gene- and exon-level abundance and can identify unannotated exons and splice junctions, but fragmented reads generally struggle to reliably reconstruct full-length transcripts, and tissue-level signals are inevitably influenced by cellular composition [
2,
32]. The consequences are specific: splice junctions are recovered but not their combinations, so genes with several alternative exons collapse into ambiguous isoform assignments; long 3′ untranslated regions and alternative polyadenylation sites are truncated as coverage decays towards transcript ends; and GC-rich exons, over-represented on avian microchromosomes, are under-covered during amplification, so exon-level quantification is least reliable where poultry annotation is weakest [
21,
33]. Small RNA sequencing and total transcriptome sequencing expand the analytical scope to miRNAs, lncRNAs, and circRNAs, thereby capturing regulatory RNA information that conventional gene expression analyses often miss. Long-read sequencing can further resolve intact or nearly intact transcript isoforms, alternative splicing, and 3′-end usage [
13,
14]. Antibody enrichment-based methods and native RNA analyses, such as direct RNA sequencing, can be used to profile RNA modifications like m
6A [
34]. Single-cell and spatial transcriptomics further pinpoint the cellular origins of expression signals and their spatial distributions within tissues [
17]. Information regarding RNA structure, RNA–protein interactions, and translation states currently remains at the frontier of poultry RNA-omics research, with limited applications to date. The following sections introduce these technologies sequentially based on the aforementioned information types, beginning with the most widely applied methods in poultry. For each technology category, we outline its direct measurement signals, the additional information it provides over existing methods, representative applications in poultry, and main limitations. The measurement and practical profiles of sequencing and modification technologies are summarized in
Table 2 and
Table 3, whereas those of cellular, spatial, interaction, translation, and RNA-structure technologies are summarized in
Table 4 and
Table 5. The text refers repeatedly to two reference resources: the multi-tissue long-read transcript annotation in chickens [
26] and the catalog of associations among cis-regulatory variants, gene expression, splicing, and 3′-UTR usage established by the ChickenGTEx project [
25,
27].
Figure 1.
Coverage of RNA information layers by poultry RNA-omics technologies, and how each layer is obtained. Rows list technologies and columns list layers of RNA information; the ordering of either axis does not imply a sequence, hierarchy, or level of sophistication. Each cell states whether the technology measures that layer directly (filled, D), obtains it only by inference or aggregation from its own data (hatched, I), or does not provide it (dot). Any cell is therefore a valid entry point: a technology is appropriate when its direct readout answers the question being asked. A single layer can be reached by technologies of very different resolution, and the direction of that difference reverses between layers. Single-cell methods infer tissue-averaged abundance by aggregation, while bulk sequencing measures that layer directly and infers cellular composition by deconvolution. The corresponding research questions, together with the current implementation status of each technology in poultry, are given in
Table 6.

Table 2.
Measurement profile of poultry RNA-omics sequencing and modification profiling technologies.
| Technology | RNA Input | Primary Signal | Main Analytical Output | Additional Information Revealed | Representative Poultry Applications |
|---|
| Bulk/total RNA-seq | Total or poly-A RNA (tissue) | Short reads | Gene/transcript abundance; DE; co-expression | Genome-wide expression and regulatory-network membership | Myogenic and fat networks [35,36,37,38,39,40]; reviews [1,3,4] |
| Small RNA-seq | Size-selected small RNA | Short reads | Mature miRNA abundance | miRNA layer of regulatory networks | miRNA surveys in health/production [41]; embryonic muscle m6A–miRNA [42] |
| Long-read RNA-seq (PacBio Iso-Seq/ONT cDNA) | Full-length cDNA | Long reads | Isoform catalogue; splicing/TSS/APA; transcript-level abundance | Complete or near-complete transcript identity | 19-tissue chicken isoforms [26]; embryonic heart [43]; benchmark [44] |
| Direct RNA sequencing (ONT native) | Native RNA | Ionic current on nanopore | Isoform + candidate modification from same read; transcript-level abundance | Native-molecule signal; joint isoform/modification | Caecal m6A/m5C after C. jejuni [45]; method [46] |
| MeRIP-seq/m6A profiling | Fragmented RNA + m6A antibody | Enriched methylated reads | m6A-enriched regions | Transcriptome-wide modification state | Laying [47]; follicle [48]; tumour liver [49] |
| High-resolution/nanopore modification calling | Native or chemically treated RNA | Basecalling deviation/chemistry | Candidate single-base sites | Higher-resolution modification localisation | β-actin zipcode fine-mapping [50] |
Table 3.
Practical profile of poultry RNA-omics sequencing and modification profiling technologies. Input and cost entries are indicative order-of-magnitude guides from the sources cited in
Table 2 and in the text. They are not vendor quotations, vary with provider, country, protocol and depth, and should be re-checked locally.
| Technology | Typical Input and Sample Requirement | Relative Cost and Throughput | Inter-Laboratory Reproducibility | Strengths | Limitations |
|---|
| Bulk/total RNA-seq | 0.1–1 µg total RNA, RIN ≥ 7; tolerant of frozen tissue | Lowest tier; baseline for comparison; high multiplexing | High; limited mainly by annotation version and pipeline choice | Deep, reproducible, low cost, comparable | Tissue average; gene-level; networks inferred |
| Small RNA-seq | 0.1–1 µg total RNA with small RNA fraction preserved | Low tier; baseline plus a dedicated protocol step | Moderate; adapter-ligation bias differs between kits | Direct miRNA quantification | Requires dedicated protocol; target prediction inferred |
| Long-read RNA-seq (PacBio Iso-Seq/ONT cDNA) | 50–500 ng intact poly(A) RNA or full-length cDNA; degradation is the main failure mode | Intermediate tier, several-fold baseline per sample; lower depth | Moderate; isoform catalogues shift with pipeline and filtering [13,44] | Resolves isoforms short reads miss | Not all reads full-length; tool-dependent; lower depth |
| Direct RNA sequencing (ONT native) | Intact native poly(A) RNA, typically ≥ 500 ng per flow cell | Intermediate to high tier; low throughput per flow cell | Low to moderate; modification calls depend on model version [51] | No cDNA/PCR bias; long native reads | Model-dependent modification calls; error; 3′ bias |
| MeRIP-seq/m6A profiling | Tens to hundreds of µg total RNA per immunoprecipitation, plus a matched input library | Intermediate tier, effectively doubled by the paired input library | Low; antibody lot, immunoprecipitation conditions and peak-calling parameters give only partial overlap between studies [34] | Established, transcriptome-wide | Region-level (not single-base); semi-quantitative; antibody-dependent |
| High-resolution/nanopore modification calling | As for direct RNA sequencing, or chemically treated intact RNA | Intermediate to high tier; requires reference standards | Not established in birds; tools disagree on candidate sites [45,51,52] | Approaches single-base resolution | Early in birds; tools diverge [45] |
Table 4.
Measurement profile of poultry cellular, spatial and interaction analysis technologies.
| Technology | RNA Input | Primary Signal | Main Analytical Output | Additional Information Revealed | Representative Poultry Applications |
|---|
| scRNA-seq | Dissociated single cells | Per-cell short reads (3′/5′) | Cell types and states | Cellular origin of a tissue signal | Heart/limb/retina [53,54,55]; immune maps [56,57,58] |
| snRNA-seq | Isolated nuclei | Per-nucleus reads | Cell types and states (incl. hard-to-dissociate) | Cell origin in fibrous tissue | Muscle satellite-cell subset (RUNX1) [59] |
| Spatial transcriptomics | Tissue section | Spot/region-resolved reads | Spatially resolved expression | Tissue position of a signal | Developing chicken heart [54]; wooden-breast [60]; grower breast muscle [56] |
| CLIP/eCLIP (RBP mapping) | RNA–protein complexes | Crosslinked RBP-bound fragments | RNA–protein binding sites | Which protein binds an RNA | Chicken embryonic heart CELF1 [61]; mammalian method reference [62] |
| Ribosome profiling (Ribo-seq) | Ribosome-protected fragments | Footprint reads | Ribosome occupancy; translation efficiency | Whether RNA is translated | Mammalian method reference [19] |
| RNA structure probing | Chemically/enzymatically treated RNA | Reactivity signal | Structure model | RNA secondary/tertiary state | No poultry transcriptome-wide application identified |
Table 5.
Practical profile of poultry cellular, spatial and interaction analysis technologies. Input and cost entries follow the convention stated for
Table 3.
| Technology | Typical Input and Sample Requirement | Relative Cost and Throughput | Inter-Laboratory Reproducibility | Strengths | Limitations |
|---|
| scRNA-seq | Fresh tissue dissociated to a viable single-cell suspension, commonly ≥ 70–80% viability, thousands of cells per sample | Highest tier, commonly about an order of magnitude above a bulk library per sample | Moderate; dissociation protocol and ambient RNA dominate batch differences [63] | Resolves heterogeneity | 3′/5′ gene-level; no isoform/modification; mammalian markers |
| snRNA-seq | Fresh or frozen tissue; nuclei isolated without a viability requirement | Highest tier, comparable to scRNA-seq | Moderate; nuclei isolation buffer changes the recovered composition [64] | Works where dissociation fails | Nuclear RNA only; isolation bias |
| Spatial transcriptomics | Intact tissue section of defined area with RNA quality preserved through fixation and cryosectioning | Highest tier per section, plus imaging and instrument access | Low to moderate; capture efficiency varies between sections and platform generations [65,66] | Retains anatomy | Spot ≠ single cell; few avian tissues |
| CLIP/eCLIP (RBP mapping) | Millions of crosslinked cells plus an antibody validated for immunoprecipitation, or a tagged RBP system | Intermediate in reagents, high in development effort | Not established in birds; antibody availability is the limiting factor [62] | Direct interaction map | One chicken application (CELF1, embryonic heart); no transcriptome-wide avian binding map |
| Ribosome profiling (Ribo-seq) | Fresh tissue or cells with translation arrested within seconds; species-specific rRNA depletion | Intermediate to high tier; two libraries per sample (footprint and matched RNA) | Moderate in mammals; not benchmarked in poultry [19] | Translational-state readout | Sparse avian evidence |
| RNA structure probing | µg amounts of intact RNA per condition and per chemistry, with a matched untreated control | Intermediate tier; requires probing chemistry expertise | Not established in birds; no avian benchmark dataset [20,67] | Structure–function link | Not established transcriptome-wide in birds |
Table 6.
Correspondence between research questions, RNA-omics technologies, and their implementation status in poultry.
| Research Question | Main Technology | RNA Information Obtained | Poultry Implementation Status |
|---|
| Which genes or transcripts change in abundance? | Bulk or total RNA-seq | Tissue-averaged gene or transcript abundance | Established: widely applied across muscle, adipose, reproductive and immune tissues |
| Which regulatory RNAs change? | Small-RNA or total-RNA sequencing | miRNA, lncRNA or circRNA abundance and inferred networks | Established: widely applied, especially in muscle, fat and infection studies |
| Which isoforms or transcript boundaries change? | Long-read RNA sequencing | Full-length or near-full-length isoforms, splice forms and transcript ends | Emerging: used mainly for transcript annotation and resource construction [26,43,68,69] |
| Which RNA modifications change? | MeRIP-seq, higher-resolution assays or direct RNA sequencing | Modification-enriched regions, candidate sites or model-inferred native-RNA signals | Emerging: concentrated mainly on m6A [42,45,47,48,49,70,71,72,73] |
| Which cell population carries a signal? | scRNA-seq or snRNA-seq | Cell types, states and cell-specific expression | Expanding: strongest in immune and muscle tissues [57,59,74] |
| Where is the signal located? | Spatial transcriptomics | Spatially resolved expression and tissue-region context | Very limited: poultry applications have been reported in the developing chicken heart and breast muscle [54,56,60]; feasibility has also been demonstrated in non-poultry birds [75] |
| What is the secondary structure of an RNA, and which regions are accessible? | Transcriptome-wide structure probing (DMS-seq, icSHAPE) | Nucleotide accessibility and reactivity-derived structure models | Frontier: probing methods established outside birds [20,67]; no poultry application identified; term set shared with interaction and translation in Table 1 |
| Which proteins bind an RNA? | CLIP or eCLIP | RNA–protein binding sites | Very limited: one chicken application (CELF1, embryonic heart) [61]; no transcriptome-wide avian binding map |
| Is an RNA ribosome-engaged, and what is its translational efficiency? | Ribosome profiling | Ribosome occupancy and translational output | Frontier: 13 records for the poultry term set (Table 1); sparse avian evidence |
3.1. Bulk Transcriptome and Regulatory RNA Analysis
Short-read RNA sequencing enabled transcriptome-wide expression analysis and remains the most extensively used technology in poultry RNA-omics research. Following alignment and quantification, the sequenced reads are primarily used to estimate the relative abundance of genes or transcripts [
2]. By modifying library preparation strategies, the analytical target can be expanded to various classes of non-coding RNAs. For example, small RNA sequencing is tailored for detecting mature miRNAs, while total RNA sequencing or circRNA-enrichment protocols are used to identify circRNAs. Different libraries capture entirely different categories of RNA [
76,
77]. Poly(A) enrichment predominantly captures mature mRNAs and polyadenylated lncRNAs but will inevitably miss most miRNAs and many circRNAs; size-selected small RNA libraries detect mature miRNAs but fail to capture their primary transcripts. circRNAs are typically analyzed from rRNA-depleted or non-poly(A)-enriched RNA [
78], or through specific enrichment of circular molecules using exonucleases like RNase R, followed by identification via reads supporting back-splice junctions [
79]. Consequently, the library type and enrichment method dictate which RNA classes can be detected before sequencing, and they strongly shape detection sensitivity and quantitative bias. The level of quantification also affects how results are interpreted. Gene-level analysis aggregates reads or transcript estimates originating from the same genomic locus and is generally more stable [
80,
81]. Transcript-level analysis requires assigning reads to distinct isoforms, so it depends heavily on annotation completeness, read length, and sequence divergence between isoforms. These two levels of results reflect total gene expression and isoform usage, respectively, and cannot be interpreted interchangeably. Building on abundance estimation, further analyses such as differential expression, co-expression modules, and competing endogenous RNA (ceRNA) networks can be conducted. The ceRNA model, initially proposed in mammalian studies [
82], is typically constructed based on sequence relationships and expression correlations among lncRNAs, miRNAs, circRNAs, and mRNAs. Compared to single-gene studies, these methods allow poultry researchers to examine synergistic RNA changes on a genome-wide scale, although their foundational data remain primarily tissue-averaged abundances.
Applications of these technologies in poultry are abundant, particularly in studies regarding production traits. circRNAs have attracted attention as regulatory RNAs in muscle research [
79]. For instance, circIGF2BP3 promotes the proliferation and differentiation of chicken primary myoblasts [
83]; integrated analyses of circRNAs, miRNAs, and mRNAs have been employed to construct myogenesis-related ceRNA networks [
36]; and lncRNA and circRNA expression profiles have been used to distinguish oxidative from glycolytic myofibers [
37,
38]. Research on lncRNAs further extends to lipid metabolism regulation and antiviral responses during viral infections [
84], while miRNAs feature prominently in regulatory networks constructed in poultry production and health studies [
41]. In contrast, the annotation and functional study of enhancer RNAs (eRNAs) remain sparse. While genome-wide predictions are now available in chickens [
85] and some candidate eRNAs have been linked to potential target genes via CRISPR-mediated activation [
86], existing reviews have summarized the roles of ncRNAs in poultry skeletal muscle and other production traits [
87,
88]. However, because most enhancer RNAs are of low abundance, highly unstable, and lack poly(A) tails, they are difficult to capture effectively with standard poly(A)-enriched or rRNA-depleted RNA-seq. Reliable identification usually requires specialized methods such as nascent RNA sequencing (e.g., GRO-seq, PRO-seq) or CAGE-seq [
89,
90]. Consequently, existing eRNA evidence in poultry still largely relies on computational predictions based on genomic features rather than direct measurement of nascent transcription.
Four boundaries must be considered when interpreting these results. First, standard differential expression analyses (e.g., DESeq2 or edgeR) [
91] only demonstrate that RNA abundance changes under specific experimental conditions, and co-expression analyses such as WGCNA [
92] reflect synchronized changes between genes. Neither can independently prove a regulatory relationship or a direct physical interaction. Second, ceRNA and “miRNA sponge” relationships are typically proposed based on binding site predictions and expression correlations, not direct measurements of molecular binding. Quantitative studies in mammals have shown that ceRNA effects are constrained by stoichiometric conditions, including the abundance of miRNAs and target RNAs, as well as binding affinities [
93,
94]. Therefore, in the absence of binding assays or functional perturbation, many reported sponge relationships should still be viewed as candidate mechanisms [
82,
95]. Third, expression differences in bulk tissue can result from changes in cell-type proportions rather than necessarily indicating transcriptional regulation within a specific cell type. Computational deconvolution can partially correct for this but cannot entirely eliminate the related uncertainties [
7]. Fourth, the annotation of lncRNAs, circRNAs, and eRNAs remains unstable. Non-coding loci lack standardized nomenclature, reliable mapping across different genomes and annotation versions is often missing, and circRNA detection is highly sensitive to the choice of analytical tools [
96]. This makes it difficult to align novel transcripts identified across different studies and limits cross-study comparisons. Overall, while bulk transcriptome and regulatory RNA analyses generate rich abundance data and candidate regulatory networks, the relationships that have undergone rigorous molecular and functional validation remain limited.
3.2. Long-Read and Direct RNA Sequencing
Total gene abundance cannot elucidate which specific transcripts a gene produces. Alternative splicing, alternative transcription start sites, and alternative polyadenylation (APA) can generate isoforms with divergent coding capacities or regulatory features. These phenomena were first mapped systematically on a transcriptome-wide scale in mammals [
8]. While short-read RNA sequencing can quantify gene and exon-level abundance, it generally struggles to reliably reconstruct full-length isoforms. Consequently, before single-molecule long-read sequencing platforms became available [
97], poultry transcript structures could rarely be resolved on a large scale [
98]. The primary shift brought by long-read sequencing is moving the analytical focus from total gene expression to the specific transcripts and isoform compositions generated by individual genes.
Different long-read platforms prioritize different types of information and performance metrics. PacBio Iso-Seq yields highly accurate consensus reads and suits the resolution of transcript structures. ONT cDNA sequencing can often generate long reads at higher depth. ONT direct RNA sequencing reads native RNA molecules directly through nanopores, without a cDNA intermediate [
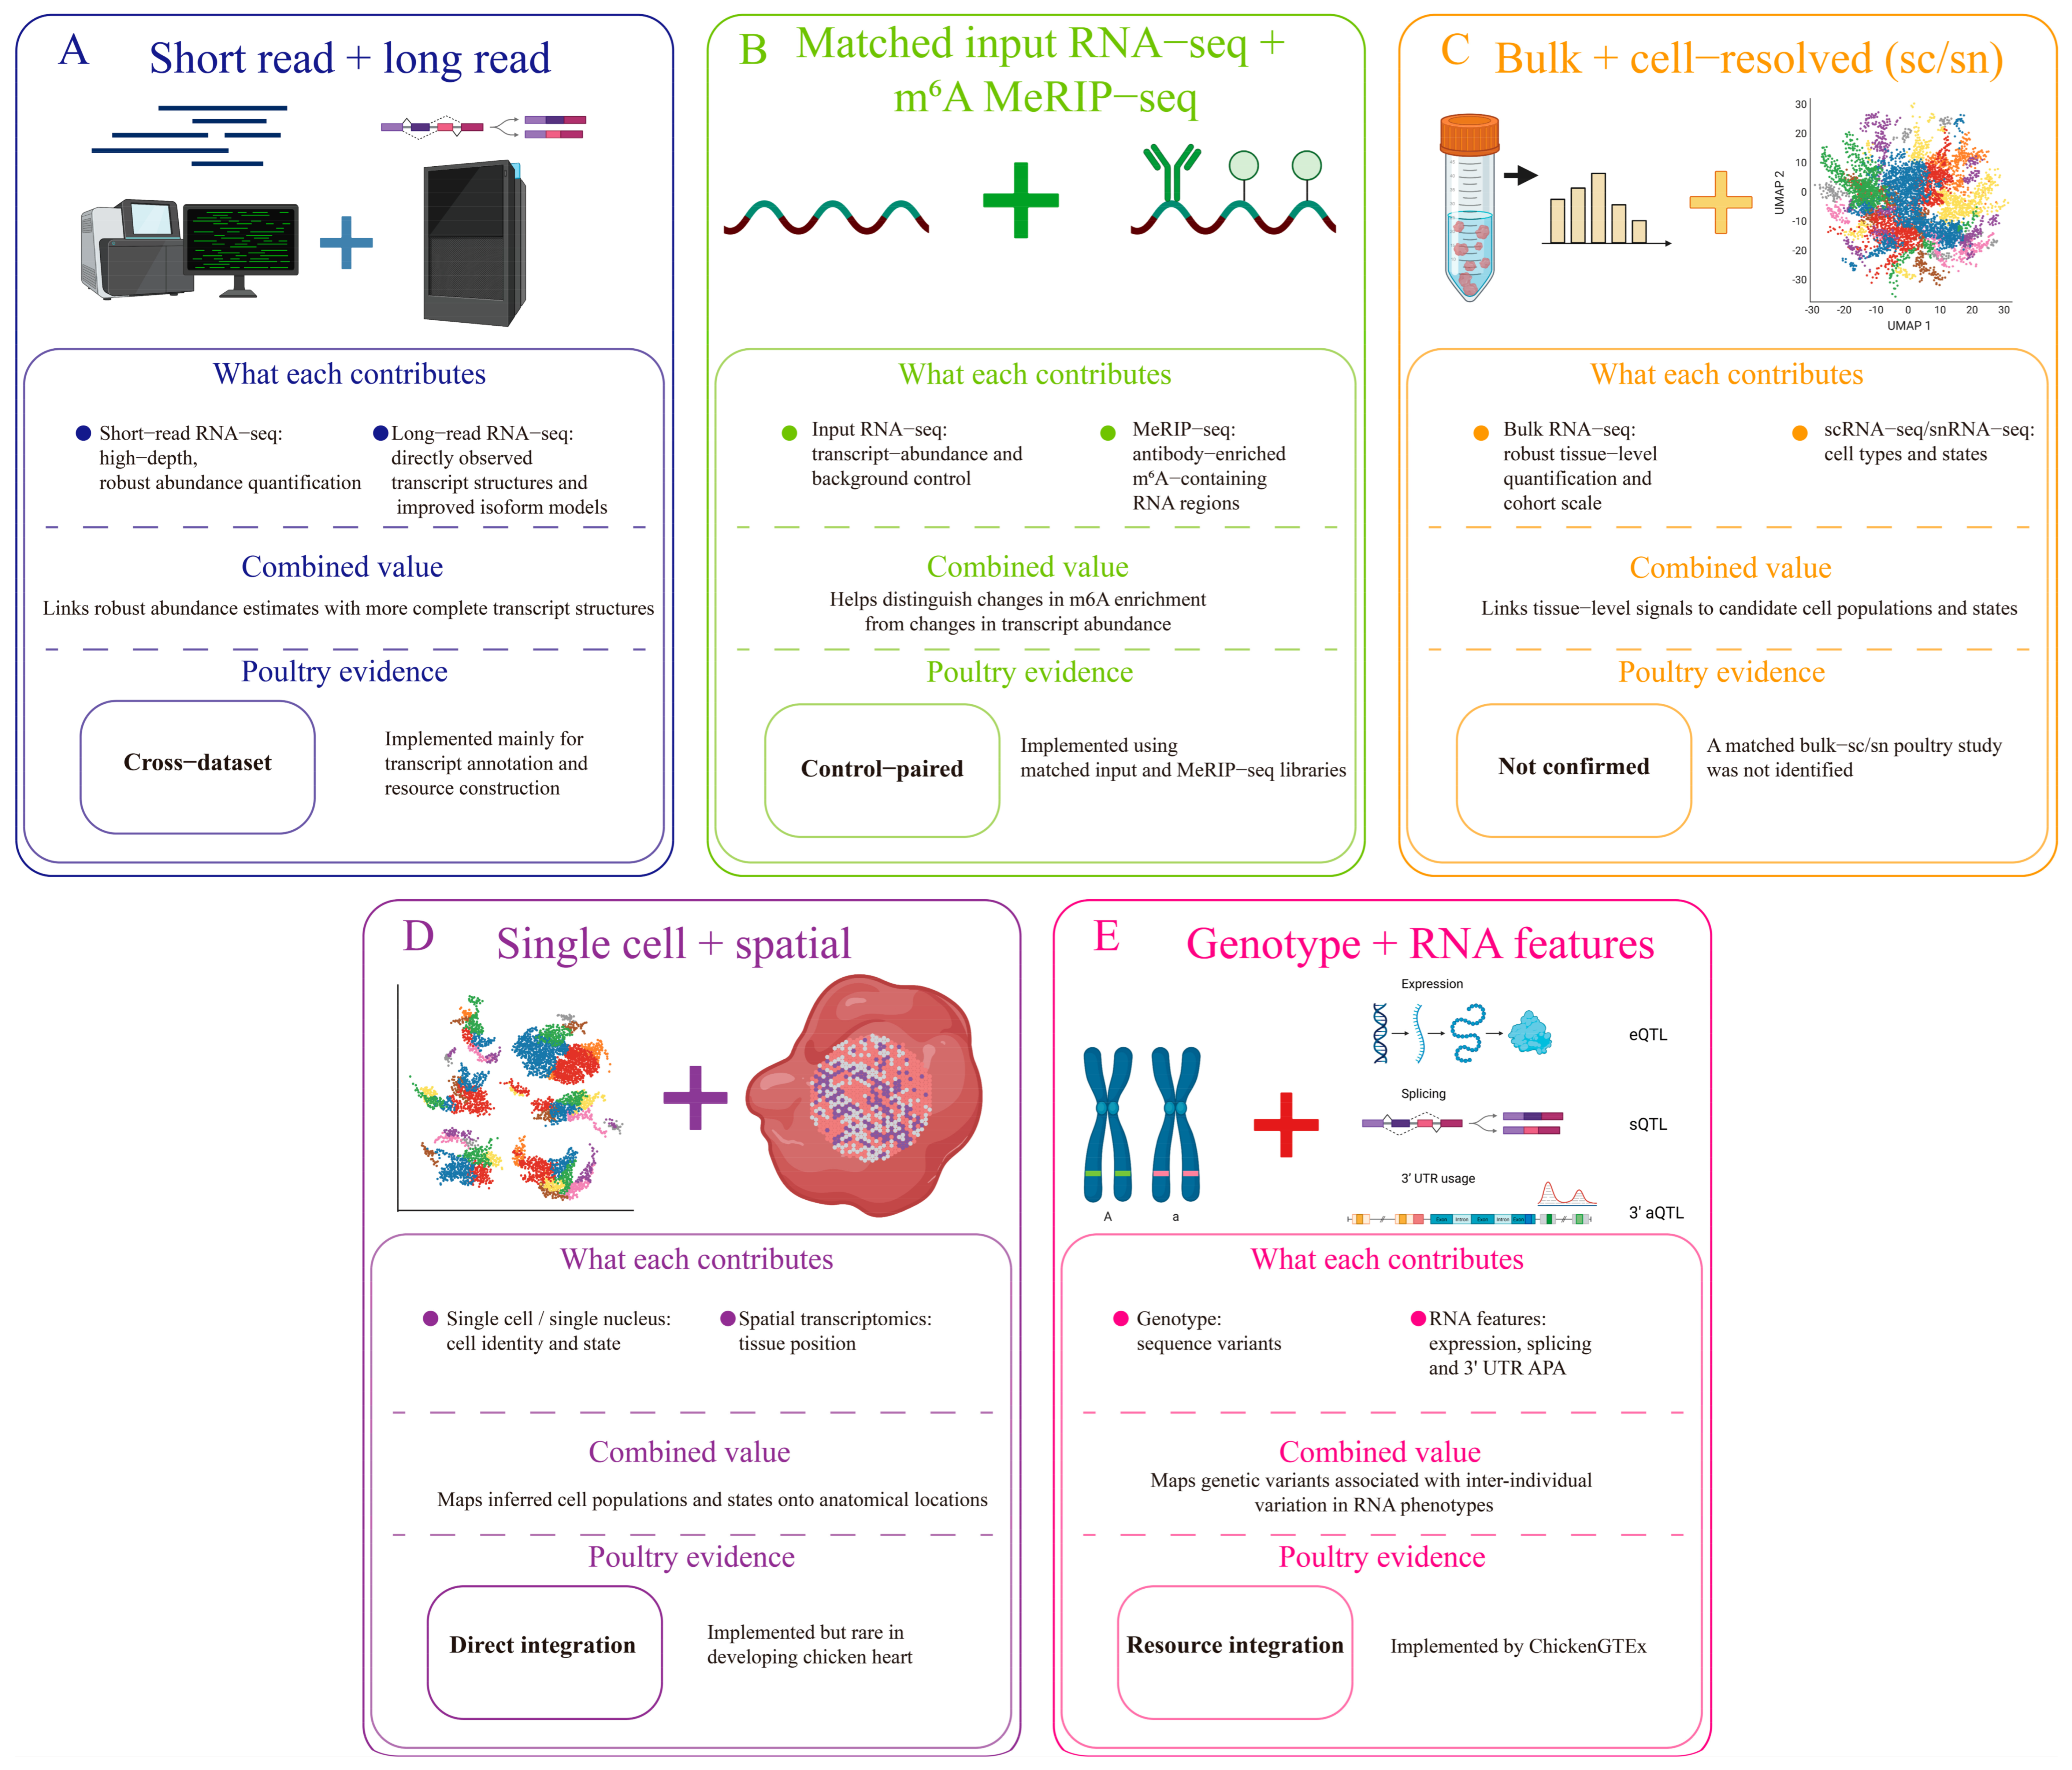
46]; this preserves molecular signals that may be lost during reverse transcription. Platform selection involves balancing throughput and cost, single-base accuracy, quantitative reliability, and native RNA information. ONT cDNA is typically more advantageous regarding throughput and cost, whereas Iso-Seq excels in single-base accuracy. The quantitative performance of different long-read library strategies is influenced by sequencing depth, molecular integrity, and library preparation biases. Direct RNA sequencing is often constrained by lower throughput and insufficient coverage of low-abundance transcripts, while cDNA methods can introduce biases related to reverse transcription and PCR. Because no single platform meets all requirements simultaneously, long-read data are frequently combined with short-read RNA-seq.
Long reads also do not guarantee full coverage of every RNA molecule. RNA degradation, incomplete reverse transcription, and coverage biases can all lead to truncated transcripts; thus, the term “full-length transcriptome” remains an approximate description [
99], and the final isoform catalogs heavily depend on the chosen analytical tools. In joint analyses, long reads are primarily used to define the structural architecture of transcripts originating from a locus, while higher-depth short reads are employed for abundance estimation and splice junction support. This assigns structural resolution and quantification to the data types best suited for each. ONT sequencing of 19 chicken tissues identified tens of thousands of isoforms, many absent from existing annotations, and achieved higher isoform classification accuracy than short-read methods [
26]. Related benchmark studies have further compared the abilities of different tools to recover and quantify isoforms [
13,
44], and early Iso-Seq studies of embryonic chicken hearts confirmed that analytical pipelines substantially alter transcript identification outcomes [
43]. Long-read sequencing is now expanding into waterfowl research. Multi-tissue PacBio Iso-Seq data in ducks established a full-length reference transcriptome, revealing thousands of alternative splicing events and lncRNAs missing from current annotations [
68]. ONT sequencing of duck embryonic myoblasts has characterized alternative splicing dynamics during muscle differentiation [
69]. These studies demonstrate that poultry, including chickens and ducks, are beginning to acquire the foundational resources necessary for transcriptome research at the isoform resolution.
Isoform-level resolution can fundamentally alter how trait-associated expression changes are interpreted. A gene showing “no change” at the overall gene level may still undergo an isoform switch that affects coding capacity or regulatory features, a change detectable only at transcript resolution [
8]. However, discovering an unannotated isoform is not synonymous with proving its involvement in phenotypic regulation [
32]. In the long-read poultry studies included in this review, the primary outcomes are largely transcript discovery and annotation, with direct functional validation of phenotype-associated isoforms remaining scarce [
26,
32,
68]. Direct RNA sequencing can also preserve native molecular signals related to RNA modifications, but modification calling relies on ionic current signals and computational models, and the results still require validation by independent methods [
15,
45,
46,
99]; this will be further discussed in
Section 3.3. Isoform validation is feasible in avian systems, but each available route carries a specific weakness. Isoform-specific RNA interference or antisense oligonucleotides can target a unique exon junction, but chicken primary myoblasts, hepatocytes and granulosa cells tolerate repeated transfection poorly, and shared-portion knockdown is hard to exclude. RNA-targeting CRISPR-Cas13 can in principle discriminate isoforms, yet junction-targeting guides also act on the linear parent transcript, so a Cas13 phenotype does not establish which isoform was responsible [
100,
101]. Ectopic expression of one isoform avoids the specificity problem but alters stoichiometry and, in birds, is performed in cultured cells, so the readout is cellular, not a production trait. The chicken
PLIN1 locus carries five verified transcript variants encoding four amino-terminally divergent proteins; nine further annotated transcripts remain computational predictions [
102]. Chicken
PPARγ produces five 3′ untranslated region isoforms by alternative polyadenylation that differ in translational efficiency without altering transactivation [
103]. Its two protein isoforms differ in their effects on preadipocytes [
104]. Dominant-isoform analysis separates fast- from slow-growing breeds in breast muscle [
105]. The prolactin receptor shows most directly why an isoform can matter independently of transcript abundance: the sex-linked late-feathering allele carries a partially duplicated copy encoding a carboxy-terminally truncated receptor that attenuates signalling in the embryo, together with a 5′ untranslated region splice variant that raises translational efficiency after hatching without altering the coding sequence, so the two variants act in opposite directions at different stages and neither effect is visible in gene-level expression [
106]. The same applies upstream in the same endocrine axis, where the goose dopamine D2 receptor, a broodiness candidate acting through prolactin secretion, is transcribed as four alternatively spliced variants whose tissue distributions differ, so a gene-level measurement in pituitary, ovary or hypothalamus averages over transcripts that are not present in the same places [
107]. An isoform switch is therefore not always a quantitative variation on one mechanism: a variant that loses an amino-terminal segment or a signal peptide can change where the product acts rather than how much of it is present, so testing it requires a readout matched to the proposed mechanism rather than total gene expression.
The field remains constrained by incomplete reference transcriptomes, differences in library preparation and platform, and dependence on analytical pipelines [
13,
44]. Recent pore chemistry and base-calling models have improved read accuracy. Context-dependent insertion and deletion errors nevertheless persist in direct RNA sequencing and affect open reading frame prediction, allele-specific analysis and modification calling [
99]. Isoform calls are limited by molecular integrity, transcript end definition, depth and algorithm choice; abundance estimates are further affected by library bias and by read assignment among similar isoforms. Most trait-associated isoforms should therefore be treated as candidate transcripts awaiting independent structural verification, functional perturbation and phenotypic validation.
3.3. Epitranscriptomic Technologies
RNA chemical modifications constitute an entirely different layer of information from sequence and abundance. Currently, poultry epitranscriptomic research predominantly focuses on N
6-methyladenosine (m
6A). This modification is catalyzed by the METTL3-METTL14 complex and recognized by specific reader proteins. While m
6A does not alter RNA sequences, it influences splicing, stability, localization, and translation, with precise effects depending on the cell type, the specific transcript, and the reader protein involved [
108,
109]. Importantly, different epitranscriptomic methods measure different targets, and their results should not be treated as equivalent tiers of modification evidence.
MeRIP-seq, which uses antibodies to enrich m
6A-containing RNA fragments, was one of the earliest methods employed to map transcriptome-wide m
6A landscapes [
16]. Its results generally manifest as modification enrichment peaks rather than precise single-base sites, with each peak potentially spanning dozens to hundreds of nucleotides. When multiple isoforms share the same region, peak signals often cannot be assigned to a specific transcript. The quantitative capacity of this method is also constrained; antibody batches, sample quality, sequencing depth, and peak-calling parameters can all impact final results, leading to only partial overlap between peaks identified in different experiments or studies [
34]. Moreover, MeRIP-seq must be interpreted in conjunction with an input RNA-seq library because immunoprecipitation signals are jointly influenced by modification levels and transcript abundance. An increased peak signal in one condition could reflect an actual change in methylation level, or it might simply reflect an upregulation in the corresponding RNA’s expression. Therefore, comparisons between conditions must focus on enrichment changes relative to input expression, rather than relying solely on raw peak intensity. High-resolution or single-base methods can further narrow the range of candidate sites, and targeted experiments can validate specific loci, as demonstrated with the conserved m
6A site in the chicken β-actin zipcode [
50]. Native RNA nanopore sequencing can also infer RNA modifications using ionic current shifts or base-calling deviations. Studies have reported candidate m
6A and m
5C signals in chicken ceca following
Campylobacter jejuni infection using this approach [
45]. However, these results rely on trained models and algorithms rather than direct chemical assays of the modifications; different tools can also yield highly discordant sets of candidate sites [
51]. Thus, antibody-enriched peaks, high-resolution candidate sites, independently validated sites, and nanopore-model inferred signals should be interpreted separately as fundamentally different forms of evidence.
To date, poultry m
6A research has explored the egg-laying process [
47], embryonic gonadal development [
70], preovulatory follicle selection [
48], fat deposition differences in broilers [
110], the coordinated changes in m
6A and miRNAs in embryonic breast muscle [
42], and m
6A remodeling in ALV-J-induced tumorous livers [
49]. These studies frequently measure the expression of modifying enzymes like METTL3 and FTO. However, a change in enzyme levels does not directly prove that the modification status of a specific transcript has changed. Enzyme abundance, target selection, and downstream effects mediated by reader proteins represent distinct mechanistic steps that must be independently verified. The clearest functional evidence thus far comes from muscle research. For example, METTL3 promotes the translation of circSIK2 and enhances chicken myoblast proliferation [
71]. METTL3-dependent m
6A modification of
GHR mRNA also regulates mitochondrial biogenesis during myoblast differentiation [
72]. These studies rely on more than just peak landscapes; they include subsequent validation of modifying enzymes, specific transcripts, or related phenotypes. Peak-level MeRIP-seq alone only indicates regional enrichment. It does not yield the modification stoichiometry of individual sites, nor is it sufficient to establish functional causality [
16]. Because RNA is fragmented during library preparation, peaks within shared sequence regions generally cannot be resolved for isoform-specific interpretation [
34]. If distinguishing heterozygous loci exist in the sample and both input and IP libraries have sufficient coverage, allele-specific enrichment can be analyzed, though such results require specialized statistical handling and experimental validation [
111,
112].
This field currently faces two primary constraints. First, the resolution of peak-level MeRIP-seq is insufficient to reliably differentiate isoform-specific or allele-specific modifications. Second, how different m
6A reader proteins dictate the fate of specific transcripts in poultry is mostly inferred from mammalian studies; direct evidence of RNA–protein binding in avian species remains lacking (a point elaborated in
Section 3.5). Beyond m
6A, modifications such as m
5C, pseudouridine, and RNA editing are rarely studied in poultry and are better viewed as future research frontiers rather than systematically resolved fields. Notably, single-base resolution absolute quantification methods like GLORI and m
6A-SAC-seq have been developed in mammalian studies, providing site-by-site m
6A methylation stoichiometry across the transcriptome. Adopting these technologies represents a critical next step for poultry epitranscriptomics to break through the resolution limits of peak-level assays and move toward single-base absolute quantification [
113,
114].
3.4. Single-Cell and Spatial Transcriptomics
Most of the aforementioned technologies measure bulk signals averaged across diverse cells within a tissue. With the scaled application of droplet-based cellular barcoding, single-cell RNA sequencing (scRNA-seq) can record expression profiles for individual cells; spatial transcriptomics retains the coordinate information of spatial spots, tissue regions, or single cells, depending on the platform [
17,
115]. These methods empower researchers to trace tissue-averaged expression back to specific cell types, cellular states, and their spatial distributions, an approach now in use in poultry research [
54,
60]. Their direct measurement readouts are typically the gene expression of single cells, nuclei, or spatial spots, whereas cell types, developmental trajectories, and cell–cell communication are inferred computationally based on these readouts.
scRNA-seq and single-nucleus RNA sequencing (snRNA-seq) analyze different pools of RNA. Droplet-based scRNA-seq captures cytoplasmic RNA well, but tissue dissociation can result in the loss of large, fragile, or hard-to-dissociate cells. snRNA-seq analyzes nuclear RNA, making it more suitable for frozen tissues and samples like muscle and fat, where intact single-cell suspensions are particularly difficult to obtain. Compared to scRNA-seq, snRNA-seq generally yields a higher proportion of intronic and lncRNA reads and may preserve cell types typically lost during dissociation [
64]. It is also essential to distinguish between directly measured expression and subsequent computational inferences. Pseudotime analysis orders cells based on transcriptional similarities to map potential state transitions, but this ordering is not a direct recording of true developmental time, and different algorithms can yield different trajectories from the same data [
116]. Similarly, cell–cell communication analyses based on ligand–receptor databases only propose potential signaling interactions; they cannot prove that molecular communication actually occurred, and the results are heavily influenced by the choice of algorithm and database [
117]. These technologies also have inherent measurement limitations. Standard droplet-based scRNA-seq typically has a 3′- or 5′-end bias, restricting analysis mostly to the gene level, thus failing to independently resolve full-length isoforms or RNA modifications in single cells. Spot-based spatial transcriptomic platforms often capture multiple cells within a single spot, necessitating computational deconvolution to estimate cell composition; the accuracy of this relies heavily on algorithms and reference data [
7]. Imaging-based spatial methods can achieve near-single-cell resolution but typically interrogate only a predefined, smaller panel of genes.
Cell type annotation presents another challenge in poultry research. Current analyses frequently borrow mammalian marker genes, yet some poultry cells lack species-validated markers, and orthologous genes may not exhibit identical expression patterns. Consequently, cell clusters often have to be named based on morphology, expression features, and cross-species analogies, resulting in varying degrees of confidence in cell type annotations. Poultry single-cell research also faces a unique barrier absent in mammals: mature avian red blood cells are nucleated (nRBCs) and transcriptionally active. In droplet-based scRNA-seq of blood or vascularized tissues, they produce substantial amounts of hemoglobin-related reads that consume the majority of sequencing throughput and interfere with cell clustering. The mitigation strategies in common use are not equivalent, because each changes which cells survive. Fluorescence-activated sorting removes erythrocytes most completely and enriches a defined leukocyte population. It costs viability, induces stress-response transcripts and discards cell types outside the sorting panel, so atlases built this way cannot report on the cells excluded upstream [
118,
119]. Avian-specific erythrocyte lysis is faster and preserves the unsorted composition. Nucleated avian erythrocytes lyse less predictably than mammalian ones, so residual haemoglobin reads and lysis-derived ambient RNA are common and fragile rare populations may be lost. Single-nucleus sequencing bypasses intact erythrocytes and works on frozen tissue, so it suits fibrous and lipid-rich tissues and embryonic liver [
59,
120], but reads nuclear RNA only and loses cytoplasmic transcripts. Blood and vascularized tissues therefore favour sorting or lysis with the residual erythrocyte read fraction reported; muscle, adipose and archived tissues favour single-nucleus protocols. Spatial transcriptomic platforms fall into two main categories, each with trade-offs. Sequencing-based spatial barcoding methods (e.g., Visium, Stereo-seq [
121]) provide unbiased whole-transcriptome information, but traditional spatial spots encompass multiple cells. Their latest iterations (e.g., Visium HD) have reduced capture areas to the micron scale, approaching subcellular or single-cell resolution [
66]. Imaging-based in situ hybridization methods (e.g., Xenium, MERFISH [
65]) offer near-single-cell or subcellular resolution but are generally constrained to analyzing pre-designed, limited gene panels dependent on probe library capacity. Current inferences about cell–cell communication in poultry depend heavily on ligand–receptor databases built from human and mouse data (e.g., CellPhoneDB [
122]). However, the repertoires of immune ligands and receptors, such as avian chemokines and their receptors, diverge substantially from those of mammals and lack complete correspondence in gene number and family composition [
123]. Directly applying mammalian databases is therefore prone to yielding false-positive or false-negative communication inferences. No curated avian ligand–receptor database is available, and renaming orthologues does not solve the problem, because differences in gene number and family composition leave some mammalian pairs without an avian counterpart and some avian receptors without an entry to inherit. A workable interim strategy is a restricted, species-anchored list built on the annotated chicken chemokine and receptor repertoire [
123]. Mammalian pairs are retained only when both partners have a one-to-one avian orthologue with conserved domain architecture. Surviving predictions are hypotheses, tested by showing expression of both partners in the proposed sender and receiver cells. Studies using an unmodified mammalian database should report its version and the proportion of pairs mappable to avian orthologues [
117,
122].
Despite these limitations, single-cell and spatial methods have substantially improved the cellular resolution of poultry tissues. Developmental and organ atlases now cover the heart [
54], limb bud [
55], and retina [
53], extending into behavioral and neural tissues [
124], and a comprehensive framework for poultry single-cell atlases is emerging [
28]. Single-nucleus sequencing has further identified myoblast subpopulations associated with muscle growth [
59]. Currently, the most widespread applications are in immunology, including atlases of leukocytes and PBMCs [
119,
125], lymphoid organs [
118], and infection or challenge responses in the bursa of Fabricius [
126], spleen [
57], cecum [
58], and PBMCs [
127]. Comparisons between disease-resistant and susceptible individuals have linked variations in cell composition and states to resistance phenotypes [
74,
128]. Spatial transcriptomics remains far less used: the poultry term set returns 15 records (
Table 1), and poultry applications currently include the developing chicken heart and breast muscle [
54,
56,
60]. Spatial and single-nucleus profiling of the avian optic tectum in non-poultry birds shows the approach transfers [
75], so the limit is study design and platform access, not species feasibility. These results can indicate what cells or tissue regions a signal originates from, but spatial localization alone does not prove the functional role of the signal. Overall, while single-cell and spatial transcriptomics contribute essential cellular origin and spatial location data to poultry research, their interpretations are jointly dictated by sample processing, computational inference, cell annotation accuracy, and platform resolution.
3.5. RNA Structure, RNA–Protein Interactions, and Translation
RNA structure, RNA–protein interactions, and translation states further broaden the scope of RNA-omics, but their application in poultry remains highly limited. Transcriptome-wide chemical probing methods, such as DMS-seq and icSHAPE, investigate RNA structures and their dynamics by measuring nucleotide accessibility [
20,
67]. Within the search scope of this review, no reports of these methods being applied transcriptome-wide to poultry hosts were found. The study of m
6A-dependent ZBP1 binding in the chicken β-actin zipcode [
50] provides evidence of RNA–protein interaction at a specific locus but does not constitute transcriptome-wide RNA structure probing.
RNA-binding proteins (RBPs) are integral to splicing, stability, localization, and translation regulation, yet poultry research still lacks systematic, transcriptome-wide RNA–protein interaction maps. Taking the m
6A reader mechanisms discussed in
Section 3.3 as an example, studies using cross-linking immunoprecipitation methods like CLIP or eCLIP to directly map the binding sites of poultry reader proteins are exceptionally rare [
62], despite these methods being widely employed in mammals. The execution of CLIP/eCLIP generally relies on antibodies capable of effectively immunoprecipitating the target RBP; in the absence of suitable antibodies, validated epitope-tagged RBP systems can serve as alternatives [
62]. The current paucity of literature is better understood as an evidence gap in poultry research rather than a fundamental inapplicability of the technology to avian species.
Ribosome profiling (Ribo-seq) evaluates RNA translation states and efficiency by sequencing ribosome-protected fragments [
19]. Compared to conventional bulk RNA-seq, its application in poultry is sparse but not entirely absent, with studies exploring chicken spleen, reproductive tissues, brain tissue, embryonic tissues, and primary myoblasts [
71,
129,
130,
131]. Its successful execution demands stringent control over the preservation of ribosome states, nuclease digestion, rRNA depletion, species-specific read mapping, and quality assessment of trinucleotide periodicity [
19]. Currently, it is more accurate to view ribosome profiling as an emerging technology in poultry research rather than an unapplied one. Another emerging value of ribosome profiling is breaking the traditional boundary between “coding” and “non-coding” RNA: by detecting short open reading frames (sORFs) occupied by ribosomes, functional micropeptides can be discovered in RNAs previously deemed non-coding. One chicken study combined RNA-seq with Ribo-seq to identify a 74-amino-acid micropeptide encoded by an lncRNA, proving it regulates myoblast proliferation and differentiation [
132]. This strategy could add a new functional layer to studies of poultry traits, such as muscle development.
Overall, while the methodological foundations for studying RNA structure, RNA–protein interactions, and translation states are well-established elsewhere, systematic data in poultry remain deficient. This highlights that current poultry RNA-omics evidence is heavily skewed toward expression abundance, isoforms, modifications, and cellular origins, leaving substantial room for expansion into structural, protein-binding, and translational layers. Transcriptome-wide structure probing needs microgram amounts of intact RNA per condition and a reactivity-to-structure model calibrated in the organism studied; without avian benchmark datasets, reactivity cannot be separated from degradation. CLIP and eCLIP need an antibody that immunoprecipitates the target protein under stringent conditions; antibodies against avian RNA-binding proteins are largely unavailable and rarely validated for immunoprecipitation, and expressing an epitope-tagged protein instead requires a transfectable or transgenic avian system, which returns to the germline bottleneck discussed in
Section 6.4. The one published avian application, CLIP of the splicing regulator CELF1 in embryonic chicken heart, identified individual targets, not a transcriptome-wide binding map, which marks both feasibility and the ceiling [
61]. Ribosome profiling needs translation arrested within seconds, species-specific rRNA depletion and an annotation complete enough to assign footprints to open reading frames. Chicken depletion reagents and short open reading frame annotation are less developed than their mammalian equivalents, so avian studies are sparse, not absent [
71,
129,
130,
131,
132]. Single-base modification mapping additionally needs chemistry-specific reference standards, which exist for mammalian transcriptomes only [
52,
113,
114]. These are reagent and resource gaps rather than biological barriers, and each has a defined remedy.