Article

Integrated Transcriptomic Analysis of Liver and Muscle Tissues Reveals Candidate Genes and Pathways Regulating Intramuscular Fat Deposition in Beef Cattle

1
College of Animal Science and Technology, Hebei Agricultural University, Baoding 071000, China
2
Key Laboratory of Crop Cultivation Physiology and Green Production of Hebei Province, Institute of Cereal and Oil Crops, Hebei Academy of Agriculture and Forestry Sciences, Shijiazhuang 050035, China
*
Authors to whom correspondence should be addressed.
These authors contributed equally to this work.
Animals 2025, 15(9), 1306; https://doi.org/10.3390/ani15091306
Submission received: 24 February 2025 / Revised: 27 March 2025 / Accepted: 29 April 2025 / Published: 30 April 2025
(This article belongs to the Section Animal Genetics and Genomics)

Simple Summary

Improving beef marbling is critical for meeting market demands. Still, it remains difficult due to the complicated biological processes of intramuscular fat deposition. While crossbreeding Wagyu and Angus cattle becomes popular in China to produce premium marbled beef, the genetic mechanism behind this process remains unclear. To elucidate the complex mechanisms of intramuscular fat deposition, we performed transcriptomic analyses of liver and muscle tissues from Wagyu–Angus crossbred cattle with differing intramuscular fat levels. Analysis revealed over 1300 differentially expressed genes, with sixty genes exhibiting differential expression in both tissues. Further analysis identified eleven key candidate genes as potential regulators, and the PPAR signaling pathway and fatty acid β-oxidation pathway play important roles in this process. Finally, we constructed a “liver–muscle” regulatory network of IMF deposition to illustrate the tissues’ interaction. Our findings provide valuable genetic markers for selectively breeding cattle with higher IMF content, improving beef quality, and increasing farmers’ financial advantages.

Abstract

Intramuscular fat (IMF) content in beef cattle is a critical determinant of beef meat quality, as it positively influences juiciness, tenderness, and palatability. In China, the crossbreeding of Wagyu and Angus is a prevalent method for achieving a better marbling level. However, the molecular mechanisms governing IMF regulation in these crossbreeds remain poorly understood. To elucidate the mechanism of IMF deposition in these crossbred cattle, we conducted a comparative transcriptomic analysis of longissimus dorsi muscles and livers from cattle with divergent IMF content. RNA-seq revealed 940 and 429 differentially expressed genes (DEGs) in the liver and muscle, respectively, with 60 genes co-differentially expressed (co-DEGs) in both tissues. Functional enrichment highlighted lipid metabolism pathways including fatty acid β-oxidation, PPAR signaling, and glycerolipid metabolism. A total of eleven genes including ACAA2, ACADL, ACOX2, CPT1B, CPT2, LPL, SLC27A1, ACAT1, GK, ACOX3, and ACSM5, were screened as key candidate genes for IMF deposition. A “liver–muscle” regulatory network of IMF deposition was built to illustrate the tissues’ interaction. The reliability of the transcriptomic data was verified by quantitative reverse real-time PCR (qRT-PCR). Our findings provide novel molecular markers for increasing the IMF content and accelerating the genetic improvement of beef quality traits in crossbred cattle.

1. Introduction

The rapid economic growth and urbanization in China has elevated consumer demand for premium beef characterized by superior sensory attributes (e.g., tenderness, juiciness) and nutritional value [1]. Therefore, breeding efforts for beef cattle now prioritize improving the quality of the meat, particularly with respect to intramuscular fat (IMF) content. IMF—which consists of lipid droplets within muscle cells and interspersed adipose tissue among muscle fibers [2]—deposition occurs predominantly during the late fattening phase, making it one of the most metabolically challenging and economically costly traits to optimize [3]. However, the IMF adipocytes, possessing smaller size and higher unsaturated fatty acids content compared to other adipose tissues, play a pivotal role in enhancing the meat’s flavor, juiciness, and tenderness [4,5,6], thereby amplifying the market value of high-marbled beef. Consequently, deciphering the molecular regulation of IMF deposition has become a central focus for improving both meat quality and production efficiency.
The synthesis of IMF is regulated by various factors, including genetics, breed, management, and nutrition [7], with the breed being the most critical. Among various breeds, Wagyu cattle have the highest IMF content, reaching 36.5% in the longissimus dorsi (LD) muscle, followed by Korean cattle at 13.7%, and Angus at 9.3% [7]. The deposition of intramuscular fat is a complex process that involves a highly coordinated program of gene expression. Numerous molecules have been identified as playing key roles in regulating this formation process, including candidate genes represented by FABPs [8,9], AdipoQ [10,11], MC4R [12], LPL [13], SCD [14], and FASN [15]. Additionally, this process is significantly influenced by transcription factors that regulate adipocyte differentiation, including the PPAR family [16], C/EBP family [17], RAR family [18], and SREBP family [14,19], as well as non-coding RNAs (ncRNAs) that participate in regulation [20,21,22,23]. Furthermore, the application of high-throughput transcriptome sequencing has significantly advanced the understanding of the regulatory mechanisms affecting IMF in cattle. Yu et al. conducted RNA sequencing on Qinchuan, Nanyang, and Japanese black cattle, uncovering that ITGB1 serves as the essential gene linked to IMF content [24]. Meanwhile, Wang et al. employed whole transcriptome sequencing examining seven different tissues from Jiaxian red cattle to elucidate the complexities of fat deposition processes [25]. Experiences in production indicate that cattle of the same breed when raised in identical environments and fed the same diet, can exhibit markedly different levels of IMF. This variation suggests that the genetic potential of each individual can have a substantial impact on the deposition of IMF [26]. However, most research has focused on inter-breed differences, leaving the genetic mechanisms underlying IMF deposition within specific breeds unclear, and the effective molecular markers for improving IMF content in cattle remain to be fully explored and require further investigation.
In China, due to restrictions on the import of Wagyu cattle, crossbreeding Australian Wagyu with Angus cattle has become the most common way to produce high-quality meat. However, research on the IMF regulation in the crossbred remains limited. Furthermore, being the primary metabolic organ, the liver is critical to lipid metabolism and is actively involved in fatty acid synthesis, degradation, and transport, as well as lipoprotein assembly and secretion [27,28]. Studying the liver alongside muscle could help clarify the mechanism of IMF deposition. Therefore, we employed RNA-Seq technology to conduct comparative transcriptomics analysis on the LD muscle and liver tissues of Wagyu and Angus crossbred individuals with significantly different IMF content. Moreover, we also studied the cellular morphology of myocytes and adipocytes with different IMF content. Our research aims to pinpoint genes that are differentially expressed (DEGs) and the pathways linked to the regulation of IMF, which could provide valuable molecular markers for increasing IMF content in beef and accelerating genetic improvement of beef quality.

2. Materials and Methods

2.1. Animals and Sample Collection

Wagyu × Angus crossbred F1 bulls (n = 26) were maintained under uniform housing and dietary conditions and slaughtered at 28 months of age with an average carcass weight of 324.0 ± 17.66 kg. Animals were fed a Total Mixed Ration (TMR) formulated to meet NRC (2016) [29] requirements for finishing beef cattle. The diet contained 55% corn, 15% alfalfa hay, 12% soybean meal, 4% fat powder (dry matter basis) and so on, providing 14.0% crude protein and 12.6 MJ/kg metabolizable energy. Full dietary composition and nutritional profiles are detailed in Supplementary Table S11. The procedures for slaughtering and sampling followed the established guidelines for the care and use of experimental animals. The experiments were conducted following the Regulations governing the Administration of Affairs Related to Experimental Animals and received approval from the Animal Research Committee at Hebei Agricultural University (approval number: 2024170; date of approval: 13 December 2024).
After slaughter, liver and LD muscle samples at the 12–13th rib were collected, trimmed to remove external fat and connective tissue, and portioned for IMF quantification, hematoxylin-eosin (HE) staining, and RNA extraction. The samples designated for IMF measurement were stored in frozen CO2 and then at −20 °C until use; the samples meant for HE staining were kept in test tubes with Tissue Fixation Solution (Servicebio, Wuhan, China), while the samples for RNA extraction were rapidly frozen in liquid nitrogen and maintained at −80 °C until required.

2.2. IMF Measurements

The content of IMF in LD muscle samples was measured using the Soxhlet extraction technique. First, meat tissues were pulverized using a meat grinder, then about 3 g of meat was weighed in each bottle and hydrolyzed using hydrochloric acid (100 mL, 2 mol/L) in a water bath maintained at 80 °C for 1 h, followed by drying at 105 °C for 1 h. An extraction solution of petroleum ether, boiling between 30 and 60 °C, was employed, with the samples extracted at 60 °C for 5 h. After extraction, the samples were heated and dried for 2 h. Subsequently, the samples were cooled to room temperature to measure the IMF content. The IMF content (%) was calculated using the following formula:
x = m 1 m 0 m 2 × 100 %
m1 represents the weight of the receiving bottle with the extracted IMF (g), m0 signifies the receiving bottle’s net weight (g), and m2 indicates the weight of the tested sample.

2.3. HE Staining

Three LD muscle samples exhibiting high and low intramuscular fat content were selected. Following the procedure described by Matsunari et al. [30], tissue samples were fixed in Tissue Fixation Solution for 24 h to ensure consistent preservation across all samples. Paraffin slices (7 μm) were then produced and stained with HE (hematoxylin: 5 min; eosin: 4 min). Slides were scanned using an Aperio AT2 digital scanner (Leica Microsystems, Shanghai, China), and images were analyzed using Aperio ImageScope x64 software (version 12.4.6, Aperio Technologies, Vista, CA, USA). Measurements of diameter (longest axis for adipocytes; shortest axis for myocytes), perimeter (cellular boundary length), and area (two-dimensional projection) were obtained for at least 200 myocytes and adipocytes per section, from at least three sections per sample. Only round, intact cells were selected to minimize measurement error.

2.4. RNA Extraction, RNA-Seq Library Construction, and Sequencing

Based on the distribution of IMF values, samples were classified into high-IMF (n = 4, IMF content ≥ 25%) and low-IMF groups (n = 4, IMF content ≤ 15%). The threshold values for high and low IMF were determined based on the upper and lower quartiles of the IMF distribution, respectively. Samples were designated as high liver (HL), high muscle (HM), low liver (LL), and low muscle (LM) groups. Total RNA was extracted using Trizol® reagent (Invitrogen, Waltham, MA, USA), and its integrity was assessed by agarose gel electrophoresis and NanoDrop spectrophotometry (RIN ≥ 7.0). A total of 3 μg of total RNA was used to purify mRNA using poly-T magnetic beads. DNA libraries were then prepared through fragmentation, cDNA synthesis, end-repair, A-tailing, and adapter ligation using Illumina PE adapters (Illumina, San Diego, CA, USA). Libraries were size-selected (400–500 bp) with AMPure XP beads (Beckman Coulter, Brea, CA, USA), amplified by 15 cycles of PCR using Illumina PCR Primer Cocktail (Illumina, San Diego, CA, USA), purified again with AMPure XP beads, and quantified using an Agilent Bioanalyzer 2100 system (Agilent Technologies, Santa Clara, CA, USA). The final libraries were sequenced at 150 bp bipartite on the NovaSeq 6000 platform (Illumina, San Diego, CA, USA) (Shanghai Parsonage Biotechnology Co., Ltd., Shanghai, China). The raw sequencing data have been submitted to the NCBI database (accession number: PRJNA1225315).

2.5. Transcriptome Data Processing and Differential Gene Expression Analysis

Raw sequencing reads (fastq format) were processed to obtain clean reads using fastp (v0.22.0). Clean reads were then mapped to the ARS-UCD2.0 bovine reference genome (https://www.ncbi.nlm.nih.gov/datasets/genome/GCF_002263795.3/ (accessed on 9 September, 2024)) using HISAT2 (v2.1.0). Read counts per gene were quantified using HTSeq (v0.9.1) and normalized to FPKM (Fragments Per Kilobase Million). Differentially expressed genes (DEGs) were identified using DESeq2 (v1.38.3) with thresholds of |log2FoldChange| > 1 and p-value < 0.05. ComplexHeatmap (v2.16.0) was used for bi-directional hierarchical clustering of samples based on gene expression, using Euclidean distance and complete linkage.

2.6. Functional Enrichment and Network Analysis

Gene Ontology (GO) enrichment analysis was performed using ClusterProfiler (v4.6.0) to identify significantly enriched GO terms (p < 0.05), providing insights into the biological functions of DEGs. Kyoto Encyclopedia of Genes and Genomes (KEGG) pathway enrichment analysis was also conducted using ClusterProfiler (v4.6.0), focusing on pathways with p < 0.05. Protein–protein interaction (PPI) network analysis was performed using the STRING database (accessed on 21 January 2024) to reveal relationships between target genes. The resulting PPI network was visualized using Cytoscape (version 3.8.0), and plots were generated using the CNSknowall platform (https://cnsknowall.com (accessed on 13 November 2024)).

2.7. qRT-PCR Validation of RNA-Seq Results

To validate the RNA-Seq results, we performed qRT-PCR on 14 selected genes. Total RNA was reverse transcribed using the PrimeScript™ FAST RT reagent Kit. Gene expression (ACSL4, IRF7, HRG, PLTP, CD74, HK2, GPAM, ACOX3, LIPE, LPL, CPT1B, EBPL, RET, and PARP14) was quantified using a CFX Opus 384 Real-Time PCR System with ACTB as a reference gene. Primers were designed using Primer-BLAST (Supplementary Table S1, https://www.ncbi.nlm.nih.gov/tools/primer-blast/, accessed on 22 January 2024). qRT-PCR was performed with a 10 μL reaction volume with 5 μL TB Green® Premix Ex Taq™ II FAST qPCR (Takara, Shiga, Japan), 0.2 μL of 10 μM primers each, 3 μL of cDNA dilution 1:5, and 1.6 μL DNase-RNase Free H2O, and thermal cycling conditions included 40 cycles of 95 °C for 5 s and 60 °C for 30 s. Primer efficiency ranged from 1.87 to 2.00 (R2 ≈ 0.99). Gene expression was calculated using the 2−∆∆Ct method.

2.8. Statistical Analysis

Statistical analyses were performed using SPSS (version 22.0; IBM Corp.) and GraphPad Prism (version 10.0; GraphPad Software). Data were tested for normality (Shapiro–Wilk) and homogeneity of variances (Levene’s test). Group comparisons were conducted using unpaired t-tests (p < 0.05). Pearson correlation coefficients (r) were calculated to evaluate associations between gene expression and IMF content, with p-values adjusted for multiple comparisons (Benjamini–Hochberg FDR). A priori power analysis (G*Power, version 3.1.4) confirmed adequate sample size (α = 0.05, power = 0.8, Cohen’s d = 1.2). Data are presented as mean ± SD.

3. Results

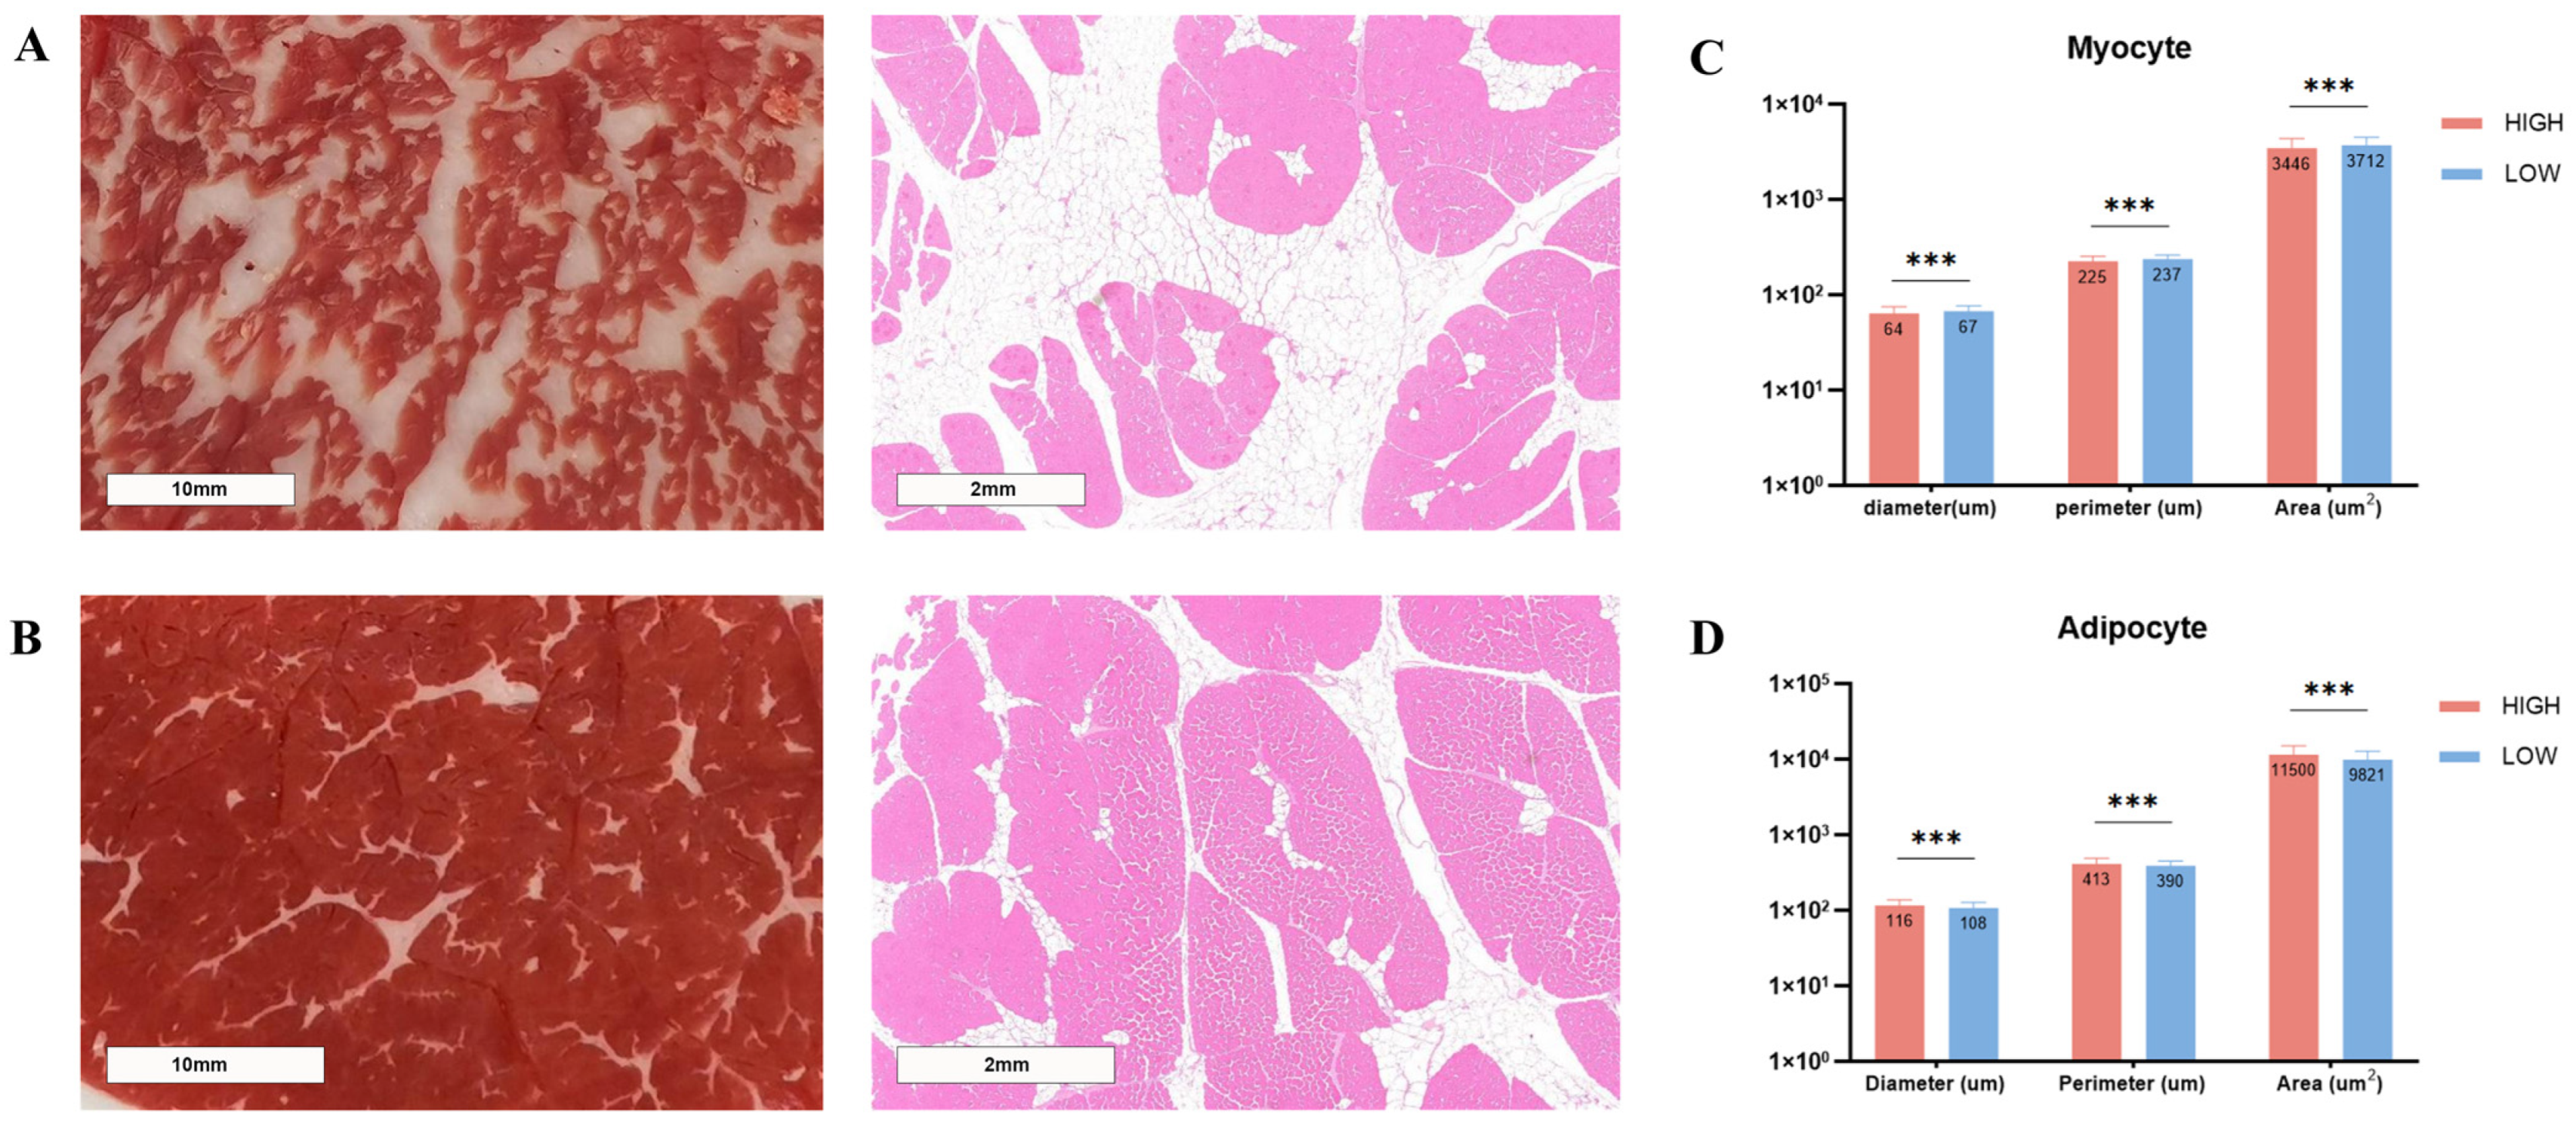
3.1. Differences in Meat Quality of Cattle with Different IMF Contents

Four samples with a high level of IMF and four with a low level were selected from the collected samples, ensuring similar carcass weights (p > 0.05). These were grouped as high and low IMF groups and analyzed for slaughtering performance and meat quality traits (Table 1). The high IMF group exhibited significantly higher IMF content (29.02 ± 6.28% vs. 11.70 ± 1.10%, p = 0.01) and marbling score (p < 0.01) than the low IMF group. Differences in fat and meat color were not statistically significant (p > 0.05).

3.2. Morphological Differences Among LD Muscle with Different Levels of IMF Content

HE staining was applied to LD muscles between HM and LM groups and revealed a marked difference in fat distribution (Figure 1). The high IMF group (Figure 1A) showed substantially greater intramuscular adipocyte density than the low IMF group (Figure 1B), confirming the previously determined IMF content. According to morphometric analysis, myocytes in the HM group had significantly reduced cell diameter, perimeter, and area (p < 0.01) (Figure 1C), while adipocytes were significantly larger (p < 0.01) than those in the LM group (Figure 1D).

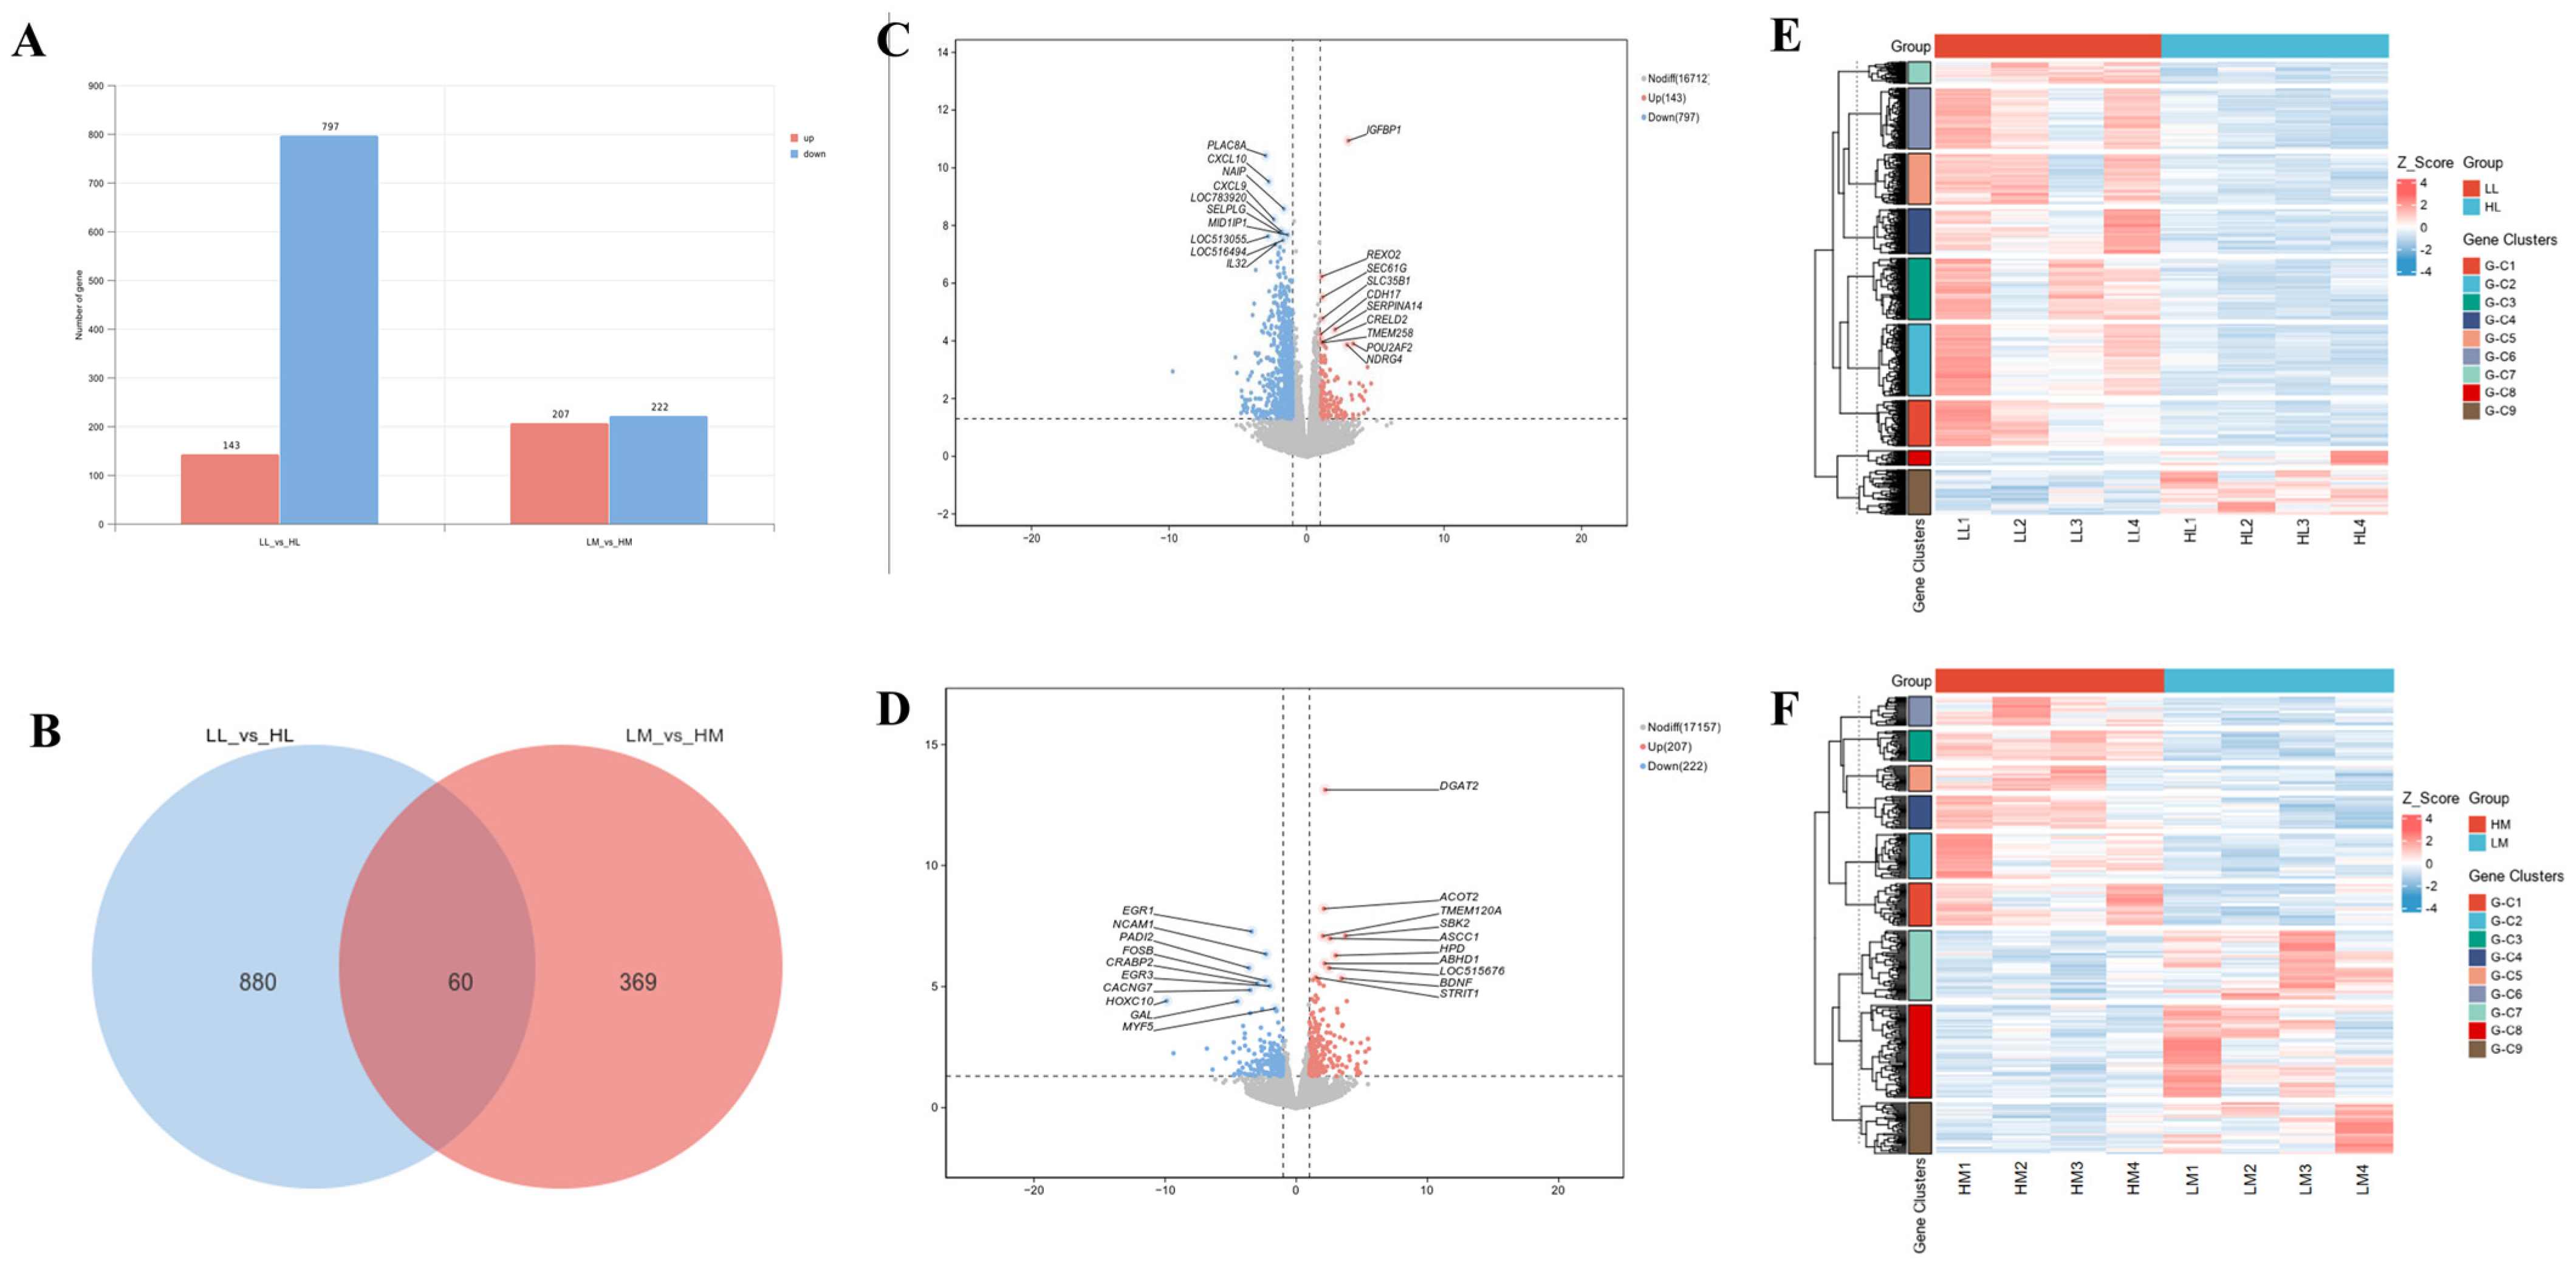
3.3. Summary of RNA-Seq Results and Identification of DEGs

After processing 16 samples for transcriptome sequencing, 115.17 Gb of clean data were produced. The RNA-Seq data are summarized in Supplementary Table S2. At least 6.32 Gb of clean data were generated for each sample, and the quality score of Q30 was achieved from 92.86% to 96.44%. Clean reads from each sample were mapped to the reference genome ARS-UCD2.0. The mapping ratio of each sample against the reference genome ranged from 91.49% to 98.44%.
DEG analysis (p < 0.05, |log2FC| ≥ 1) identified 940 DEGs in the liver (LL vs. HL) and 429 DEGs in the muscle (LM vs. HM) (Figure 2A, Supplementary Tables S3 and S4), with 60 genes co-differentially expressed (co-DEGs) in both tissues (Figure 2B, Supplementary Table S5). Specifically, HL showed 143 upregulated and 797 downregulated genes compared to LL, while HM showed 207 upregulated and 222 downregulated genes compared to LM. Notable DEGs included IGFBP1, REXO2 (upregulated), PLAC8A, CXCL10, NAIP (downregulated) in liver (Figure 2C), and DGAT2, ACOT2, ABHD1 (upregulated), EGR1, NCAM1, MYF5 (downregulated) in muscle (Figure 2D). The z-score-transformed gene expression data were also subjected to unsupervised hierarchical clustering using Euclidean distance with complete linkage. K-means partitioning (k = 9) successfully clustered liver and muscle samples into distinct groups based on IMF contents, supporting the existence of tissue-specific transcriptional programs regulating IMF deposition (Figure 2E,F).

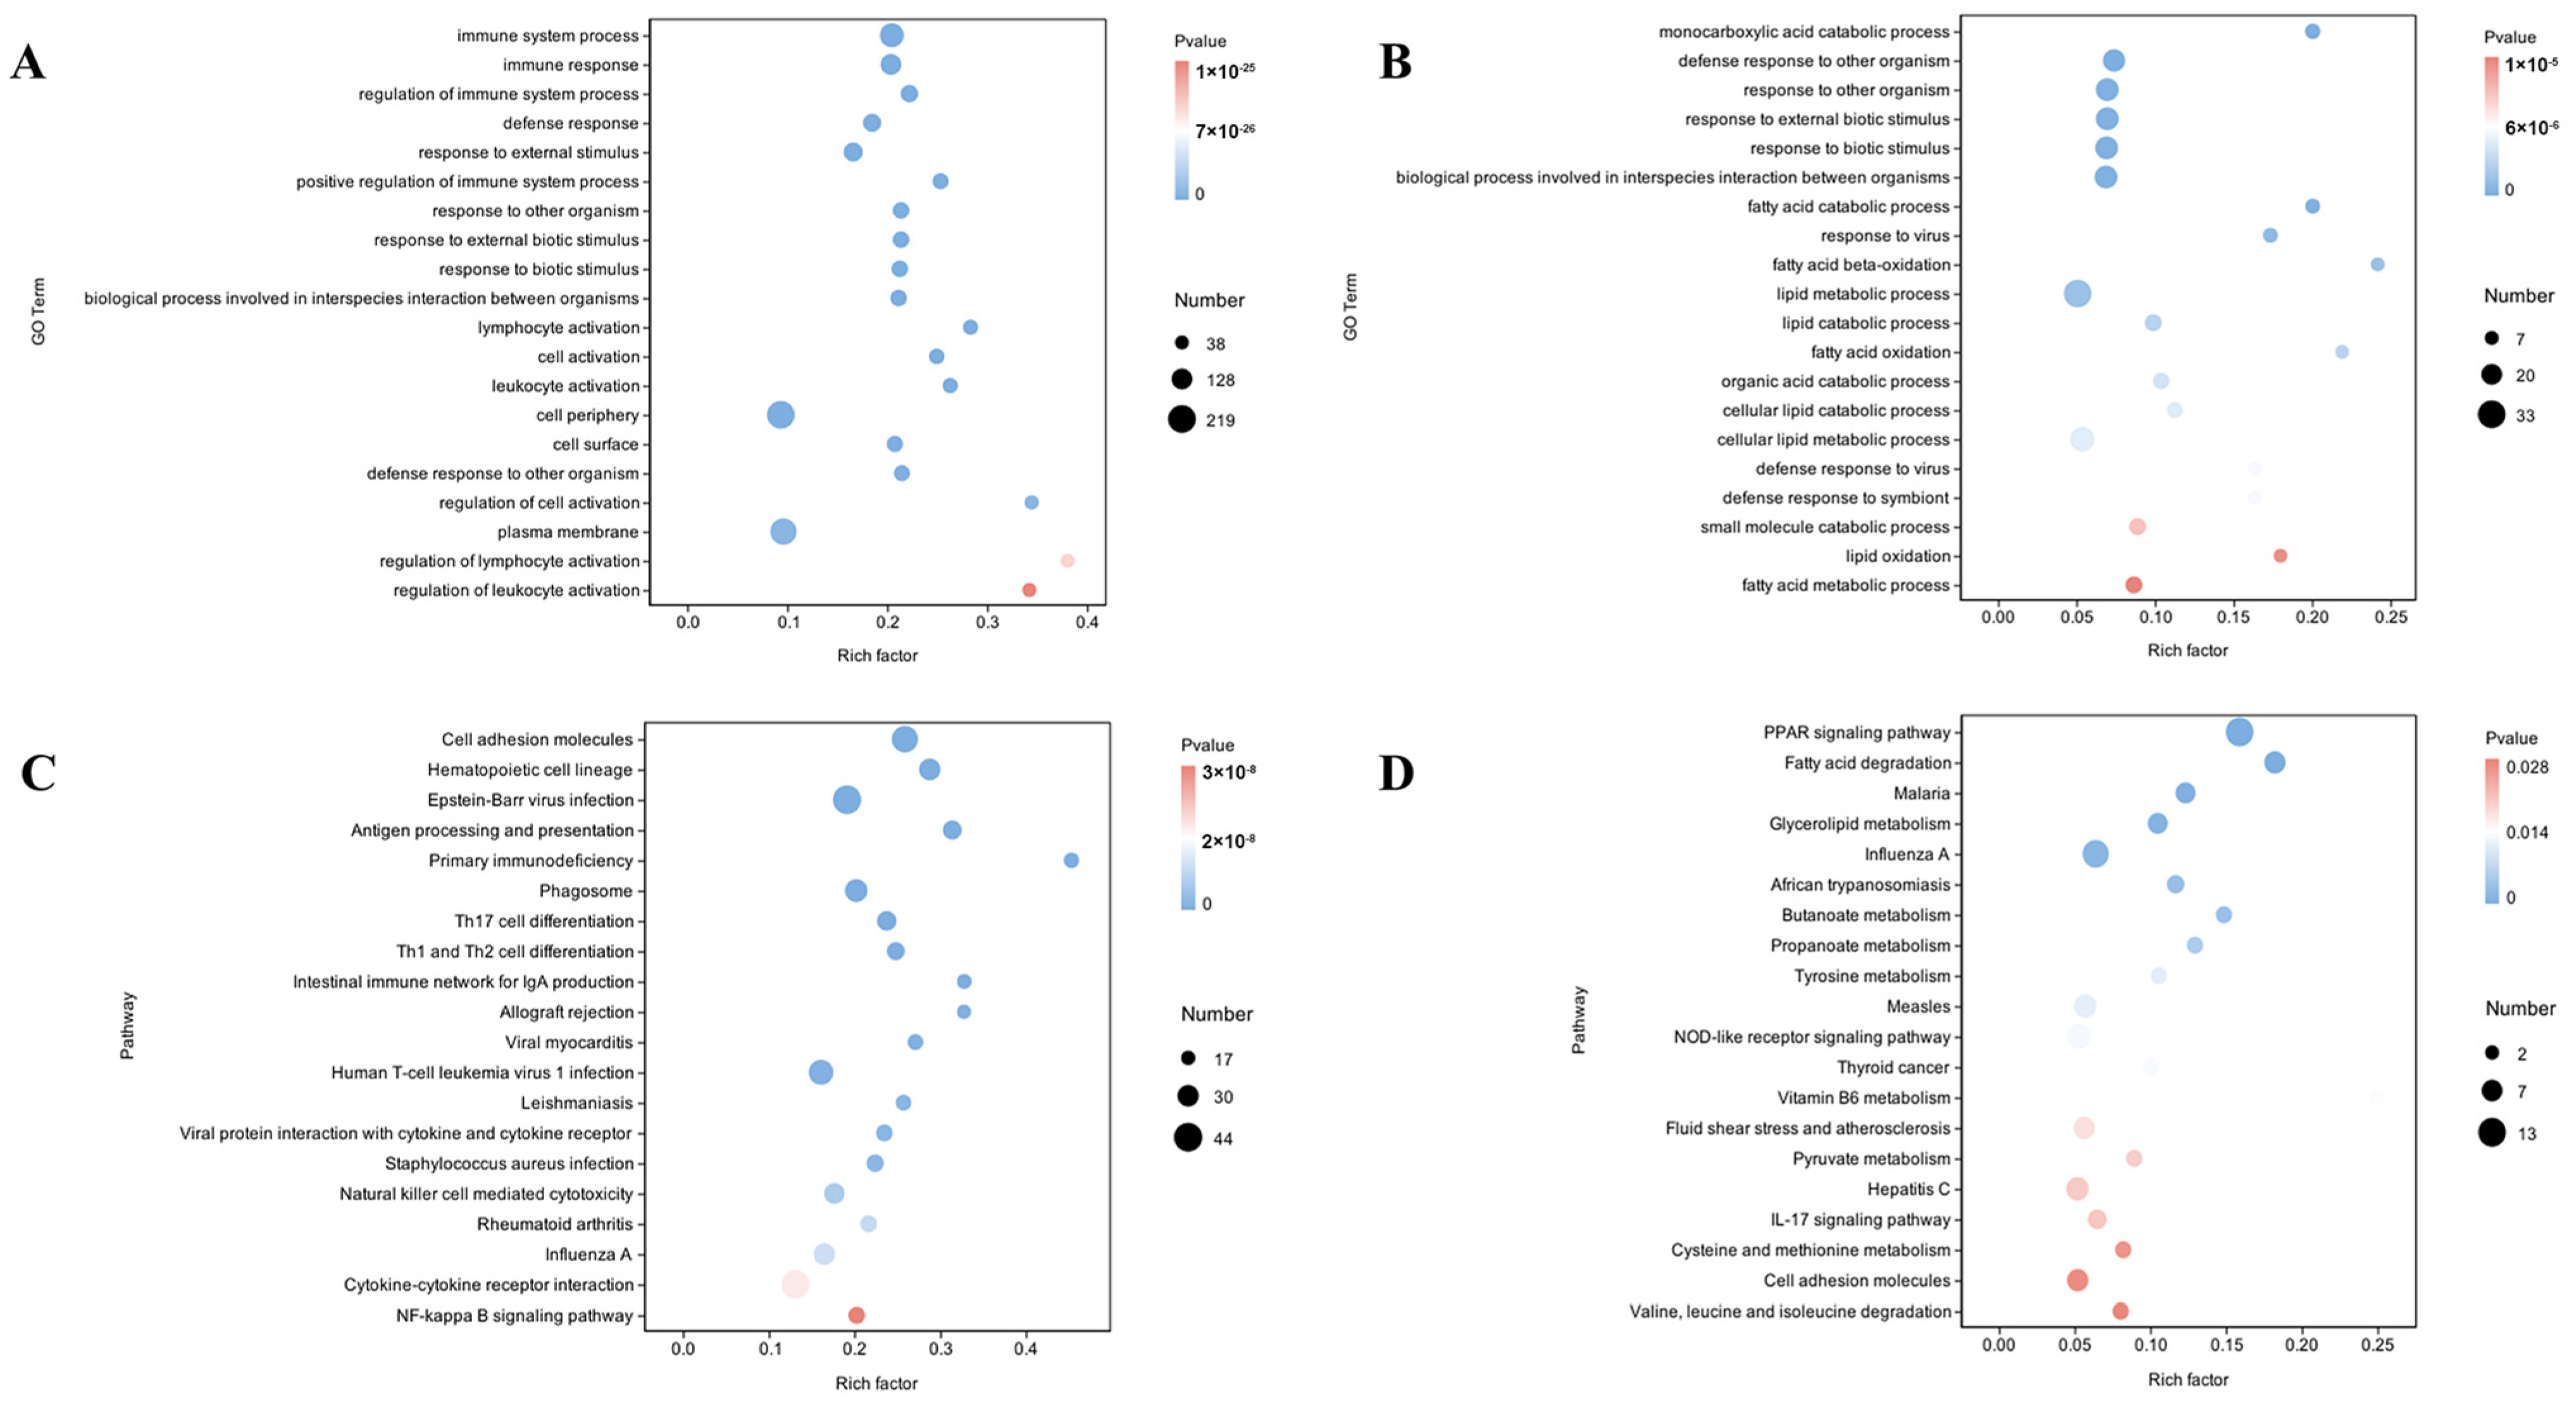
3.4. Functional Enrichment Analysis of DEGs in Liver and Muscle Reveals Tissue-Specific Biological Processes Associated with Intramuscular Fat

3.4.1. GO Term Enrichment in Liver and Muscle DEGs Related to Intramuscular Fat

To better understand the biological mechanisms between different IMF content, GO enrichment analyses of the DEGs in the liver and muscle, which included biological process (BP), cellular component (CC), and molecular function (MF) enrichment were conducted. A total of 928 GO terms (p < 0.05) were considerably enriched in the liver’s DEGs, with 667 fitting into the BP category, 56 into the CC category, and 205 into the MF category. These terms were primarily enriched in the immune system process, immune response, and regulation of the immune system process, etc. (Figure 3A, Supplementary Table S6). At the same time, DEGs in the muscle were significantly enriched in 546 GO terms (p < 0.05), including 388 in the BP category, 32 in the CC category, and 126 in the MF category. These GO terms were primarily related to the monocarboxylic acid catabolic process, fatty acid catabolic process, fatty acid beta-oxidation, and lipid metabolic process (Figure 3B, Supplementary Table S7).

3.4.2. KEGG Pathway Enrichment in Liver and Muscle DEGs Related to Intramuscular Fat

A KEGG enrichment analysis was performed to investigate the biological roles of the DEGs. There was a substantial (p < 0.05) enrichment of 65 KEGG pathways in the liver and 27 in the muscle. In the liver, the DEGs were significantly enriched in cell adhesion molecules, hematopoietic cell lineage, phagosome, etc. (Figure 3C, Supplementary Table S8). In addition, there was a notable enrichment of DEGs in muscle in functions involving the PPAR signaling pathway, fatty acid degradation, and glycerolipid metabolism (Figure 3D, Supplementary Table S9).

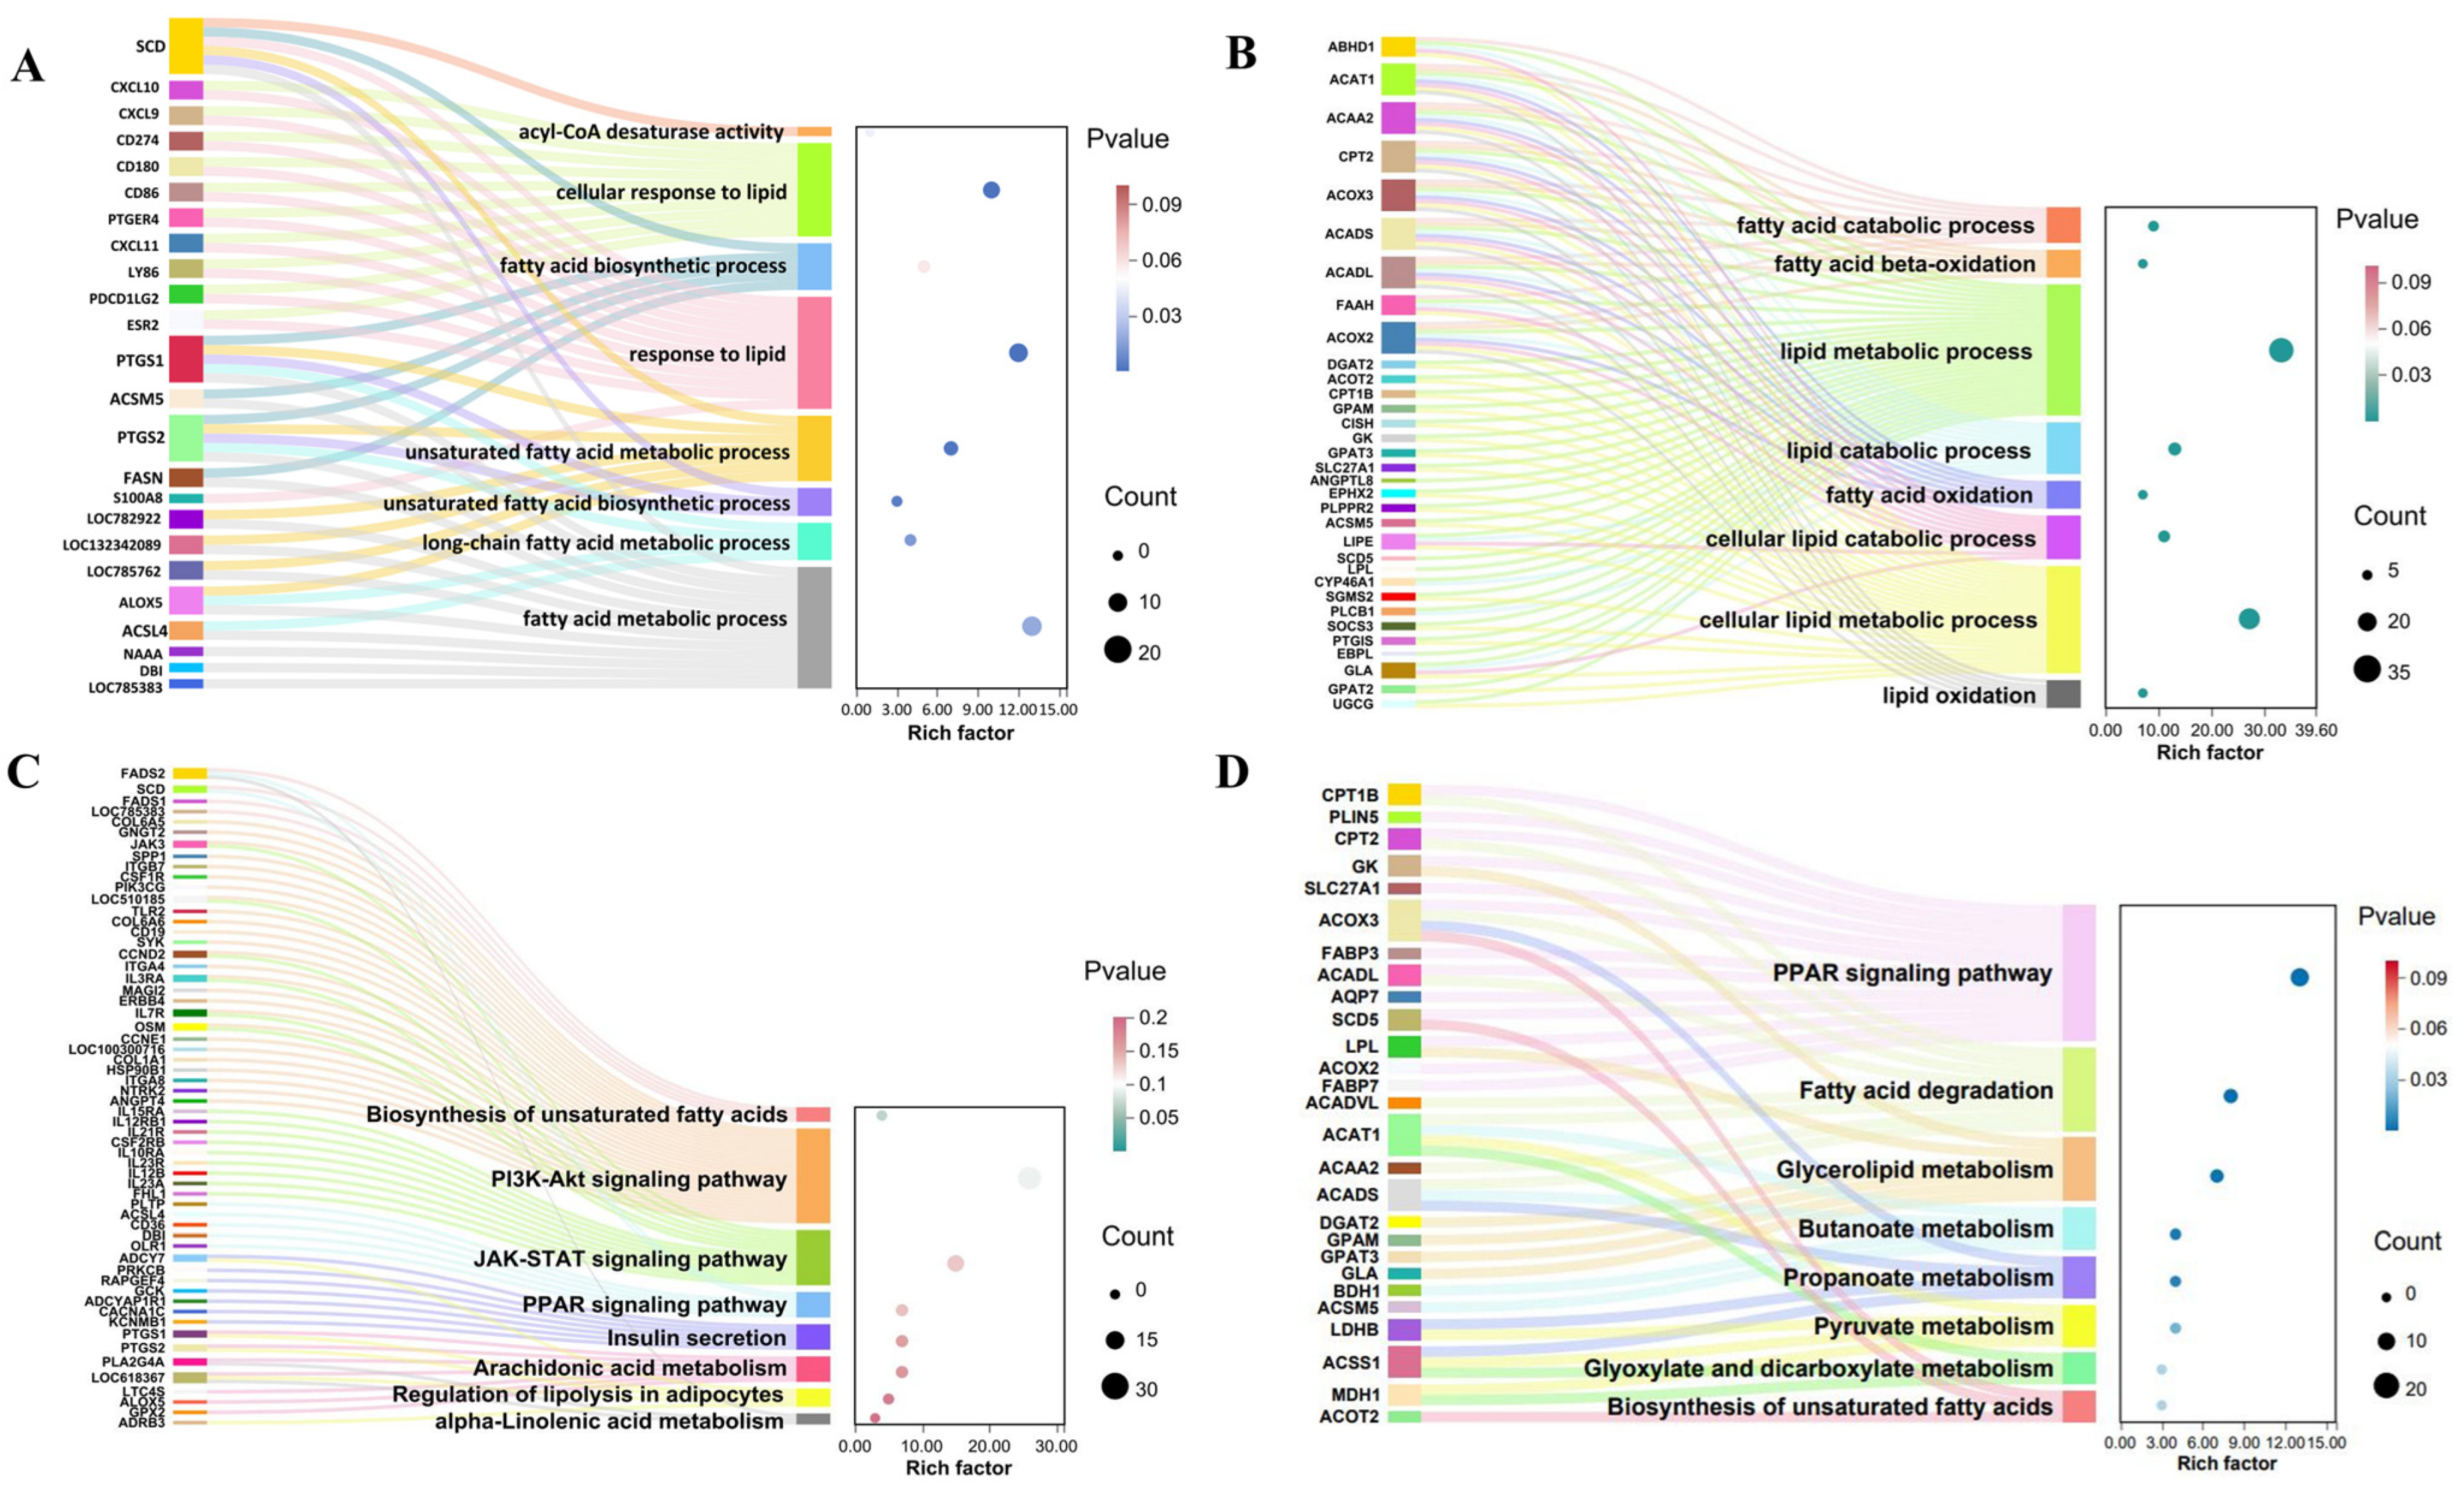
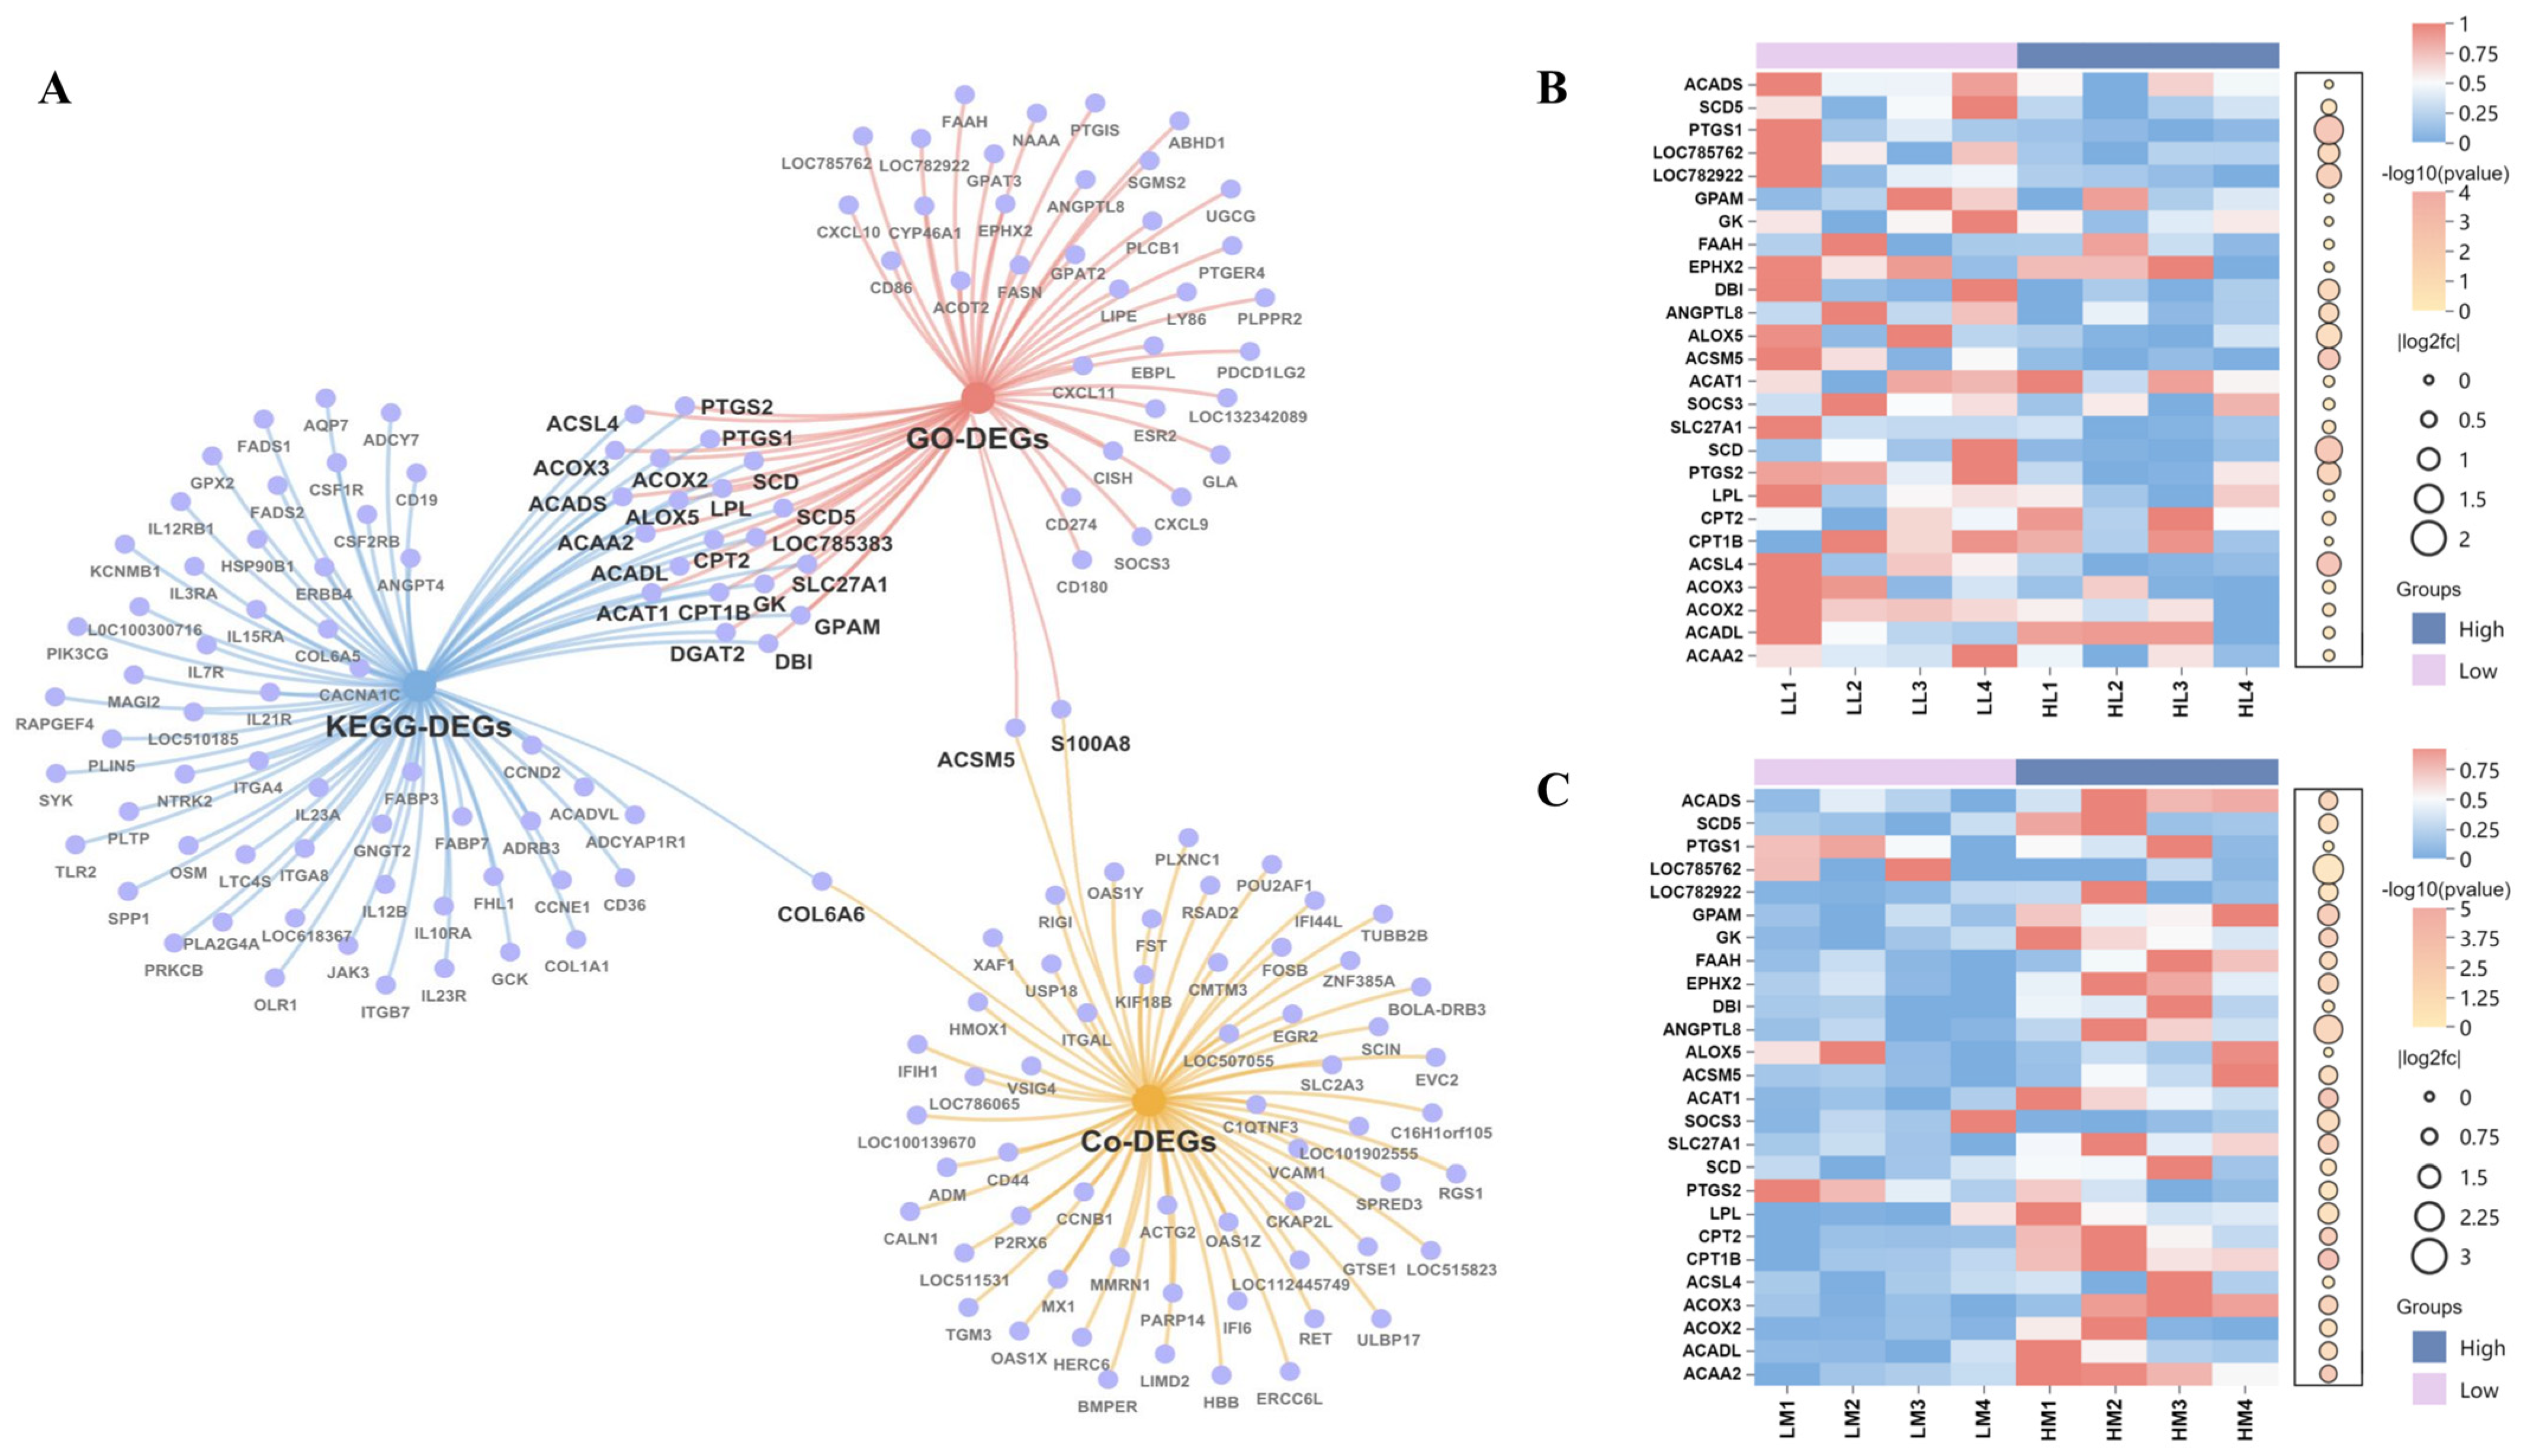
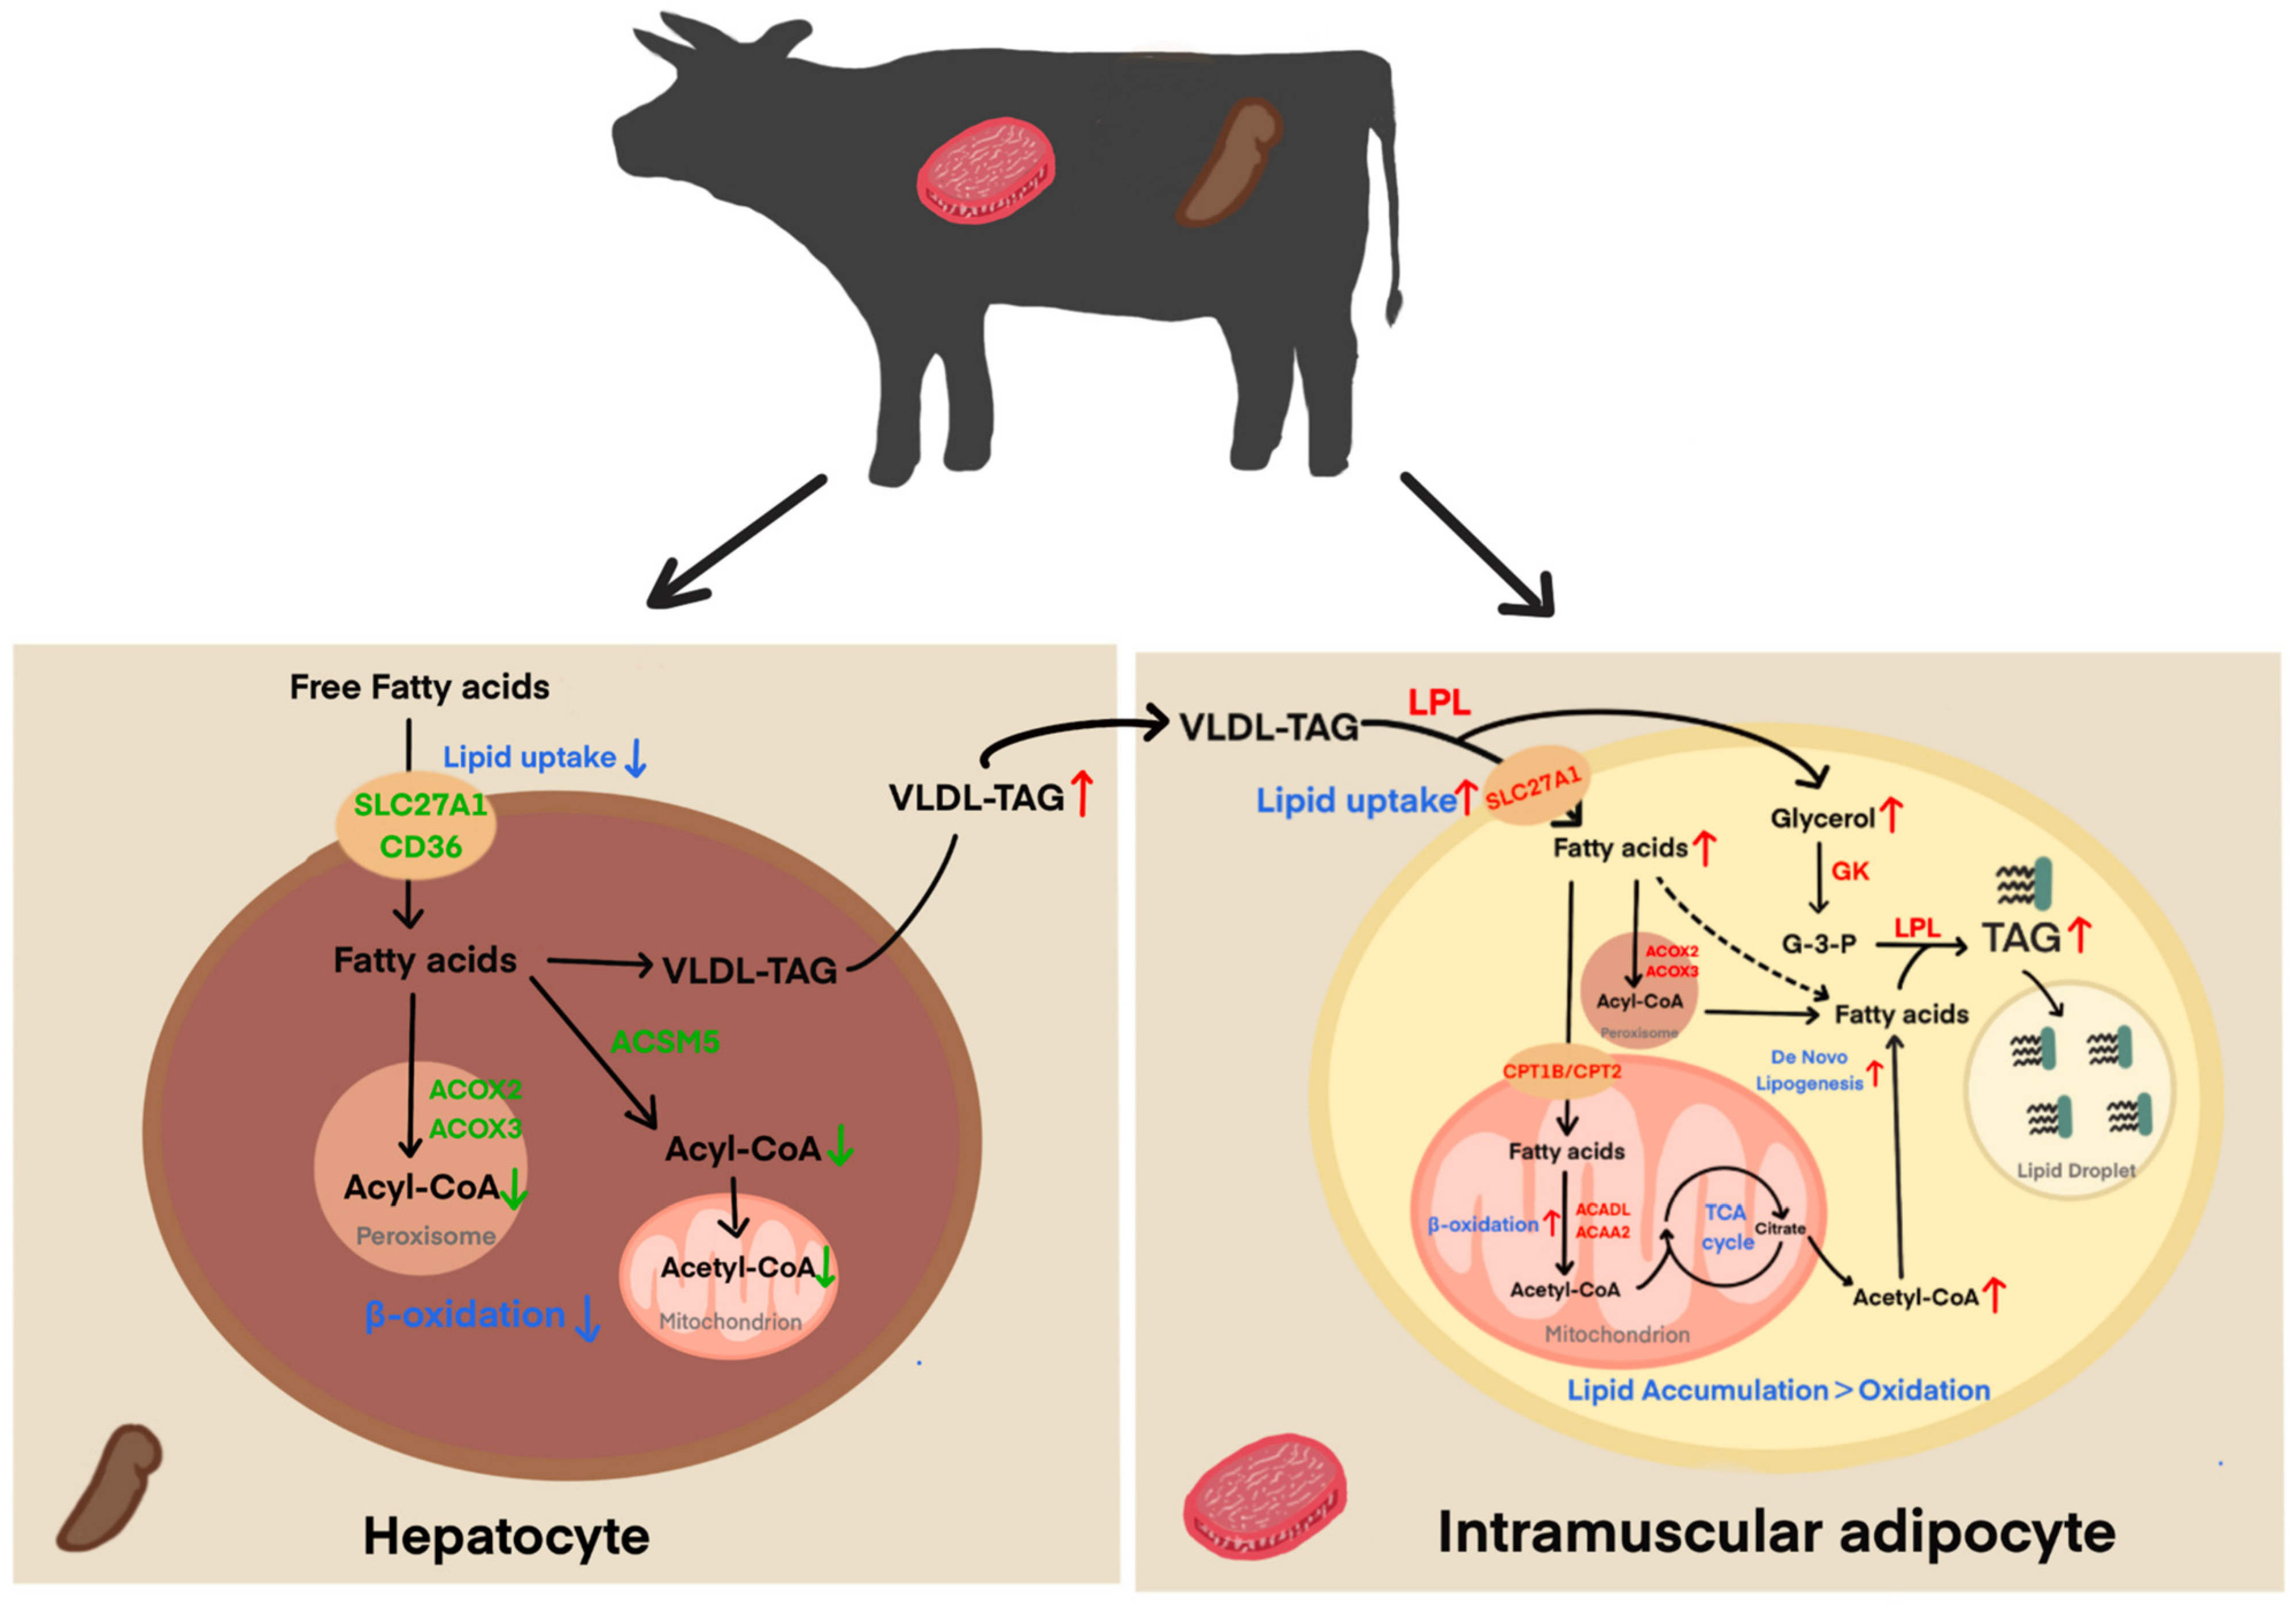
3.5. Candidate Genes in Liver-Muscle Interaction for IMF Deposition

To identify candidate genes involved in IMF deposition, eight pathways directly related to lipid metabolism were selected from GO and KEGG pathway analyses of liver and muscle tissues (Figure 4). A total of 57 genes were identified from GO pathways and 78 from KEGG pathways. These genes were enriched in pathways such as PPAR signaling, fatty acid degradation, unsaturated fatty acid biosynthesis, response to lipids, and lipid metabolic processes. A total of 26 genes were identified as overlapping between co-DEGs, GO-DEGs, and KEGG-DEGs (Figure 5A). The expression levels of these overlapping genes in each individual are summarized in Figure 5B,C. Subsequently, correlation analysis was performed between these genes and IMF content, and 16 genes with significant correlations: 11 in the muscle (ACAA2, ACADL, ACOX2, CPT1B, CPT2, LPL, SLC27A1, ACAT1, EPHX2, GK, SCD5), 7 in the liver (ACOX2, ACOX3, PTGS2, SLC27A1, ACSM5, LOC785762, PTGS1), and 2 (ACOX2, SLC27A1) in both tissues were identified (Figure 6A).
To investigate functional relationships, 14 interacting genes were identified by PPI network analysis utilizing STRING. K-means clustering of these genes revealed two distinct clusters: cluster 1 (12 genes: ACAA2, ACADL, ACOX2, CPT1B, CPT2, LPL, SLC27A1, ACAT1, EPHX2, GK, ACOX3, ACSM5) and cluster 2 (2 genes: PTGS1, PTGS2). To prioritize potential regulators of IMF deposition, the 12 genes within cluster 1 were ranked using Cytoscape’s cytoHubba plugin and the Maximal Clique Centrality (MCC) algorithm (Figure 6B). Based on this ranking and their involvement in key metabolic pathways, a final set of 11 genes, including ACAA2, ACADL, ACOX2, CPT1B, CPT2, LPL, SLC27A1, ACAT1, GK, ACOX3, and ACSM5, were selected as key candidate genes for IMF deposition. Subsequent functional enrichment analysis indicated that these candidate genes were primarily involved in fatty acid β-oxidation and PPAR signaling pathways (Figure 6C,D). Then, A “liver-muscle” regulatory network of IMF deposition was constructed based on their expression levels in two tissues and function (Figure 7).

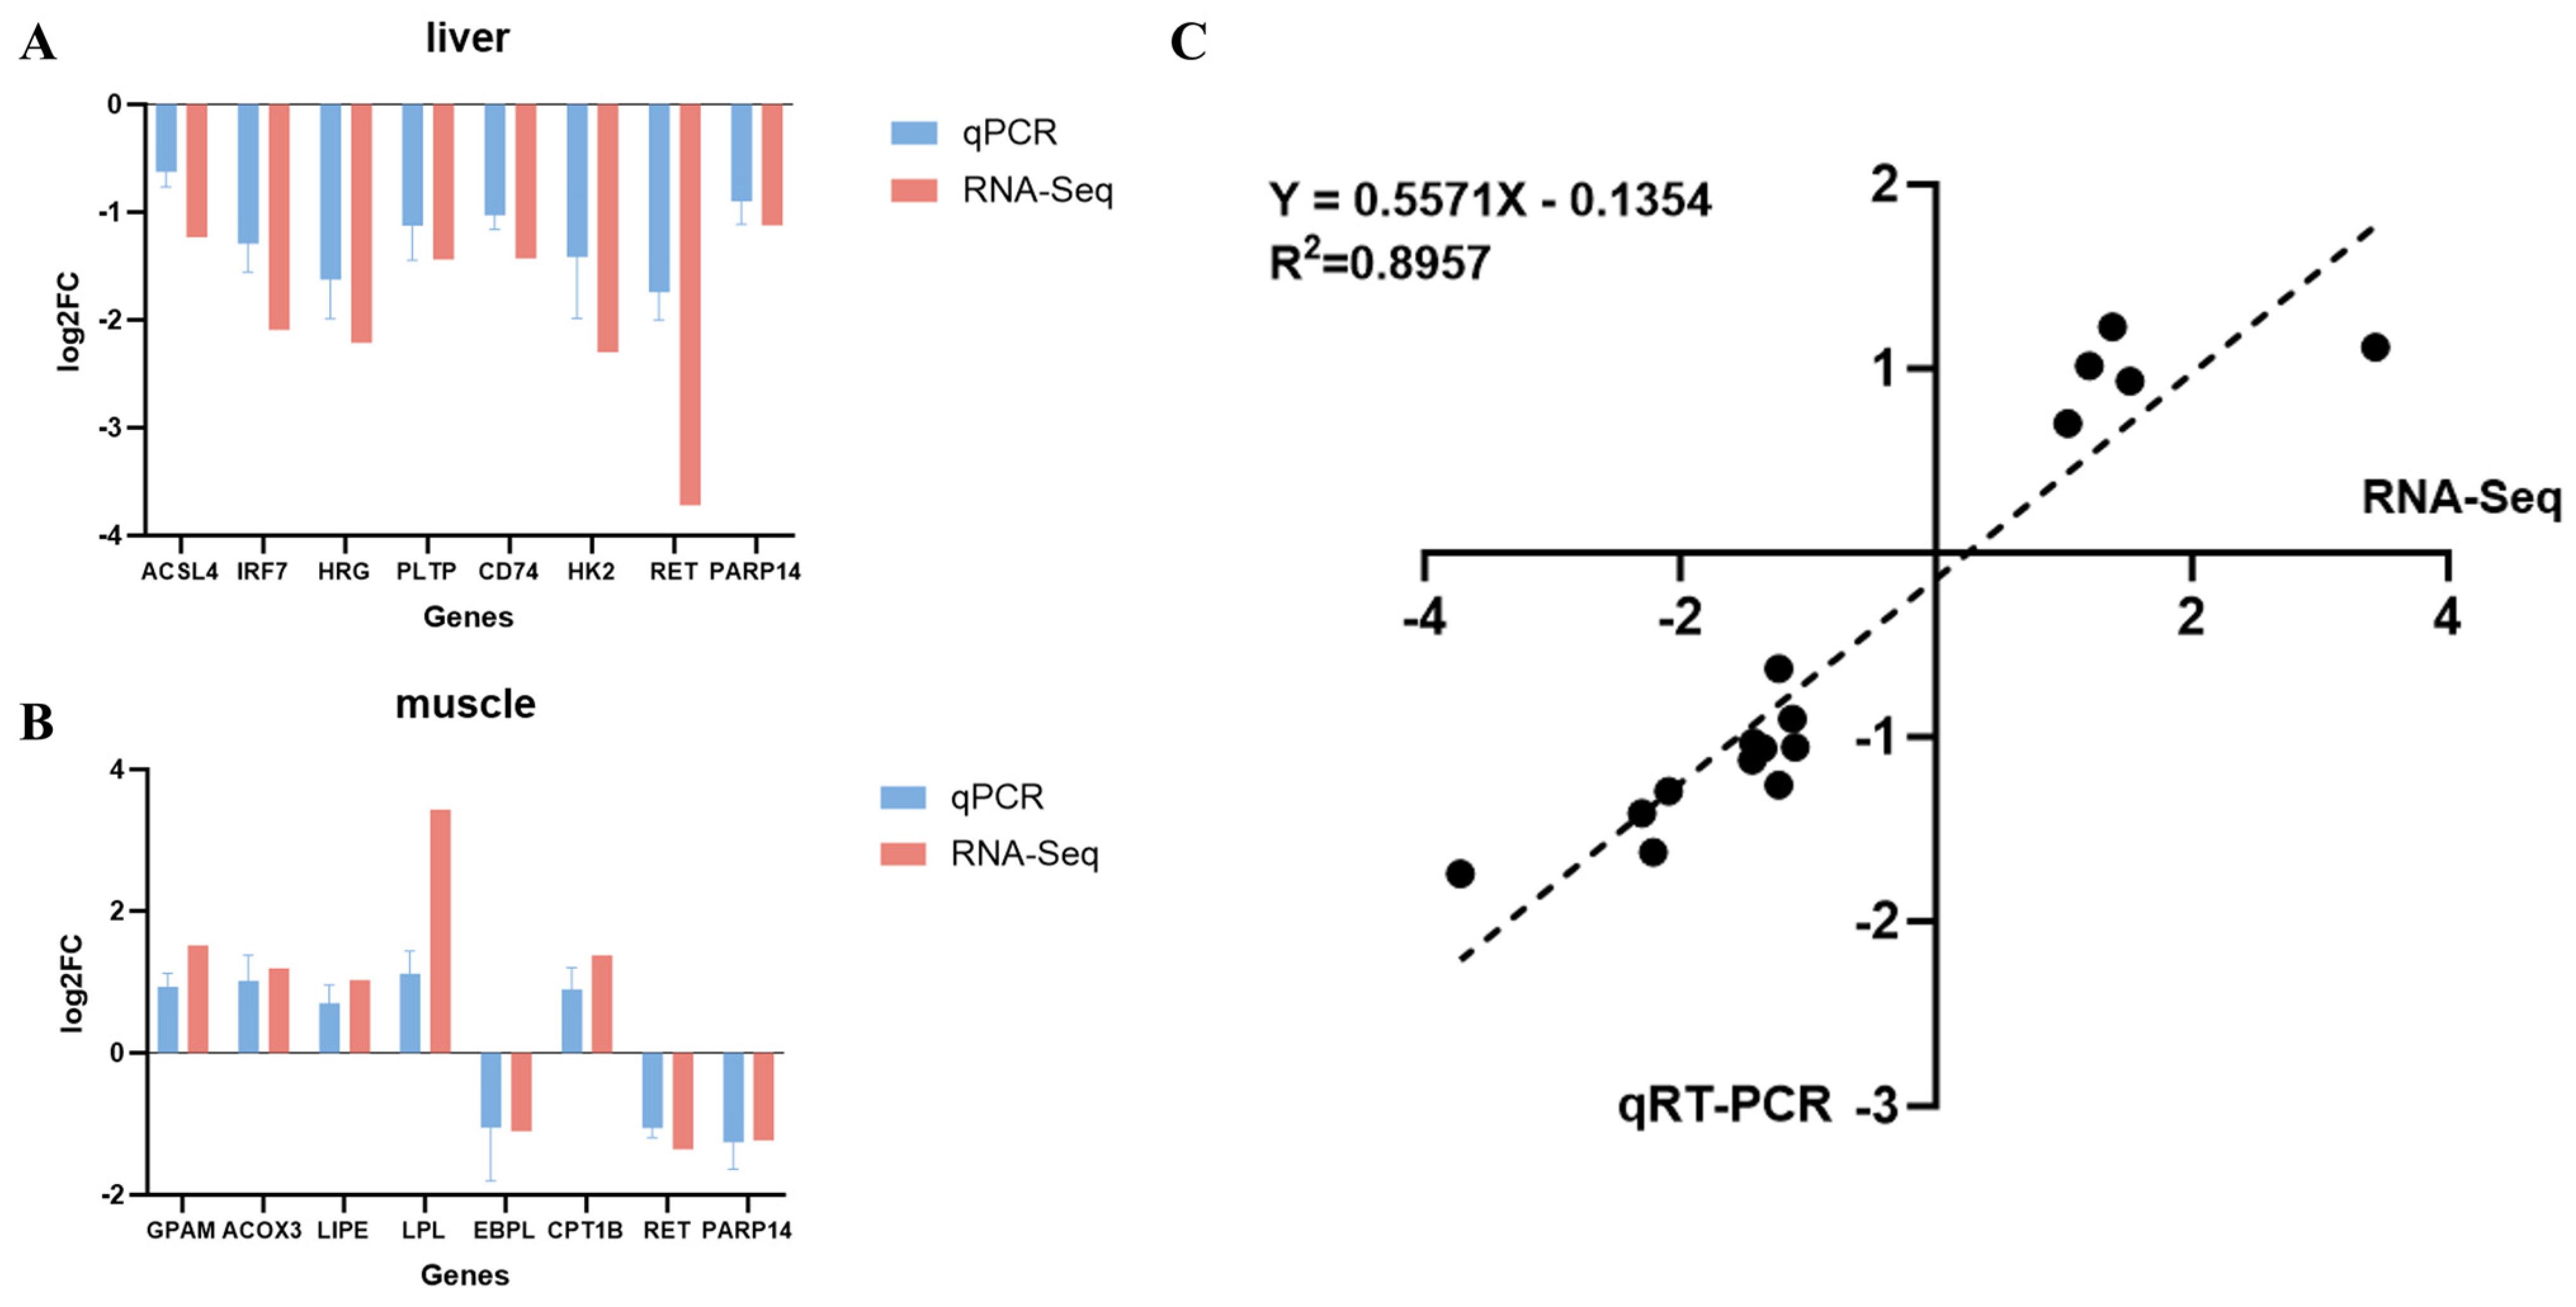
3.6. RNA-Seq Data Validation by qRT-PCR

qRT-PCR was performed on six randomly selected DEGs from the liver, six from the muscle, and two co-DEGs to validate the RNA-Seq data. The expression patterns observed by RNA-Seq were consistent with qRT-PCR results across all genes, confirming the reliability of our methods (Figure 8). Specifically, in high vs. low IMF groups, the liver showed down-regulation of ACSL4, IRF7, HRG, PLTP, CD74, and HK2, while the muscle showed up-regulation of GPAM, ACOX3, LIPE, LPL, and CPT1B, and down-regulation of EBPL. RET and PARP14 were downregulated in both the liver and the muscle. Pearson correlation analysis validated the consistency of qRT-PCR and RNA-Seq results (R2 = 0.8957).

4. Discussion

Numerous transcriptomic studies have investigated IMF deposition in cattle, but most have focused on identifying differentially expressed genes between breeds with differing IMF capacities [24,31,32]. In contrast, our study investigates intra-population variation in IMF within a commercially relevant crossbred population under controlled conditions. This approach overcomes the limitations of inter-breed comparisons, which often confound breed-specific genetic differences with the mechanisms of IMF deposition. By integrating comparative transcriptomics of LD muscle and liver tissues with analyses of cellular morphology, we provide a more nuanced understanding of the regulatory mechanisms driving differential IMF accumulation within this important crossbred population.
The integration of phenotypic and transcriptomic data provides a multi-level explanation for the divergent IMF deposition between groups. First, histological analysis revealed that high-IMF cattle exhibited significantly smaller myocytes (diameter: 32.5 ± 2.1 μm vs. 45.8 ± 3.4 μm, p < 0.01) and larger adipocytes (area: 1250 ± 150 μm2 vs. 780 ± 90 μm2, p < 0.01) compared to the low-IMF group (Figure 1C,D), similar results have been reported in pigs [33]. This morphological shift is consistent with the downregulation of myogenic regulators such as MYF5 (Figure 2D) and the upregulation of lipid storage genes such as LPL and CPT1B (Figure 6A), suggesting a potential transcriptional trade-off between myogenesis and adipogenesis. Second, the transcriptomic activation of PPAR signaling and fatty acid β-oxidation pathways (Figure 3D) supports enhanced lipid turnover in muscle, which directly correlates with the elevated IMF content (Table 1). Notably, the absence of adipocyte differentiation pathway enrichment (e.g., PPARγ, C/EBPα) in our data (Supplementary Table S7) indicates that the larger adipocyte size in high-IMF cattle is driven by lipid accumulation during fattening (consistent with [34]), rather than hyperplasia, which aligns with previous findings that adipocyte number is primarily determined during early development [35]. Finally, the coordinated downregulation of hepatic fatty acid oxidation genes such as SLC27A1 facilitate the redirection of lipid substrates to the muscle, further amplifying intramuscular fat deposition. These findings collectively demonstrate that IMF variation in Wagyu–Angus crossbreeds is mechanistically linked to metabolic reprogramming favoring lipid storage over muscle hypertrophy.
Transcriptomic analysis reveals the PPAR signaling pathway and fatty acid β-oxidation pathway as key regulators of IMF deposition. The involvement of the PPAR signaling pathway in lipid metabolism has been established in various cattle species, such as Simmental and Pingliang Red cattle [36], Nanyang cattle, and Japanese black cattle [24], as well as in pigs [37] and chicken [38]. Lim et al. found differential expression of ten PPAR signaling pathway genes between high- and low-marbled Hanwoo cattle, with fatty acid oxidation identified as the primary downstream pathway [39], which was consistent with our research. We identified thirteen differentially expressed genes in the PPAR signaling pathway between HM and LM groups, while seven genes in the liver, including seven identified as key genes involved in IMF deposition, and most of them are also playing important roles in lipid metabolism, adipocyte differentiation, and gluconeogenesis processes. Among them, SLC27A1, which is also identified as FATP1, is notable for its critical role in fatty acid transport and metabolism. SLC27A1 is an important membrane protein that promotes the absorption of long-chain fatty acids, which are essential for oleic acid synthesis in beef. It was reported that overexpression of SLC27A1 in bovine preadipocytes promotes adipocyte differentiation, whereas interference with SLC27A1 expression inhibits the process [40]. In addition, association studies have identified two SNPs in SLC27A1 significantly impacting meat quality traits in Qinchuan cattle [41], highlighting its association with fat deposition. Our study provides further validation of the role of these genes and pathways.
The fatty acid β-oxidation pathway, which involves the breakdown of fatty acids for energy, plays a crucial role in regulating the balance between fat deposition and excretion, thereby influencing IMF content. Yang et al. found that DE circRNAs (DECs) and DE lncRNAs (DECs) were enriched for the GO pathway by whole transcriptome sequencing analysis of Qinchuan cattle intramuscular adipocytes at different differentiation stages, and both were significantly enriched in fatty acid β-oxidation pathway [42]. In our study, seven key genes were identified in this pathway, including ACOX2, ACOX3, ACADL, CPT1B, CPT2, ACAT1, and ACAA2. ACOX2 and ACOX3 are peroxisomal enzymes involved in the first step of the β-oxidation pathway with different substrate preferences, they catalyze the initial desaturation of acyl-CoAs, producing enoyl-CoAs [43]. It has been reported that ACOX2 may be associated with the meat quality of yak [44], while ACOX3 has been screened to be related to IMF in Qinchuan cattle [45] and chicken [46]. CPT1B and CPT2 facilitate fatty acyl-CoA conversion to acyl-carnitines, enabling fatty acid transport across the inner mitochondrial membrane and into peroxisomes for their subsequent oxidation [47]. Transcriptome analysis has revealed that CPT1B might significantly affect IMF deposition in Laiwu pigs, and CPT2 might be involved in IMF regulation in Ningxiang pigs [48] and chicken [46]. ACADL, which encodes the mitochondrial enzyme LCAD that initiates long-chain fatty acyl-CoA oxidation [49], promotes goat intramuscular adipocyte differentiation through TNF signaling pathway activation [50]. ACAT1, encoding the mitochondrial enzyme that catalyzes the final step of long-chain fatty acid β-oxidation [51], has been identified as a candidate gene for the ribeye area trait in Nelore cattle via WGCNA [52]. ACAA2, a key enzyme responsible for the thiolytic cleavage of 3-oxoacyl-CoAs into acetyl-CoA and a fatty acyl-CoA shortened by two carbon atoms [53], also promotes the differentiation of sheep precursor adipocytes into adipocytes [54]. These previous findings, along with our results, confirm the crucial role of these genes and the β-oxidation pathway in the control of fat deposition in this crossbreed.
In addition to the key genes enriched in the two pathways, we also identified several other candidate genes that are involved in fat deposition, such as LPL, ACSM5, GK, and so on. LPL catalyzes the hydrolysis of triglycerides in lipoproteins to release fatty acids for cellular uptake. Comparative transcriptome analysis from castrated cattle showed its abnormal expression during increases in IMF [55]. ACSM5, a gene involved in the activation of medium-chain fatty acids, was previously identified by eGWAS as a potential candidate affecting porcine meat quality [56]. GK, which was more abundant in chicken breast muscle with higher IMF content [46], was also detected in our study. Although these genes are known to be involved in lipid regulation processes in cattle and other species, and our findings suggest that they may play an important role in IMF control in Wagyu–Angus crossbreeds, a more comprehensive understanding of the specific mechanisms regulating bovine IMF deposition is required.
In this study, we hypothesized a trans-tissue mechanism of IMF deposition in bovine muscle by integrating transcriptomic data obtained from the liver and LD muscle. Briefly, reduced expression of ACOX2, ACOX3, and SLC27A1 in the liver inhibited fatty acid uptake and oxidation, resulting in more free fatty acids (FFA) entering the circulation mediated by very low-density lipoproteins (VLDL), which provided sufficient substrate for IMF deposition. Meanwhile, in the LD muscle, the upregulation of SLC27A1, LPL, and GK creates an efficient network for lipid uptake and synthesis: SLC27A1 and LPL promote the transport and supply of fatty acids, while GK accelerates glycerol metabolism and provides the backbone for triglyceride (TAG) synthesis; furthermore, the upregulation of β-oxidation genes (e.g., CPT1B) in the muscle tissues may provide more substrates for lipid de novo lipogenesis. Ultimately, the rate of lipid uptake and esterification is greater than the rate of degradation, leading to an accumulation of IMF. This metabolic coupling suggests that IMF deposition in crossbred cattle is driven by preferential shunting of hepatic lipid reserves to muscle, rather than de novo lipogenesis dominance, a finding that contrasts with previous study suggesting that de novo lipogenesis is the primary contributor to IMF [57].
While this study sheds light on the genes and pathways regulating IMF deposition of the crossbred, certain limitations must be acknowledged. Primarily, our study focused on a specific crossbreed, and the genetic architecture of IMF may differ in other cattle breeds. Future studies should include purebred animals and other crossbred combinations to assess the broader relevance of our findings and to identify breed-specific regulators of IMF deposition. Furthermore, the precise nature of hepatic-muscle communication signals, such as exosomes or hormones, remains to be fully elucidated. Moreover, the mechanistic resolution of our study is currently confined to the mRNA level. To address these limitations, future research should integrate spatial transcriptomics and metabolic flux analysis to dynamically characterize the spatial and temporal aspects of lipid partitioning. Finally, functional validation of the identified candidate genes through techniques such as gene knockout or overexpression experiments is necessary to confirm their roles in IMF regulation.

5. Conclusions

In conclusion, this study utilized RNA-Seq to investigate the genetic mechanisms underlying IMF deposition in Wagyu–Angus crossbred F1 bulls, a prevalent approach to enhance marbling traits in China. Comparative transcriptomic analysis identified the involvement of key lipid metabolic pathways, including fatty acid beta-oxidation and PPAR signaling, with 11 candidate genes (ACAA2, ACADL, ACOX2, CPT1B, CPT2, LPL, SLC27A1, ACAT1, GK, ACOX3, and ACSM5) were identified as potential regulators of IMF deposition. We also initially constructed a “liver–muscle” regulatory network to promote IMF deposition. These findings provide novel molecular markers for enhancing IMF content and accelerating genetic selection programs aimed at improving beef quality traits in Wagyu–Angus crossbred cattle. Future research should focus on the following: (1) examining breed-specific genetic factors in IMF deposition by including diverse cattle breeds; (2) elucidating hepatic-muscle communication mechanisms; and (3) functionally validating candidate genes across diverse genetic backgrounds. These efforts will clarify the universality of our findings and refine marker-assisted selection strategies.

Supplementary Materials

The following supporting information can be downloaded at: https://www.mdpi.com/article/10.3390/ani15091306/s1, Table S1: The primer information of qRT-PCR; Table S2: Statistics of sequencing data; Table S3: DEGs of LL vs. HL group; Table S4: DEGs of the LM vs. HM group; Table S5: Co-DEGs between the liver and muscle; Table S6: Significantly enriched GO terms of DEGs from LL vs. HL group; Table S7: Significantly enriched GO terms of DEGs from LM vs. HM group; Table S8: Significantly enriched KEGG pathways of DEGs from LL vs. HL group; Table S9: Significantly enriched KEGG pathways of DEGs from the LM vs. HM group; Table S10: Information of hub genes associated with IMF deposition; Table S11. Composition and nutritional levels of the TMR for experimental cattle.

Author Contributions

Conceptualization, S.W., K.W. and R.Z.; methodology, S.W. and T.L.; formal analysis, S.W., T.L. and P.P.; investigation, S.S., P.P. and S.L.; data curation, X.C. and Y.F.; validation, T.L., S.S.; writing—original draft preparation, S.W.; writing—review and editing, T.L., Y.F. and R.Z.; supervision, K.W. and R.Z.; project administration, K.W. and R.Z.; funding acquisition, K.W. and R.Z. All authors have read and agreed to the published version of the manuscript.

Funding

This research was funded by Basic Research Funds of Hebei Academy of Agriculture and Forestry Sciences (2023060102), Hebei Agriculture Research System (HBCT2024240202), and HAAFS Science and Technology Innovation Special Project (2022KJCXZX-LYS-19).

Institutional Review Board Statement

The animal study protocol was reviewed and approved by the Laboratory Animal Welfare and Animal Experimental Ethical Review Committee under permit No. 2024170, date of approval: 13 December 2024.

Informed Consent Statement

Written informed consent has been obtained from the owners of the animals.

Data Availability Statement

The original contributions presented in the study are publicly available. All sequencing data are available through the NCBI Sequence Read Archive under the accession number PRJNA1225315.

Acknowledgments

We thank Hua Xu and his team from Langfang Animal Husbandry Station and Shunze Meat Co. (Langfang, China) for supporting this study. We acknowledge the use of ChatGPT-4o for assistance with grammar checking of this manuscript.

Conflicts of Interest

The authors declare no conflicts of interest.

Abbreviations

The following abbreviations are used in this manuscript:
ABHD1Abhydrolase Domain Containing 1
ACAA2Acetyl-CoA Acyltransferase 2
ACADLAcyl-CoA Dehydrogenase Long Chain
ACAT1Acetyl-CoA Acetyltransferase 1
ACOT2Acyl-CoA Thioesterase 2
ACOX2Acyl-CoA Oxidase 2
ACOX3Acyl-CoA Oxidase 3
ACSL4Acyl-CoA Synthetase Long Chain Family Member 4
ACSM5Acyl-CoA Synthetase Medium Chain Family Member 5
ACTBActin Beta
AdipoQAdiponectin
C/EBPCCAAT/Enhancer Binding Protein
CD74CD74 Molecule
CPT1BCarnitine Palmitoyltransferase 1B
CPT2Carnitine Palmitoyltransferase 2
CXCL10C-X-C Motif Chemokine Ligand 10
DGAT2Diacylglycerol O-Acyltransferase 2
EBPLEmopamil Binding Protein Like
EGR1Early Growth Response 1
EPHX2Epoxide Hydrolase 2
FABPsFatty Acid Binding Proteins
FASNFatty Acid Synthase
FATP1Fatty Acid Transport Protein 1
GKGlycerol Kinase
GPAMGlycerol-3-Phosphate Acyltransferase
HK2Hexokinase 2
HRGHeregulin
IGFBP1Insulin Like Growth Factor Binding Protein 1
IRF7Interferon Regulatory Factor 7
ITGB1Integrin Subunit Beta 1
LIPELipase E, Hormone Sensitive Type
LPLLipoprotein Lipase
MC4RMelanocortin 4 Receptor
MYF5Myogenic Factor 5
NAIPNLR Family Apoptosis Inhibitory Protein
NCAM1Neural Cell Adhesion Molecule 1
PARP14Poly(ADP-Ribose) Polymerase 14
PLAC8APlacenta Specific 8A
PLTPPhospholipid Transfer Protein
PPARPeroxisome Proliferator Activated Receptor
PTGS1Prostaglandin-Endoperoxide Synthase 1
PTGS2Prostaglandin-Endoperoxide Synthase 2
RARRetinoic Acid Receptor
RETRet Proto-Oncogene
REXO2RNA exonuclease 2
SCDStearoyl-CoA Desaturase
SLC27A1Solute Carrier Family 27 Member 1
SREBPSterol Regulatory Element Binding Protein

References

  1. Fu, R.; Li, C.; Wang, L.; Gao, Z. Chinese consumer preference for beef with geographical indications and other attributes. Meat Sci. 2024, 212, 109475. [Google Scholar] [CrossRef]
  2. Halli, K.; Bohlouli, M.; Schulz, L.; Sundrum, A.; König, S. Estimation of direct and maternal genetic effects and annotation of potential candidate genes for weight and meat quality traits in a genotyped outdoor dual-purpose cattle breed. Transl. Anim. Sci. 2022, 6, txac022. [Google Scholar] [CrossRef] [PubMed]
  3. Liu, S.; Huang, J.; Wang, X.; Ma, Y. Transcription factors regulate adipocyte differentiation in beef cattle. Anim. Genet. 2020, 51, 351–357. [Google Scholar] [CrossRef] [PubMed]
  4. Frank, D.; Kaczmarska, K.; Paterson, J.; Piyasiri, U.; Warner, R. Effect of marbling on volatile generation, oral breakdown and in mouth flavor release of grilled beef. Meat Sci. 2017, 133, 61–68. [Google Scholar] [CrossRef] [PubMed]
  5. Raza, S.H.A.; Khan, R.; Abdelnour, S.A.; Abd El-Hack, M.E.; Khafaga, A.F.; Taha, A.; Ohran, H.; Mei, C.; Schreurs, N.M.; Zan, L. Advances of molecular markers and their application for body variables and carcass traits in Qinchuan cattle. Genes 2019, 10, 717. [Google Scholar] [CrossRef]
  6. Wheeler, T.L.; Cundiff, L.V.; Koch, R.M. Effect of marbling degree on beef palatability in Bos taurus and Bos indicus cattle. J. Anim. Sci. 1994, 72, 3145–3151. [Google Scholar] [CrossRef]
  7. Park, S.J.; Beak, S.H.; Jung, D.J.S.; Kim, S.Y.; Jeong, I.H.; Piao, M.Y.; Kang, H.J.; Fassah, D.M.; Na, S.W.; Yoo, S.P.; et al. Genetic, management, an5d nutritional factors affecting intramuscular fat deposition in beef cattle—A review. Asian-Australas. J. Anim. Sci. 2018, 31, 1043–1061. [Google Scholar] [CrossRef]
  8. Michal, J.J.; Zhang, Z.W.; Gaskins, C.T.; Jiang, Z. The bovine fatty acid binding protein 4 gene is significantly associated with marbling and subcutaneous fat depth in Wagyu x Limousin F2 crosses. Anim. Genet. 2006, 37, 400–402. [Google Scholar] [CrossRef]
  9. Chen, J.N.; Jiang, Y.Z.; Cen, W.M.; Xing, S.H.; Zhu, L.; Tang, G.Q.; Li, M.Z.; Jiang, A.A.; Lou, P.E.; Wen, A.X.; et al. Distribution of H-FABP and ACSL4 gene polymorphisms and their associations with intramuscular fat content and backfat thickness in different pig populations. Genet. Mol. Res. 2014, 13, 6759–6772. [Google Scholar] [CrossRef]
  10. Morsci, N.S.; Schnabel, R.D.; Taylor, J.F. Association analysis of adiponectin and somatostatin polymorphisms on BTA1 with growth and carcass traits in Angus cattle. Anim. Genet. 2006, 37, 554–562. [Google Scholar] [CrossRef]
  11. Choi, Y.; Davis, M.E.; Chung, H. Effects of genetic variants in the promoter region of the bovine adiponectin (ADIPOQ) gene on marbling of Hanwoo beef cattle. Meat Sci. 2015, 105, 57–62. [Google Scholar] [CrossRef] [PubMed]
  12. Liu, Y.; Albrecht, E.; Schering, L.; Kuehn, C.; Yang, R.; Zhao, Z.; Maak, S. Agouti signaling protein and its receptors as potential molecular markers for intramuscular and body fat deposition in cattle. Front. Physiol. 2018, 9, 172. [Google Scholar] [CrossRef]
  13. Wu, S.A.; Kersten, S.; Qi, L. Lipoprotein lipase and its regulators: An unfolding story. Trends Endocrinol. Metab. 2021, 32, 48–61. [Google Scholar] [CrossRef]
  14. Gao, Y.Y.; Cheng, G.; Cheng, Z.X.; Bao, C.; Yamada, T.; Cao, G.F.; Bao, S.Q.; Schreurs, N.M.; Zan, L.S.; Tong, B. Association of variants in FABP4, FASN, SCD, SREBP1 and TCAP genes with intramuscular fat, carcass traits and body size in Chinese Qinchuan cattle. Meat Sci. 2022, 192, 108882. [Google Scholar] [CrossRef] [PubMed]
  15. Ji, S.; Yang, R.; Lu, C.; Qiu, Z.; Yan, C.; Zhao, Z. Differential expression of PPARγ, FASN, and ACADM genes in various adipose tissues and longissimus dorsi muscle from Yanbian yellow cattle and Yan yellow cattle. Asian-Australas. J. Anim. Sci. 2014, 27, 10–18. [Google Scholar] [CrossRef]
  16. Moisá, S.J.; Shike, D.W.; Faulkner, D.B.; Meteer, W.T.; Keisler, D.; Loor, J.J. Central role of the PPARγ gene network in coordinating beef cattle intramuscular adipogenesis in response to weaning age and nutrition. Gene Regul. Syst. Biol. 2014, 8, 17–32. [Google Scholar] [CrossRef] [PubMed]
  17. Choy, L.; Derynck, R. Transforming growth factor-beta inhibits adipocyte differentiation by Smad3 interacting with CCAAT/enhancer-binding protein (C/EBP) and repressing C/EBP transactivation function. J. Biol. Chem. 2003, 278, 9609–9619. [Google Scholar] [CrossRef]
  18. Abebe, B.K.; Wang, H.; Li, A.; Zan, L. A review of the role of transcription factors in regulating adipogenesis and lipogenesis in beef cattle. J. Anim. Breed. Genet. 2024, 141, 235–256. [Google Scholar] [CrossRef]
  19. Carobbio, S.; Hagen, R.M.; Lelliott, C.J.; Slawik, M.; Medina-Gomez, G.; Tan, C.-Y.; Sicard, A.; Atherton, H.J.; Barbarroja, N.; Bjursell, M.; et al. Adaptive changes of the Insig1/SREBP1/SCD1 set point help adipose tissue to cope with increased storage demands of obesity. Diabetes 2013, 62, 3697–3708. [Google Scholar] [CrossRef]
  20. Xu, H.Y.; Shao, J.; Yin, B.Z.; Zhang, L.M.; Fang, J.C.; Zhang, J.S.; Xia, G.J. Bovine bta-microRNA-1271 promotes preadipocyte differentiation by targeting activation transcription factor 3. Biochemistry 2020, 85, 749–757. [Google Scholar] [CrossRef]
  21. Ma, X.; Wei, D.; Cheng, G.; Li, S.; Wang, L.; Wang, Y.; Wang, X.; Zhang, S.; Wang, H.; Zan, L. Bta-miR-130a/b regulates preadipocyte differentiation by targeting PPARG and CYP2U1 in beef cattle. Mol. Cell. Probes 2018, 42, 10–17. [Google Scholar] [CrossRef] [PubMed]
  22. Chen, X.; Raza, S.H.A.; Cheng, G.; Ma, X.; Wang, J.; Zan, L. Bta-miR-376a targeting KLF15 interferes with adipogenesis signaling pathway to promote differentiation of Qinchuan beef cattle preadipocytes. Animals 2020, 10, 2362. [Google Scholar] [CrossRef] [PubMed]
  23. Mir, B.A.; Albrecht, E.; Ali, A.; Hansson, O.; Maak, S. MicroRNA-100 reduced fetal bovine muscle satellite cell myogenesis and augmented intramuscular lipid deposition by modulating IGF1R. Cells 2022, 11, 451. [Google Scholar] [CrossRef] [PubMed]
  24. Yu, H.; Yu, S.; Guo, J.; Wang, J.; Mei, C.; Abbas Raza, S.H.; Cheng, G.; Zan, L. Comprehensive analysis of transcriptome and metabolome reveals regulatory mechanism of intramuscular fat content in beef cattle. J. Agric. Food Chem. 2024, 72, 2911–2924. [Google Scholar] [CrossRef]
  25. Wang, S.; Pan, C.; Sheng, H.; Yang, M.; Yang, C.; Feng, X.; Hu, C.; Ma, Y. Construction of a molecular regulatory network related to fat deposition by multi-tissue transcriptome sequencing of Jiaxian red cattle. iScience 2023, 26, 108346. [Google Scholar] [CrossRef]
  26. Greenwood, P.L.; Siddell, J.P.; Walmsley, B.J.; Geesink, G.H.; Pethick, D.W.; McPhee, M.J. Postweaning substitution of grazed forage with a high-energy concentrate has variable long-term effects on subcutaneous fat and marbling in Bos taurus genotypes. J. Anim. Sci. 2015, 93, 4132–4143. [Google Scholar] [CrossRef]
  27. Heeren, J.; Scheja, L. Metabolic-associated fatty liver disease and lipoprotein metabolism. Mol. Metab. 2021, 50, 101238. [Google Scholar] [CrossRef]
  28. Nguyen, P.; Leray, V.; Diez, M.; Serisier, S.; Bloc’h, J.L.; Siliart, B.; Dumon, H. Liver lipid metabolism. J. Anim. Physiol. Anim. Nutr. 2008, 92, 272–283. [Google Scholar] [CrossRef]
  29. NRC. Nutrient Requirements of Beef Cattle, 8th rev. ed.; National Academies Press: Washington, DC, USA, 2016. [Google Scholar]
  30. Matsunari, H.; Watanabe, M.; Nakano, K.; Enosawa, S.; Umeyama, K.; Uchikura, A.; Yashima, S.; Fukuda, T.; Klymiuk, N.; Kurome, M.; et al. Modeling lethal X-linked genetic disorders in pigs with ensured fertility. Proc. Natl. Acad. Sci. USA 2018, 115, 708–713. [Google Scholar] [CrossRef]
  31. Wang, X.; Zhang, Y.; Zhang, X.; Wang, D.; Jin, G.; Li, B.; Xu, F.; Cheng, J.; Zhang, F.; Wu, S.; et al. The comprehensive liver transcriptome of two cattle breeds with different intramuscular fat content. Biochem. Biophys. Res. Commun. 2017, 490, 1018–1025. [Google Scholar] [CrossRef]
  32. Dehghanian Reyhan, V.; Ghafouri, F.; Sadeghi, M.; Miraei-Ashtiani, S.R.; Kastelic, J.P.; Barkema, H.W.; Shirali, M. Integrated Comparative transcriptome and circRNA-lncRNA-miRNA-mRNA ceRNA regulatory network analyses identify molecular mechanisms associated with intramuscular fat content in beef cattle. Animals 2023, 13, 2598. [Google Scholar] [CrossRef]
  33. Gao, K.; Han, S.; Li, Z.; Luo, Z.; Lv, S.; Choe, H.M.; Paek, H.J.; Quan, B.; Kang, J.; Yin, X. Analysis of metabolome and transcriptome of longissimus thoracis and subcutaneous adipose tissues reveals the regulatory mechanism of meat quality in MSTN mutant castrated male finishing pigs. Meat Sci. 2024, 207, 109370. [Google Scholar] [CrossRef]
  34. Costa, T.C.; Gionbelli, M.P.; Duarte, M.S. Fetal programming in ruminant animals: Understanding the skeletal muscle development to improve meat quality. Anim. Front. 2021, 11, 66–73. [Google Scholar] [CrossRef] [PubMed]
  35. Owens, F.N.; Dubeski, P.; Hanson, C.F. Factors that alter the growth and development of ruminants. J. Anim. Sci. 1993, 71, 3138–3150. [Google Scholar] [CrossRef]
  36. Wang, Z.; An, X.; Yang, Y.; Zhang, L.; Jiao, T.; Zhao, S. Comprehensive analysis of the longissimus dorsi transcriptome and metabolome reveals the regulatory mechanism of different varieties of meat quality. J. Agric. Food Chem. 2023, 71, 1234–1245. [Google Scholar] [CrossRef] [PubMed]
  37. Li, X.; Xie, F.; Li, R.; Li, L.; Ren, M.; Jin, M.; Zhou, J.; Wang, C.; Li, S. Integrated 4D analysis of intramuscular fat deposition: Quantitative proteomic and transcriptomic studies in Wannanhua pig longissimus dorsi muscle. Animals 2024, 14, 167. [Google Scholar] [CrossRef] [PubMed]
  38. Cheng, J.; Wang, L.; Wang, S.; Chen, R.; Zhang, T.; Ma, H.; Lu, H.; Yuan, G. Transcriptomic analysis of thigh muscle of Lueyang black-bone chicken in free-range and caged feeding. Anim. Biotechnol. 2023, 34, 785–795. [Google Scholar] [CrossRef]
  39. Lim, D.; Chai, H.-H.; Lee, S.-H.; Cho, Y.-M.; Choi, J.-W.; Kim, N.-K. Gene expression patterns associated with peroxisome proliferator-activated receptor (PPAR) signaling in the longissimus dorsi of Hanwoo (Korean cattle). Asian-Australas. J. Anim. Sci. 2015, 28, 1075–1083. [Google Scholar] [CrossRef]
  40. Liu, X.; Li, S.; Wang, L.; Zhang, W.; Wang, Y.; Gui, L.; Zan, L.; Zhao, C. The effect of FATP1 on adipocyte differentiation in Qinchuan beef cattle. Animals 2021, 11, 2789. [Google Scholar] [CrossRef]
  41. Zhao, Z.D.; Li, A.N.; Wei, S.J.; Wang, M.M.; Li, S.J.; Zan, L.S. Genetic polymorphisms of the FATP1 gene and their associations with meat quality traits in Chinese Qinchuan cattle. Genet. Mol. Res. 2015, 14, 17439–17446. [Google Scholar] [CrossRef]
  42. Yang, X.; Ma, X.; Mei, C.; Zan, L. A genome-wide landscape of mRNAs, lncRNAs, circRNAs and miRNAs during intramuscular adipogenesis in cattle. BMC Genom. 2022, 23, 691. [Google Scholar] [CrossRef]
  43. Wanders, R.J.; Vreken, P.; Ferdinandusse, S.; Jansen, G.A.; Waterham, H.R.; van Roermund, C.W.; Van Grunsven, E.G. Peroxisomal fatty acid alpha- and beta-oxidation in humans: Enzymology, peroxisomal metabolite transporters and peroxisomal diseases. Biochem. Soc. Trans. 2001, 29 Pt 2, 250–267. [Google Scholar] [CrossRef]
  44. Zhang, M.; Zha, X.; Ma, X.; La, Y.; Guo, X.; Chu, M.; Bao, P.; Yan, P.; Wu, X.; Liang, C. Genome-wide transcriptome profiling reveals the mechanisms underlying hepatic metabolism under different raising systems in yak. Animals 2024, 14, 695. [Google Scholar] [CrossRef] [PubMed]
  45. Yu, H.; Wang, J.; Zhang, K.; Cheng, G.; Mei, C.; Zan, L. Integrated multi-omics analysis reveals variation in intramuscular fat among muscle locations of Qinchuan cattle. BMC Genom. 2023, 24, 367. [Google Scholar] [CrossRef] [PubMed]
  46. Liu, L.; Cui, H.; Fu, R.; Zheng, M.; Liu, R.; Zhao, G.; Wen, J. The regulation of IMF deposition in pectoralis major of fast- and slow-growing chickens at hatching. J. Anim. Sci. Biotechnol. 2017, 8, 77. [Google Scholar] [CrossRef] [PubMed]
  47. López-Viñas, E.; Bentebibel, A.; Gurunathan, C.; Morillas, M.; de Arriaga, D.; Serra, D.; Asins, G.; Hegardt, F.G.; Gómez-Puertas, P. Definition by functional and structural analysis of two malonyl-CoA sites in carnitine palmitoyltransferase 1A. J. Biol. Chem. 2007, 282, 18212–18224. [Google Scholar] [CrossRef]
  48. Chen, W.; Xiao, Y.; Yang, F.; Liufu, S.; Gong, Y.; Li, Z.; Zhang, S.; Tang, S.; Li, B.; Ma, H. Integrated analysis of muscle transcriptome, miRNA, and proteome of Chinese indigenous breed Ningxiang pig in three developmental stages. Front. Genet. 2024, 15, 1393834. [Google Scholar] [CrossRef]
  49. Houten, S.M.; Wanders, R.J. A general introduction to the biochemistry of mitochondrial fatty acid β-oxidation. J. Inherit. Metab. Dis. 2010, 33, 469–477. [Google Scholar] [CrossRef]
  50. Li, A.; Li, Y.; Wang, Y.; Wang, Y.; Li, X.; Qubi, W.; Xiong, Y.; Zhu, J.; Liu, W.; Lin, Y. ACADL Promotes the differentiation of goat intramuscular adipocytes. Animals 2023, 13, 281. [Google Scholar] [CrossRef]
  51. Chang, C.C.; Sakashita, N.; Ornvold, K.; Lee, O.; Chang, E.T.; Dong, R.; Lin, S.; Lee, C.Y.; Strom, S.C.; Kashyap, R.; et al. Immunological quantitation and localization of ACAT-1 and ACAT-2 in human liver and small intestine. J. Biol. Chem. 2000, 275, 28083–28092. [Google Scholar] [CrossRef]
  52. Silva-Vignato, B.; Coutinho, L.L.; Poleti, M.D.; Cesar, A.S.M.; Moncau, C.T.; Regitano, L.C.A.; Balieiro, J.C.C. Gene co-expression networks associated with carcass traits reveal new pathways for muscle and fat deposition in Nelore cattle. BMC Genom. 2019, 20, 32. [Google Scholar] [CrossRef] [PubMed]
  53. Kiema, T.R.; Harijan, R.K.; Strozyk, M.; Fukao, T.; Alexson, S.E.; Wierenga, R.K. The crystal structure of human mitochondrial 3-ketoacyl-CoA thiolase (T1): Insight into the reaction mechanism of its thiolase and thioesterase activities. Acta Crystallogr. D Biol. Crystallogr. 2014, 70 Pt 12, 3212–3225. [Google Scholar] [CrossRef] [PubMed]
  54. Zhang, Y.; Wang, Y.; Wang, X.; Ji, Y.; Cheng, S.; Wang, M.; Zhang, C.; Yu, X.; Zhao, R.; Zhang, W.; et al. Acetyl-coenzyme A acyltransferase 2 promote the differentiation of sheep precursor adipocytes into adipocytes. J. Cell. Biochem. 2019, 120, 8021–8031. [Google Scholar] [CrossRef]
  55. Zhang, Y.; Wang, Y.; Wang, H.; Ma, X.; Zan, L. MicroRNA-224 impairs adipogenic differentiation of bovine preadipocytes by targeting LPL. Mol. Cell. Probes 2019, 44, 29–36. [Google Scholar] [CrossRef] [PubMed]
  56. Criado-Mesas, L.; Ballester, M.; Crespo-Piazuelo, D.; Castelló, A.; Fernández, A.I.; Folch, J.M. Identification of eQTLs associated with lipid metabolism in Longissimus dorsi muscle of pigs with different genetic backgrounds. Sci. Rep. 2020, 10, 9845. [Google Scholar] [CrossRef]
  57. Cui, H.; Wang, Y.; Zhu, Y.; Liu, X.; Liu, L.; Wang, J.; Tan, X.; Wang, Y.; Xing, S.; Luo, N.; et al. Genomic insights into the contribution of de novo lipogenesis to intramuscular fat deposition in chicken. J. Adv. Res. 2024, 65, 19–31. [Google Scholar] [CrossRef]
Figure 1. Histological analysis of longissimus dorsi (LD) muscle in (A) high and (B) low intramuscular fat (IMF) groups. Left panels: photographs of LD muscle samples; right panels: HE-stained sections of LD muscle with scale bars indicating 2 mm. Morphometric measurements of (C) myocytes and (D) adipocytes. The asterisks indicating significance level: *** p < 0.001.
Animals 15 01306 g001
Figure 2. Differential gene expression (DEG) and clustering analysis in liver and muscle with varying intramuscular fat (IMF) content. (A) Number of DEGs; (B) Venn diagram of shared DEGs; Volcano plots in (C) liver (LL vs. HL) and (D) muscle (LM vs. HM); Hierarchical clustering of gene expression in (E) liver and (F) muscle.
Animals 15 01306 g002
Figure 3. Functional annotation analysis of DEGs among different groups: (A) top 20 Gene Ontology (GO) pathways in the liver; (B) top 20 GO pathways in muscle; (C) top 20 Kyoto Encyclopedia of Genes and Genomes (KEGG) pathways in the liver; (D) top 20 KEGG pathways in muscle.
Animals 15 01306 g003
Figure 4. Lipid metabolism pathways in liver and muscle tissue: (A) GO terms in liver tissue; (B) GO terms in muscle tissue; (C) KEGG pathways in liver tissue; (D) KEGG pathways in muscle tissue.
Animals 15 01306 g004
Figure 5. Overlapping genes and expression profiles: (A) Venn diagram of overlapping DEGs, GO−DEGs, and KEGG−DEGs; (B) heatmap of overlapping gene expression in liver tissue; (C) heatmap of overlapping gene expression in muscle tissue.
Animals 15 01306 g005
Figure 6. Identification of hub genes regulating IMF deposition. (A) Correlation analysis of gene expression and IMF content. Values represent Pearson’s correlation coefficients (r), with asterisks indicating significance levels: * p < 0.05, ** p < 0.01, *** p < 0.001. (B) Protein–protein interaction (PPI) network and ranking of hub genes. Node color intensity indicates ranking by the Maximal Clique Centrality (MCC) algorithm (darker color = higher rank). (C) GO enrichment analysis of biological processes for genes in cluster 1. (D) KEGG pathway enrichment analysis for genes in cluster 1.
Animals 15 01306 g006
Figure 7. Mechanism regulating intramuscular fat deposition in the liver and LD muscle. Red nodes: upregulation; green nodes: downregulation. Abbreviations: SLC27A1: solute carrier family 27 member 1; CD36: cluster of differentiation 36; ACSM5: acyl−CoA synthetase medium chain family member 5; ACOX2/3: acyl−CoA oxidase 2/3; LPL: lipoprotein lipase; CPT1B/2: carnitine palmitoyltransferase 1B/2; ACADL: long−chain acyl−CoA dehydrogenase; ACAA2: acetyl−CoA acyltransferase 2; TCA cycle: tricarboxylic acid cycle; VLDLTAG: very low−density lipoprotein−associated triacylglycerol; G−3−P: glycerol−3−phosphate.
Animals 15 01306 g007
Figure 8. qRT−PCR validation of RNA−Seq data: (A) liver gene expression; (B) muscle gene expression; (C) Pearson correlation between qRT−PCR and RNA-Seq expression, each point represents a gene.
Animals 15 01306 g008
Table 1. Carcass and meat quality traits of high and low groups.
TraitsHigh IMF GroupLow IMF Groupp
Carcass weight/kg421.50 ± 44.16425.00 ± 55.240.924
IMF/%29.02 ± 6.2811.70 ± 1.100.010
Fat color2.00 ± 0.002.50 ± 0.580.134
Meat color2.00 ± 0.003.00 ± 0.00-
Marbling level4.25 ± 0.501.75 ± 0.500.000
Disclaimer/Publisher’s Note: The statements, opinions and data contained in all publications are solely those of the individual author(s) and contributor(s) and not of MDPI and/or the editor(s). MDPI and/or the editor(s) disclaim responsibility for any injury to people or property resulting from any ideas, methods, instructions or products referred to in the content.

