Evaluating Pulmonary Arterial Pressure in Angus Yearling Bulls at High Elevation: Associations with Birth Traits and Growth Performance

 , , ,
, , ,
Simple Summary
Abstract
1. Introduction
2. Materials and Methods
3. Results
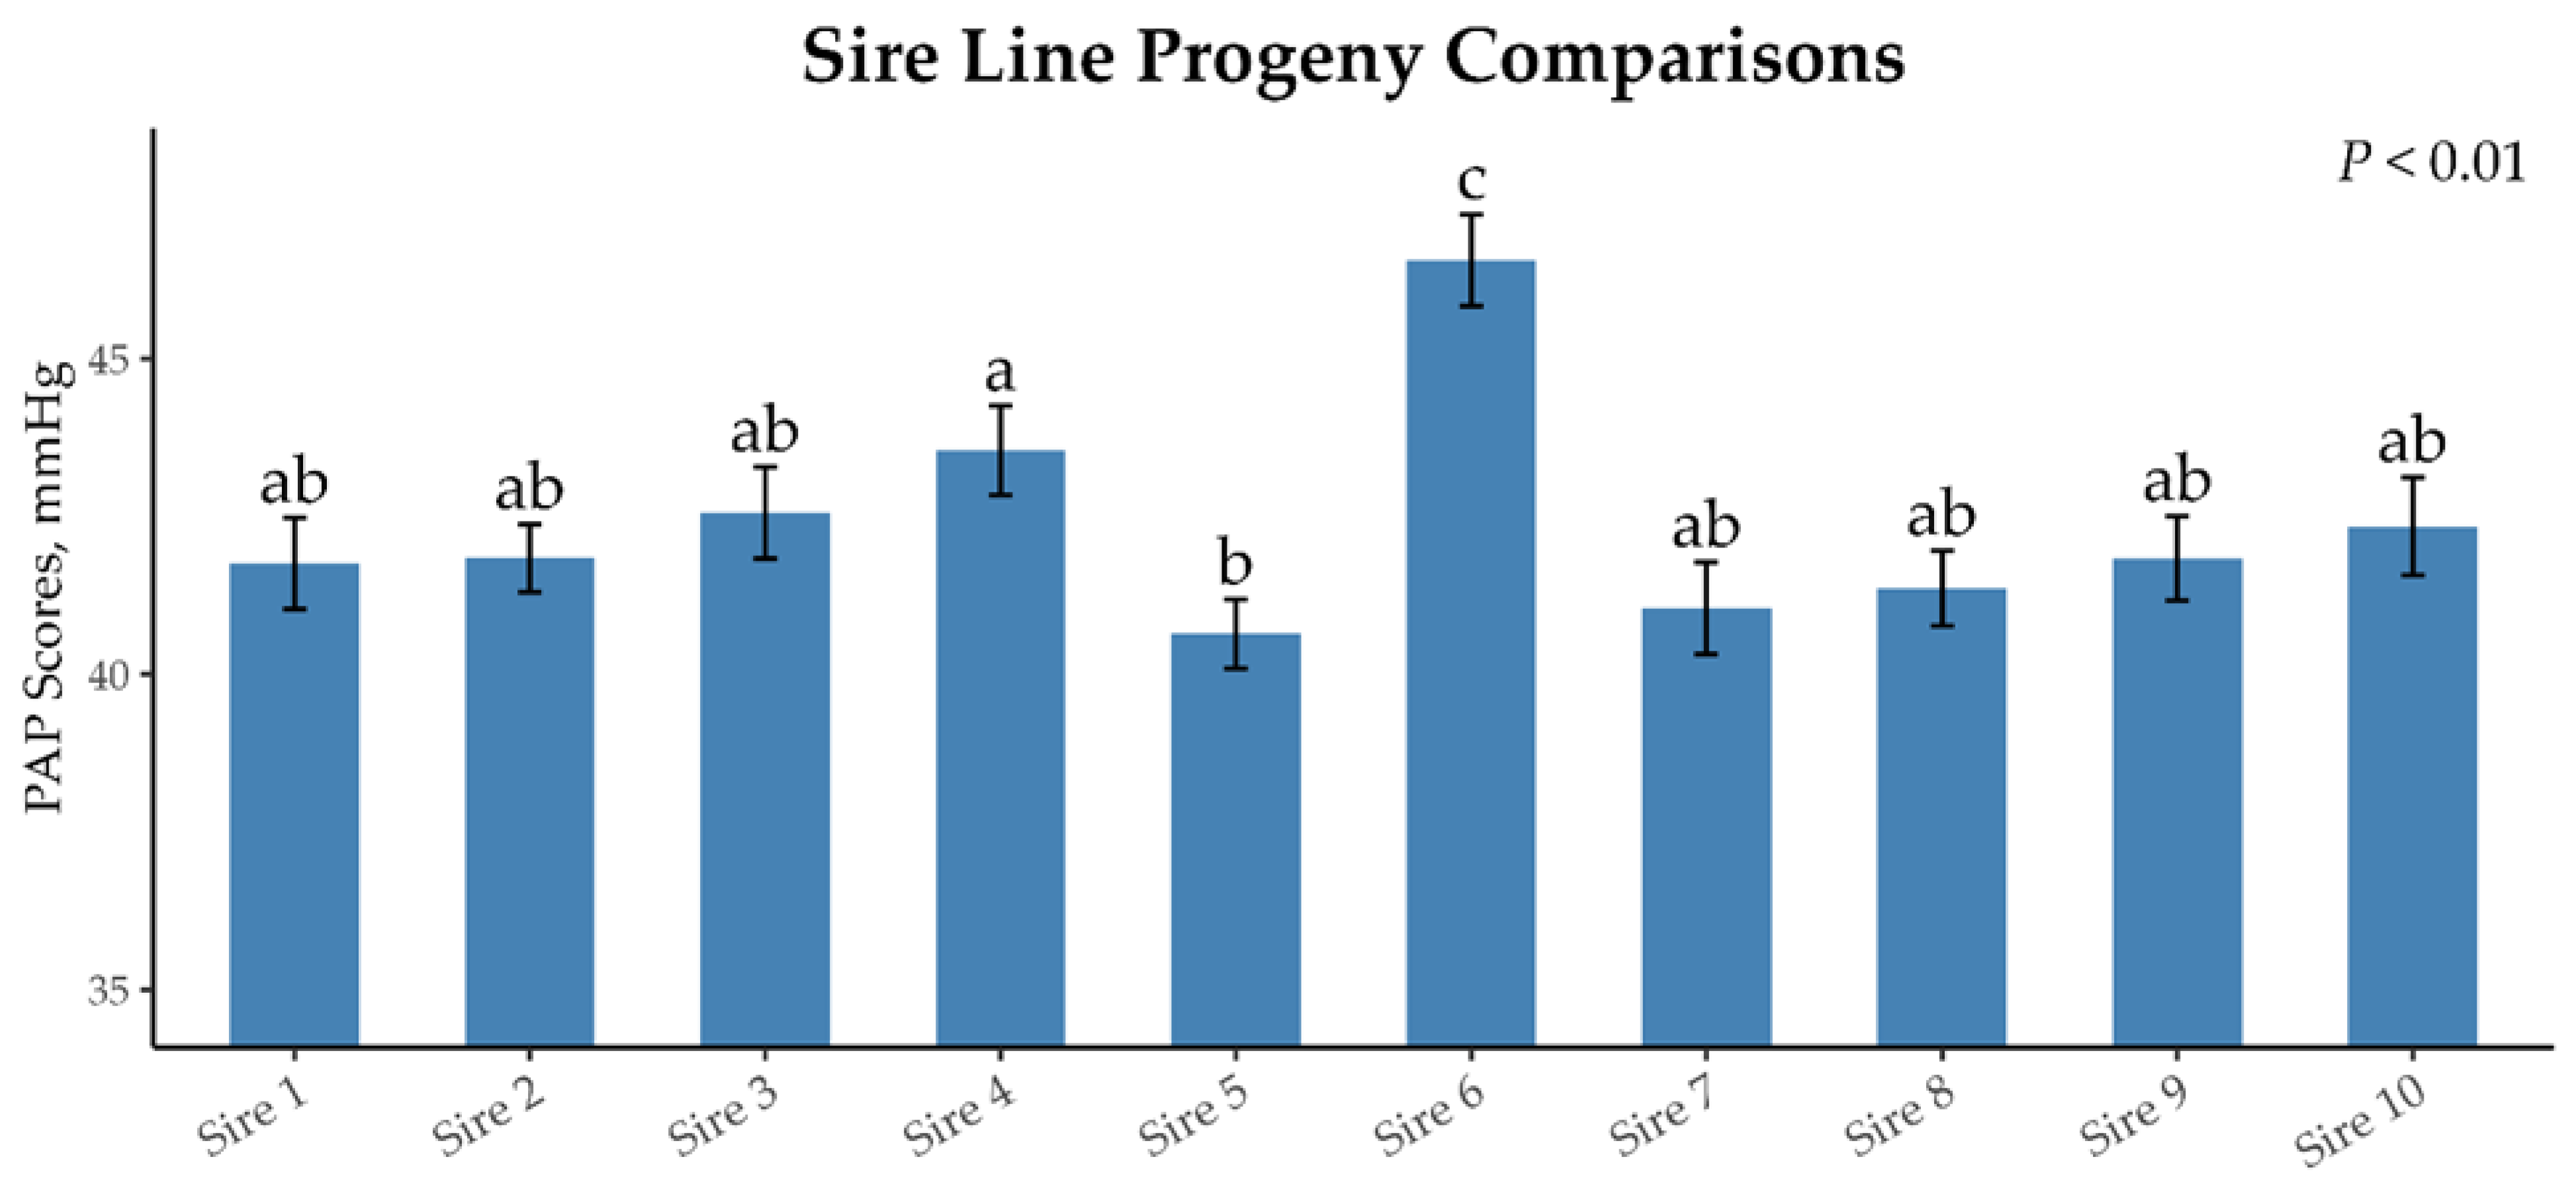
3.1. Sire Line Progeny Analysis
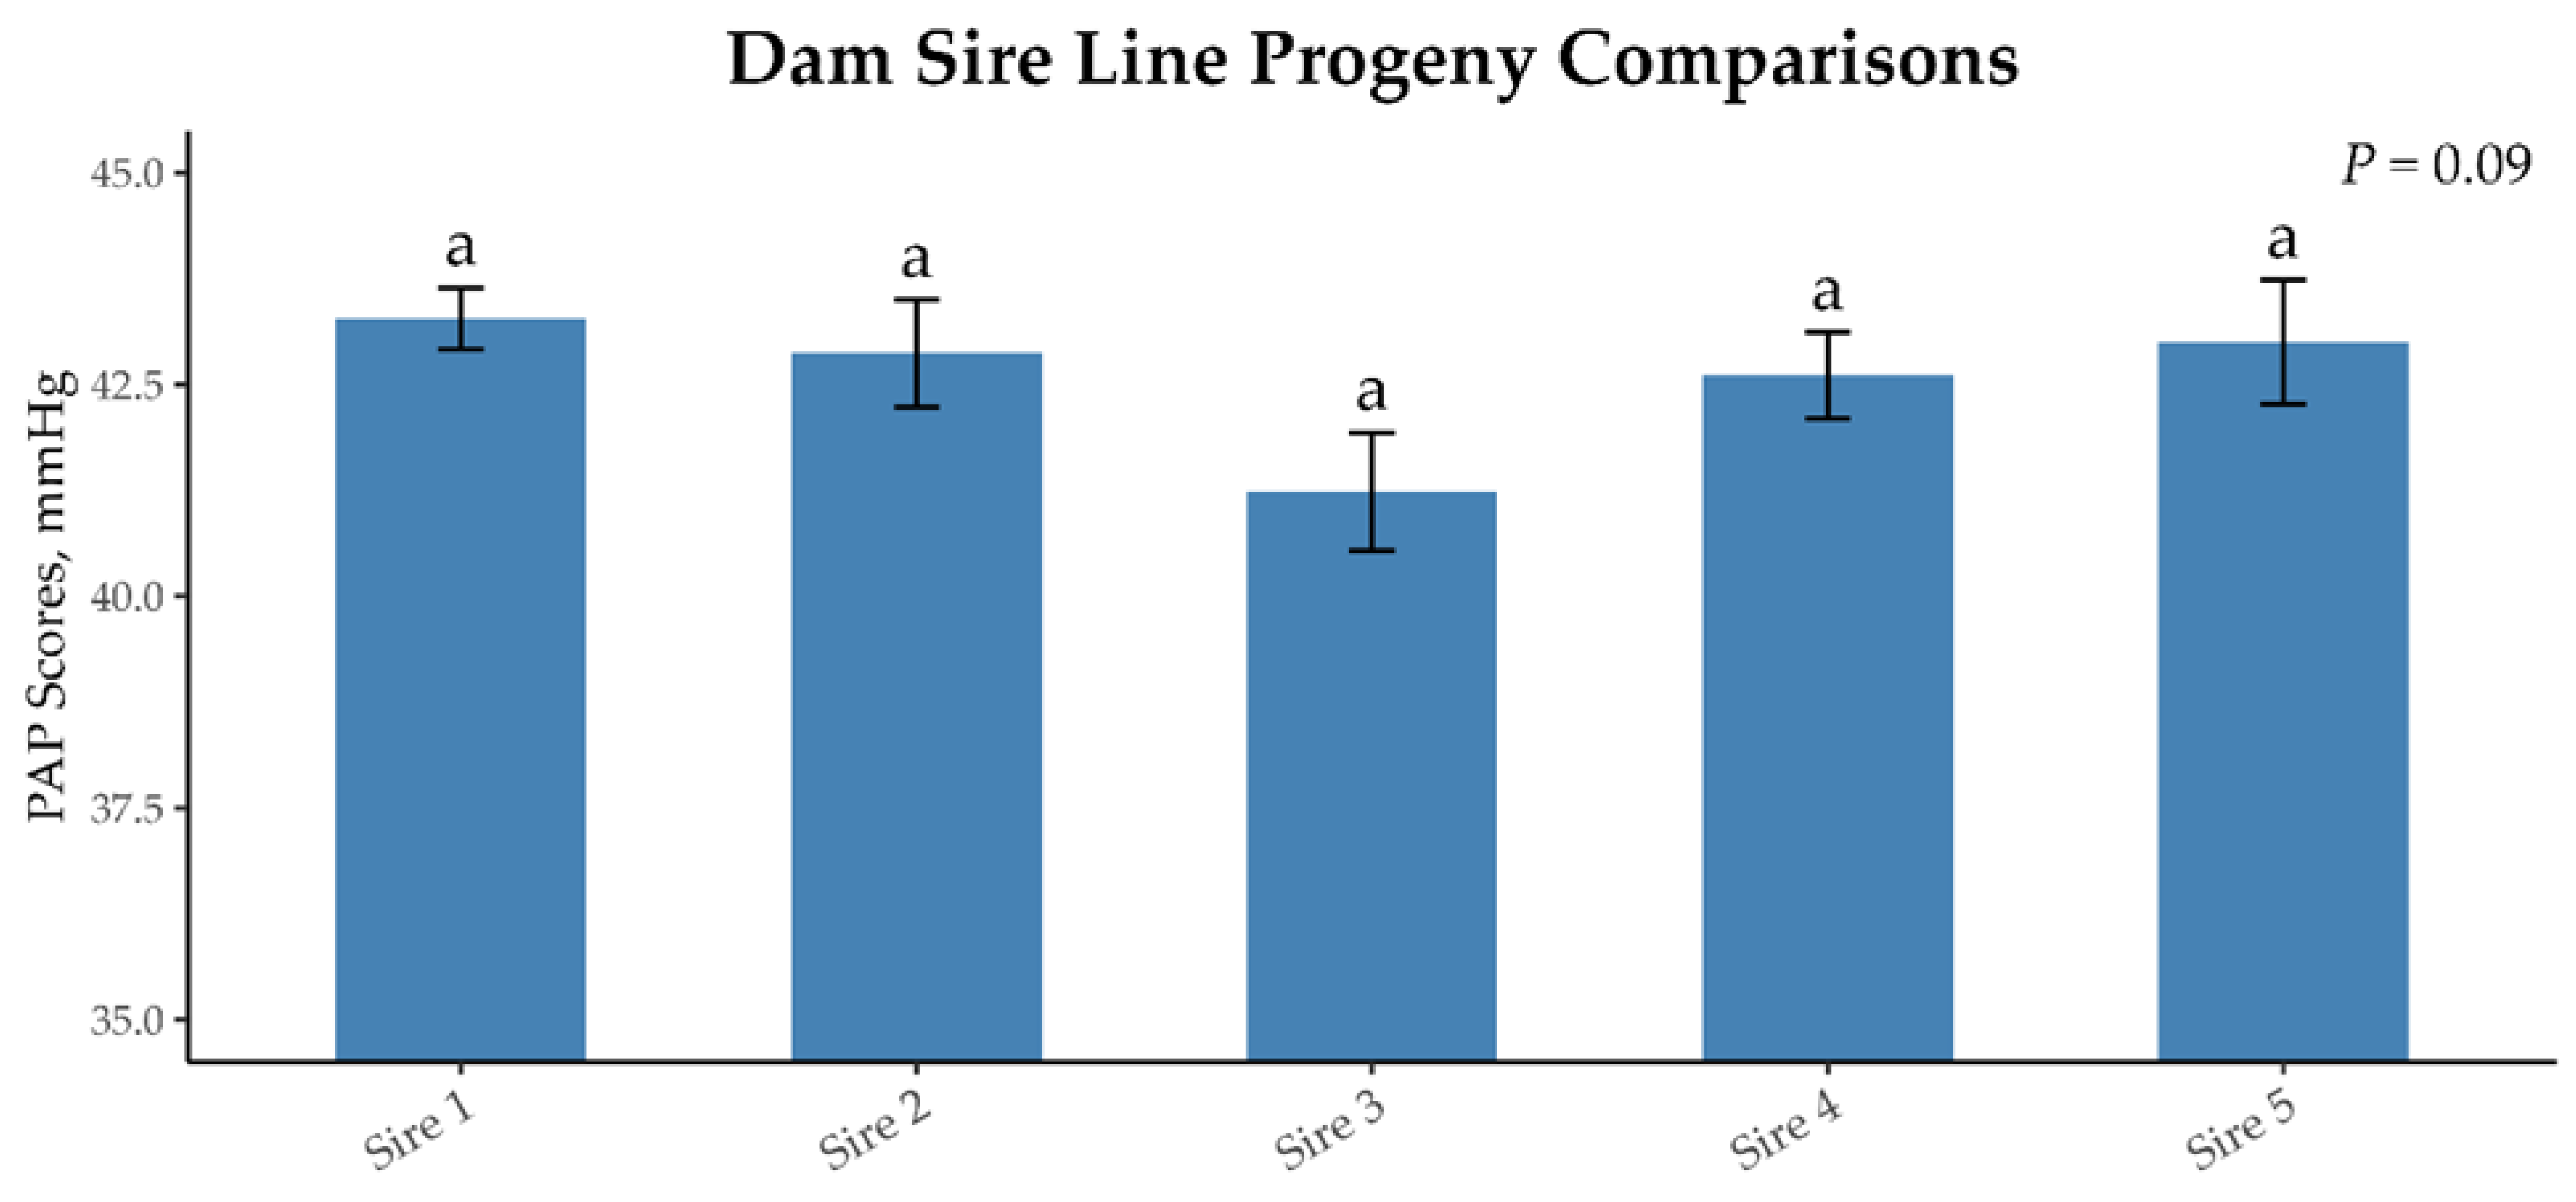
3.2. DamSire Line Progeny Analysis
4. Discussion
5. Conclusions
Author Contributions
Funding
Institutional Review Board Statement
Informed Consent Statement
Data Availability Statement
Acknowledgments
Conflicts of Interest
Abbreviations
| PAP | Pulmonary arterial pressure |
| HAD | High altitude disease |
| HMD | High Mountain Disease |
| RHF | Right-sided heart failure |
| mmHg | Millimeters of mercury |
| AAA | American Angus Association |
| AICc | Akaike’s Information Criterion adjusted for small sample sizes |
| EPD | Expected Progeny Differences |
| CV | Coefficient of variation |
References
- Holt, T.N.; Callan, R.J. Pulmonary arterial pressure testing for high mountain disease in cattle. Vet. Clin. N. Am. Food Anim. Pract. 2007, 23, 575–596. [Google Scholar] [CrossRef] [PubMed]
- Markel, C.D. Characterizing Effects of Management Strategy and Degree of Pulmonary Hypertension on Live Growth Performance, Carcass Quality, and Respiratory Microbiome of Finishing Beef Cattle. Master’s Thesis, University of Wyoming, Laramie, WY, USA, 2023. [Google Scholar]
- Glover, G.H.; Newsom, I.E. Brisket Disease: Dropsy of High Altitudes; Agricultural Experimnet Station of the Agricultural College of Colorado: Fort Collins, CO, USA, 1914; Volume 204. [Google Scholar]
- Williams, J.L.; Bertrand, J.K.; Misztal, I.; Łukaszewicz, M. Genotype by environment interaction for growth due to altitude in United States Angus cattle. Anim. Sci. J. 2012, 90, 2152–2158. [Google Scholar] [CrossRef]
- Alexander, A.; Jensen, R. Pulmonary Vascular Pathology of Bovine High Mountain Disease. Am. J. Vet. Res. 1963, 24, 1098–1111. [Google Scholar]
- Heath, D.; Castillo, Y.; Arias-Stella, J.; Harris, P. The small pulmonary arteries of the llama and other domestic animals native to high altitudes. Cardiovasc. Res. 1969, 3, 75–78. [Google Scholar] [CrossRef] [PubMed]
- Alexander, A. The bovine lung: Normal vascular histology and vascular lesions in high mountain disease. Respiration 1962, 19, 528–542. [Google Scholar] [CrossRef]
- Veit, H.; Farrell, R. The anatomy and physiology of the bovine respiratory system relating to pulmonary disease. Cornell Vet. 1978, 68, 555–581. [Google Scholar]
- Stearns, K.; DelCurto-Wyffels, H.; Wyffels, S.; Van Emon, M.; DelCurto, T. The Use of Pulmonary Arterial Pressure (PAP) for Improved Beef Cattle Management. Animals 2024, 14, 2430. [Google Scholar] [CrossRef] [PubMed]
- Pauling, R.C.; Speidel, S.E.; Thomas, M.G.; Holt, T.N.; Enns, R.M. Genetic parameters for pulmonary arterial pressure, yearling performance, and carcass ultrasound traits in Angus cattle. Anim. Sci. J. 2023, 101, skad228. [Google Scholar] [CrossRef]
- Neary, J.M. Epidemiological, Physiological and Genetic Risk Factors Associated with Congestive Heart Failure and Mean Pulmonary Arterial Pressure in Cattle. Ph.D. Dissertation, Colorado State Univeristy, Fort Collins, CO, USA, 2014. [Google Scholar]
- Thomas, M.G.; Neary, J.M.; Krafsur, G.M.; Holt, T.N.; Enns, R.M.; Speidel, S.E.; Garry, F.B.; Canovas, A.; Medrano, J.F.; Brown, R.D.; et al. Pulmonary Hypertension (PH) in Beef Cattle: Complicated Threat to Health and Productivity in Multiple Beef Industry Segments. In Certified Angus Beef (CAB) White Paper; Certified Angus Beef: Wooster, OH, USA, 2018. [Google Scholar]
- Heaton, M.P.; Bassett, A.S.; Whitman, K.J.; Krafsur, G.M.; Lee, S.I.; Carlson, J.M.; Clark, H.J.; Smith, H.R.; Pelster, M.C.; Basnayake, V.; et al. Evaluation of EPAS1 variants for association with bovine congestive heart failure. F1000Research 2019, 8, 1189. [Google Scholar] [CrossRef]
- Ahola, J.; Enns, R.; Holt, T. Examination of potential methods to predict pulmonary arterial pressure score in yearling beef cattle. Anim. Sci. J. 2006, 84, 1259–1264. [Google Scholar] [CrossRef]
- Shirley, K.L.; Beckman, D.W.; Garrick, D.J. Inheritance of pulmonary arterial pressure in Angus cattle and its correlation with growth. Anim. Sci. J. 2008, 86, 815–819. [Google Scholar] [CrossRef]
- Will, D.H.; Horrell, J.F.; Reeves, J.T.; Alexander, A.F. Influence of altitude and age on pulmonary arterial pressure in cattle. Proc. Soc. Exp. Biol. Med. 1975, 150, 564–567. [Google Scholar] [CrossRef]
- Neary, J.M.; Garry, F.B.; Holt, T.N.; Thomas, M.G.; Enns, R.M. Mean pulmonary arterial pressures in Angus steers increase from cow–calf to feedlot–finishing phases. Anim. Sci. J. 2015, 93, 3854–3861. [Google Scholar] [CrossRef] [PubMed]
- Speidel, S.E.; Thomas, M.G.; Holt, T.N.; Enns, R.M. Evaluation of the sensitivity of pulmonary arterial pressure to elevation using a reaction norm model in Angus Cattle. Anim. Sci. J. 2020, 98, skaa129. [Google Scholar] [CrossRef] [PubMed]
- Will, D.H.; McMurtry, I.F.; Reeves, J.T.; Grover, R.F. Cold-induced pulmonary hypertension in cattle. J. Appl. Physiol. 1978, 45, 469–473. [Google Scholar] [CrossRef]
- Franklin, A.B.; Anderson, D.R.; Gutiérrez, R.J.; Burnham, K.P. Climate, habitat quality, and fitness in northern spotted owl populations in northwestern California. Ecol. Monogr. 2000, 70, 539–590. [Google Scholar] [CrossRef]
- Burnham, K.P. A practical information-theoretic approach. In Model Selection and Multimodel Inference; Springer: New York, NY, USA, 1998. [Google Scholar]
- Bates, D.; Machler, M.; Bolker, B.M.; Walker, S.C. Fitting linear mixed-effects models using lme4. J. Stat. Softw. 2015, 67, 1–48. [Google Scholar] [CrossRef]
- Kuznetsova, A.; Brockhoff, P.B.; Christensen, R.H.B. lmerTest package: Tests in linear mixed effects models. J. Stat. Softw. 2017, 82, 1–26. [Google Scholar] [CrossRef]
- Arnold, T.W. Uninformative Parameters and Model Selection Using Akaike’s Information Criterion. J. Wildl. Manage 2010, 74, 1175–1178. [Google Scholar] [CrossRef]
- Bartoń, K. MuMIn: Multi-Model Inference, R package version 1.46.0; R Foundation for Statistical Computing: Vienna, Austria, 2022.
- Nakagawa, S.; Schielzeth, H. A general and simple method for obtaining R2 from generalized linear mixed-effects models. Methods Ecol. Evol. 2013, 4, 133–142. [Google Scholar] [CrossRef]
- R Core Team. R: A Language and Environment for Statistical Computing; R Foundation for Statistical Computing: Vienna, Austria, 2023. [Google Scholar]
- Fox, J.; Weisberg, S. An R Companion to Applied Regression; Sage Publications: Los Angeles, LA, USA, 2018. [Google Scholar]
- Lenth, R. R Package, Version 1.7.2. Emmeans: Estimated Marginal Means, Aka Least-Squares Means. R Foundation for Statistical Computing: Vienna, Austria, 2022. [Google Scholar]
- Eigenmann, U.J.; Schoon, H.A.; Jahn, D.; Grunert, E. Neonatal respiratory distress syndrome in the calf. Vet. Rec. 1984, 114, 141–144. [Google Scholar] [CrossRef] [PubMed]
- Benesi, F.J. Neonatal calf asphyxia syndrome. Importance and critical evaluation. Arch. Sch. Vet. Med. Fed. Univ. Bahia 1993, 16, 38–48. [Google Scholar]
- Foxworthy, H.; Enns, R.; Speidel, S.; Thomas, M.; Holt, T. 286 Gestation length as a weak predictor of yearling pulmonary arterial pressure and risk of developing high altitude disease in Angus cattle at high elevation. Anim. Sci. J. 2018, 96, 106–107. [Google Scholar] [CrossRef]
- Crawford, N.F.; Thomas, M.G.; Holt, T.N.; Speidel, S.E.; Enns, R.M. Heritabilities and genetic correlations of pulmonary arterial pressure and performance traits in Angus cattle at high altitude. Anim. Sci. J. 2016, 94, 4483–4490. [Google Scholar] [CrossRef] [PubMed]
- Schimmel, J.G. Genetic Aspects of High Mountain Disease in Beef Cattle. Ph.D. Dissertation, Colorado State University, Fort Collins, CO, USA, 1981. [Google Scholar]
- Enns, R.M.; Brinks, J.S.; Bourdon, R.M.; Field, T.G. Heritability of pulmonary arterial pressure in Angus cattle. In Proceedings of the Western Section, American Society of Animal Science, Phoenix, AZ, USA, 8–10 July 1992; p. 112. [Google Scholar]
- Cockrum, R.R.; Zeng, X.; Berge, N.F.; Neary, J.M.; Garry, F.B.; Holt, T.; Blackburn, H.D.; Thomas, S.; Speidel, S.E.; Garrick, D.J.; et al. Angus cattle at high altitude: Genetic relationships and initial genome-wide association analysis of pulmonary arterial pressure. In Proceedings of the World Congress on Genetics Applied to Livestock Production, Vancouver, BC, Canada, 17–22 August 2014. [Google Scholar]

| Model 1 | K 2 | AICc 3 | ΔAICc 4 | Wi 5 | p-Value |
|---|---|---|---|---|---|
| Gestation Length | |||||
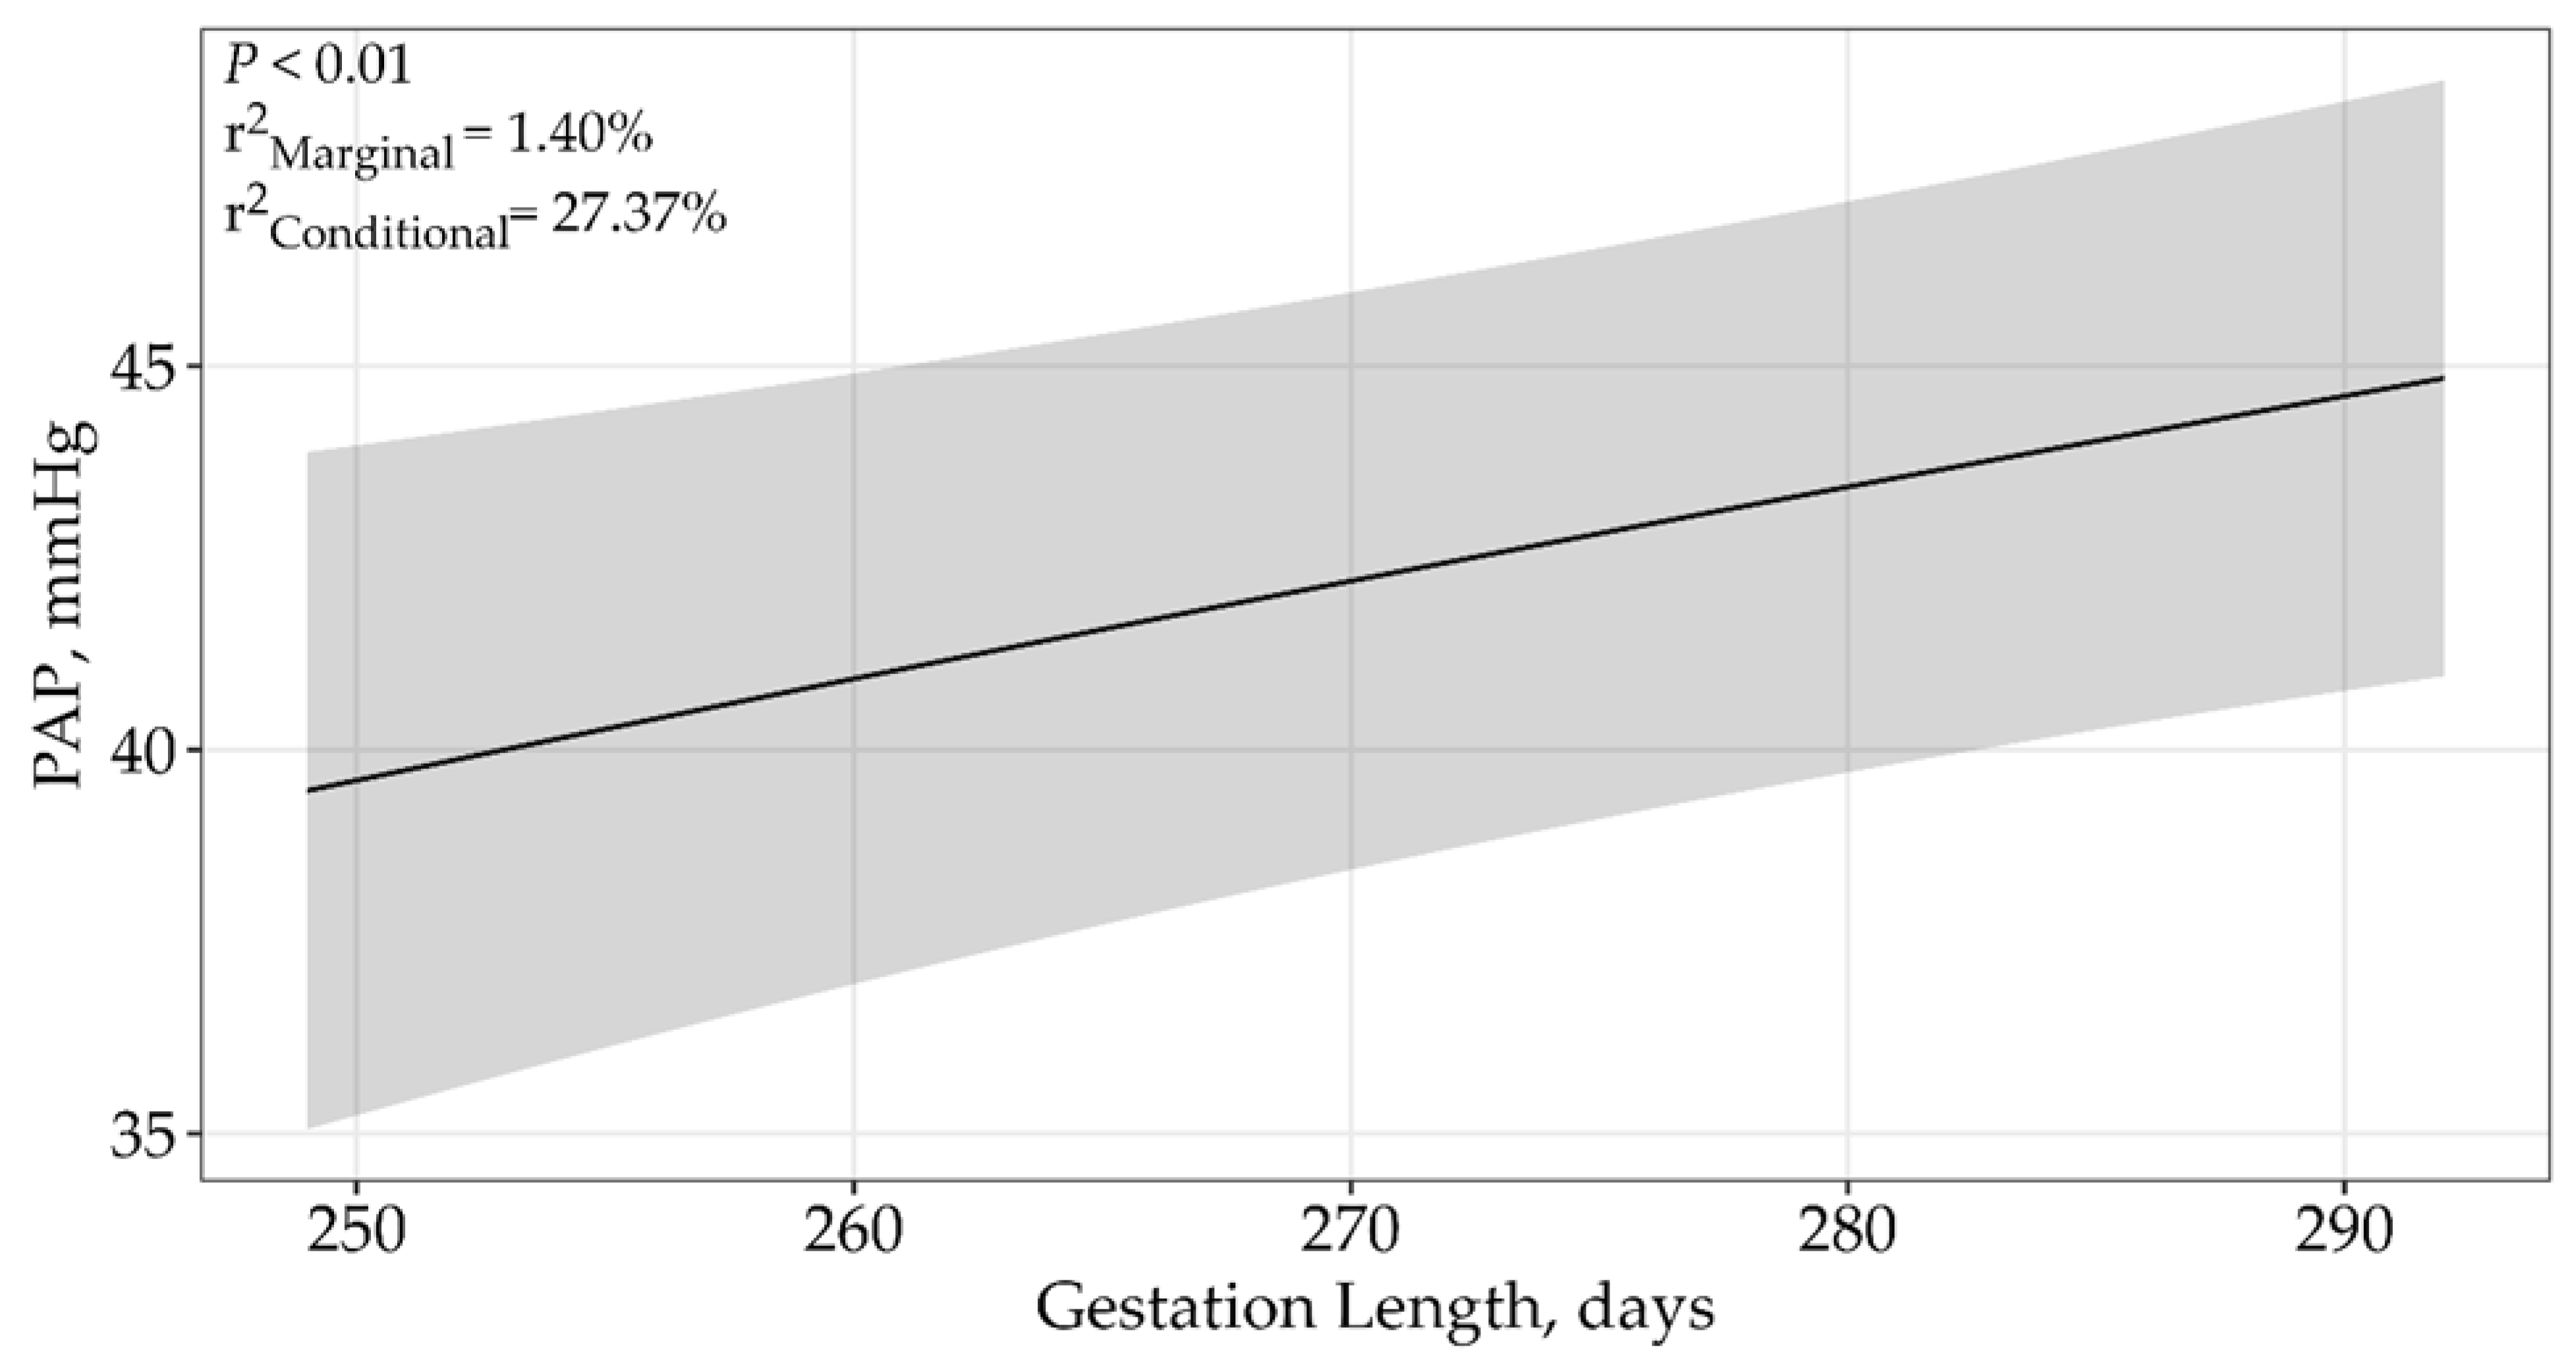
| ln(Gestation Length) | 4 | 2783.65 | 0 | 1 | <0.01 |
| Gestation Length | 4 | 2784.86 | 11.20 | 0 | <0.01 |
| (Gestation Length) 2 | 5 | 2806.20 | 22.55 | 0 | 0.85 |
| Birth Weight | |||||
| ln(Birth Weight) | 4 | 33,627.32 | 0 | 0.97 | <0.01 |
| Birth Weight | 4 | 33,363.42 | 7.29 | 0.03 | <0.01 |
| (Birth Weight) 2 | 5 | 33,374.95 | 18.18 | 0 | 0.82 |
| Weaning Weight | |||||
| ln(Weaning Weight) | 4 | 33,627.32 | 0 | 1 | 0.24 |
| Weaning Weight | 4 | 33,638.66 | 11.35 | 0 | 0.26 |
| (Weaning Weight) 2 | 5 | 33,658.47 | 31.15 | 0 | 0.72 |
| Yearling Weight | |||||
| ln(Yearling Weight) | 4 | 33,612.76 | 0 | 1 | 0.04 |
| Yearling Weight | 4 | 33,625.17 | 12.58 | 0 | 0.04 |
| (Yearling Weight) 2 | 5 | 33,646.23 | 33.47 | 0 | 0.64 |
| Growth from Birth to Weaning | |||||
| ln(Growth from Birth to Weaning) | 4 | 33,215.41 | 0 | 0.99 | 0.03 |
| Growth from Birth to Weaning | 4 | 33,225.35 | 9.94 | 0.01 | 0.05 |
| (Growth from Birth to Weaning) 2 | 5 | 33,243.76 | 28.35 | 0 | 0.23 |
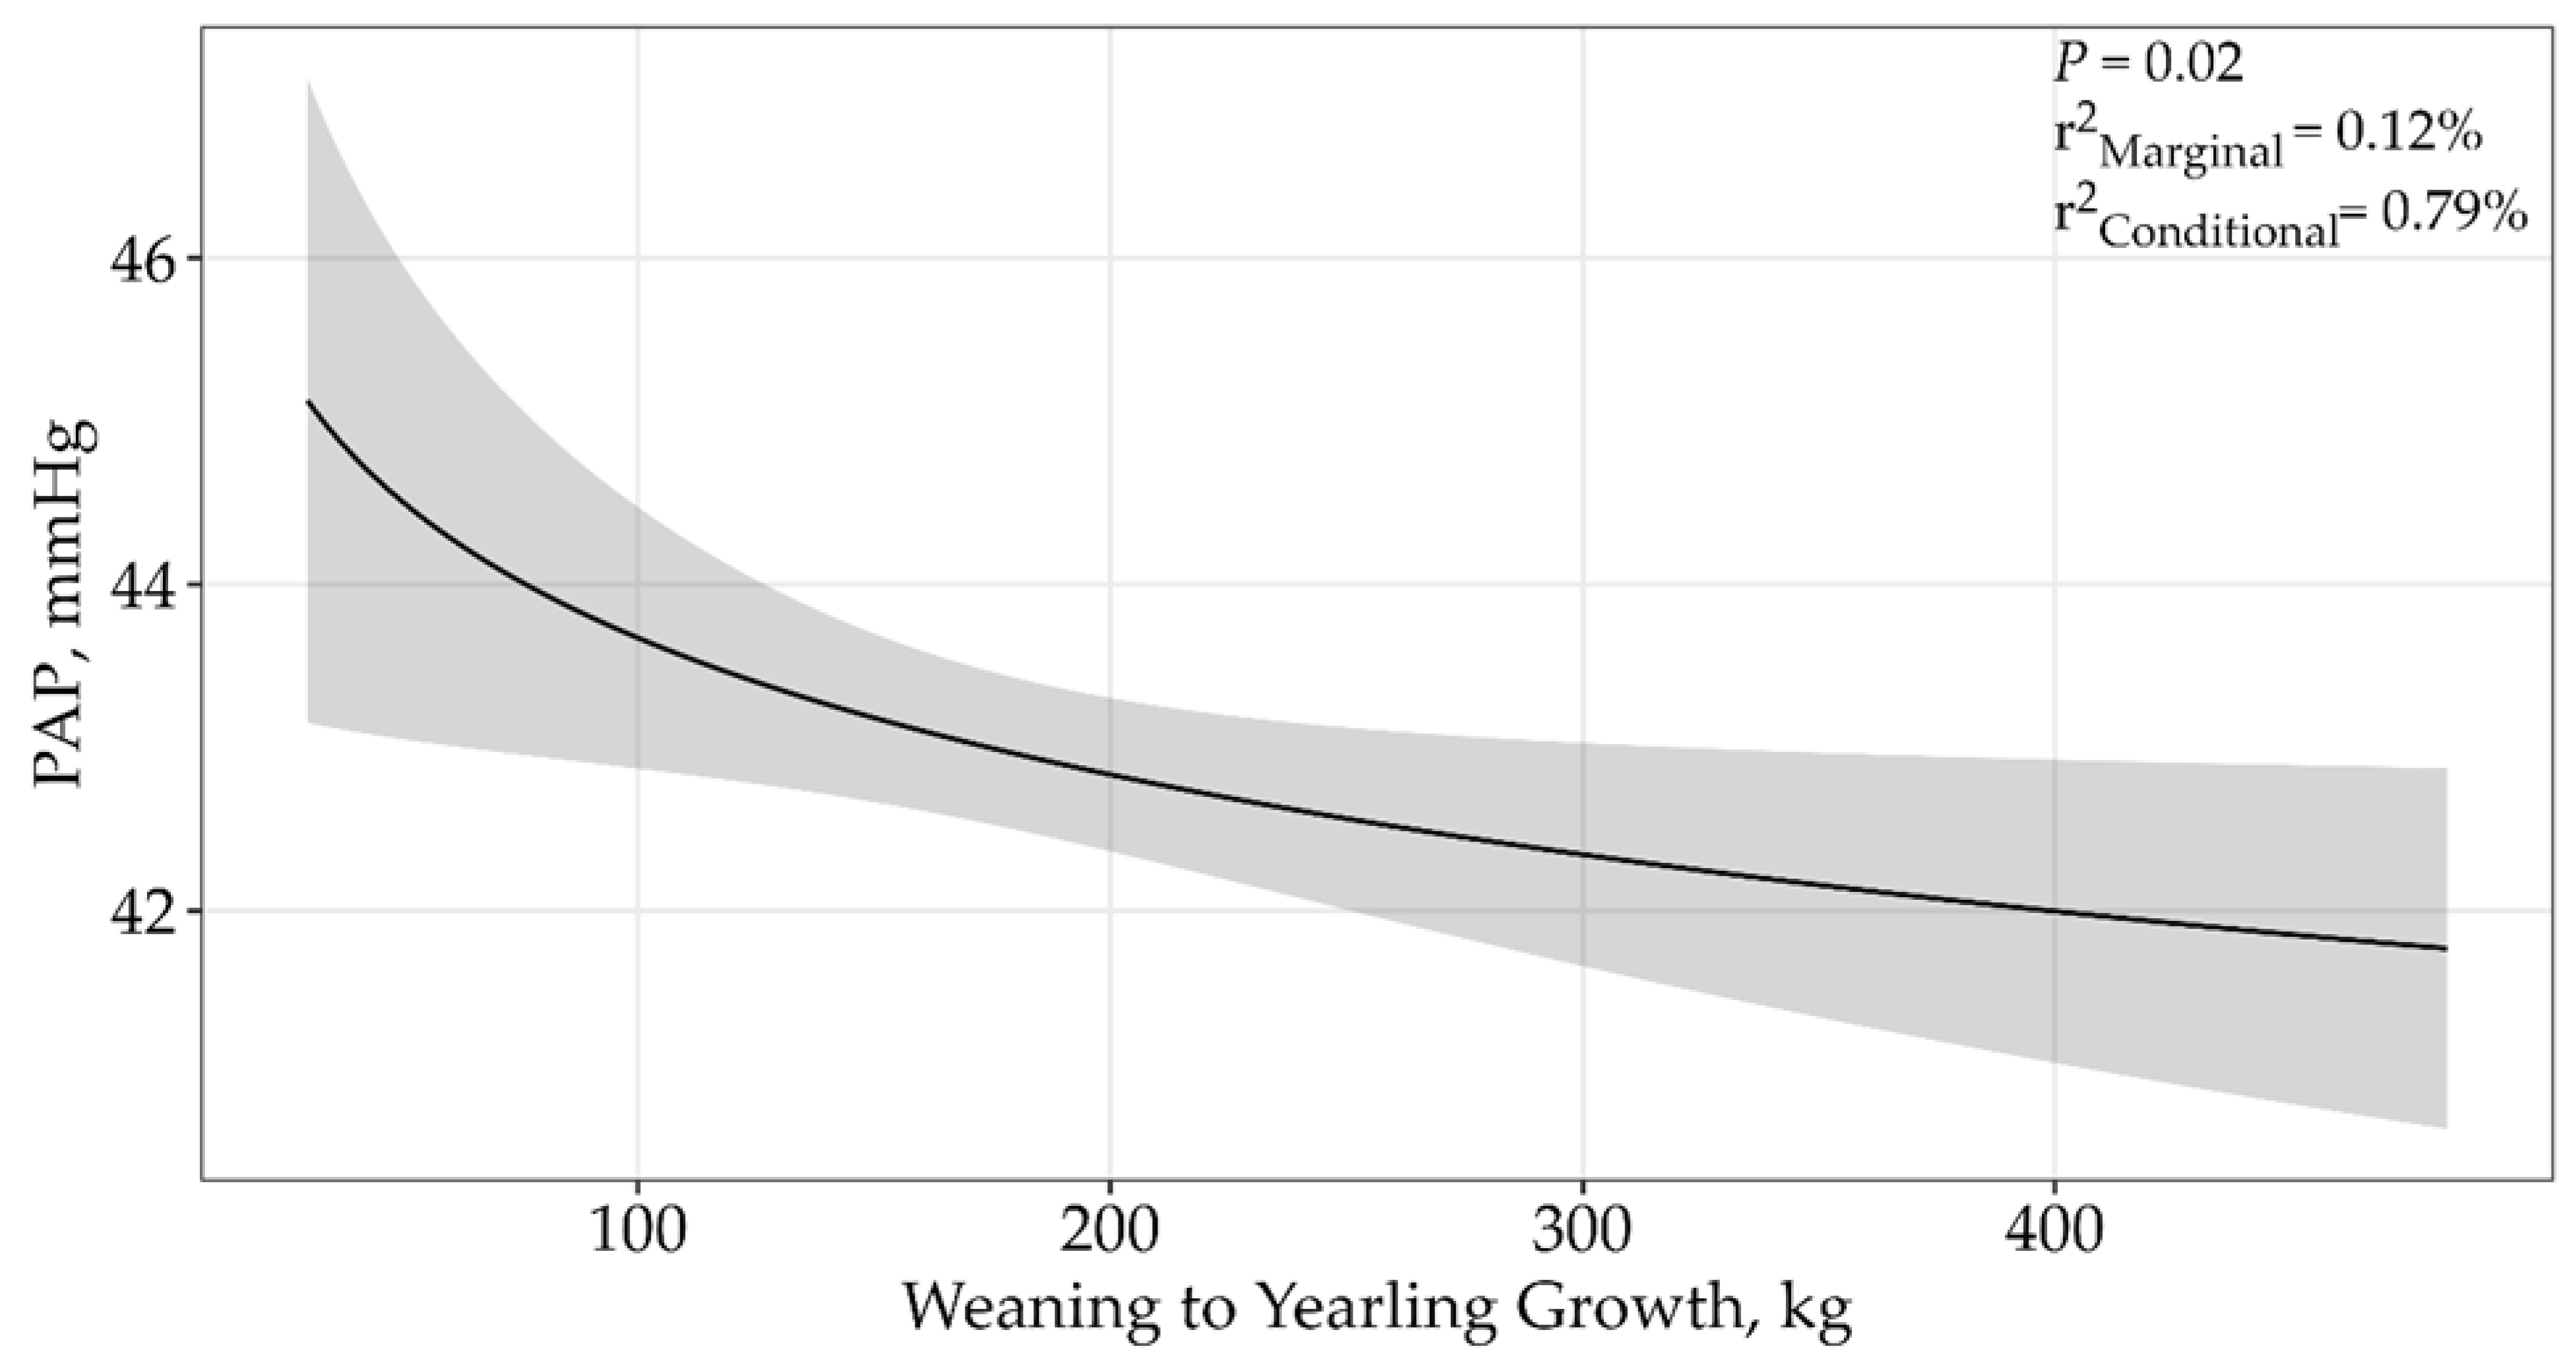
| Growth from Weaning to Yearling | |||||
| ln(Growth from Weaning to Yearling) | 4 | 33,413.33 | 0 | 1 | 0.06 |
| Growth from Weaning to Yearling | 4 | 33,425.17 | 11.84 | 0 | 0.02 |
| (Growth from Weaning to Yearling) 2 | 5 | 33,646.26 | 33.47 | 0 | 0.07 |
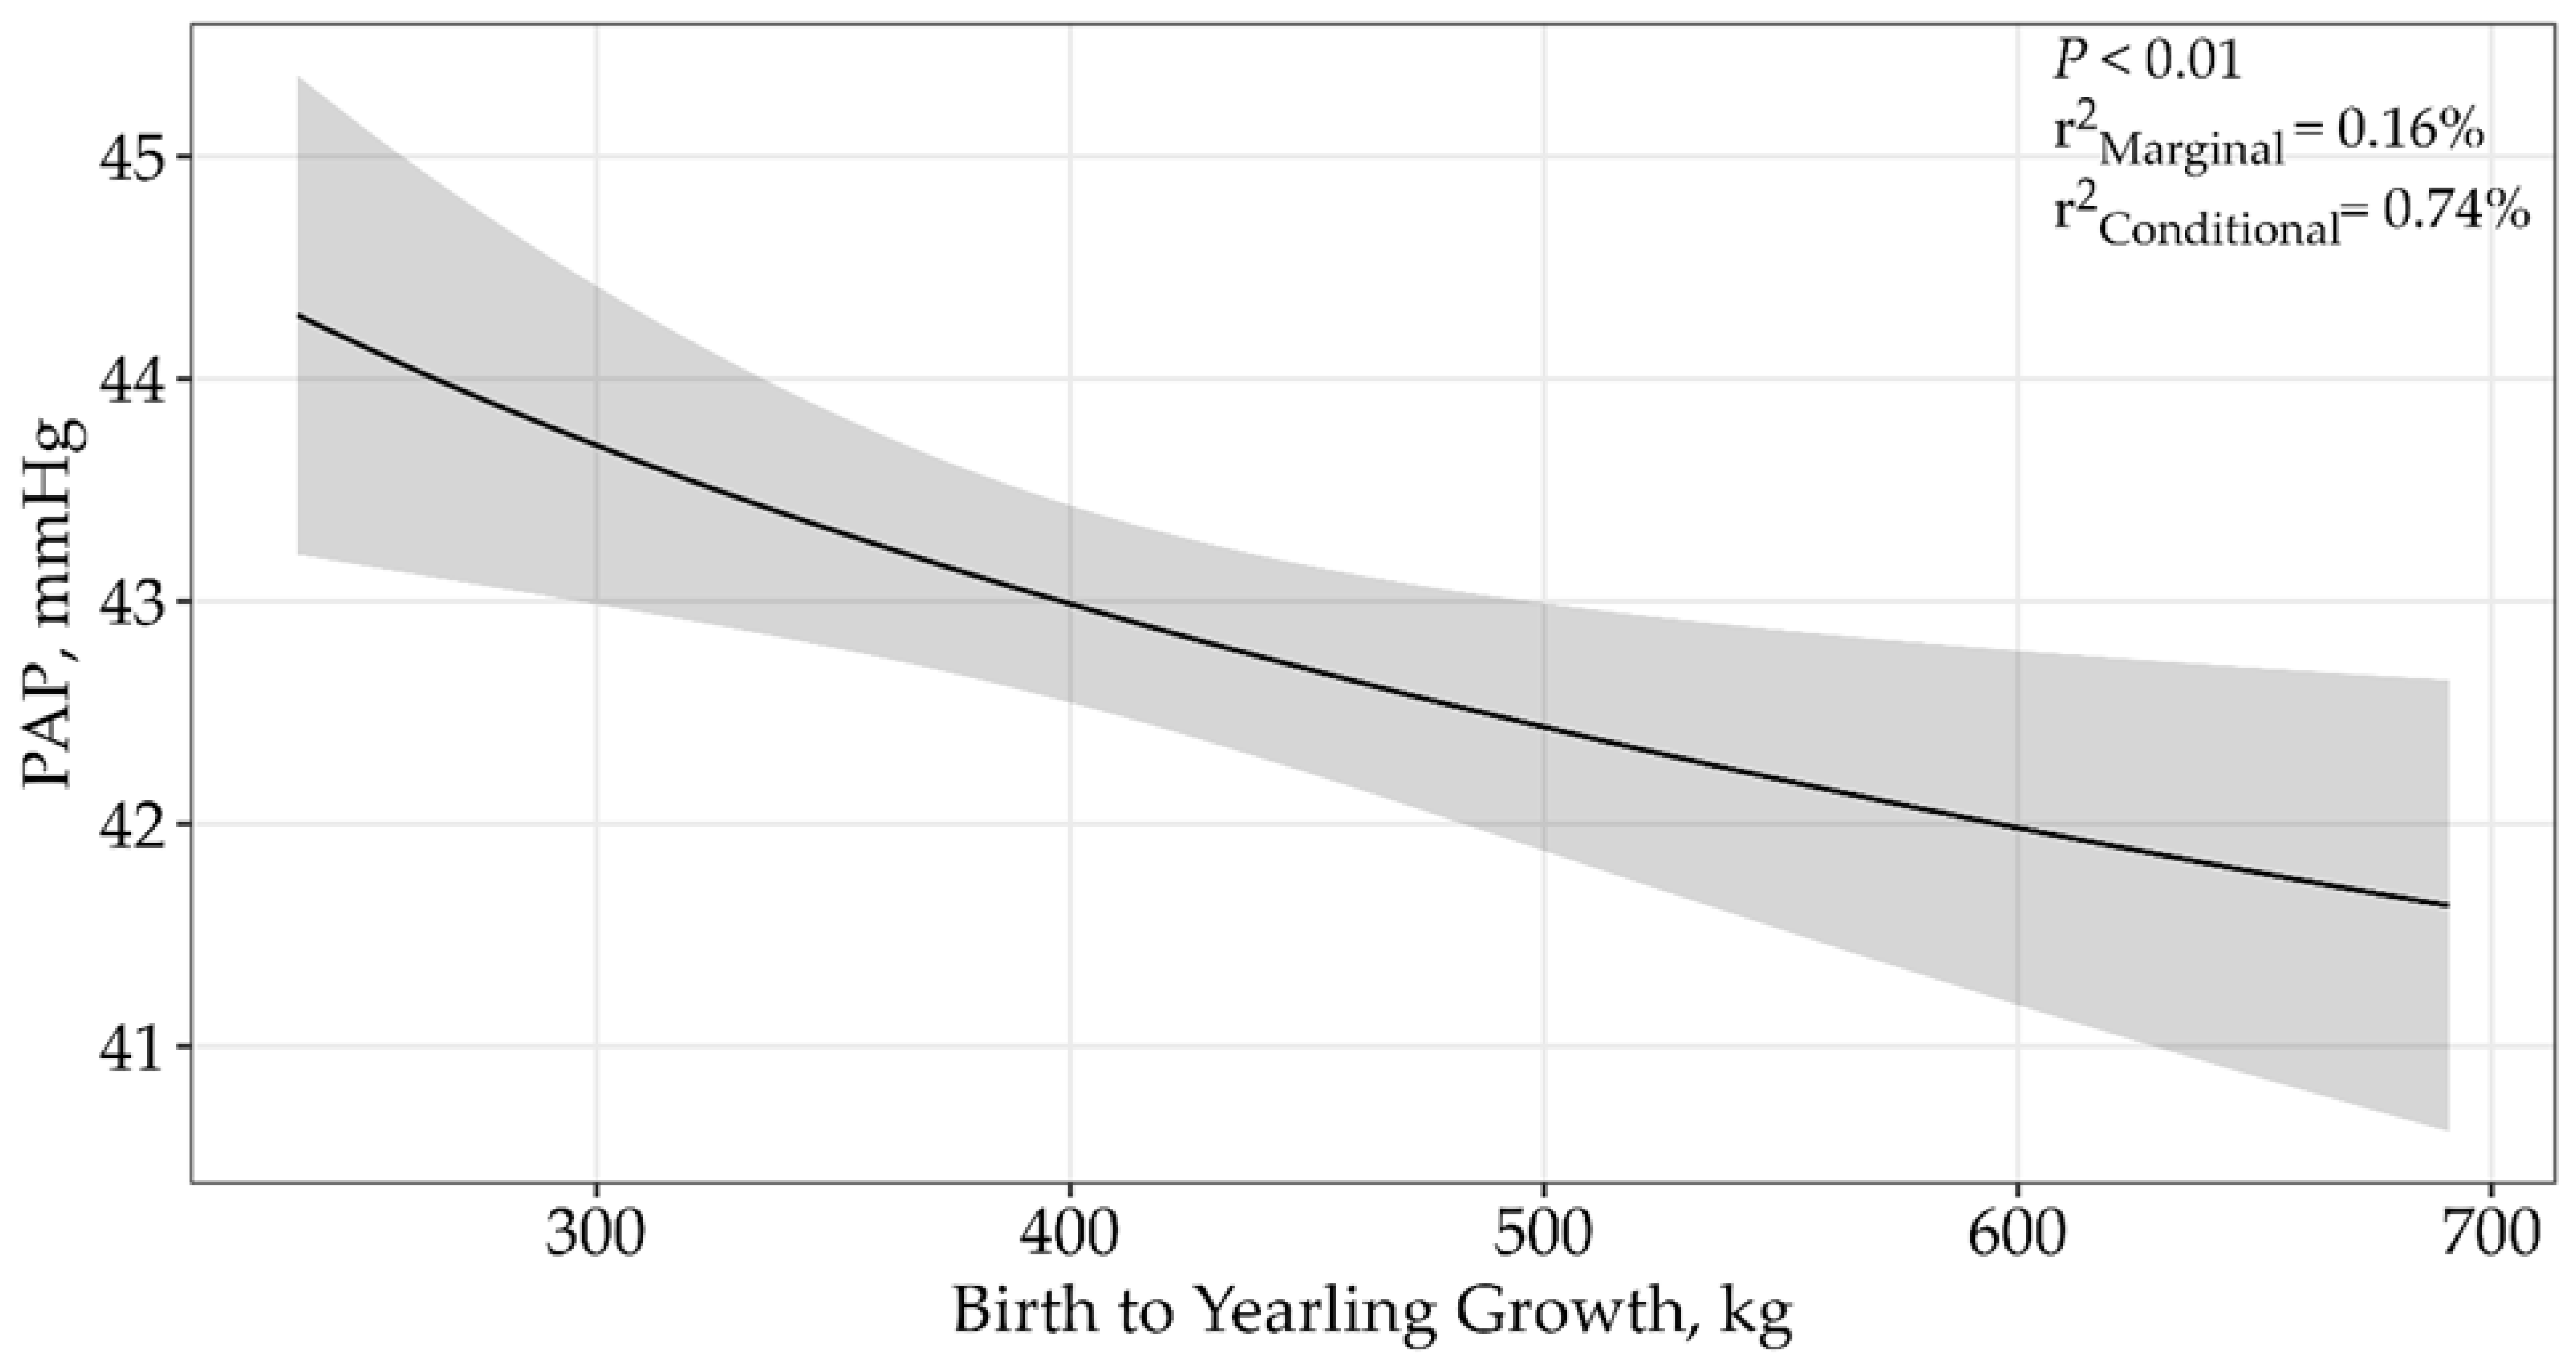
| Growth from Birth to Yearling | |||||
| ln(Growth from Birth to Yearling) | 4 | 33,131.04 | 0 | 1 | <0.01 |
| Growth from Birth to Yearling | 4 | 33,143.26 | 12.21 | 0 | <0.01 |
| (Growth from Birth to Yearling) 2 | 5 | 33,164.16 | 33.12 | 0 | 0.81 |
| Model 1 | K 2 | AICc 3 | ΔAICc 4 | Wi 5 | r2 m 6 | r2 c 7 | p-Value |
|---|---|---|---|---|---|---|---|
| Gestation Length | |||||||
| ln(Gestation Length) | 4 | 2783.85 | 0 | 1 | 1.40% | 27.37% | <0.01 |
| null | 3 | 33,858.87 | 31,075.22 | 0 | 0% | 0.50% | |
| Birth Weight | |||||||
| ln(Birth Weight) | 4 | 33,356.14 | 0 | 0.66 | 0.25% | 0.77% | <0.01 |
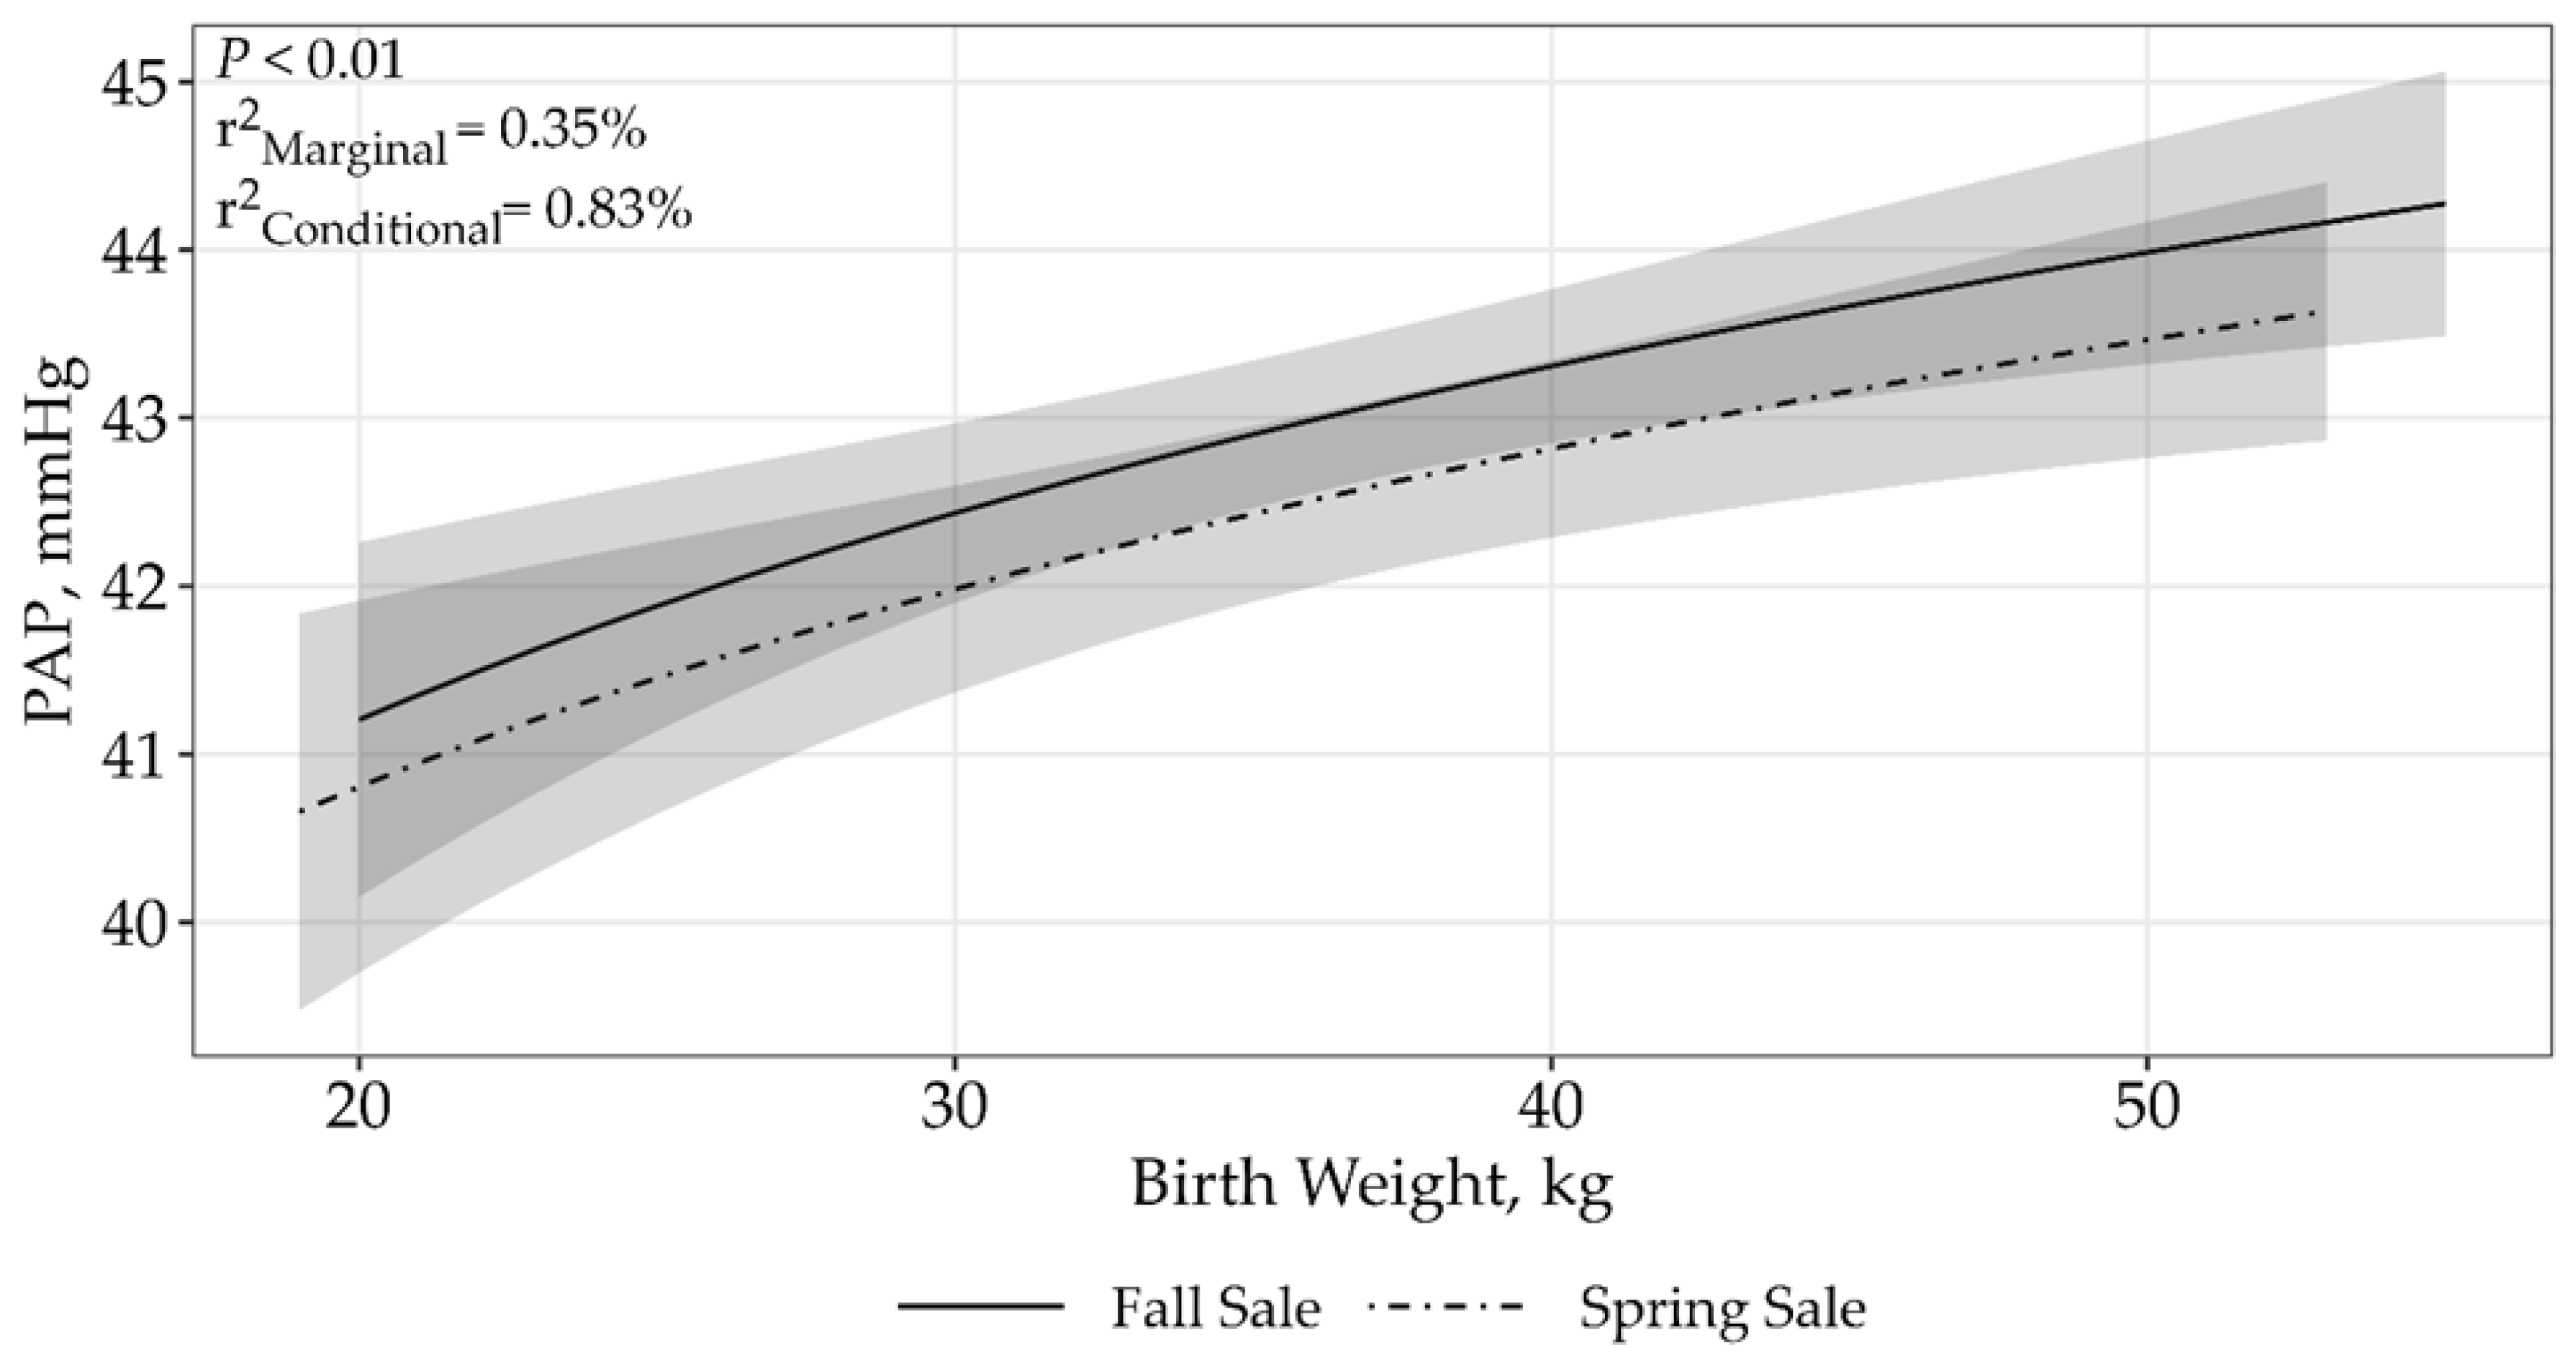
| ln(Birth Weight) × sale | 5 | 33,357.46 | 1.33 | 0.34 | 0.35% | 0.83% | <0.01 |
| null | 3 | 33,858.87 | 502.74 | 0 | 0% | 0.50% | |
| Weaning Weight | |||||||
| ln(Weaning Weight) | 4 | 33,627.32 | 0 | 0.86 | 0.03% | 0.47% | 0.26 |
| ln(Weaning Weight) × sale | 5 | 33,630.91 | 3.59 | 0.14 | 0.09% | 0.52% | 0.67 |
| null | 3 | 33,858.87 | 246.11 | 0 | 0% | 0.50% | |
| Yearling Weight | |||||||
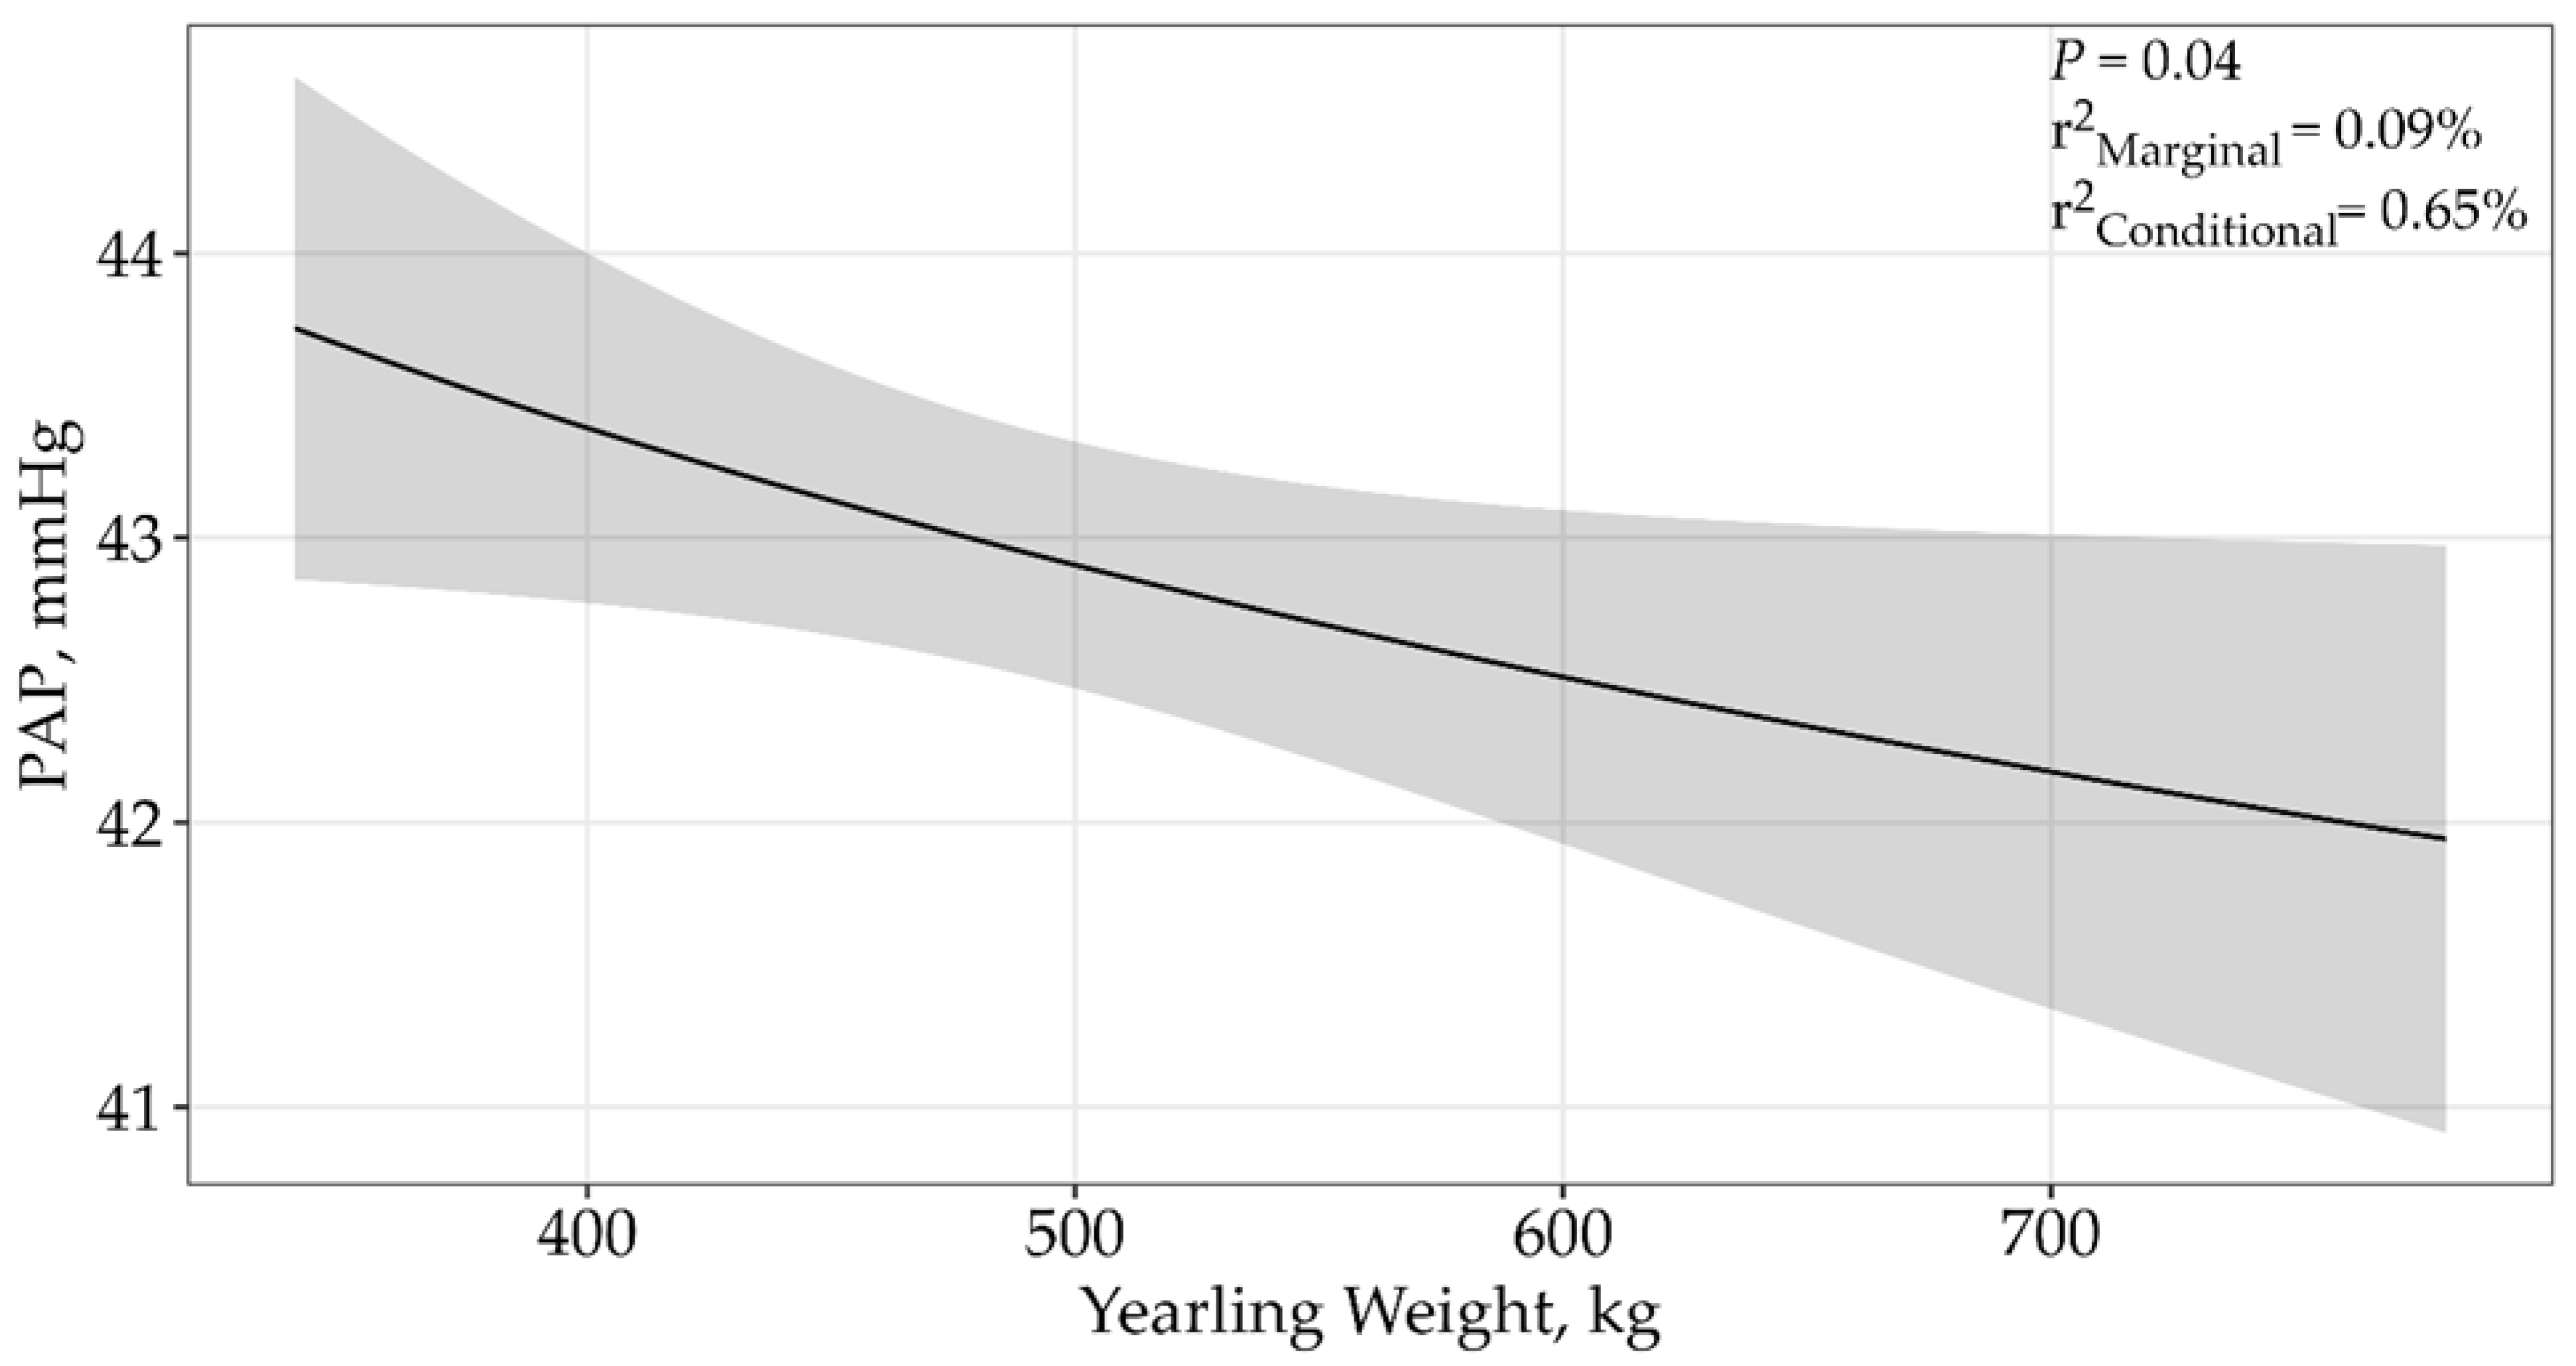
| ln(Yearling Weight) | 4 | 33,612.76 | 0 | 0.93 | 0.09% | 0.65% | 0.04 |
| ln(Yearling Weight) × sale | 5 | 33,618.03 | 5.27 | 0.07 | 0.11% | 0.62% | 0.24 |
| null | 3 | 33,858.87 | 246.11 | 0 | 0% | 0.50% | |
| Growth from Birth to Weaning | |||||||
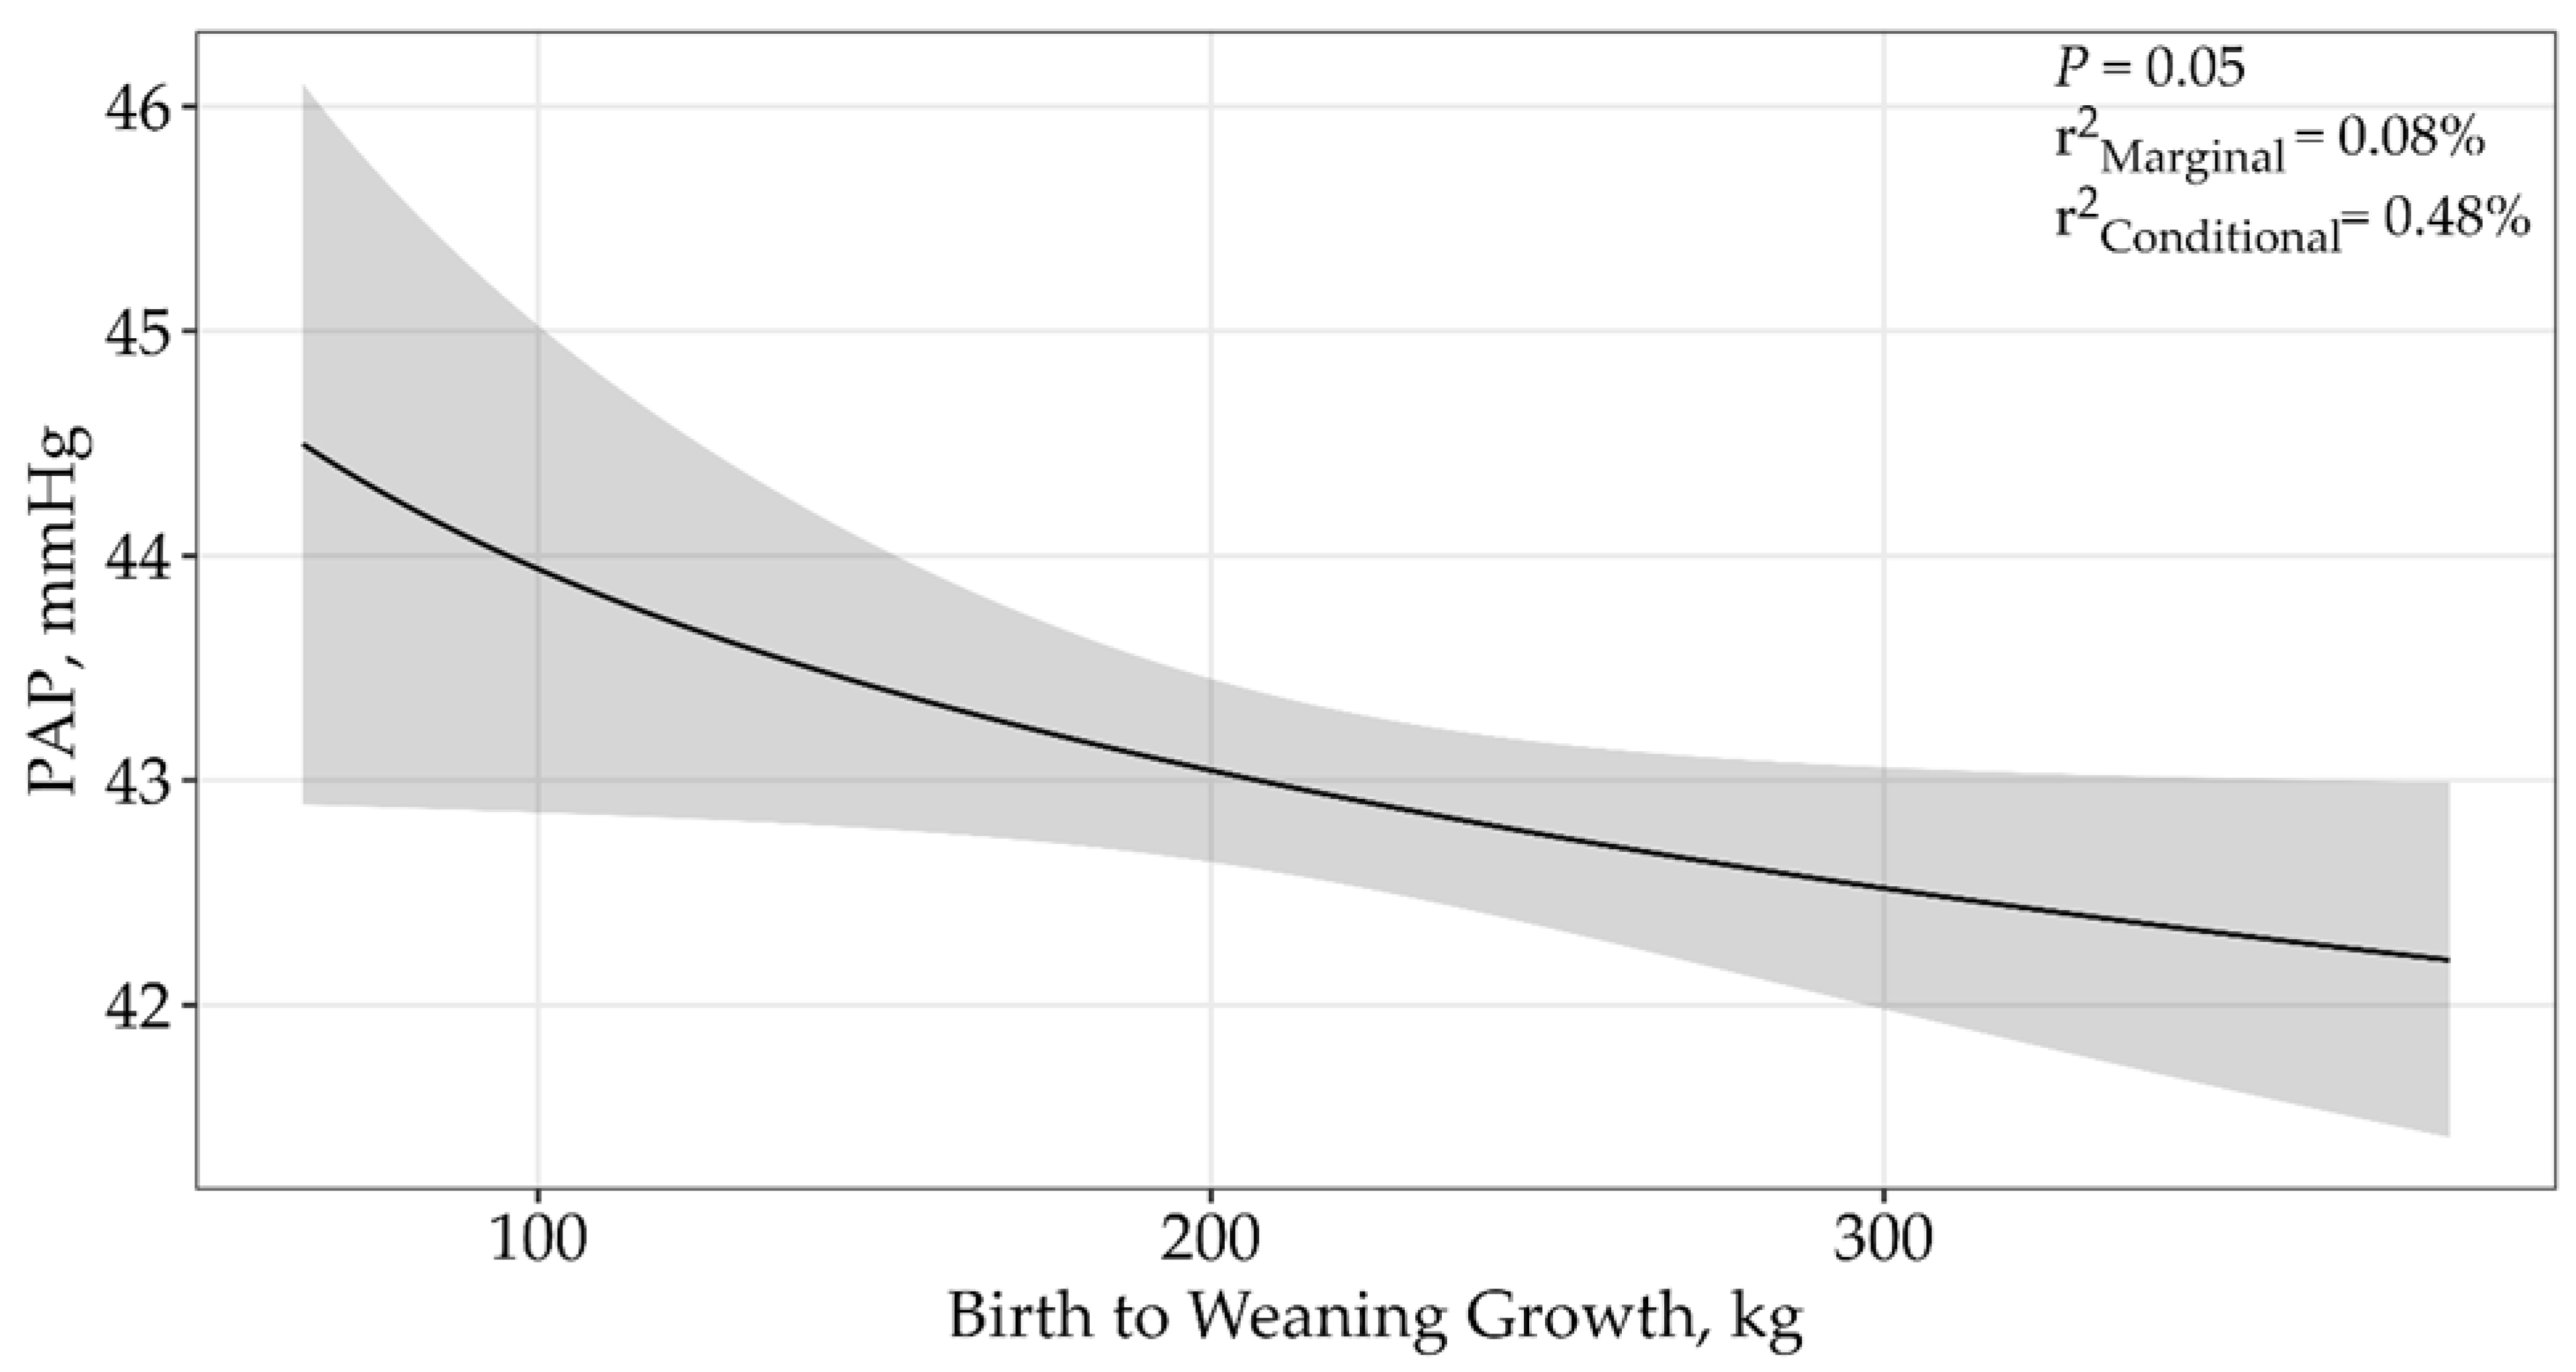
| ln(Growth from Birth to Weaning) | 4 | 33,215.41 | 0 | 0.91 | 0.08% | 0.48% | 0.05 |
| ln(Growth from Birth to Weaning) × sale | 5 | 33,220.15 | 4.74 | 0.09 | 0.12% | 0.51% | 0.15 |
| null | 3 | 33,858.87 | 643.46 | 0 | 0% | 0.50% | |
| Growth from Weaning to Yearling | |||||||
| ln(Growth from Weaning to Yearling) | 4 | 33,413.33 | 0 | 0.93 | 0.12% | 0.79% | 0.02 |
| ln(Growth from Weaning to Yearling) × sale | 5 | 33,418.36 | 5.03 | 0.07 | 0.13% | 0.72% | 0.07 |
| null | 3 | 33,858.87 | 445.55 | 0 | 0% | 0.50% | |
| Birth to Yearling Growth | |||||||
| ln(Birth to Yearling Growth) | 4 | 33,131.04 | 0 | 0.96 | 0.16% | 0.74% | <0.01 |
| ln(Birth to Yearling Growth) × sale | 5 | 33,137.19 | 6.15 | 0.04 | 0.16% | 0.71% | 0.04 |
| null | 3 | 33,858.87 | 727.83 | 0 | 0% | 0.50% |
| Sires | ||||||||||||
|---|---|---|---|---|---|---|---|---|---|---|---|---|
| 1 | 2 | 3 | 4 | 5 | 6 | 7 | 8 | 9 | 10 | SE | p-Value | |
| Number of offspring | 125 | 217 | 110 | 124 | 238 | 109 | 112 | 256 | 139 | 102 | ||
| Average offspring PAP score | 41.57 ab | 41.84 ab | 42.56 ab | 43.55 a | 40.64 b | 46.56 c | 41.05 ab | 41.36 ab | 41.84 ab | 42.34 ab | 0.674 | <0.01 |
| CV of offspring PAP score 1 | 11.50 | 19.55 | 17.67 | 18.03 | 13.00 | 18.52 | 15.07 | 9.93 | 14.87 | 8.38 | ||
| Sire PAP EPD 2 | −0.62 | −1.10 | +2.85 | +0.41 | −2.29 | +2.22 | −0.71 | −1.94 | −1.34 | −0.51 | ||
| EPD accuracy | 0.56 | 0.70 | 0.67 | 0.45 | 0.67 | 0.36 | 0.59 | 0.75 | 0.59 | 0.63 | ||
| Dam Sires | |||||||
|---|---|---|---|---|---|---|---|
| 1 | 2 | 3 | 4 | 5 | SE | p-Value | |
| Number of offspring | 523 | 144 | 115 | 246 | 107 | ||
| Average offspring PAP score | 43.30 | 42.84 | 41.19 | 42.59 | 42.94 | 0.814 | 0.09 |
| CV of offspring PAP score 1 | 17.88 | 18.15 | 13.47 | 15.47 | 16.31 | ||
| Sire PAP EPD 2 | +1.96 | +1.99 | −0.29 | −0.77 | +3.38 | ||
| EPD accuracy | 0.78 | 0.64 | 0.51 | 0.59 | 0.50 | ||
Disclaimer/Publisher’s Note: The statements, opinions and data contained in all publications are solely those of the individual author(s) and contributor(s) and not of MDPI and/or the editor(s). MDPI and/or the editor(s) disclaim responsibility for any injury to people or property resulting from any ideas, methods, instructions or products referred to in the content. |
© 2025 by the authors. Licensee MDPI, Basel, Switzerland. This article is an open access article distributed under the terms and conditions of the Creative Commons Attribution (CC BY) license (https://creativecommons.org/licenses/by/4.0/).
Share and Cite
Stearns, K.; DelCurto-Wyffels, H.; Wyffels, S.; Van Emon, M.; Davis, N.G.; Sitz, T.; DelCurto, T. Evaluating Pulmonary Arterial Pressure in Angus Yearling Bulls at High Elevation: Associations with Birth Traits and Growth Performance. Animals 2025, 15, 1302. https://doi.org/10.3390/ani15091302
Stearns K, DelCurto-Wyffels H, Wyffels S, Van Emon M, Davis NG, Sitz T, DelCurto T. Evaluating Pulmonary Arterial Pressure in Angus Yearling Bulls at High Elevation: Associations with Birth Traits and Growth Performance. Animals. 2025; 15(9):1302. https://doi.org/10.3390/ani15091302
Chicago/Turabian StyleStearns, Kaylen, Hannah DelCurto-Wyffels, Sam Wyffels, Megan Van Emon, Noah G. Davis, Taylre Sitz, and Tim DelCurto. 2025. "Evaluating Pulmonary Arterial Pressure in Angus Yearling Bulls at High Elevation: Associations with Birth Traits and Growth Performance" Animals 15, no. 9: 1302. https://doi.org/10.3390/ani15091302
APA StyleStearns, K., DelCurto-Wyffels, H., Wyffels, S., Van Emon, M., Davis, N. G., Sitz, T., & DelCurto, T. (2025). Evaluating Pulmonary Arterial Pressure in Angus Yearling Bulls at High Elevation: Associations with Birth Traits and Growth Performance. Animals, 15(9), 1302. https://doi.org/10.3390/ani15091302