Article

Genome-Wide Association Study for Belly Traits in Canadian Commercial Crossbred Pigs

by
Zohre Mozduri
1,
Graham Plastow
1,
Jack Dekkers
2,
Kerry Houlahan
3,
Robert Kemp
3 and
Manuel Juárez
4,*
1
Livestock Gentec Centre, Department of Agricultural, Food and Nutritional Science, University of Alberta, Edmonton, AB T6G 2E1, Canada
2
Department of Animal Science, Iowa State University, Ames, IA 50011, USA
3
Genesus Genetic Technology Inc., Winnipeg, MB R3P 0H4, Canada
4
Lacombe Research and Development Centre, Agriculture and Agri-Food Canada, Lacombe, AB T4L 1W1, Canada
*
Author to whom correspondence should be addressed.
Animals 2025, 15(9), 1254; https://doi.org/10.3390/ani15091254
Submission received: 19 March 2025 / Revised: 11 April 2025 / Accepted: 25 April 2025 / Published: 29 April 2025
(This article belongs to the Section Animal Genetics and Genomics)

Simple Summary

Belly fat traits are key indicators of pork quality and consumer acceptance. In this study, we analyzed 1118 commercial crossbred pigs to identify genetic regions and candidate genes associated with six important belly traits: iodine value, firmness, side fat, total thickness, subcutaneous fat, and seam fat. Using whole-genome sequencing data and genome-wide association studies (GWASs), we discovered several quantitative trait loci (QTLs) and genes involved in fat metabolism, muscle structure, and energy regulation. Genes such as SCD, CHUK, HIF1AN, and PRKAG3 were highlighted for their contributions to fat composition and meat quality. These findings offer valuable genetic markers for improving pork quality through breeding and provide insights into the biological processes underlying carcass fat traits in pigs.

Abstract

The improvement of carcass traits is a key focus in pig genetic breeding programs. To identify quantitative trait loci (QTLs) and genes linked to key carcass traits, we conducted a genome-wide association study (GWAS) using whole-genome sequencing data from 1118 commercial pigs (Duroc sires and Yorkshire/Landrace F1 dams). This study focused on six phenotypes: iodine value, belly firmness, belly side fat, total side thickness (belly SThK), belly subcutaneous fat (Subq), and belly seam. Phenotypes were measured using image analysis, DEXA, and fatty acid profiling, and genotyping was performed using low-pass sequencing (SkimSeq). After quality control, 18,911,793 single nucleotide polymorphisms (SNPs) were retained for further analysis. A GWAS was conducted using a linear mixed model implemented in GCTA. Key findings include a significant QTL on SSC15 (110.83–112.23 Mb), which is associated with the iodine value, containing genes such as COX15, CHUK, SCD, and HIF1AN, which have known roles in fatty acid metabolism. Additionally, PNKD, VIL1, and PRKAG3 (120.74–121.88 Mb on SSC15) were linked to belly firmness, influencing muscle structure and fat composition. Three QTLs for belly side fat were identified on SSC1, SSC2, and SSC3, highlighting genes like SLC22A18, PHLDA2, and OSBPL5, which regulate fat deposition and lipid metabolism. The results provide novel molecular markers that can be incorporated into selective breeding programs to improve pork quality, fat distribution, and meat composition. These findings enhance our understanding of the genetic mechanisms underlying carcass belly traits while offering tools to improve pork quality, optimize fat composition, and align with consumer preferences in the meat production industry.

1. Introduction

The pork belly comprises a combination of various component muscles along with layers of intermuscular and subcutaneous fat [1]. Backfat depth is a critical metric for carcass production and an important indicator of pig performance and lean meat yield [2]. Currently, pork belly stands out as the most valuable ($/cwt) retail cut of pork [3]. Pork belly is extracted from the area between the second and third ribs to just above the hip bone and is known for its high fat content (30–60%), though this proportion has decreased over the years [4]. In North America and other regions, pork belly is primarily used for bacon production [5], while various other preparations of raw bellies are preferred in Asian markets [6]. A growing demand for bacon has significantly increased the demand for pork bellies [7]. Increasing demand for pork in Asian and European markets has driven the need for high-quality, specifically defined fresh pork bellies [6]. As a result, it is important to predict pork belly composition and understand the factors that influence it to satisfy market demands [8]. Firmness is a critical characteristic in determining the quality of pork belly for both applications, and excessive softness is considered a significant defect [5].
The fat in pork belly is composed of two layers: subcutaneous and intermuscular fat [1,4]. Excess subcutaneous fat can lead to a greasy taste, making the pork belly less appealing [9]. It has been reported that pork bellies need a minimum level of subcutaneous fat and a higher degree of fat saturation to meet the firmness standards demanded by buyers and processors [10]. While iodine value (IV) is a good indication of the degree of unsaturation in fat and is often used to predict fat firmness, it has been widely reported that IV does not explain more than one-third of the variability in belly firmness [7].
Kang et al. (2023) reported heritability estimates for detailed belly traits, which ranged from moderate to high (0.27 to 0.49) [11]. The genetic correlation among various pork belly parameters, such as the fat ratio, the intermuscular fat area, and the subcutaneous fat area, has been reported to range from −0.24 to 0.84 [12]. Additionally, Do et al. (2014) found moderate to high genetic correlations between carcass traits, with belly weight showing a correlation of 0.88 with carcass weight, 0.46 with back fat thickness, and 0.80 with lean meat percentage [13]. In a commercial crossbred study, trimmed belly weight was genetically correlated with traits such as weaning weight, average daily gain, back fat thickness, and intramuscular fat (IMF) [14]. These findings suggest that fat-related traits in pigs are genetically highly related [1]. Willson et al. (2020) reported that the heritability of belly firmness was 0.31 ± 0.11. The high estimate for belly firmness indicates the potential for its selection in breeding programs [15].
Several studies have identified potential candidate genes linked to backfat and IMF in pigs. For instance, the DHCR7 gene, located on SSC2 near IGF2, has been linked to backfat thickness in multiple pig populations. The MC4R polymorphism has been reported to influence backfat thickness, feed intake, and growth traits, including test daily gain and lifetime daily gain [16,17]. However, research on genes related to the component muscles of pork belly is still lacking, highlighting the need for further genetic analysis, including GWAS and -omics studies. This study aimed to determine whether WGS could identify new regions associated with carcass belly fat traits in Canadian commercial crossbred pigs.

2. Materials and Methods

2.1. Animals and Phenotypes

The experimental procedures were approved by the Animal Care Committee at the Agriculture and Agri-Food Canada Lacombe Research and Development Centre (AAFC-LRDC), under protocol #202204 (June 2024), adhering to the Canadian Council on Animal Care’s guidelines. A total of 1118 commercial crossbred pigs (498 females and 620 males; from Yorkshire × Landrace sows × Duroc boars; Genesus Genetic Technology, London, ON, Canada) were raised according to standard commercial practices and slaughtered at ~125 kg at the AAFC-LRDC federally inspected abattoir. Blood samples were collected for genomic analysis during bleeding (vacutainer tubes, K2 EDTA, 10 mL volume; BD Vacutainer®; Mississauga, ON, Canada). Carcass weight and backfat depth, measured between the 3rd and 4th last ribs, were recorded using a grading probe. The carcasses were then divided into primal cuts, and the fat content was determined using dual energy x-ray absorptiometry (DEXA) [18]. A pork chop from the loin center was used to measure the IMF content with the Smart Trac Fat Analyzer Model 907,955 (CEM Corporation, Matthews, NC, USA). A 5 g backfat sample from the shoulder was collected, stored at −80 °C, and analyzed for fatty acids following [19]. Fatty acid composition was used to calculate the IV, according to the American Oil Chemists Society [20]. Images of bellies were taken for image analysis, with measurements including side fat, total side (SThK), subcutaneous fat (Subq), and seam fat (Seam) thicknesses, as well as belly firmness assessed according to previously published protocols [10,21,22].

2.2. Genotypes

Blood samples were genotyped for 36,566,734 single nucleotide polymorphism (SNP) markers using SkimSEEK™ (a low-pass sequencing method imputed up to a whole-genome sequence; Neogen®, Edmonton, AB, Canada). Quality control procedures were applied to exclude SNPs from the whole-genome sequencing data using PLINK 2.00a3.6 [23], with the following criteria: minor allele frequency (MAF) < 0.01, genotyping rate < 0.01, sample genotyping rate < 0.1 (mind), and Hardy–Weinberg equilibrium (HWE) p-value < 1 × 10⁻⁶. Only autosomal SNPs were included in the analysis. No animals or variants were excluded due to missing genotype data, so imputation was not required. After quality control, 1118 pigs and 18,911,793 SNPs were retained for further analysis.

2.3. Statistical Analysis

A linear mixed model was used to assess both fixed and random effects using the lme4 package (version 1.1–35) in the R software. The package was accessed from https://cran.r-project.org/web/packages/lme4/, accessed on 3 November 2023, employing REML or maximum likelihood estimation. The fixed effects tested included sex, boar line, boar group (or semen pool effect), and other methodological factors depending on the trait. The animal model accounted for random additive polygenic effects, as well as random effects for the contemporary group and the common litter. Commercial carcass weight was included as a covariate, and to adjust for population stratification, PCA was performed, incorporating the top three principal components as covariates. For the genome-wide association study, a single-marker mixed linear association model (MLMA) was applied using GCTA version 1.26.0 [24].
The model is represented by
y = 1µ + Xb + Zu + W1c1 + W2c2 + e
where y denotes the vector of phenotypes for all (n) animals; µ is the overall mean; b is a vector of (p) fixed effects (including the additive effect of SNP, sex, boar line, and boar group); X is the incidence matrix of fixed effects (n × p) linking the records in y to the fixed effects in b in which SNP genotypes are coded as 0, 1, or 2; u is a vector of polygenic random effects; and Z is an incidence matrix that relates records to the polygenic effects. c1 and c2 are vectors of q levels (q × 1) of random effects of the contemporary group and the common litter, and e represents a vector of random residual terms (n × 1). W1 and W2 represent design matrices (n × q1 and n × q2) relating to the records in y with the random effects in c1 and c2, respectively. It is assumed that u~N(0, GRM σ2u) and e~N(0, I σ2e), where GRM is the genomic relationship matrix and σ2u and σ2e represent the additive genetic and residual variances, respectively.
To correct for multiple testing, we employed the simple method proposed by [25]. This method determines the effective number of independent tests based on the degree of linkage disequilibrium (LD) among SNPs through principal component analysis. First, a correlation matrix for the SNPs was constructed for each chromosome using the composite LD. Next, eigenvalues were calculated from the principal component analysis of the composite LD matrix. Finally, the effective number of SNPs per chromosome was determined as the number of principal components needed to jointly explain 99% of the variance among the SNPs. Since SNPs located on different chromosomes are anticipated to be in linkage equilibrium within the general population, the total effective number of SNPs (Meff) used in this study was derived by summing the effective number of SNPs for each chromosome. p-values from single SNP association tests were further adjusted for multiple comparisons using the Šidák correction based on Meff, calculated as follows: adjusted p-value = 1 − (1 − p-value)Meff [26]. We utilized the qqman R package (version 0.1.9) [27] to generate Manhattan and Q-Q plots for visualizing the GWAS results. The Manhattan plots were customized to highlight significant associations by setting a genome-wide significance threshold at p < 2.62410715 × 10⁻⁷ and color-coding chromosomes for clarity.

Sample Size Justification Based on Power Analysis

To ensure that the sample size (n = 1118) was sufficient for detecting significant associations in the GWAS, a Power analysis was conducted in the R software (version 4.3.2) using a threshold of α = 2.624 × 10⁻⁷, based on the method reported by [25] for multiple testing corrections. This method adjusts for linkage disequilibrium between SNPs and provides a more realistic effective number of independent tests compared to Bonferroni corrections. We assessed the statistical power across different effect sizes (Beta) and minor allele frequencies (MAFs), showing that SNPs with an MAF ≥ 0.2 and an effect size (β) ≥ 0.3 have enough statistical power (≥80%) with 1118 individuals. For rarer SNPs (MAF = 0.05), high power would only be achieved for large effect sizes (β ≥ 0.5).

2.4. Post-GWAS Analyses

We used the biomaRt package in R (https://bioconductor.org/packages/biomaRt/, accessed on 15 June 2024) to identify candidate genes linked to SNPs in the relevant regions, as well as neighboring SNPs within 0.5 Mbp upstream and downstream based on the Sus scrofa 11.1 reference genome assembly, which was obtained from the NCBI Datasets platform (https://www.ncbi.nlm.nih.gov/datasets/genome/GCF_000003025.6/, accessed on 15 June 2024). Genes located within ±0.5 Mb of the SNP positions were extracted and annotated. The 0.5 Mbp distance was chosen based on findings that the average linkage disequilibrium (LD) in commercial pig lines falls below 0.3 for SNPs that are more than 0.5 Mb apart [28]. Thus, the significant window was defined as 0.5 Mb on either side of the significant SNPs identified in the GWAS that were within 0.5 Mb of each other.
Additionally, the proportion of variance explained by each significant SNP was the amount of genetic variance reduced after adding the significant SNP to the model in GCTA version 1.26.0 [24] divided by the phenotypic variance. Finally, we employed the UpSetR package in R, a customizable tool for data exploration and set visualization, to display the number of common SNPs and overlapping genes shared among the six traits in our GWAS analysis, providing a clear alternative to complex Venn diagrams when working with multiple datasets [29].
Functional enrichment analysis was conducted using the DAVID Functional Annotation Tools (https://davidbioinformatics.nih.gov/tools.jsp, accessed on 25 June 2024) [30], employing the Benjamini–Hochberg procedure to adjust for multiple comparisons and control the false discovery rate (FDR).

3. Results and Discussion

3.1. Descriptive Statistics and Heritability Estimates
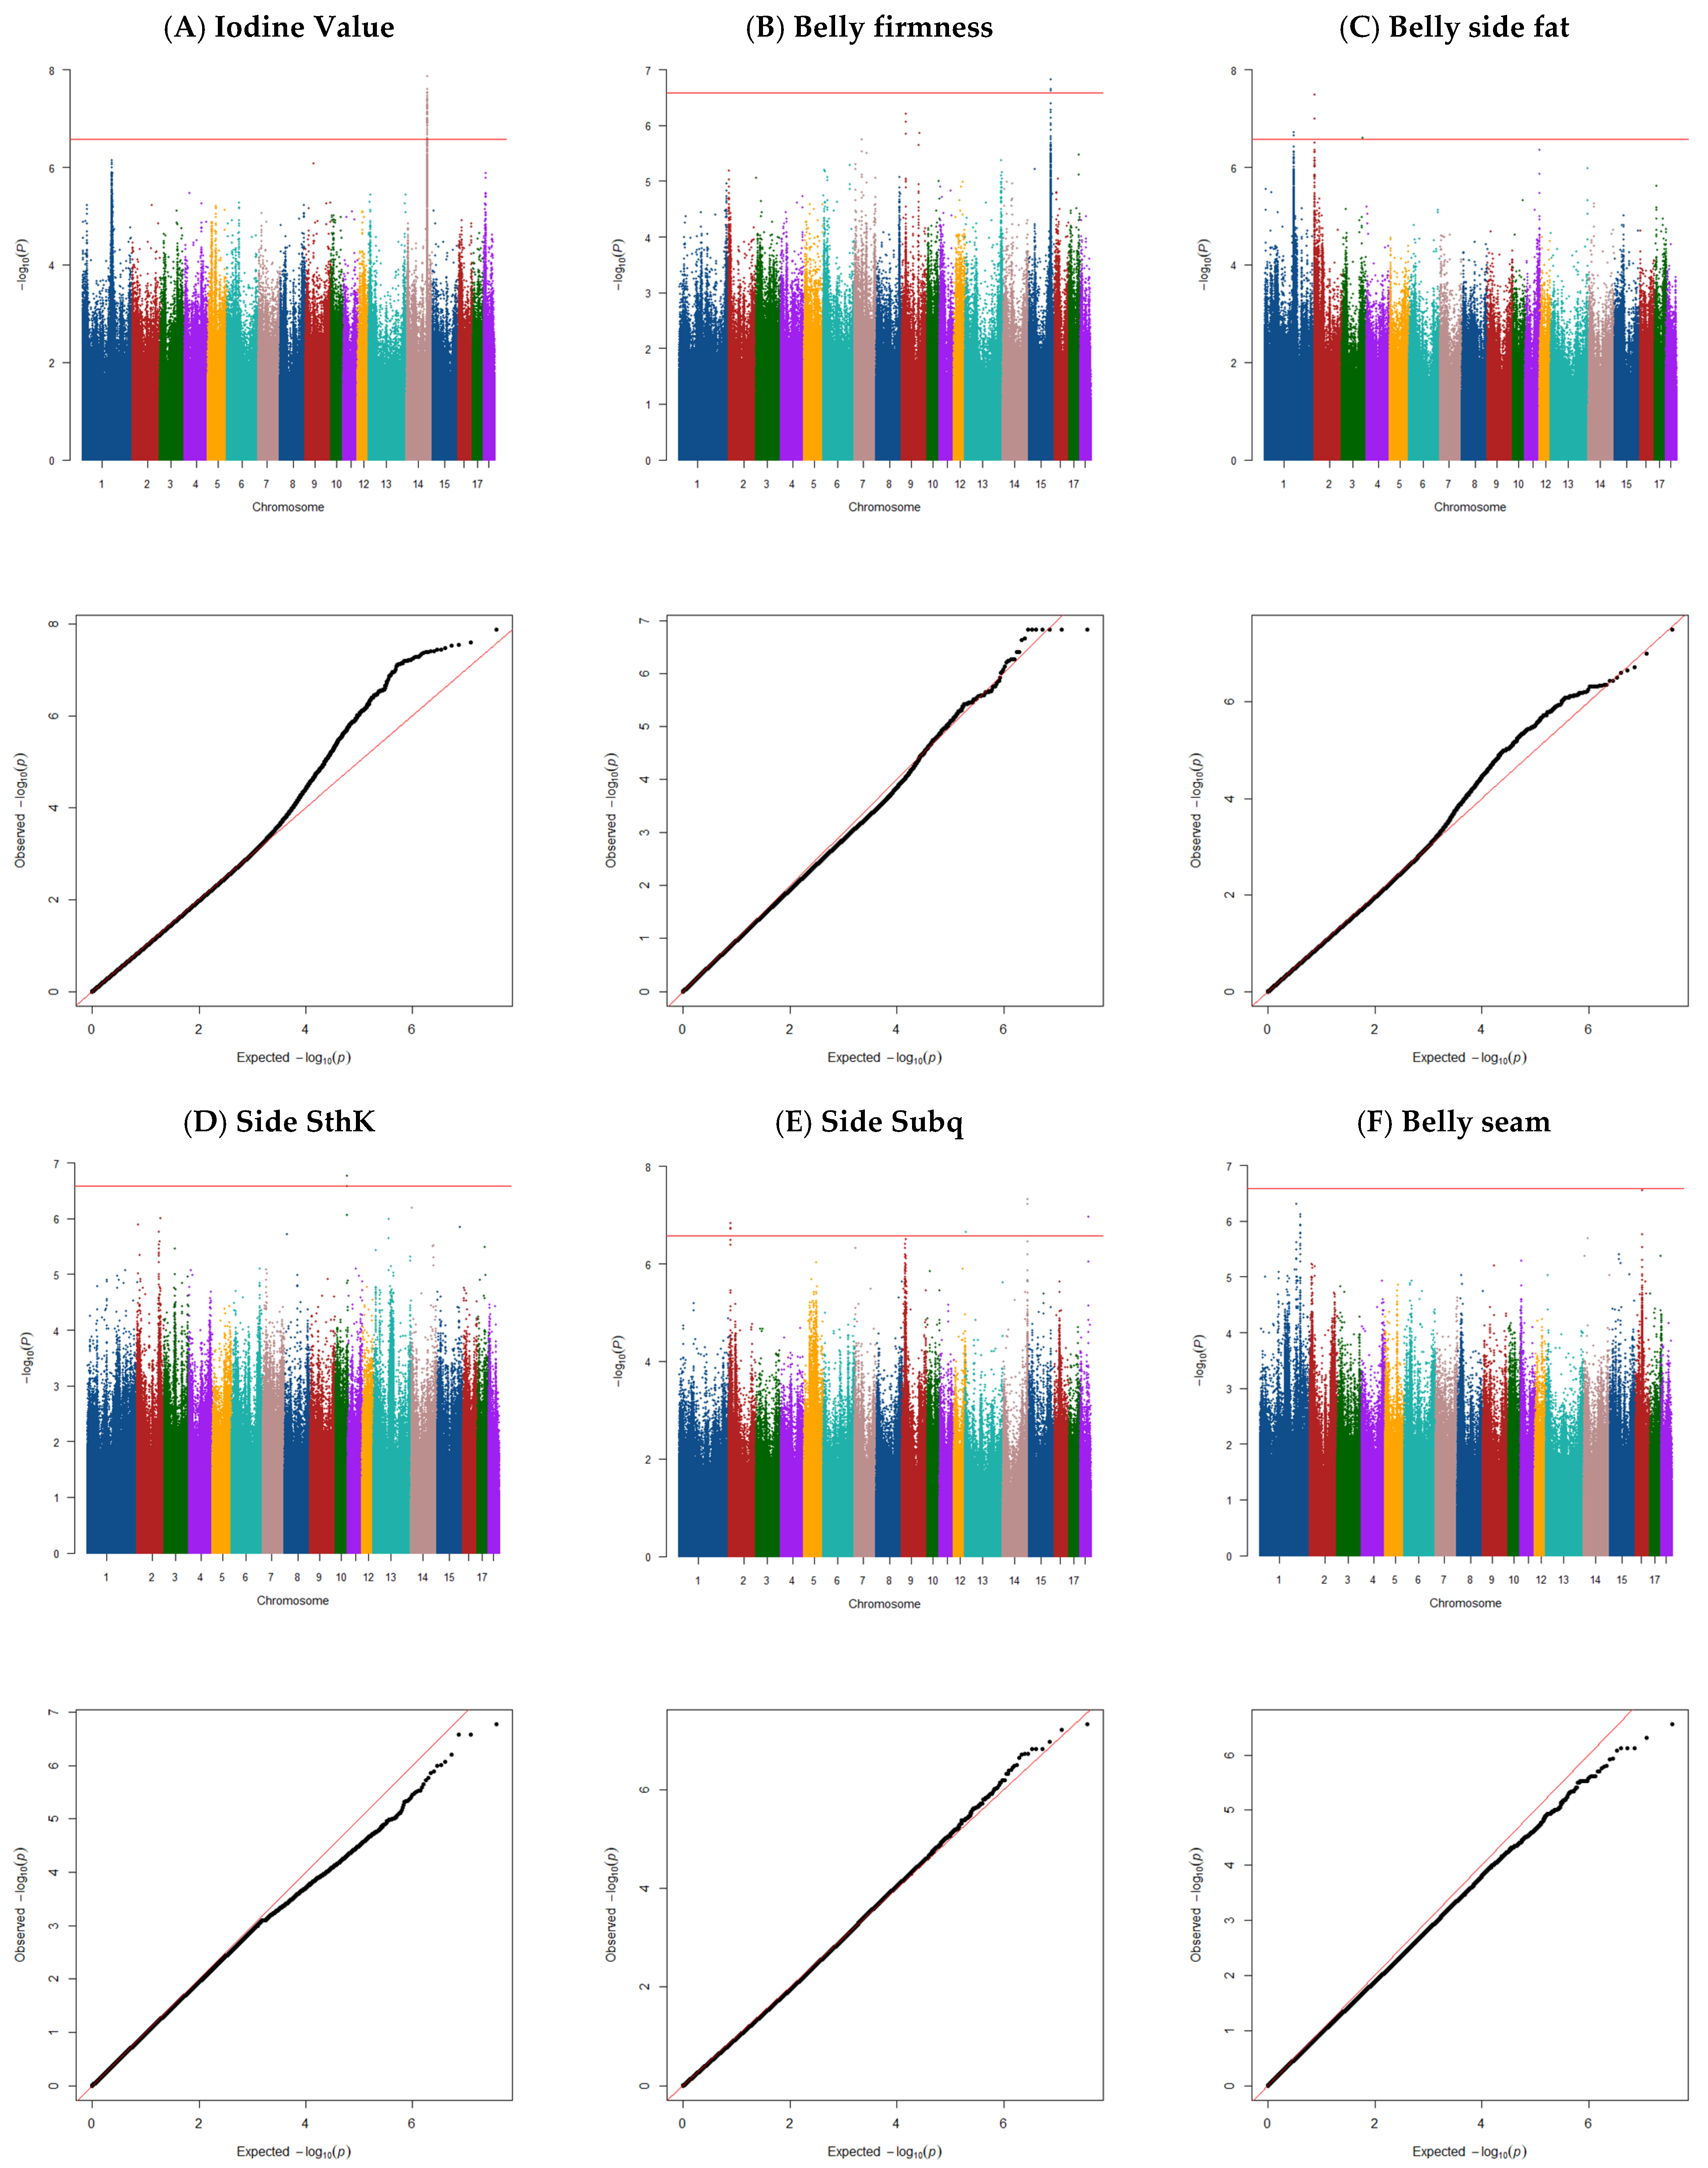
Descriptive statistics for eight belly traits are summarized in Table 1. The IV exhibited the largest sample size (n = 1117), with a mean of 60.3 and a standard deviation (SD) of 3.34, indicating moderate variation among individuals. Belly firmness demonstrated the highest variability (SD = 26.4), with values ranging from 69.8 to 132.0 across a smaller sample size (n = 494). Belly side fat and subcutaneous fat (Subq) displayed similar mean values of 2.50 mm and 1.36 mm, respectively, with relatively low standard deviations, suggesting limited dispersion. Total side thickness (SThK) had a mean of 3.71 mm (SD = 0.58), while intermuscular fat (Seam) showed the lowest mean value (2.12 mm) among all measured fat-related traits. These descriptive results provide a quantitative overview of phenotypic variation in economically relevant belly traits in Canadian commercial crossbred pigs and serve as a basis for subsequent genetic analyses.

3.2. Iodine Value

The genome-wide association analysis for IV identified one QTL located at 110.83–112.23 Mb on SSC14 (Figure 1A). This QTL explained ~6% of the total variance, and 63 SNPs were significant for IV (Table 2), and 39 genes were found in this region (Table 2 and Supplementary Material S1). Several of the genes located in this QTL region are involved in overlapping pathways regulating fatty acid composition and metabolism. COX15 was previously found to be associated with fatty acid composition traits, particularly C18:1n-9 and C18:0 [31].
In addition, CPN1 influences saturated fatty acids (SFAs), with a key SNP identified within its intron [32]; CHUK plays a regulatory role in lipid and carbohydrate metabolism, impacting IMF deposition in pigs [33]; both BLOC1S2 and SCD are linked to unsaturated fatty acid content in porcine muscle [34]. The SCD gene plays a central role in lipid metabolism by catalyzing the conversion of saturated fatty acids (e.g., stearic acid, C18:0) into monounsaturated fatty acids (e.g., oleic acid, C18:1n-9) [35]. Polymorphisms in SCD have been significantly associated with variation in fatty acid composition in pigs, particularly influencing the ratio of saturated to unsaturated fatty acids [36]. In pigs, genome-wide association studies have identified SCD as a major candidate gene within QTL regions, affecting intramuscular fat quality and composition [37]. Its proximity to top associated markers and its functional role in fatty acid desaturation highlight SCD as a valuable target for improving meat quality traits through genomic selection [35]. PKD2L1 regulates the synthesis of fatty acids, particularly C16:0 and C16:1n-7 [32]. Additional genes such as WNT8B influence growth traits in pigs [38], and NDUFB8 contributes to fatty acid oxidation by encoding a mitochondrial NADH dehydrogenase subunit [39]. HIF1AN interacts with multiple genes involved in fatty acid metabolism, playing a central role in regulating fatty acid levels [40]. The HIF1AN gene, identified through expression-based genome-wide association studies, is implicated in regulating fatty acid metabolism in pigs. It was significantly associated with 241 SNPs across multiple chromosomes [41]. Its expression may be inhibited through the PI3K-Akt pathway, linking HIF1AN to lipid regulation and energy metabolism and supporting its role as a candidate gene for intramuscular fatty acid composition [41]. Furthermore, PAX2 and SEMA4G are associated with the synthesis of monounsaturated fatty acids (MUFAs) and specific fatty acids like C16:1n-7 [32]. Lastly, LZTS2 has been linked to milk fat and protein formation in other species, indicating its broader role in lipid metabolism [42].
The QTL identified for IV highlights key genes regulating fatty acid metabolism and composition, offering potential targets for genetic selection. Genes such as CHUK, SCD, and HIF1AN, which influence lipid synthesis, oxidation, and unsaturated fatty acid content, provide insights into pathways that may be modified to help optimize pork fat quality. Associations with these gene variants may allow breeders to use genomic selection to enhance traits like fat firmness and oxidative stability, which are crucial for meat processing and consumer preferences. The association of multiple genes within overlapping pathways emphasizes the interconnected regulation of fatty acid traits and may help with more precise selection strategies to balance fat quality, composition, and overall meat performance.

3.3. Belly Firmness

Genome-wide association analysis for belly firmness identified one QTL (Figure 1B) located at 120.74–121.88 Mb on SSC15 that explained ~1% of the total variance, with nine SNPs significantly linked to the trait (Table 2). Within 0.5 Mb upstream and downstream of these significant SNPs, 69 genes (Table 2 and Supplementary Material S1) were identified. These genes contribute to pathways associated with muscle structure, metabolism, and fatty acid composition, which are critical to meat quality traits. The PNKD and VIL1 genes regulate muscle structural integrity, impacting muscle composition and meat color through variations in myoglobin concentration and metabolism [43,44]. VIL1 has been linked to meat pH, color, and tenderness in pigs and cattle [45,46,47].
Other studies have shown that the PNKD gene is implicated in the regulation of muscle development and pork quality traits in pigs [48]. Intronic variants have been associated with feed intake, water holding capacity, loin weight, meat texture, and color, particularly in breeds such as Puławska and Polish Landrace. PNKD is also predicted to interact with proteins involved in muscle growth and structure, indicating its potential role in muscle physiology [48]. These findings suggest that PNKD is a promising candidate gene for genetic selection to improve carcass traits and meat quality in pigs. Additionally, VIL1 plays a key role in cytoskeletal dynamics and villin-mediated actin remodeling, which further supports its influence on muscle quality traits [43].
PRKAG3, encoding the γ3 subunit of AMP-activated protein kinase (AMPK), plays a central role in energy metabolism in skeletal muscle and is associated with traits like glycolytic potential and IMF content in breeds such as Large White, Duroc, and Pietrain [49].
The PRKAG3 gene is considered a strong candidate, as it influences meat pH and overall pork quality. Genome-wide analyses in Finnish Yorkshire pigs identified SNPs near PRKAG3 as significantly associated with meat pH [50]. In the study by Verardo et al. (2012), post-GWAS network analysis identified PRKAG3 as one of the key candidate genes potentially involved in regulating meat pH and muscle cell homeostasis, supporting its relevance to pork meat quality traits [50]. These findings support its potential role in determining meat quality traits.
CTDSP1 and miR-26 influence milk fatty acid synthesis and adipocyte development, highlighting their potential roles in fat-related pathways. WNT6 is associated with fat metabolism in pigs [33]. WNT6 inhibits adipogenesis by activating the Wnt/β-catenin pathway, which blocks fat cell differentiation through β-catenin stabilization [51].
SLC23A3 regulates fatty acid composition in meat [52]. SLC23A3 is a key gene involved in regulating fatty acid composition in muscle and adipose tissue [52]. It may influence the levels of polyunsaturated fatty acids (PUFAs) by affecting fatty acid metabolism. A higher expression of SLC23A3 has been associated with increased PUFA content, suggesting a potential role in enhancing meat quality and nutritional value [52]. While its function is better characterized in chicken studies [52], the gene shows promise as a candidate for genomic selection to improve fatty acid traits in livestock.
Genes like ATG9A, GLB1L, and OBSL1 are expressed in skeletal muscle and are linked to pig meat quality traits [46].
The identified QTL and associated genes highlight pathways critical to belly firmness, including muscle structure, energy metabolism, and fatty acid composition. Genes such as PNKD, VIL1, and PRKAG3 emphasize the interplay between muscle integrity, IMF, and meat color, providing actionable targets for genetic selection. These insights enable breeders to optimize meat quality traits like pH, tenderness, and firmness while aligning fat deposition with processing and consumer preferences. Furthermore, genes involved in fatty acid synthesis, such as CTDSP1, WNT6, and SLC23A3, offer opportunities to fine-tune fat composition, enhancing sensory attributes and market value.

3.4. Belly Side Fat Thickness

Three QTLs were identified for belly side fat (Figure 1C). The region on SSC1 (159.49–160.73 Mb) explained 14% of the total variance and was confirmed by two SNPs. Additional windows on SSC2 (1.45–2.45 Mb) and SSC3 (111.96–112.96 Mb) explained 14% and 8% of the variance, respectively, confirmed by two and one SNPs. In total, 78 genes were located within 0.5 Mb upstream and downstream of the significant SNPs in these regions (Table 2 and Supplementary Material S1). Key genes involved in lipid metabolism include SLC22A18, which regulates lipid metabolic pathways and shows methylation variations between pig breeds [53], and SLC22A18 is an imprinted gene linked to fat accumulation [54]. It has been reported that the SLC22A18 gene is involved in lipid metabolism, as its knockdown in mice has been shown to decrease lipid accumulation in the liver, indicating its role in promoting lipid storage [55]. SLC22A18 is associated with lipid metabolism and fat deposition in pigs [56]. Located within QTL regions linked to backfat thickness and feed conversion ratio, this imprinted gene may influence fat accumulation through its regulatory effects on hepatic lipid storage [56]. Its involvement in these economically important traits highlights SLC22A18 as a promising candidate for genetic selection in swine breeding programs.
PHLDA2 influences glycogen metabolism and fat storage [57]. OSBPL5, associated with cholesterol balance, contributes to body composition and fat deposition traits [58]. NADSYN1, located within QTL regions alongside INS and IGF2, plays a critical role in lipid metabolism and glucose regulation [59], while DHCR7, linked to backfat thickness, regulates fat deposition [60,61]. ABHD1 encodes lysolipid lipase, supporting lipid droplet formation and adipose tissue development [62]. HADHA and HADHB are key players in fatty acid oxidation, impacting fat metabolism and muscle texture [63].
In the skeletal muscle tissue of Landrace weanling pigs, HADHA was found to be downregulated in individuals with higher growth rates [64]. This downregulation may indicate reduced oxidative metabolic activity, which has been associated with increased intramuscular fat content and a decreased growth rate [65]. Furthermore, HADHA expression has previously been reported to be higher in pig breeds characterized by lower growth rates [66,67,68], supporting its involvement in energy metabolism related to muscle development [64]. Collectively, these findings suggest that HADHA is a key gene exhibiting growth rate-associated expression changes in skeletal muscle and may represent a valuable molecular marker for genetic selection and breeding strategies aimed at improving growth performance in pigs.
Other notable genes include SSC-miR-10383, which modulates fat deposition by regulating mRNA networks and is differentially expressed in fat- and lean-type pigs [69]. EMILIN1 contributes to adipogenesis and growth traits, influencing fat distribution [70], and KCNK3, involved in potassium–sodium pump regulation, plays a role in meat tenderness [71]. KCNK3 has been identified as a molecular marker associated with porcine BAT/beige adipocytes, highlighting its potential involvement in the regulation of thermogenic adipogenesis in pigs [72].
RAB10 facilitates lipophagy, with its silencing leading to increased fat accumulation, underscoring its role in fat degradation [73].
The identified QTLs and associated genes reveal critical pathways regulating fat deposition, lipid metabolism, and related traits in pigs. Genes such as SLC22A18, PHLDA2, and NADSYN1 provide actionable targets for genetic selection to optimize fat storage and composition. Fat oxidation regulators like HADHA and HADHB offer insights into balancing fat metabolism with muscle texture and quality. Furthermore, genes like EMILIN1, SSC-miR-10383, and KCNK3 emphasize the interplay between fat distribution, meat quality, and growth traits.

3.5. Total Side Thickness

Genome-wide association analysis for SThK identified one QTL (Figure 1D) located at 61.08–62.08 Mb on SSC10 that explained ~10% of the total variance. Three SNPs were significantly linked to SThK (Table 2), and 31 genes were identified in this region (Table 2 and Supplementary Material S1).

3.6. Side Subcutaneous Thickness

A total of four QTLs were detected for Subq (Figure 1E). The window on SSC2 (8.08–9.24 Mb) explained 8% of the total variance and was confirmed by 10 SNPs. The window on SSC13 (4.53–5.53 Mb) explained 11% of the total variance and was confirmed by one SNP. Additionally, the window on SSC14 (132.50–133.50 Mb) explained 13% of the total variance and was confirmed by two SNPs.
The other window on SSC18 (44.58–45.58 Mb) explained 10% of the total variance and was confirmed by one SNP (Table 2 and Supplementary Material S1), and 125 genes were identified in this region. Amongst these genes, several are known to influence fat deposition and metabolism, including MACROD1, an obesity risk gene associated with BMI regulation [74], and NAA40, which is involved in lipid metabolism and fatty acid transport, processes that are essential for energy homeostasis [74]. Additionally, NAA40 was identified as a novel candidate gene associated with the lipid metabolic process in pigs. Its involvement suggests a potential regulatory role in fatty acid metabolism and muscle lipid composition, contributing to variations in intramuscular fat content [75].
MARK2, which is linked to adiposity, impacts fat accumulation and backfat thickness traits [76,77]. PLAAT3, which is highly expressed in fatty pig breeds, and LGALS12, which regulates fat deposition through adipogenesis, highlight critical pathways for subcutaneous fat accumulation [78,79].
The SLC22A6 gene plays a role in fatty acid oxidation [74], while BSCL2, which encodes seipin, regulates fat storage and meat quality traits such as loin mass and carcass yield [80]. It has been reported that the BSCL2 gene was identified as one of the key genes involved in lipid droplet formation in pigs [81]. The research showed that BSCL2 expression was associated with adipocyte size across different fat depots (subcutaneous, visceral, and intramuscular), suggesting its potential role in regulating fat accumulation and adipose tissue development [81].
GANAB influences protein glycosylation, which affects biological processes related to protein stability and function [82]. TUT1 has been linked to fatty acid composition and sensory tenderness in meat [83]. The HOXA gene family, including HOXA1, HOXA5, HOXA9, and HOXA13, plays significant roles in musculoskeletal system development, fat metabolism, and subcutaneous fat deposition. For example, HOXA5 suppresses adipocyte proliferation and is linked to fat distribution and adipose differentiation in pigs and other species [84,85]. It has been reported that HOXA10, HOXA9, and HOXA7 play a role in lipid metabolism in Duroc pigs [34].
The identified QTLs and associated genes reveal a complex network regulating subcutaneous fat deposition, lipid metabolism, and fat distribution. Genes like MACROD1, NAA40, and BSCL2 provide actionable targets for genetic selection to optimize fat storage and improve carcass composition. The role of the HOXA gene family underscores the genetic regulation of subcutaneous fat and its influence on meat quality traits such as texture and fat distribution.

3.7. Belly Seam Fat Thickness

For the belly seam trait, no significant peaks were observed (Figure 1F).
Functional enrichment analysis was performed separately for the gene sets associated with each of the belly traits evaluated in this study. No significantly enriched biological pathways were identified after multiple testing corrections, as the majority of FDR-adjusted p-values were equal to 1.0. These findings indicate a lack of overrepresented functional categories among the genes associated with the six belly traits.

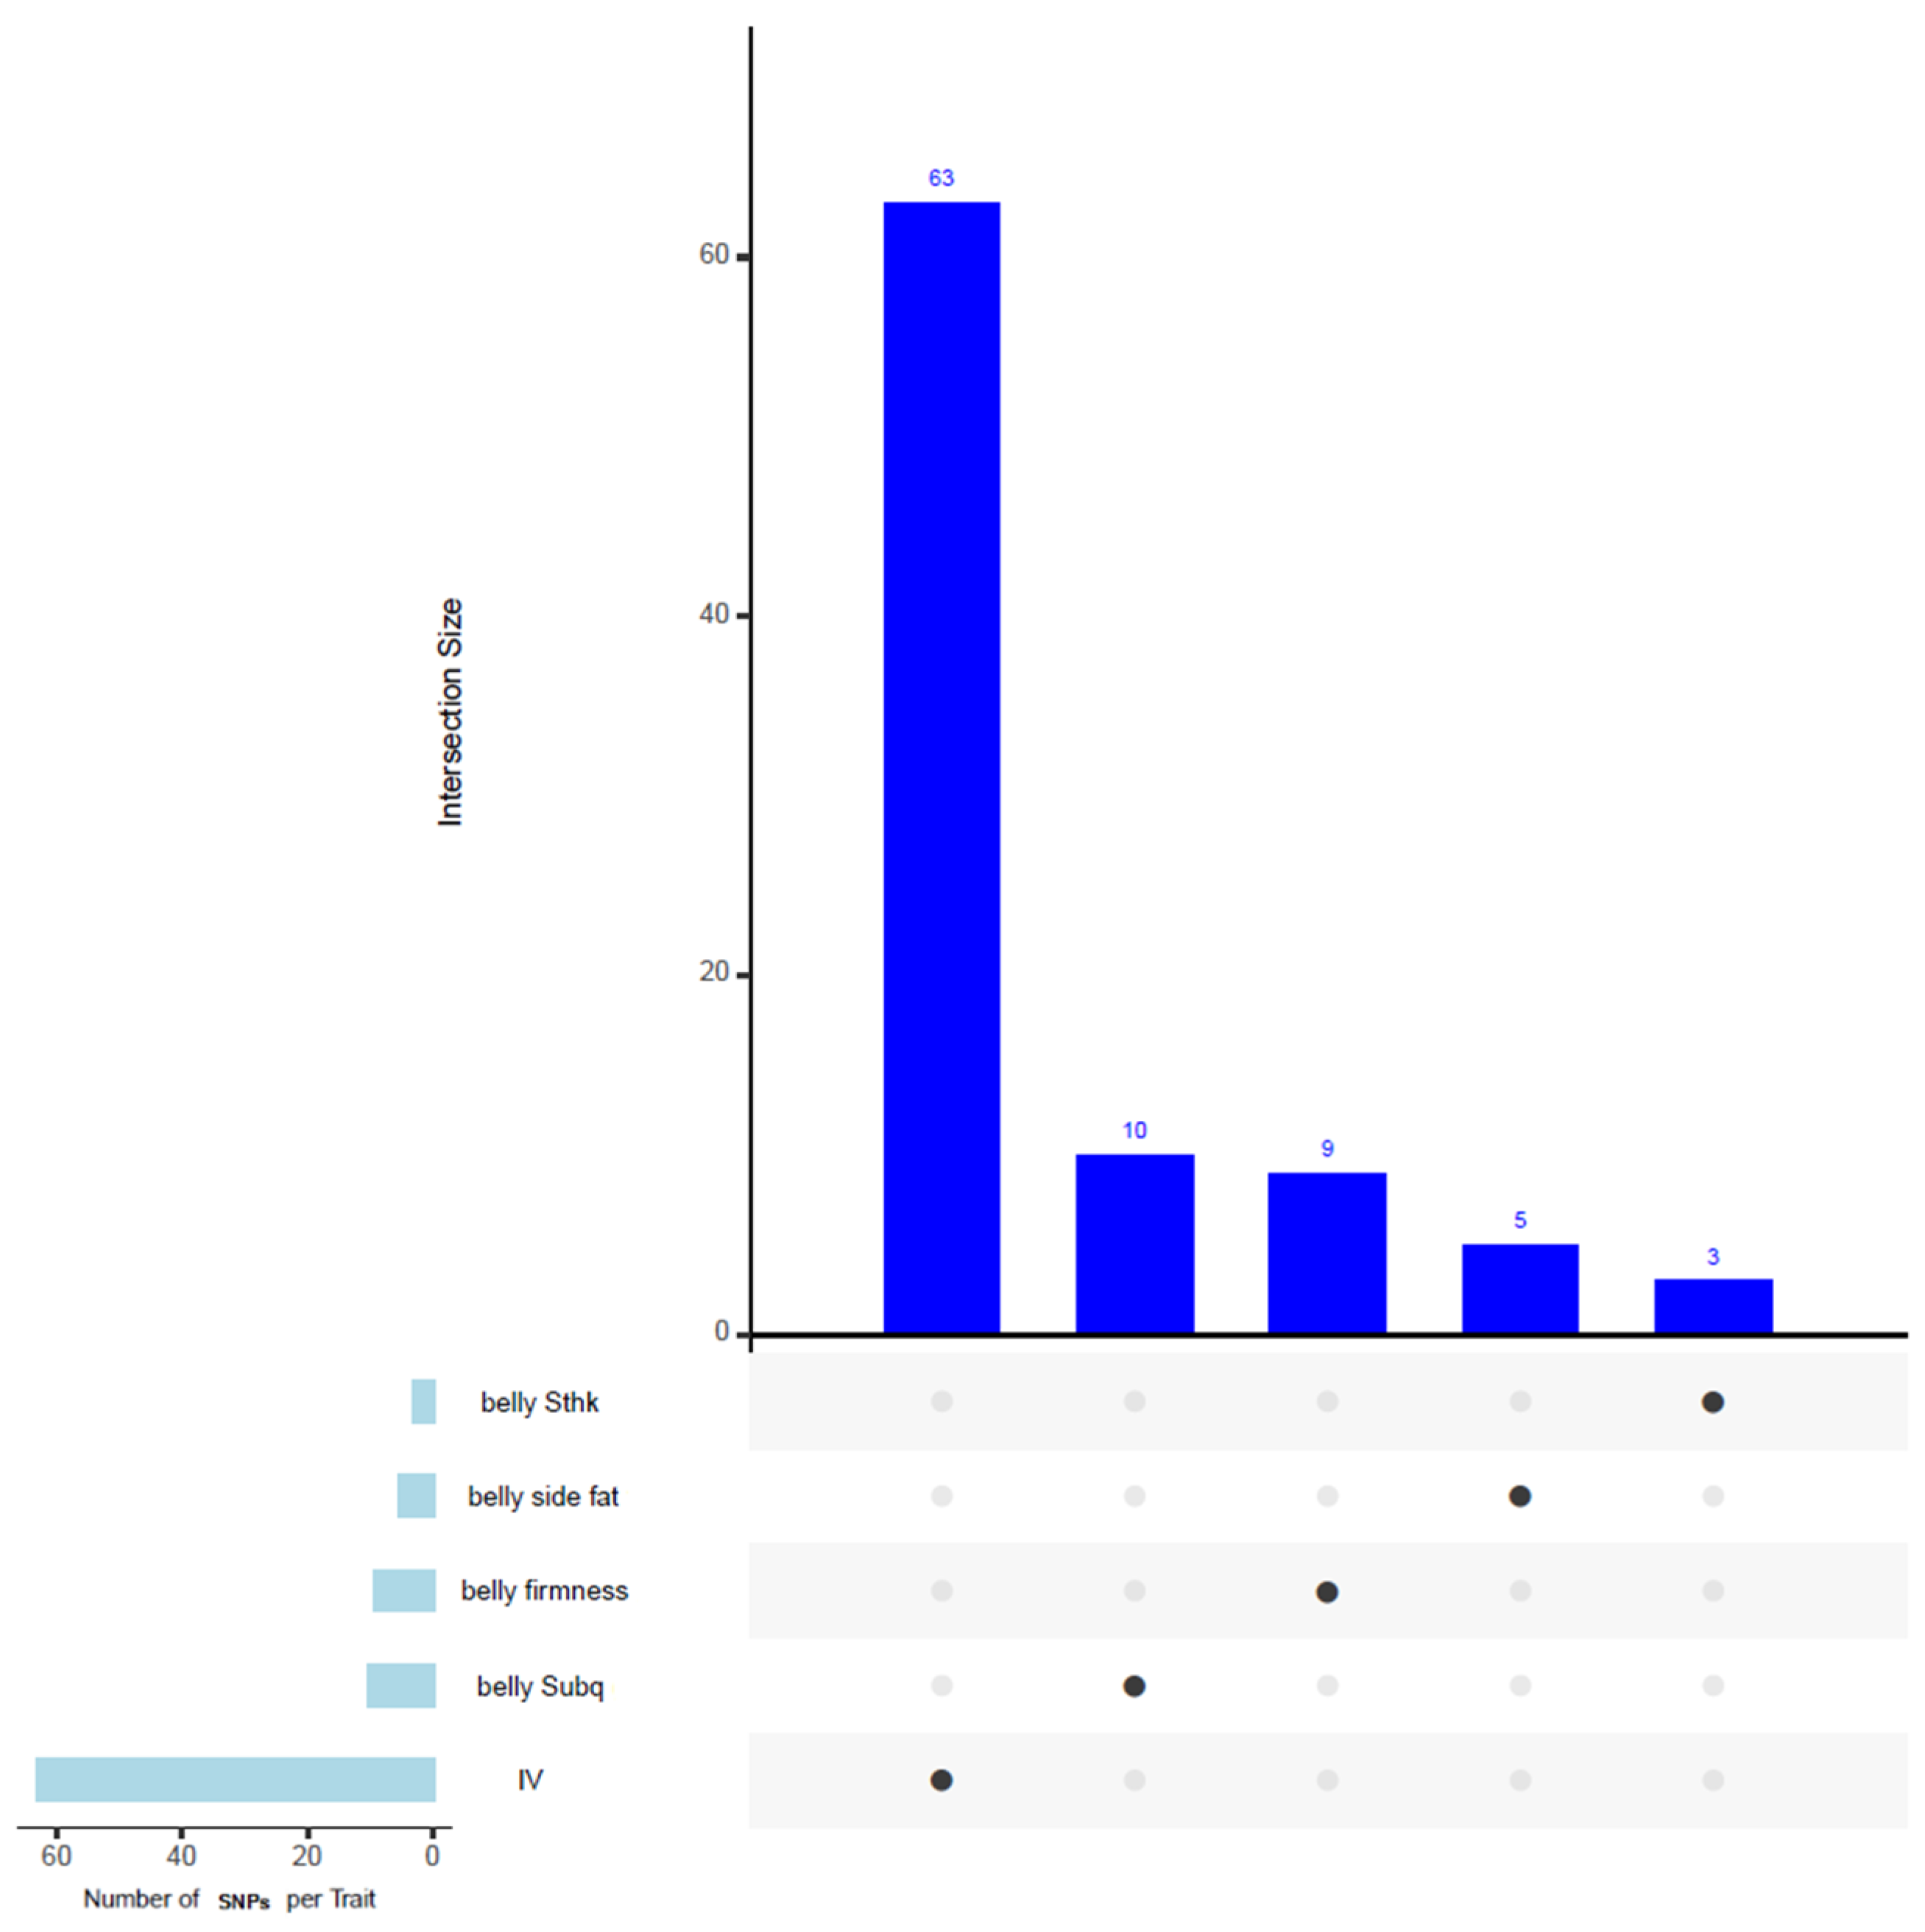
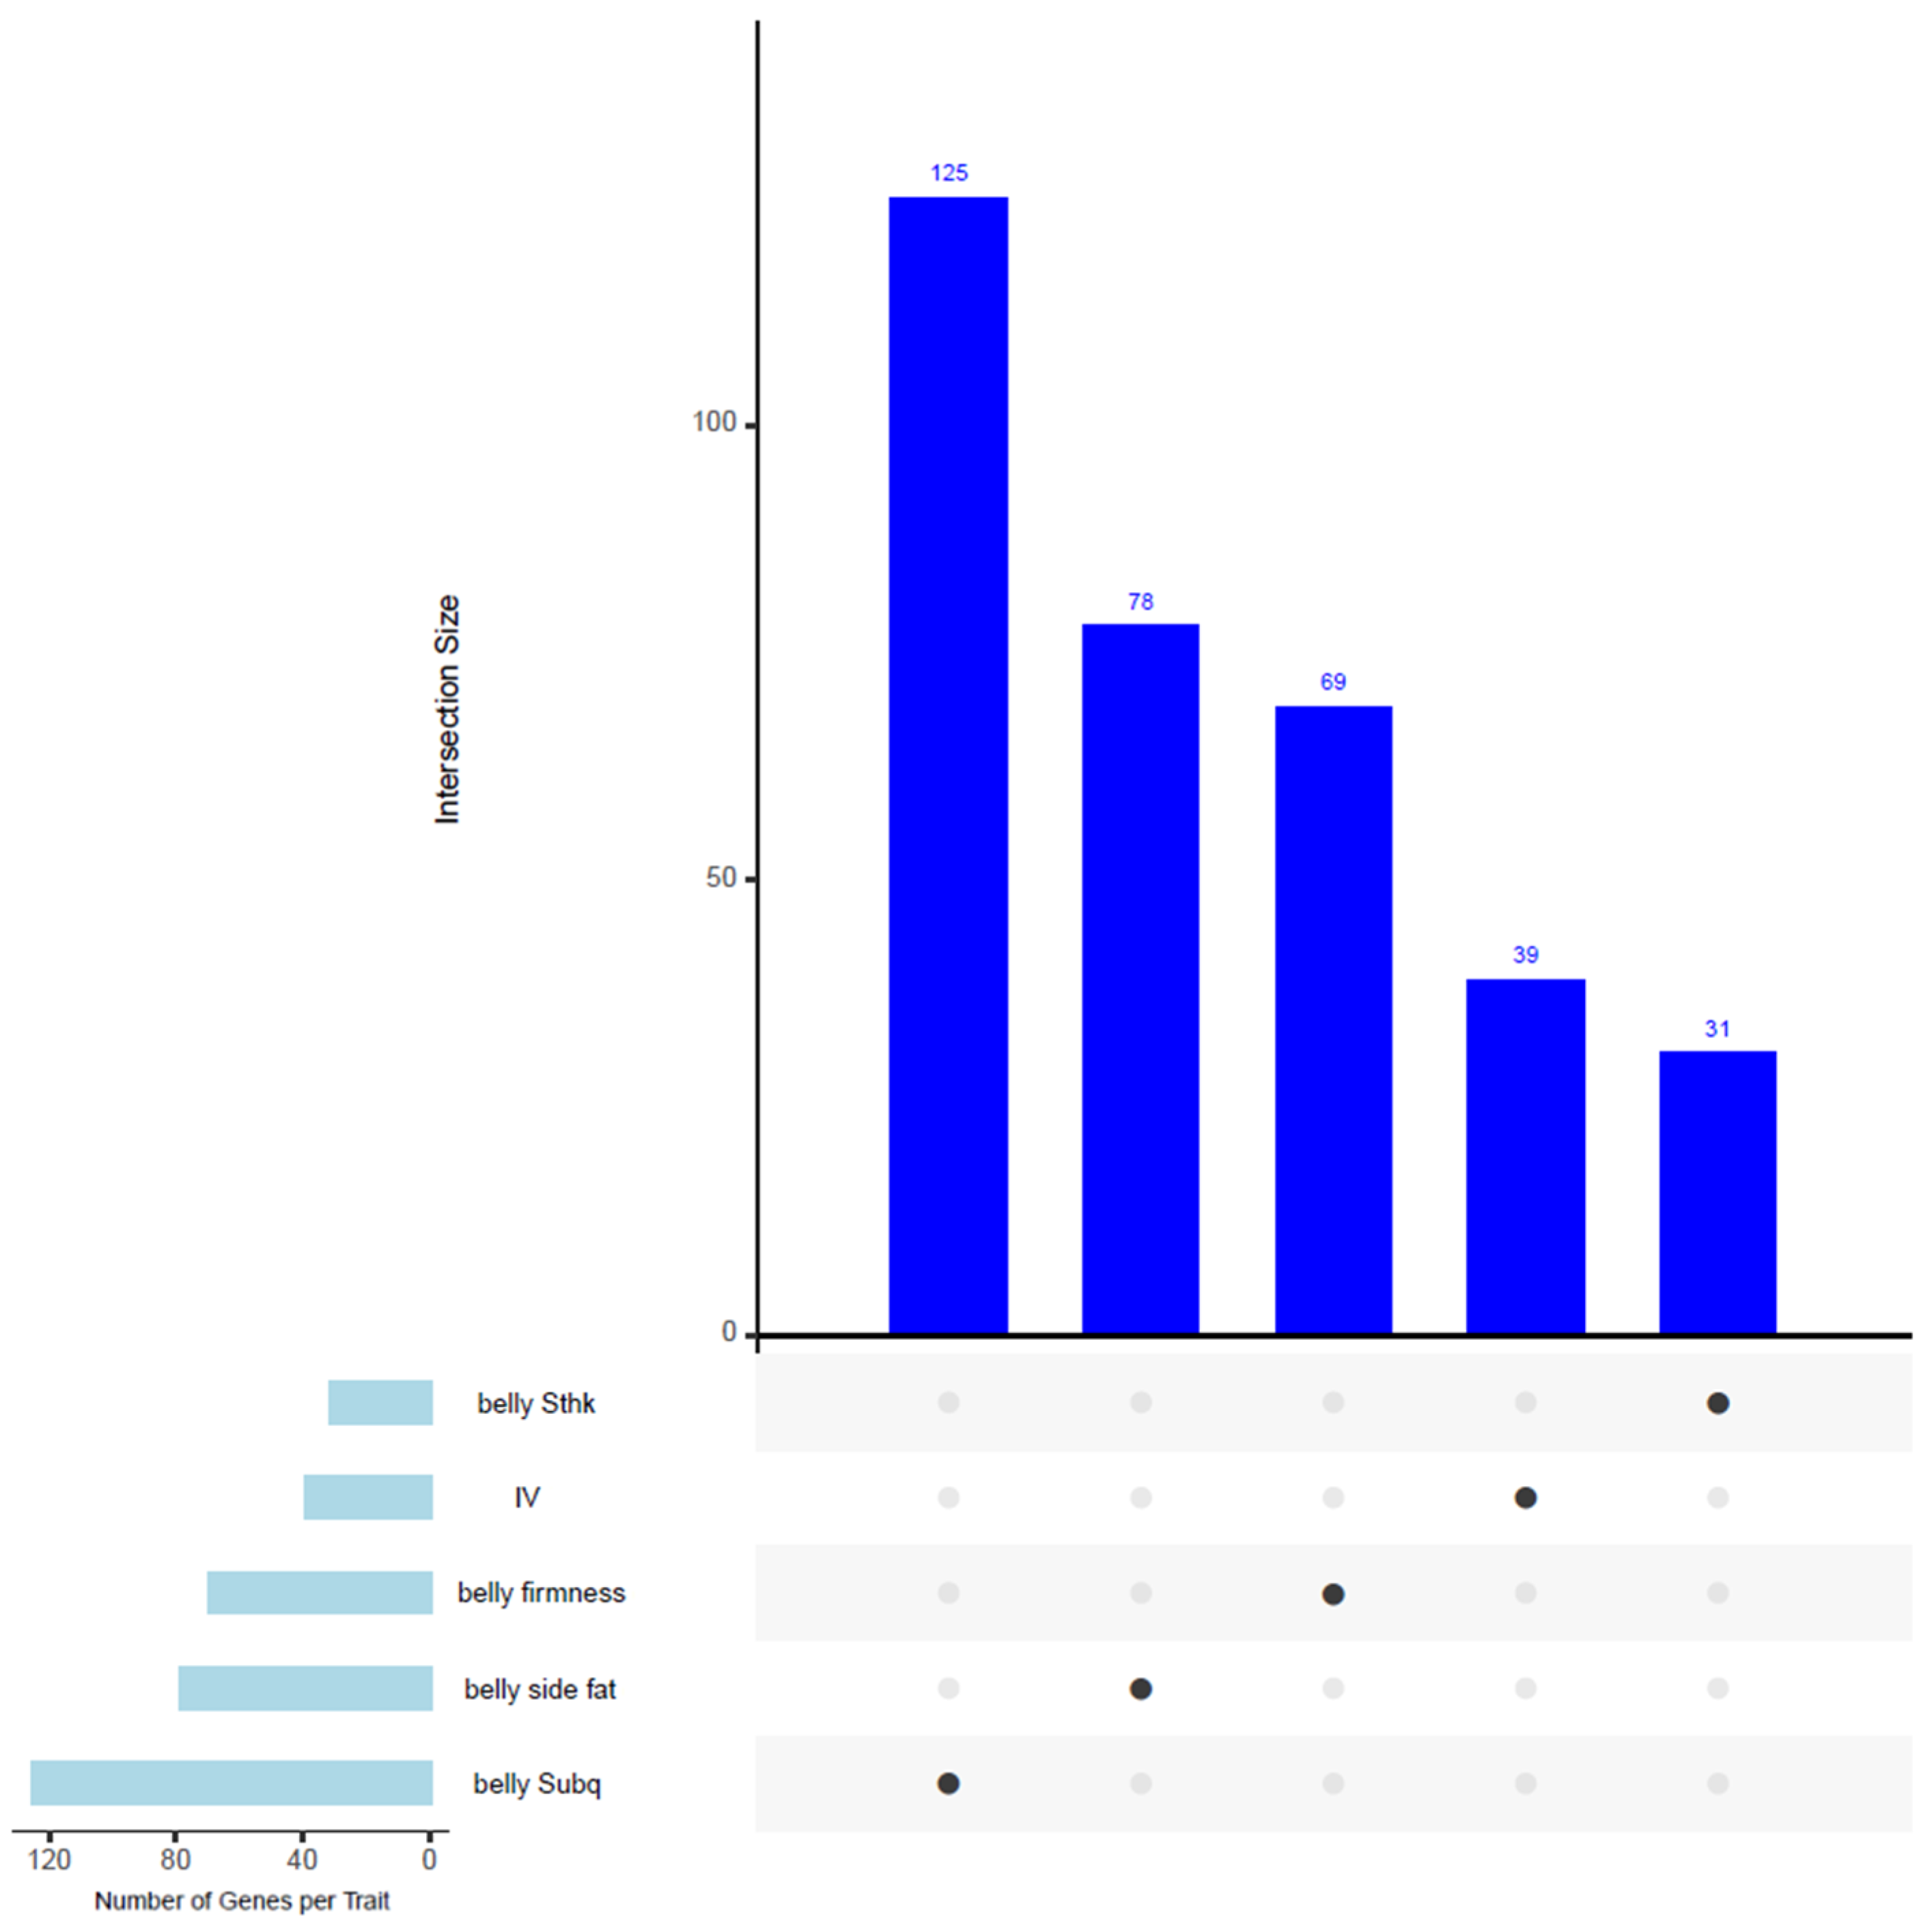
3.8. Common SNPs and Genes in Windows Associated with Multiple Traits

Figure 2 presents an upset plot illustrating the overlapping SNPs among traits in our GWAS analysis. However, no shared SNPs were identified among the traits shown in the figure.
All the SNPs are included in Supplementary File S2. Figure 3 illustrates an upset plot showing the overlapping genes shared among traits in our GWAS analysis. However, no common genes were identified among the traits presented in this figure.

4. Conclusions

This study provides valuable insights into the genetic basis of carcass belly traits in pigs using GWAS analysis with whole-genome sequencing data. By analyzing 1118 commercial crossbred pigs from three breeds, we identified significant QTLs and candidate genes associated with traits such as belly seam fat, subcutaneous belly fat, belly firmness, IV, and belly side fat. A larger population can be used in the future to confirm these results and to evaluate rarer SNPs.
This study identifies key genetic markers and pathways influencing carcass belly traits in pigs through GWAS analysis with whole-genome sequencing data. Several QTLs and candidate genes were associated with belly firmness, belly side fat, total side thickness, subcutaneous belly fat, and IV. Genes involved in lipid metabolism, fat deposition, and muscle structure were highlighted, offering actionable targets for genomic selection programs. Integrating these findings into breeding strategies can optimize carcass composition, improve meat quality, and support industry efforts to balance fat content and processing efficiency. This study provides a genetic framework for developing high-quality pork products tailored to consumer and market demands.

Supplementary Materials

The following supporting information can be downloaded at https://www.mdpi.com/article/10.3390/ani15091254/s1. Supplementary Material S1. Candidate genes located in significant or nearby regions identified in this study through whole-genome sequencing (WGS) for belly traits, including iodine value, belly firmness, belly side fat, total side thickness, and belly subcutaneous fat in Canadian commercial crossbred pigs. Supplementary Material S2. List of significant SNPs identified in this study.

Author Contributions

Conceptualization, G.P., R.K. and M.J.; methodology, M.J.; validation, R.K.; formal analysis, Z.M., G.P., J.D., K.H. and R.K.; investigation, M.J.; resources, M.J.; data curation, Z.M. and M.J.; writing—original draft preparation, Z.M.; writing—review and editing, J.D., K.H., R.K. and M.J.; supervision, G.P.; project administration, G.P.; funding acquisition, G.P. All authors have read and agreed to the published version of the manuscript.

Funding

This work was financially supported by Results Driven Agriculture Research (RDAR)/Genome Alberta, Genesus Genetic Technology (Project #2024F2553R).

Institutional Review Board Statement

The experimental conditions received approval from the Agriculture and Agri-Food Canada Lacombe Research and Development Centre (AAFC-LRDC) and the Animal Care Committee (#202204), in accordance with the principles and guidelines of the Canadian Council on Animal Care.

Informed Consent Statement

Not applicable.

Data Availability Statement

Data may be available from the authors upon reasonable request and authorization from the funding organizations.

Acknowledgments

The authors thank the AAFC-Lacombe Research and Development Centre’s operational, processing, and technical staff for their dedication and expert assistance.

Conflicts of Interest

Authors Kerry Houlahan and Robert Kemp were employed by the company Genesus Genetic Technology Inc. The remaining authors declare that the research was conducted in the absence of any commercial or financial relationships that could be construed as a potential conflict of interest.

References

  1. Lee, S.H.; Kim, J.M. Breeding Potential for Pork Belly to the Novel Economic Trait. J. Anim. Sci. Technol. 2023, 65, 1–15. [Google Scholar] [CrossRef] [PubMed]
  2. Liu, L.; Zhou, Q.; Lin, C.; He, L.; Wei, L. Integrative Analyses of Gene Expression and Alternative Splicing to Gain Insights into the Effects of Copper on Hepatic Lipid Metabolism in Swamp Eel (Monopterus albus). Aquaculture 2022, 546, 737367. [Google Scholar] [CrossRef]
  3. Arkfeld, E.K.; Wilson, K.B.; Overholt, M.F.; Harsh, B.N.; Lowell, J.E.; Hogan, E.K.; Klehm, B.J.; Bohrer, B.M.; Mohrhauser, D.A.; King, D.A.; et al. Pork loin quality is not indicative of fresh belly or fresh and cured ham quality. J. Anim. Sci. 2016, 94, 5155–5167. [Google Scholar] [CrossRef] [PubMed]
  4. Person, R.C.; McKenna, D.R.; Griffin, D.B.; McKeith, F.K.; Scanga, J.A.; Belk, K.E.; Smith, G.C.; Savell, J.W. Benchmarking Value in the Pork Supply Chain: Processing Characteristics and Consumer Evaluations of Pork Bellies of Different Thicknesses When Manufactured into Bacon. Meat Sci. 2005, 70, 121–131. [Google Scholar] [CrossRef]
  5. Juárez, M.; Plett, D.; Uttaro, B. Manually Operated Portable Equipment for Measurement and Classification of Fresh Pork Belly Firmness. Invent. Discl. 2023, 3, 100014. [Google Scholar] [CrossRef]
  6. Knecht, D.; Duziński, K.; Jankowska-Mąkosa, A. Variability of Fresh Pork Belly Quality Evaluation Results Depends on Measurement Locations. Food Anal. Methods 2018, 11, 2195–2205. [Google Scholar] [CrossRef]
  7. Soladoye, P.O.; Shand, P.J.; Aalhus, J.L.; Gariépy, C.; Juárez, M. Review: Pork Belly Quality, Bacon Properties and Recent Consumer Trends. Can. J. Anim. Sci. 2015, 95, 325–340. [Google Scholar] [CrossRef]
  8. Hermesch, S.; O’Shea, J.M. Genetic Parameters for Characteristics of Pork Bellies. In Application of New Genetic Technologies to Animal Breeding; CSIRO Publishing: Clayton, Australia, 2005; pp. 137–140. [Google Scholar]
  9. Oh, S.H.; See, M.T. Pork Preference for Consumers in China, Japan and South Korea. Asian-Australas. J. Anim. Sci. 2012, 25, 143–150. [Google Scholar] [CrossRef]
  10. Soladoye, O.P.; Uttaro, B.; Zawadski, S.; Dugan, M.E.R.; Gariépy, C.; Aalhus, J.L.; Shand, P.; Juárez, M. Compositional and Dimensional Factors Influencing Pork Belly Firmness. Meat Sci. 2017, 129, 54–61. [Google Scholar] [CrossRef]
  11. Kang, H.S.; Lopez, B.M.; Kim, T.H.; Kim, H.S.; Kim, S.H.; Nam, K.C.; Seo, K.S. Estimation of Genetic Parameters for Pork Belly Components in Yorkshire Pigs. Asian-Australas. J. Anim. Sci. 2015, 28, 922–925. [Google Scholar] [CrossRef]
  12. Hermesch, S. Genetic Relationships between Composition of Pork Bellies and Performance, Carcase and Meat Quality Traits. Animal 2008, 2, 1178–1185. [Google Scholar] [CrossRef] [PubMed]
  13. Do, C.-H.; Park, C.-H.; Wasana, N.; Choi, J.-G.; Park, S.-B.; Kim, S.-D.; Cho, G.-H.; Lee, D.-H. Genetic and Phenotypic Relationships of Live Body Measurement Traits and Carcass Traits in Crossbred Pigs of Korea. Korean J. Agric. Sci. 2014, 41, 229–236. [Google Scholar] [CrossRef]
  14. Miar, Y.; Plastow, G.; Bruce, H.; Moore, S.; Manafiazar, G.; Kemp, R.; Charagu, P.; Huisman, A.; Van Haandel, B.; Zhang, C.; et al. Genetic and Phenotypic Correlations between Performance Traits with Meat Quality and Carcass Characteristics in Commercial Crossbred Pigs. PLoS ONE 2014, 9, e110105. [Google Scholar] [CrossRef]
  15. Willson, H.E.; de Oliveira, H.R.; Schinckel, A.P.; Grossi, D.; Brito, L.F. Estimation of Genetic Parameters for Pork Quality, Novel Carcass, Primal-Cut and Growth Traits in Duroc Pigs. Animals 2020, 10, 779. [Google Scholar] [CrossRef] [PubMed]
  16. Silva, F.; Lopes, M.S.; Lopes, P.S.; Gasparino, E. A Genome-Wide Association Study for Feed Efficiency-Related Traits in a Crossbred Pig Population. Animal 2019, 13, 2447–2456. [Google Scholar] [CrossRef]
  17. Kim, K.S.; Larsen, N.; Short, T.; Plastow, G.; Rothschild, M.F. A Missense Variant of the Porcine Melanocortin-4 Receptor (MC4R) Gene Is Associated with Fatness, Growth, and Feed Intake Traits. Mamm. Genome 2000, 11, 131–135. [Google Scholar] [CrossRef]
  18. Soladoye, O.P.; Campos, L.; Aalhus, J.L.; Gariépy, C.; Shand, P.; Juárez, M. Accuracy of Dual Energy X-Ray Absorptiometry (DXA) in Assessing Carcass Composition from Different Pig Populations. Meat Sci. 2016, 121, 310–316. [Google Scholar] [CrossRef]
  19. Turner, T.D.; Mapiye, C.; Aalhus, J.L.; Beaulieu, A.D.; Patience, J.F.; Zijlstra, R.T.; Dugan, M.E.R. Flaxseed Fed Pork: N-3 Fatty Acid Enrichment and Contribution to Dietary Recommendations. Meat Sci. 2014, 96, 541–547. [Google Scholar] [CrossRef]
  20. Collison, M.W. Official Methods and Recommended Practices of the AOCS, 7th ed.; American Oil Chemists’ Society: Urbana, IL, USA, 2017. [Google Scholar]
  21. Uttaro, B.; Zawadski, S.; Larsen, I.; Juárez, M. An Image Analysis Approach to Identification and Measurement of Marbling in the Intact Pork Loin. Meat Sci. 2021, 179, 108549. [Google Scholar] [CrossRef]
  22. Wei, X.; Bohrer, B.; Uttaro, B.; Juárez, M. Evaluating the Effect of Temperature and Multiple Bends on an Automated Pork Belly Firmness Conveyor Belt Classification System. Meat Sci. 2023, 203, 109222. [Google Scholar] [CrossRef]
  23. Purcell, S.; Neale, B.; Todd-Brown, K.; Thomas, L.; Ferreira, M.A.R.; Bender, D.; Maller, J.; Sklar, P.; De Bakker, P.I.W.; Daly, M.J.; et al. PLINK: A Tool Set for Whole-Genome Association and Population-Based Linkage Analyses. Am. J. Hum. Genet. 2007, 81, 559–575. [Google Scholar] [CrossRef] [PubMed]
  24. Yang, J.; Lee, S.H.; Goddard, M.E.; Visscher, P.M. GCTA: A Tool for Genome-Wide Complex Trait Analysis. Am. J. Hum. Genet. 2011, 88, 76–82. [Google Scholar] [CrossRef] [PubMed]
  25. Gao, X.; Starmer, J.; Martin, E.R. A Multiple Testing Correction Method for Genetic Association Studies Using Correlated Single Nucleotide Polymorphisms. Genet. Epidemiol. 2008, 32, 361–369. [Google Scholar] [CrossRef] [PubMed]
  26. Peñagaricano, F.; Weigel, K.A.; Khatib, H. Genome-Wide Association Study Identifies Candidate Markers for Bull Fertility in Holstein Dairy Cattle. Anim. Genet. 2012, 43, 65–71. [Google Scholar] [CrossRef]
  27. Turner, S.D. Qqman: An R Package for Visualizing GWAS Results Using Q-Q and Manhattan Plots. J. Open Source Softw. 2018, 3, 731. [Google Scholar] [CrossRef]
  28. Badke, Y.M.; Bates, R.O.; Ernst, C.W.; Schwab, C.; Steibel, J.P. Estimation of Linkage Disequilibrium in Four US Pig Breeds. BMC Genom. 2012, 13, 24. [Google Scholar] [CrossRef]
  29. Conway, J.R.; Lex, A.; Gehlenborg, N. UpSetR: An R Package for the Visualization of Intersecting Sets and Their Properties. Bioinformatics 2017, 33, 2938–2940. [Google Scholar] [CrossRef]
  30. Huang, D.W.; Sherman, B.T.; Lempicki, R.A. Systematic and Integrative Analysis of Large Gene Lists Using DAVID Bioinformatics Resources. Nat. Protoc. 2009, 4, 44–57. [Google Scholar] [CrossRef]
  31. Zhang, J.; Cui, L.; Ma, J.; Chen, C.; Yang, B.; Huang, L. Transcriptome Analyses Reveal Genes and Pathways Associated with Fatty Acid Composition Traits in Pigs. Anim. Genet. 2017, 48, 645–652. [Google Scholar] [CrossRef]
  32. van Son, M.; Enger, E.G.; Grove, H.; Ros-Freixedes, R.; Kent, M.P.; Lien, S.; Grindflek, E. Genome-Wide Association Study Confirm Major QTL for Backfat Fatty Acid Composition on SSC14 in Duroc Pigs. BMC Genom. 2017, 18, 369. [Google Scholar] [CrossRef]
  33. Valdés-Hernández, J.; Folch, J.M.; Crespo-Piazuelo, D.; Passols, M.; Sebastià, C.; Criado-Mesas, L.; Castelló, A.; Sánchez, A.; Ramayo-Caldas, Y. Identification of Candidate Regulatory Genes for Intramuscular Fatty Acid Composition in Pigs by Transcriptome Analysis. Genet. Sel. Evol. 2024, 56, 12. [Google Scholar] [CrossRef] [PubMed]
  34. González-Prendes, R.; Quintanilla, R.; Mármol-Sánchez, E.; Pena, R.N.; Ballester, M.; Cardoso, T.F.; Manunza, A.; Casellas, J.; Cánovas, Á.; Díaz, I.; et al. Comparing the MRNA Expression Profile and the Genetic Determinism of Intramuscular Fat Traits in the Porcine Gluteus Medius and Longissimus Dorsi Muscles. BMC Genom. 2019, 20, 170. [Google Scholar] [CrossRef] [PubMed]
  35. Zhang, W.; Zhang, J.; Cui, L.; Ma, J.; Chen, C.; Ai, H.; Xie, X.; Li, L.; Xiao, S.; Huang, L.; et al. Genetic Architecture of Fatty Acid Composition in the Longissimus Dorsi Muscle Revealed by Genome-Wide Association Studies on Diverse Pig Populations. Genet. Sel. Evol. 2016, 48, 5. [Google Scholar] [CrossRef] [PubMed]
  36. Estany, J.; Ros-Freixedes, R.; Tor, M.; Pena, R.N. A Functional Variant in the Stearoyl-CoA Desaturase Gene Promoter Enhances Fatty Acid Desaturation in Pork. PLoS ONE 2014, 9, e86177. [Google Scholar] [CrossRef]
  37. Yang, B.; Zhang, W.; Zhang, Z.; Fan, Y.; Xie, X.; Ai, H.; Ma, J.; Xiao, S.; Huang, L.; Ren, J. Genome-Wide Association Analyses for Fatty Acid Composition in Porcine Muscle and Abdominal Fat Tissues. PLoS ONE 2013, 8, e65554. [Google Scholar] [CrossRef]
  38. Xing, L.; Lu, X.; Zhang, W.; Wang, Q.; Zhang, W. Genetic Structure and Genome-Wide Association Analysis of Growth and Reproductive Traits in Fengjing Pigs. Animals 2024, 14, 2449. [Google Scholar] [CrossRef]
  39. Catillo, G.; Zappaterra, M.; Zambonelli, P.; Buttazzoni, L.; Steri, R.; Minelli, G.; Davoli, R. Genome-Wide Association Study Identifies Quantitative Trait Loci Regions Involved in Muscle Acidic Profile in Large White Heavy Pigs. Animal 2020, 14, 1342–1350. [Google Scholar] [CrossRef]
  40. Passols, M.; Llobet-Cabau, F.; Sebastià, C.; Castelló, A.; Valdés-Hernández, J.; Criado-Mesas, L.; Sánchez, A.; Folch, J.M. Identification of Genomic Regions, Genetic Variants and Gene Networks Regulating Candidate Genes for Lipid Metabolism in Pig Muscle. Animal 2023, 17, 101033. [Google Scholar] [CrossRef]
  41. Puig-Oliveras, A.; Revilla, M.; Castelló, A.; Fernández, A.I.; Folch, J.M.; Ballester, M. Expression-Based GWAS Identifies Variants, Gene Interactions and Key Regulators Affecting Intramuscular Fatty Acid Content and Composition in Porcine Meat. Sci. Rep. 2016, 6, 31803. [Google Scholar] [CrossRef] [PubMed]
  42. Ryabova, A.E.; Pozovnikova, M.V.; Dementieva, N.V.; Shcherbakov, Y.S.; Tulinova, O.V.; Romanova, E.A.; Azovtseva, A.I. Analysis of the Genetic Diversity of Ayrshire Cattle in Russia. Message 2. Genome Analysis Based on Data on the Distribution of ROH Patterns in Ayrshire Cows. Ecol. Genet. 2023, 21, 235–248. [Google Scholar] [CrossRef]
  43. Marín-Garzón, N.A.; Magalhães, A.F.B.; Mota, L.F.M.; Fonseca, L.F.S.; Chardulo, L.A.L.; Albuquerque, L.G. Genome-Wide Association Study Identified Genomic Regions and Putative Candidate Genes Affecting Meat Color Traits in Nellore Cattle. Meat Sci. 2021, 171, 108288. [Google Scholar] [CrossRef] [PubMed]
  44. Listrat, A.; Lebret, B.; Louveau, I.; Astruc, T.; Bonnet, M.; Lefaucheur, L.; Picard, B.; Bugeon, J. How Muscle Structure and Composition Influence Meat and Flesh Quality. Sci. World J. 2016, 2016, 3182746. [Google Scholar] [CrossRef] [PubMed]
  45. Zhang, C.; Wang, Z.; Bruce, H.; Kemp, R.A.; Charagu, P.; Miar, Y.; Yang, T.; Plastow, G. Genome-Wide Association Studies (GWAS) Identify a QTL Close to PRKAG3 Affecting Meat PH and Colour in Crossbred Commercial Pigs. BMC Genet. 2015, 16, 33. [Google Scholar] [CrossRef] [PubMed]
  46. Piórkowska, K.; Żukowski, K.; Ropka-Molik, K.; Tyra, M.; Gurgul, A. A Comprehensive Transcriptome Analysis of Skeletal Muscles in Two Polish Pig Breeds Differing in Fat and Meat Quality Traits. Genet. Mol. Biol. 2018, 41, 125–136. [Google Scholar] [CrossRef]
  47. Lee, K.T.; Chung, W.H.; Lee, S.Y.; Choi, J.W.; Kim, J.; Lim, D.; Lee, S.; Jang, G.W.; Kim, B.; Choy, Y.H.; et al. Whole-Genome Resequencing of Hanwoo (Korean Cattle) and Insight into Regions of Homozygosity. BMC Genom. 2013, 14, 519. [Google Scholar] [CrossRef]
  48. Stuczyńska, A.; Piórkowska, K.; Tyra, M.; Żukowski, K. The Effect of QTL-Rich Region Polymorphisms Identified by Targeted DNA-Seq on Pig Production Traits. Mol. Biol. Rep. 2018, 45, 361–371. [Google Scholar] [CrossRef]
  49. Ryan, M.T.; Hamill, R.M.; O’Halloran, A.M.; Davey, G.C.; McBryan, J.; Mullen, A.M.; McGee, C.; Gispert, M.; Southwood, O.I.; Sweeney, T. SNP Variation in the Promoter of the PRKAG3 Gene and Association with Meat Quality Traits in Pig. BMC Genet. 2012, 13, 66. [Google Scholar] [CrossRef]
  50. Verardo, L.L.; Sevón-Aimonen, M.L.; Serenius, T.; Hietakangas, V.; Uimari, P. Whole-Genome Association Analysis of Pork Meat PH Revealed Three Significant Regions and Several Potential Genes in Finnish Yorkshire Pigs. BMC Genet. 2017, 18, 13. [Google Scholar] [CrossRef]
  51. Chen, X.; Luo, Y.; Jia, G.; Liu, G.; Zhao, H.; Huang, Z. FTO Promotes Adipogenesis through Inhibition of the Wnt/β-Catenin Signaling Pathway in Porcine Intramuscular Preadipocytes. Anim. Biotechnol. 2017, 28, 268–274. [Google Scholar] [CrossRef]
  52. Gunawan, A.; Basril, S.Y.; Listyarini, K.; Furqon, A.; Bilyaro, W.; Jakaria; Uddin, M.J.; Sumantri, C. Preliminary Study of Solute Carrier Family 23 Member 3 (SLC23A3) Gene as Candidate Marker for Fatty Acid Traits in Kampung-Broiler Crossbred Chickens. J. Indones. Trop. Anim. Agric. 2018, 43, 201–210. [Google Scholar] [CrossRef]
  53. Ponsuksili, S.; Trakooljul, N.; Basavaraj, S.; Hadlich, F.; Murani, E.; Wimmers, K. Epigenome-Wide Skeletal Muscle DNA Methylation Profiles at the Background of Distinct Metabolic Types and Ryanodine Receptor Variation in Pigs. BMC Genom. 2019, 20, 492. [Google Scholar] [CrossRef] [PubMed]
  54. Yamamoto, T.; Izumi-Yamamoto, K.; Iizuka, Y.; Shirota, M.; Nagase, M.; Fujita, T.; Gotoda, T. A Novel Link between Slc22a18 and Fat Accumulation Revealed by a Mutation in the Spontaneously Hypertensive Rat. Biochem. Biophys. Res. Commun. 2013, 440, 521–526. [Google Scholar] [CrossRef] [PubMed]
  55. Yamamoto, T.; Iizuka, Y.; Izumi-Yamamoto, K.; Shirota, M.; Mori, N.; Tahara, Y.; Fujita, T.; Gotoda, T. Overexpression of Slc22a18 Facilitates Fat Accumulation in Mice. Biochem. Biophys. Res. Commun. 2024, 712–713, 149922. [Google Scholar] [CrossRef] [PubMed]
  56. Ma, G.; Tan, X.; Yan, Y.; Zhang, T.; Wang, J.; Chen, X.; Xu, J. A Genome-Wide Association Study Identified Candidate Regions and Genes for Commercial Traits in a Landrace Population. Front. Genet. 2024, 15, 1505197. [Google Scholar] [CrossRef]
  57. Liu, C.; Chen, Z.; Zhang, Z.; Wang, Z.; Guo, X.; Pan, Y.; Wang, Q. Unveiling the Genetic Mechanism of Meat Color in Pigs through GWAS, Multi-Tissue, and Single-Cell Transcriptome Signatures Exploration. Int. J. Mol. Sci. 2024, 25, 3682. [Google Scholar] [CrossRef]
  58. Desire, S.; Johnsson, M.; Ros-Freixedes, R.; Chen, C.Y.; Holl, J.W.; Herring, W.O.; Gorjanc, G.; Mellanby, R.J.; Hickey, J.M.; Jungnickel, M.K. A Genome-Wide Association Study for Loin Depth and Muscle PH in Pigs from Intensely Selected Purebred Lines. Genet. Sel. Evol. 2023, 55, 42. [Google Scholar] [CrossRef]
  59. Boshove, A.; Derks, M.F.L.; Sevillano, C.A.; Lopes, M.S.; van Son, M.; Knol, E.F.; Dibbits, B.; Harlizius, B. Large Scale Sequence-Based Screen for Recessive Variants Allows for Identification and Monitoring of Rare Deleterious Variants in Pigs. PLoS Genet. 2024, 20, e1011034. [Google Scholar] [CrossRef]
  60. Martínez-Montes, Á.M.; Fernández, A.; Muñoz, M.; Noguera, J.L.; Folch, J.M.; Fernández, A.I. Using Genome Wide Association Studies to Identify Common QTL Regions in Three Different Genetic Backgrounds Based on Iberian Pig Breed. PLoS ONE 2018, 13, e0190184. [Google Scholar] [CrossRef]
  61. Gozalo-Marcilla, M.; Buntjer, J.; Johnsson, M.; Batista, L.; Diez, F.; Werner, C.R.; Chen, C.Y.; Gorjanc, G.; Mellanby, R.J.; Hickey, J.M.; et al. Genetic Architecture and Major Genes for Backfat Thickness in Pig Lines of Diverse Genetic Backgrounds. Genet. Sel. Evol. 2021, 53, 76. [Google Scholar] [CrossRef]
  62. Torres-Romero, I.; Légeret, B.; Huleux, M.; Sorigue, D.; Damm, A.; Cuiné, S.; Veillet, F.; Blot, C.; Brugière, S.; Couté, Y.; et al. The α/β hydrolase domain-containing protein 1 (ABHD1) acts as a lysolipid lipase and is involved in lipid droplet formation. bioRxiv 2023. Preprint. [Google Scholar] [CrossRef]
  63. Wang, X.; Song, H.; Liang, J.; Jia, Y.; Zhang, Y. Abnormal Expression of HADH, an Enzyme of Fatty Acid Oxidation, Affects Tumor Development and Prognosis (Review). Mol. Med. Rep. 2022, 26, 355. [Google Scholar] [CrossRef] [PubMed]
  64. Komatsu, Y.; Sukegawa, S.; Yamashita, M.; Katsuda, N.; Tong, B.; Ohta, T.; Kose, H.; Yamada, T. Identification of Genes Showing Differential Expression Profile Associated with Growth Rate in Skeletal Muscle Tissue of Landrace Weanling Pig. J. Genet. 2016, 95, 341–347. [Google Scholar] [CrossRef] [PubMed]
  65. Sudre, K.; Cassar-Malek, I.; Listrat, A.; Ueda, Y.; Leroux, C.; Jurie, C.; Auffray, C.; Renand, G.; Martin, P.; Hocquette, J.F. Biochemical and Transcriptomic Analyses of Two Bovine Skeletal Muscles in Charolais Bulls Divergently Selected for Muscle Growth. Meat Sci. 2005, 70, 267–277. [Google Scholar] [CrossRef] [PubMed]
  66. Xu, H.; Xu, Y.; Liang, X.; Wang, Y.; Jin, F.; Liu, D.; Ma, Y.; Yuan, H.; Song, X.; Zeng, W. Porcine Skeletal Muscle Differentially Expressed Gene ATP5B: Molecular Characterization, Expression Patterns, and Association Analysis with Meat Quality Traits. Mamm. Genome 2013, 24, 142–150. [Google Scholar] [CrossRef]
  67. Kim, N.K.; Park, H.R.; Lee, H.C.; Yoon, D.; Son, E.S.; Kim, Y.S.; Kim, S.R.; Kim, O.H.; Lee, C.S. Comparative Studies of Skeletal Muscle Proteome and Transcriptome Profilings between Pig Breeds. Mamm. Genome 2010, 21, 307–319. [Google Scholar] [CrossRef]
  68. Li, A.; Mo, D.; Zhao, X.; Jiang, W.; Cong, P.; He, Z.; Xiao, S.; Liu, X.; Chen, Y. Comparison of the Longissimus Muscle Proteome between Obese and Lean Pigs at 180 Days. Mamm. Genome 2013, 24, 72–79. [Google Scholar] [CrossRef]
  69. Zhang, J.; Wang, J.; Ma, C.; Wang, W.; Wang, H.; Jiang, Y. Comparative Transcriptomic Analysis of MRNAs, MiRNAs and LncRNAs in the Longissimus Dorsi Muscles between Fat-Type and Lean-Type Pigs. Biomolecules 2022, 12, 1294. [Google Scholar] [CrossRef]
  70. Silva, E.F.P.; Gaia, R.C.; Mulim, H.A.; Pinto, L.F.B.; Iung, L.H.S.; Brito, L.F.; Pedrosa, V.B. Genome-Wide Association Study of Conformation Traits in Brazilian Holstein Cattle. Animals 2024, 14, 2472. [Google Scholar] [CrossRef]
  71. Bongiorni, S.; Gruber, C.E.M.; Bueno, S.; Chillemi, G.; Ferrè, F.; Failla, S.; Moioli, B.; Valentini, A. Transcriptomic Investigation of Meat Tenderness in Two Italian Cattle Breeds. Anim. Genet. 2016, 47, 273–287. [Google Scholar] [CrossRef]
  72. Liu, J.; Jiang, Y.; Chen, C.; Zhang, L.; Wang, J.; Yang, C.; Wu, T.; Yang, S.; Tao, C.; Wang, Y. Bone Morphogenetic Protein 2 Enhances Porcine Beige Adipogenesis via AKT/MTOR and MAPK Signaling Pathways. Int. J. Mol. Sci. 2024, 25, 3915. [Google Scholar] [CrossRef]
  73. Pan, J.; Jin, H.; He, L.; Zhu, J.; Zhu, Y.; Wang, Y.; Jin, G.; Tang, X. The Regulatory Mechanism of Salt-Induced Lipid Metabolism in Porcine Biceps Femoris Through Proteomic Analysis of Lipid Droplets. Food Bioprocess Technol. 2024, 17, 4163–4176. [Google Scholar] [CrossRef]
  74. Banerjee, D.; Girirajan, S. Cross-Ancestry Analysis Identifies Genes Associated with Obesity Risk and Protection. medRxiv 2024. [Google Scholar] [CrossRef]
  75. Zhang, J.; Zhang, Y.; Gong, H.; Cui, L.; Ma, J.; Chen, C.; Ai, H.; Xiao, S.; Huang, L.; Yang, B. Landscape of Loci and Candidate Genes for Muscle Fatty Acid Composition in Pigs Revealed by Multiple Population Association Analysis. Front. Genet. 2019, 10, 1067. [Google Scholar] [CrossRef] [PubMed]
  76. Hurov, J.B.; Huang, M.; White, L.S.; Lennerz, J.; Cheol, S.C.; Cho, Y.R.; Kim, H.J.; Prior, J.L.; Piwnica-Worms, D.; Cantley, L.C.; et al. Loss of the Par-1b/MARK2 Polarity Kinase Leads to Increased Metabolic Rate, Decreased Adiposity, and Insulin Hypersensitivity in Vivo. Proc. Natl. Acad. Sci. USA 2007, 104, 5680–5685. [Google Scholar] [CrossRef]
  77. Fan, B.; Onteru, S.K.; Du, Z.Q.; Garrick, D.J.; Stalder, K.J.; Rothschild, M.F. Genome-Wide Association Study Identifies Loci for Body Composition and Structural Soundness Traits in Pigs. PLoS ONE 2011, 6, e14726. [Google Scholar] [CrossRef]
  78. Wang, Z.; Chai, J.; Wang, Y.; Gu, Y.; Long, K.; Li, M.; Jin, L. LncPLAAT3-AS Regulates PLAAT3-Mediated Adipocyte Differentiation and Lipogenesis in Pigs through MiR-503-5p. Genes 2023, 14, 161. [Google Scholar] [CrossRef]
  79. Wu, W.; Zhang, D.; Yin, Y.; Ji, M.; Xu, K.; Huang, X.; Peng, Y.; Zhang, J. Comprehensive Transcriptomic View of the Role of the LGALS12 Gene in Porcine Subcutaneous and Intramuscular Adipocytes. BMC Genom. 2019, 20, 509. [Google Scholar] [CrossRef]
  80. Piórkowska, K.; Sroka, J.; Żukowski, K.; Zygmunt, K.; Ropka-Molik, K.; Tyra, M. The Effect of BSCL2 Gene on Fat Deposition Traits in Pigs. Animals 2023, 13, 641. [Google Scholar] [CrossRef]
  81. Kociucka, B.; Jackowiak, H.; Kamyczek, M.; Szydlowski, M.; Szczerbal, I. The Relationship between Adipocyte Size and the Transcript Levels of SNAP23, BSCL2 and COPA Genes in Pigs. Meat Sci. 2016, 121, 12–18. [Google Scholar] [CrossRef]
  82. Liu, J.; Liu, Z.; Chen, L.; Zhang, H. ITRAQ-Based Proteomic Analysis Reveals Alterations in the Liver Induced by Restricted Meal Frequency in a Pig Model. Nutrition 2016, 32, 871–876. [Google Scholar] [CrossRef]
  83. Leal-Gutiérrez, J.D.; Elzo, M.A.; Johnson, D.D.; Hamblen, H.; Mateescu, R.G. Genome Wide Association and Gene Enrichment Analysis Reveal Membrane Anchoring and Structural Proteins Associated with Meat Quality in Beef. BMC Genom. 2019, 20, 151. [Google Scholar] [CrossRef] [PubMed]
  84. Cui, W.; Zhang, Q.; Wang, H.; Zhang, X.; Tian, M.; Liu, D.; Yang, X. Effects of HOXC8 on the Proliferation and Differentiation of Porcine Preadipocytes. Animals 2023, 13, 2615. [Google Scholar] [CrossRef] [PubMed]
  85. Parrillo, L.; Spinelli, R.; Costanzo, M.; Florese, P.; Cabaro, S.; Desiderio, A.; Prevenzano, I.; Raciti, G.A.; Smith, U.; Miele, C.; et al. Epigenetic Dysregulation of the Homeobox A5 (HOXA5) Gene Associates with Subcutaneous Adipocyte Hypertrophy in Human Obesity. Cells 2022, 11, 728. [Google Scholar] [CrossRef] [PubMed]
Figure 1. Manhattan and QQ plot of the GWAS for belly traits: (A) iodine value (λ = 0.97), (B) belly firmness (λ = 0.98), (C) belly side fat (λ = 0.96), (D) side SthK (λ = 0.96), (E) side Subq (λ = 0.94), and (F) belly seam (λ = 0.96) in commercial pigs. The horizontal red line indicates the genome-wide significance threshold (a significant threshold of p < 2.62410715 × 10⁻⁷, corrected for multiple testing). We applied the corrected threshold for multiple testing using the simple method described by Gao et al. (2008) [25].
Animals 15 01254 g001
Figure 2. Upset plot illustrating the overlapping SNPs associated with multiple traits identified in the GWAS analysis. Although several SNPs were detected for each individual trait, no shared SNPs were observed across the traits shown. The full list of identified SNPs is provided in Supplementary File S2.
Animals 15 01254 g002
Figure 3. Upset plot showing the overlapping genes located within associated windows across multiple traits in the GWAS analysis. Despite detecting candidate genes for each trait, no common genes were identified among the traits displayed in this figure.
Animals 15 01254 g003
Table 1. Descriptive statistics for belly traits in Canadian commercial crossbred pigs.
TraitnminmaxmeanSD
IV111750.975.760.33.34
Belly firmness (°)49469.817713226.4
Belly side fat (mm)10830.954.002.500.45
Belly SThK (mm)9642.005.493.710.58
Belly Subq (mm)10830.822.501.360.23
Belly Seam (mm)9640.404.072.120.58
IV: iodine value; SThK: total side thicknesses; Subq: subcutaneous fat; Seam: intermuscular fat.
Table 2. Candidate genes located on significant regions and/or nearby regions identified using a whole-genome sequence (WGS) for belly traits in Canadian commercial crossbred pigs.
TraitChrStart, BPEnd, BPSNP (Lowest p-Value)MAFp-ValueVar 1Candidate Genes 2
Iodine value14110,834,310112,238,89914:111437307C:T0.3291.33 × 10−80.06ENTPD7, COX15, CUTC, ABCC2, Y_RNA, DNMBP, CPN1, CHUK, CWF19L1, SNORA12, BLOC1S2, PKD2L1, SCD, WNT8B, SEC31B, NDUFB8, HIF1AN, ENSSSCG00000044499, ENSSSCG00000049992, ENSSSCG00000058770, PAX2, SLF2, SEMA4G, ssc-mir-10382, MRPL43, TWNK, LZTS2, ENSSSCG00000053081, SFXN3, KAZALD1, and TLX1
Belly firmness15120,747,942121,885,70815:121247942C:T0.1051.49 × 10−70.01GPBAR1, AAMP, PNKD, CATIP, SLC11A1, CTDSP1, MIR26B, VIL1, USP37, CNOT9, PLCD4, BCS1L, RNF25, STK36, TTLL4, CYP27A1, PRKAG3, WNT6, WNT10A, CDK5R2, FEV, CRYBA2, ssc-mir-375, CFAP65, IHH, NHEJ1, SLC23A3, CNPPD1, RETREG2, ZFAND2B, ABCB6, ATG9A, ANKZF1, GLB1L, STK16, TUBA4A,
DNAJB2, PTPRN, MIR153-1, DNPEP, ssc-mir-4334, DES, GMPPA,
ASIC4, CHPF, TMEM198, OBSL1, INHA, STK11IP, SLC4A3, and U6
Belly side fat 1159,498,384160,730,0751:160230075A:C0.1821.87 × 10−70.14RNF152 and CDH20
Belly side fat21,451,9722,455,8052:1951972T:C0.0343.19 × 10−80.14INS, TH, ASCL2, TSPAN32, CD81, TSSC4, TRPM5, KCNQ1, CDKN1C, SLC22A18, PHLDA2, NAP1L4, CARS1, OSBPL5, NADSYN1, and DHCR7
Belly side fat3111,960,719112,960,7193:112460719T:C0.0192.45 × 10−70.08TCF23, PREB, ABHD1, KHK, EMILIN1, OST4, AGBL5, TMEM214, MAPRE3, DPYSL5, CENPA, SLC35F6, KCNK3, CIB4, CIMIP2C, OTOF, DRC1, SELENOI, ADGRF3, HADHB, HADHA, GAREM2, RAB10, and U6
Side SthK1061,089,62362,089,64310:61589642T:C0.2051.68 × 10−70.1ENSSSCG00000061765, ENSSSCG00000045932,
ENSSSCG00000055980, andENSSSCG00000052436
side Subq28,082,9149,247,8162:8587647A:T0.0171.47 × 10−70.08MACROD1, OTUB1, COX8A, NAA40, RCOR2, MARK2, SPINDOC, ZFTA, ATL3, PLAAT3, LGALS12, PLAAT5, SLC22A8, SLC22A6, SLC3A2, U2, SNORD26, SNORD27, SNORD28, SNORD22, SNORD29, SNORD30, SNORD31, WDR74, TEX54, STX5, NXF1, TMEM223, TMEM179B, TAF6L, POLR2G, TTC9C, HNRNPUL2, BSCL2, UBXN1, UQCC3, CSKMT, SNORA57, C11orf98, INTS5, GANAB, B3GAT3, ROM1, EML3, MTA2, and TUT1
side Subq134,535,7285,535,72813:5035728A:G0.0122.24 × 10−70.11TBC1D5 and U6, SATB1
side Subq14132,507,485133,507,49814:133007485G:C0.0144.65 × 10−80.13PSTK, IKZF5, ACADSB, ssc-mir-4331-2, HMX3, HMX2, BUB3, GPR26, CPXM2, and CHST15
side Subq1844,588,81645,588,81618:45088816A:G0.0141.06 × 10−70.1JAZF1, TAX1BP1, HIBADH, U6, EVX1, HOXA13, HOXA11, HOXA10, ssc-mir-196b-1, HOXA9, HOXA7, HOXA5, HOXA3, HOXA2, and HOXA1
1: all the genes are included in the Supplementary File. 2: Var: percentage of additive genetic variance explained by each SNP.
Disclaimer/Publisher’s Note: The statements, opinions and data contained in all publications are solely those of the individual author(s) and contributor(s) and not of MDPI and/or the editor(s). MDPI and/or the editor(s) disclaim responsibility for any injury to people or property resulting from any ideas, methods, instructions or products referred to in the content.

