Simple Summary
High temperature is a major stressor that has been shown to impair poultry health and performance through multiple pathways, including metabolism and immunity. This has significant negative consequences for the poultry industry. In this study, mRNA-seq was used to identify differentially expressed genes (DEGs) in the spleen and bursae of Fabricius of chickens during heat stress. The DEGs included IGSF11, ALDOB, APOB, GZMA, DUSP1, and HSPA5. Subsequent cell function analysis confirmed that the over-expression of DUSP1 and HSPA5 enhanced the capacity of HD11 cells to recognize and bind LPS while concomitantly reducing the time required for LPS presentation. This study provides a theoretical foundation for further research on the impact of heat stress on the immune system.
Abstract
The objective of this study was to elucidate the immune system response to heat stress in chickens. In this study, mRNA-seq was conducted on the spleen and bursa of experimental chickens, six differentially expressed genes associated with immunity were present in the spleen following immunization. Following exposure to heat stress, 15 differentially expressed genes related to immune and heat shock proteins were identified. Furthermore, the expression levels of DUSP1 and HSPA5 were significantly lower in the non-stressed group. With regard to the mechanism, overexpression of DUSP1 or HSPA5 resulted in no significant difference in MHC-I, MHC-II, and CD80 mRNA expression. However, following stimulation with LPS, mRNA expression of MHC-II, CD80, CD86, CD1C, IL1B, and TLR4 was significantly increased. Furthermore, the enhancement was observed to occur at an earlier stage than when LPS was stimulated alone, thereby facilitating the recognition of LPS by HD11. Following the inhibition of DUSP1 or HSPA5 and the stimulation of LPS, no significant alterations were detected. However, CD1C expression was notably diminished. In conclusion, DUSP1 and HSPA5 have been demonstrated to play important roles in immunity to heat stress by affecting antigen presentation. The present study provides a theoretical basis for the regulation mechanism of disease resistance in poultry.
1. Introduction
Under high temperatures in summer, poultry would experience a host of health problems, such as reduced immunity and disease resistance, lower food intake, slow growth and development, abnormal endocrine functions, and increased mortality [1,2,3,4,5]. These issues seriously hamper intensive poultry production, leading to economic losses. High temperatures usually cause heat stress, which could influence chicken productive performance through reduced immunity. Effect of chronic heat stress on some physiological and immunological parameters in different breeds of broilers [6,7,8].
It has been demonstrated that acute heat stress results in the inhibition of pituitary and thyroid components within the pituitary–thyroid–peripheral tissue axis (PTTA). Furthermore, lipopolysaccharides (LPSs) have been shown to exert additional inhibitory effects on all components of the PTTA [9]. As a highly conserved protein family, the heat shock proteins (HSPs) are expressed under high temperatures or other environmental stresses, such as hypoxia, ultraviolet radiation, cold, viral infection, and starvation, and bind to non-protein molecules with exposed hydrophobic residues [10,11,12,13]. Mammalian HSP60, HSP70, HSP90, and gp96 can form bonds with LPS [14,15,16]. In mammals, other functions of HSPs include inducing antigen-presenting cells (APCs) to secrete cytokines (IL-1 and IL-6), promoting dendritic cell maturation, and increasing MHC-I and MHC-II expression [17,18,19]. Extracellular HSPs can also promote cross-presentation of HSP-bound peptide antigens to MHC-I molecules in dendritic cells, activating antigen-specific cytotoxic T lymphocytes [20]. There are differences in chickens and mammals on immune genes, and it is important to conduct research to better understand these differences.
The pecteneal hyalocytes can recognize antigens but cannot present antigens in chickens, which are considered to be monocyte/macrophage systems, and the function is not yet fully understood in the immune response [21]. The immune response of the HD11 (a macrophage cell line) to LPS in the heat-stress environment (up-regulation of CCL4, CCL5, IL1B, IL8, and iNOS) was higher than in thermoneutral conditions [22]. Expression for the immune-related genes CCL4, CCL5, CD40, GM-CSF, IFN-γ, IL-10, IL-12b, IL-1b, IL-6, IL-8, and iNOS was highly induced in response to LPS in the chicken-bone-marrow-derived dendritic cells [23]. Microarray analysis on chicken DNA has revealed the transcriptome of E. coli-infected chicken HD11, and researchers speculate that chicken HSP70 is involved in immune-related pathways [24]. The involvement of avian HSPs in immune response was further substantiated by the observation that the inhibition of intracellular HSP90 expression led to a notable reduction in IFN-γ expression following the immunostimulation of chicken HD11 cells with CpG oligodeoxynucleotides (CpG-OND). Conversely, HSP90-bound CpG-OND increased IFN-γ, IL-6, and MIP-3α expression, as well as nitrogen oxide (NO) levels [24].
HSPs have been demonstrated to influence immune response. However, research into the function of HSPA5 in antigen presentation remains limited. In this study, mRNA-seq was employed to identify genes associated with heat stress, and the impact of DUSP1 and HSPA5 on antigen presentation was validated through cell function analysis. This will facilitate further investigation into the role of antigen presentation in immune function during heat stress.
2. Materials and Methods
2.1. Experimental Animal Management
Twelve 28-day-old SPF chickens (Xinxing Dahuanong Poultry and Egg Co., Ltd, Guangdong, China) were inoculated with Newcastle disease vaccine (NDV, Live, Strain Clone 30, Harbin, China, only as antigen) and served as an experimental group, and six 28-day-old SPF chickens were not inoculated with Newcastle disease vaccine and served as a control group. Antibody levels were detected after 7 d of rearing. The experimental chickens were divided into three groups: control group (not been vaccinated against Newcastle disease; n = 6; 24 ± 1 °C for 3 h), vaccination group (vaccinated against Newcastle disease but had non-stressed; n = 6; 24 ± 1 °C for 3 h), and heat treatment vaccination group (vaccinated against Newcastle disease but had experienced stressed; n = 6; 36 ± 1 °C for 3 h). They were stunned with a stun gun and promptly exsanguinated through the jugular vein at 35 days old. Subsequently, three chicks were selected from each group, and the spleen and bursa of Fabricius tissue of these chicks were harvested for mRNA-seq. Blood samples were collected and stored at −20 °C. Tissue samples were stored in liquid nitrogen. The experimental scheme was approved by the Animal Care Committee of South China Agricultural University.
2.2. Antibody Level Determination and Measurements of Heat-Resistance Traits
Hemagglutination inhibition (HI) antibody levels were measured according to previously reported [25]. Corticosterone was detected using an enzyme-linked immunosorbent assay (ELISA) kit (Guangzhou Darui Antibody CO., LTD, Guangzhou, China) as per the manufacturer’s instructions. The H/L value was counted by light microscope, and the expression of CD3+, CD4+, and CD8+ T cells was analyzed using flow cytometry.
2.3. mRNA-Seq of Spleen and Bursa of Fabricius Tissues
The spleen and bursae of Fabricius from the control group, the vaccination group, and the heat treatment vaccination group were subjected to mRNA-seq (Illumina HiSeq 2500, SE50, 5×). Each treatment had three biological replicates, totaling 18 samples. All samples’ base mass fractions of sequencing reads were above Q30 (99.9% recognition rate of bases) (Figure A1A,B). In the base composition of each sequencing sample, C and G curves mostly overlapped, as did T and A curves. The sequencing process was stable and could be visualized as a horizontal line, indicating balanced base composition in each sequencing sample (Figure A1C,D). Sequenced reads were trimmed for adaptor sequence and masked for low-complexity or low-quality sequence, then mapped to Gallus gallus (galgal6) whole genome using bowtie 2. RefSeq identifiers of candidate genes were matched to corresponding Ensembl identifiers (Ensembl release 97, www.ensembl.org, 3 October 2019). Differential expression analysis of two conditions/groups was performed using the DEGseq. Genes with an adjusted p-value < 0.05 found by DEseq were assigned as differentially expressed. Gene Ontology (GO) enrichment analysis of the DEGs was implemented by the GOseq R packages (Bioconductor 3.18) based on Wallenius non-central hyper-geometric distribution [26], which can adjust for gene length bias in DEGs. We used KOBAS 2.0 software (http://bioinfo.org/kobas, 5 December 2019) to test the statistical enrichment of differential expression genes in KEGG pathways [27].
2.4. Cell Culture
The chicken HD11 macrophage cell line (gifted from Prof. Susan Lamont, Department of Animal Science, Iowa State University, Ames, IA, USA) was cultured at 37 °C and 5% CO2 in Roswell Park Memorial Institute 1640 medium (Gibco Life Technologies, Carlsbad, CA, USA) supplemented with 10% heat-inactivated fetal calf serum (PAA, Pashing, Austria), 10 mm HEPES, 0.1 mm non-essential amino acids, 2 mm glutamine, 1 mm sodium pyruvate, 100 U/mL penicillin, 100 μg/mL streptomycin, and 5 × 10⁻⁵ M 2-mercaptoethanol (pH 7.3).
2.5. Synthesis of siRNA and LPS Stimulation
A set of four siRNA interfere fragments was synthesized by GenePharma (GenePharma, Suzhou, China) that targeted distinct sites within HSPA5 and DUSP1, along with a positive control targeting glyceraldehyde-3-phosphate dehydrogenase (GAPDH) (sequences are shown in Supplemental Data 2). Cells (1–2 × 10⁵) seeded in Costar 12-well plates (Corning, Palo Alto, CA, USA) were stimulated with 1 μg/mL LPS (E. coli endotoxin 0111: B4; Sigma, St. Louis, MO, USA). Cells were collected for RNA extraction 0, 2, 4, and 6 h post stimulation. To verify the role of HSPA5 and DUSP1 in LPS-induced activation, HD11 cells were transfected with an HSPA5 and DUSP1 overexpression plasmid or treated with the siRNA interfere fragments targeting HSPA5 and DUSP1 for 48 h, then stimulated with LPS 1 μg/mL, and collected 0, 2, 4, and 6 h post stimulation. Triplicate samples were used in each group.
2.6. Overexpression Plasmid Construction and Transfection
Chicken cDNA was synthesized from RNA using the iScript cDNA Synthesis Kit (Bio-Rad, Hercules, CA, USA). The chicken DUSP1 open reading frame (the Hind III digestion site was added to the 5′ end, and the Xba I restriction site was added to the 3′ end) was synthesized by the company (Gene Create, Wuhan, China). The product was cloned into the pcDNA3.1 vector between the Hind III and Xba I restriction sites. The primer pair 5′-ggggGGTCTCtagtgGTTCGTGTGTGACGAGCGG-3′ (forward) and 5′-ccgGGTCTCgtgggACACAACATTCAGAGATGCCAGT-3′ (reverse) was used to amplify the chicken HSPA5 open reading frame (uppercase in the primer sequences, annealing temperature is 56 °C). The PCR product was cloned into the pSDS vector following the RuyilianTM instructions (Innovative Cellular Therapeutics, Shanghai, China); 0.8 μg plasmid and 3 μL Attractene (Qiagen, Düsseldorf, Germany) were mixed with 60 μL Opti-MEM (Gibco Life Technologies) and incubated for 12 min at room temperature, then transfected into cells.
2.7. Reverse Transcription-qPCR (RT-qPCR) Analysis
Total RNA was extracted from cells using TRIzol reagent (Takara Bio Inc., Dalian, China), and first-strand cDNA was synthesized using iScript cDNA Synthesis kit (Bio-Rad). The cDNA samples were quantified by RT-qPCR using the CFX96 system with SsoFast EvaGreen Supermix (Bio-Rad), and reaction conditions were set according to the manufacturer’s recommendations with an annealing temperature of 58–65 °C (40 cycles). The primer sequences are shown in Table A1. GAPDH was used as an internal control for RT-qPCR data normalization.
2.8. Statistical Analysis
A Student’s t-test was employed to ascertain the disparities between the groups. Each group comprised at least three replicates. GraphPad software was used for data analysis (GraphPad Prism 8). Differences were analyzed using the Student’s t-test. A value of p < 0.05 was considered to be statistically significant.
3. Results
3.1. Antibodies, Along with Pre and Post-Heat-Stress Changes to Physiological Indices
Following the administration of Newcastle disease virus, antibody levels in heat-stressed SPF chickens demonstrated a significant increase at 7 and 10 days post-immunization, indicating the persistence of an immune response. Moreover, acute heat stress did not appear to cause antibody changes immediately (Figure 1A). No tachypnoea was observed in the NC group, whereas tachypnoea was observed in the group exposed to heat stress (36 ± 1 °C, Figure 1B,C). We then investigated the changes in physiological parameters in response to stress in different treatment groups. They had significantly higher H/L (p < 0.01) and corticosterone (p < 0.01) (Figure 1D,F) and significantly lower CD4+/CD8+ ratio (p < 0.01) than non-heat-stressed chickens (Figure 1E), indicating a physiological stress response.
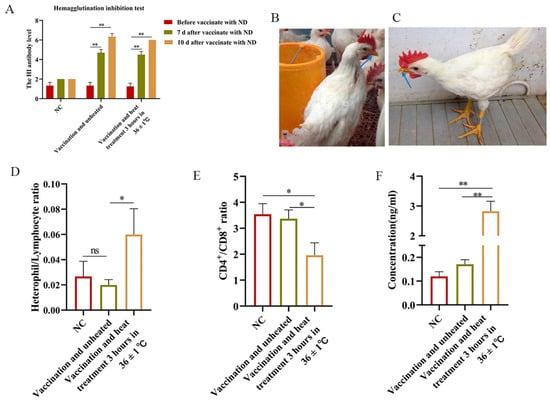
Figure 1.
Antibody levels and heat stress detection. (A) Detection of antibody levels after NDV injection. (B) The chickens in the NC group were normal breathers. (C) The chickens in the heat stress (36 ± 1 °C) group showed mouth opening and rapid breathing. (D–F) The changes in H/L, concentration, and CD4+/CD8+ were detected after different treatments. Data presented as mean ± SEM. Blue arrow: The state of the chicken's mouth; *: p < 0.05; **: p < 0.01, ns: no significance.
3.2. Gene Expression Differences in Spleen and Bursa of Fabricius Tissues from Different Treatments
The mRNA-seq analysis yielded a total of 22 differentially expressed genes in Group A, of which 20 were found to be up-regulated and 2 were down-regulated, including FGB, IGSF11, and ALDOB (Figure 2A). Similarly, Group B exhibited a total of 35 differentially expressed genes, encompassing 7 up-regulated genes and 28 down-regulated genes, including GZMA, STAR, and DUSP1 (Figure 2B). Group C revealed a total of 43 genes, of which 12 were found to be up-regulated, while 31 were down-regulated, including MAP2, CD69, and MYL4 (Figure 2C). Group D exhibited a total of 13 genes, of which 5 were up-regulated and 8 were down-regulated, including ABCB1LB, COL21A1, and CD69 (Figure 2D).
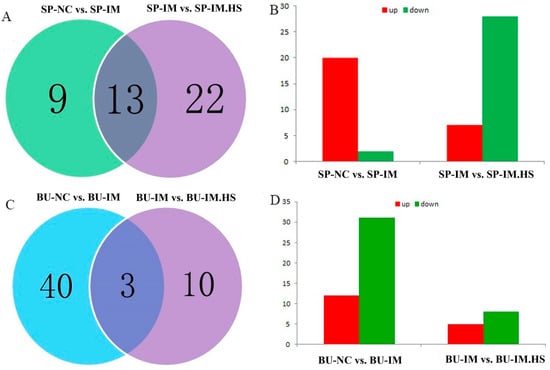
Figure 2.
Differentially expressed genes among four contrasts. The spleen-sequencing data were subjected to grouping and comparison. The SP-NC is the control group, SP-IM is the vaccination group, and SP-IM. HS refers to the heat treatment vaccination groups (A,B). The sequencing data pertaining to the bursa of Fabricius were subjected to grouping and comparison. BU-NC is the control group, BU-IM is the vaccination group, BU-IM.HS refers to the heat treatment vaccination groups (C,D). (A,C): DEGs are unique or shared among the two contrasts; (B,D): DEGs are up or down in the latter of each contrast.
3.3. GO Enrichment Analysis of Differentially Expressed Genes in the Spleen and Bursa of Fabricius
The GO enrichment analysis found that the differentially expressed genes in the spleen samples of Group A were enriched in the following biological processes: cellular protein complex assembly (4 genes, p < 0.05), platelet activation (3 genes, p < 0.05), and assembly of cellular macromolecule complexes (4 genes, p < 0.05) (Figure 3A). In Group B, enriched biological processes included the assembly of cellular protein complexes (4 genes, p < 0.05), platelet activation (3 genes, p < 0.05), and protein aggregation (3 genes, p < 0.05) (Figure 3B). Differentially expressed genes in the bursa of Fabricius samples of Group C were enriched in the following biological processes: cellular processes (2 genes, p < 0.05), multicellular processes (1 gene, p < 0.05), and responses to stimuli (2 genes, p < 0.05) (Figure 3C). In Group D, enrichment occurred in biological adhesion (1 gene, p < 0.05) and cellular processes (1 gene, p < 0.05) (Figure 3D).
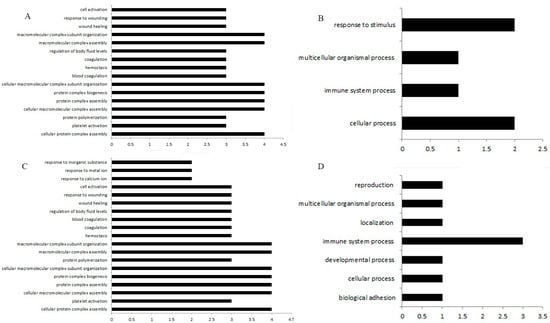
Figure 3.
The biological processes of DEGs enrichment in different treatments. (A) GO enrichment analysis of DEGs in spleen samples. (B) Enriched biological processes included the assembly of cellular protein complexes, platelet activation, etc. (C) GO enrichment analysis of DEGs in the bursa of Fabricius samples. (D) Enrichment occurred in adhesion and cellular processes.
3.4. Differentially Expressed Genes Associated with Immune Responses in the Spleen and Bursa of Fabricius
By analyzing the differentially expressed genes, we found that six differentially expressed genes (including IGSF11, ALDOB, and APOB) were associated with spleen immune response after immunization. Their upregulation is associated with enhanced immunity, suggesting that immunity raises disease resistance in chickens. Additionally, 15 differentially expressed genes (GZMA, DUSP1, and HSPA5) associated with immune response and heat stress were identified after 3 h of heat stimulation (Table 1). The upregulation of GZMA can enhance immunity, while the downregulation of DUSP1 and HSPA5 is associated with the decrease in immunity, indicating that the disease resistance of chickens is negatively affected by heat stress, and GZMA may play a negative feedback role in the decrease in immunity under stress conditions.

Table 1.
The DEGs are associated with immune responses in the spleen and bursa of Fabricius.
In the bursa of Fabricius, CD69 was the only immune-response-related gene identified after immunization. After 3 h of heat stimulation, three more differentially expressed genes (COL21A1, CD69, and HSP90AB1) associated with immune response were detected (Table 1). Contrasting to results from spleen samples, these data indicated that the bursa of Fabricius is insensitive to heat stress and the vaccine used.
3.5. KEGG Pathway Analysis of Differentially Expressed Genes in the Spleen and Bursa of Fabricius
The results of the KEGG pathway analysis showed that the 22 differentially expressed genes in Group A were significantly enriched in 8 pathways (p < 0.05), including complement and coagulation cascades, pentose phosphate pathway, and fat digestion and absorption (p < 0.05). In Group B, 35 genes were enriched in 7 pathways, such as glutathione metabolism, complement and coagulation cascades, and chemokine-signaling pathways (Table 2). We noted that the pathway of complement and coagulation cascades was found in both groups. These pathways involve proteins mediating immune and inflammatory responses. Thus, KEGG results suggested that the genes in Groups A and B are associated with immune responses. The 43 differentially expressed genes in Group C were not enriched in any pathway, whereas the 13 differentially expressed genes in Group D were significantly enriched in the following 2 pathways, synaptic vesicle cycle and protein digestion and absorption (Table 2). These results further emphasize that the bursa of Fabricius does not respond to heat stress or the selected vaccine.
Table 2.
The enriched KEGG pathway of DEGs.
3.6. Ingenuity Pathway Analysis (IPA) Network Formed by Differentially Expressed Genes in the Spleen and Bursa of Fabricius
The results of the IPA network analysis on Group A’s 22 differentially expressed genes demonstrated that they formed a significantly interactive gene network (Table 3), associated with cellular functions and maintenance, hematopoietic system development and function, as well as cell development. The 35 differentially expressed genes in Group B formed 2 significantly interactive gene networks (Table 3). The first was associated with neurological system development and function, cancer, as well as cardiovascular system development and function. The second was associated with cell motility, along with multiple immunity-related genes, including hematopoietic system development and functions, along with immune cell trafficking (Figure 4). In short, these networks in the spleen have a strong association with immune response. Group C’s 43 differentially expressed genes also formed two significantly interactive gene networks (Table 3). The first was associated with cell migration, along with cellular functions, maintenance, and behavior, whereas the second was associated with cell-to-cell signal transduction and interactions, digestive system development and function, as well as liver development and function. The 13 differentially expressed genes of Group D formed a single significantly interactive gene network (Table 3), associated with cell-to-cell signal transduction and interactions, as well as cell growth, proliferation, and migration. In line with data from our other analyses, these networks in the bursa of Fabricius have no strong association with immune response.
Table 3.
DEGs interaction network of IPA in four alignment groups.
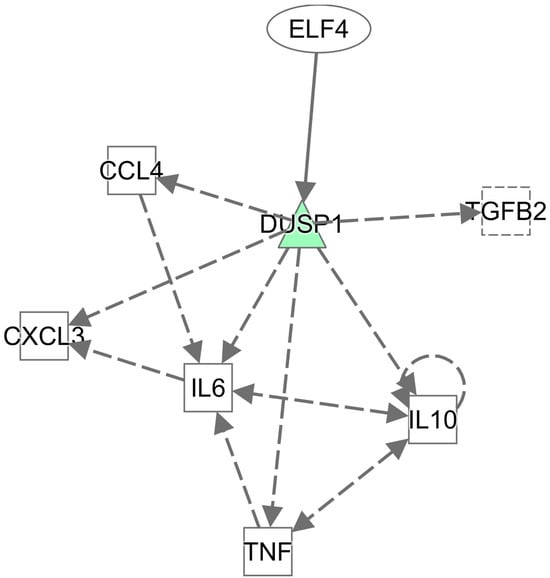
Figure 4.
IPA network of differential gene enrichment. The 35 differentially expressed genes in Group B formed significantly interactive gene networks. Colored in green are down-regulated in White Leghorn. Color intensity correlates with the size of the FC, in which the color is darker, and the variance is greater.
3.7. RT-qPCR Analysis of the Differentially Expressed Genes
To verify sequence accuracy, 20 differentially expressed genes were randomly selected from Groups A–D for RT-qPCR verification. The results indicated different fold changes (FC) from the sequencing data but consistent trends in differential expression (Table 4). Thus, the sequencing results appeared to be reliable.
Table 4.
RT-qPCR validation of DEGs.
The sequencing and RT-qPCR results all indicated that heat stress significantly decreased DUSP1 (sequencing: FC = 0.29, p < 0.01; RT-qPCR: FC = 0.45, p < 0.01) and HSPA5 (sequencing: FC = 0.52, p < 0.01; RT-qPCR: FC = 0.42, p < 0.01). Both KEGG and IPA analyses indicated that DUSP1 is involved in immune-related pathways, and many reports have shown that HSPA5 is associated with immune response. Thus, our subsequent experiments focused on verifying that DUSP1 and HSPA5 differential expression was associated with post-heat-stress immunity.
3.8. LPS Stimulates Immune Response in Chicken HD11 Cells
The results of the RT-qPCR showed that compared with the control group, mRNA levels of MHC-I and CD80 were very significantly or significantly increased at 4 h post-LPS stimulation. At 6 h post-stimulation, MHC-II, IL1B, IL6, TLR4, CD1C, CD80, and CD86 mRNA levels were very significantly or significantly increased (Figure 5A–H). Furthermore, MHC-II expression on HD11 cell surfaces significantly increased at 4 h after LPS stimulation (Figure 5).
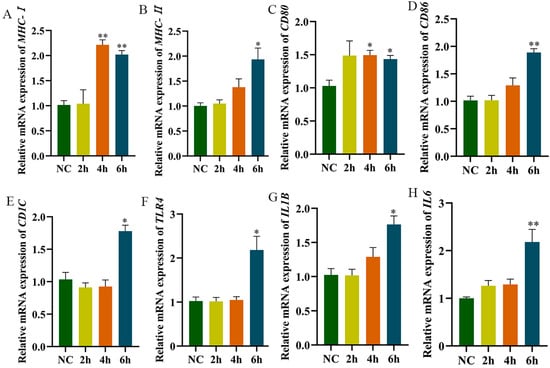
Figure 5.
The expression detection of related genes after LPS-stimulated HD11. (A–H): Cells were collected for RNA extraction after being stimulated for 2 h, 4 h, and 8 h using 1 μg/mL of LPS; RT-qPCR was used to detect the expression level of related genes. NC is the control group, 2 h, 4 h, and 6 h are the stimulation times by LPS. The NC group is without LPS stimulation. Data presented as mean ± SEM, *: p< 0.05; **: p < 0.01.
3.9. The Effect of DUSP1 on LPS Recognition in HD11
To ascertain the biological function of DUSP1, the pcDNA3.1-DUSP1 overexpressing vector was constructed (Figure 6A). Then, subsequent to the transduction of pcDNA3.1-DUSP1 into HD11 cells. RT-qPCR results showed that the mRNA expression of MHC-I, MHC-II, CD80, and CD86 did not significantly differ before and after DUSP1 overexpression (Figure 6B). The above results show that intracellular DUSP1 overexpression does not influence macrophage activation without actual LPS addition. We performed LPS stimulation after overexpression of DUSP1 in HD11 cells. The RT-qPCR results showed that TLR4 expression was significantly up-regulated at 2 h after LPS stimulation (Figure 6D). Moreover, a two-fold decrease in duration before TLR4 up-regulation occurred compared with LPS stimulation alone. We also found that MHC-II mRNA levels increased significantly at 4 h after LPS stimulation (Figure 6C), while mRNA levels of IL1B (Figure 6E), CD1C (glycolipid antigen-presenting molecule) (Figure 6F), CD80 (Figure 6G), and CD86 (Figure 6H) increased significantly at 2 h after LPS stimulation. This timing was earlier than under LPS stimulation only. Together, these data indicated that DUSP1 overexpression accelerates HD11 recognition of LPS and thus allows earlier LPS recognition, as compared with LPS stimulation alone.
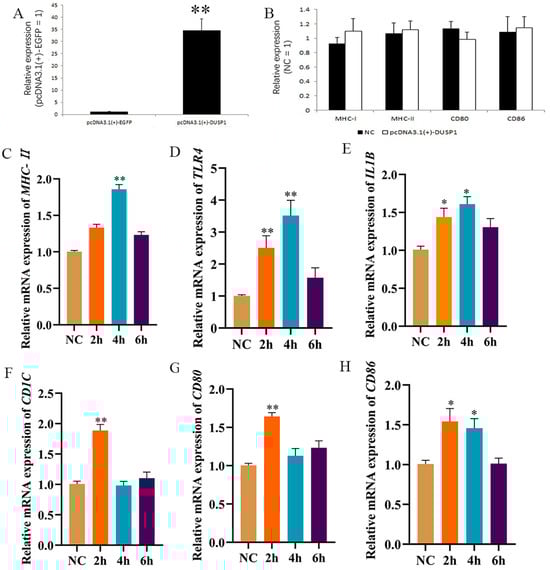
Figure 6.
DUSP1 overexpression accelerates HD11 recognition of LPS and thus allows earlier LPS presentation. (A) Verification of DUSP1 overexpression efficiency. (B) RT-qPCR was used to detect antigen-passing-related genes after overexpression of DUSP1. (C–H) Overexpression of DUSP1 was followed by 1 μg/mL LPS stimulation for different times, followed by RT-qPCR to detect the expression of MHC-II, TLR4, IL1B, CD1C, CD80, and CD86.The NC group was only stimulated with LPS.Data presented as mean ± SEM, *: p< 0.05; **: p < 0.01.
The DUSP1 interfering fragment 724 (DUSP1-724) was able to inhibit DUSP1 expression (Figure 7; Table A2). After treatment with DUSP1-724, HD11 cells were stimulated with LPS, and the results within 6 h showed that the levels of MHC-I (Figure 7B) and MHC-II (Figure 7C) mRNA remained largely unaltered in comparison to the levels observed in the LPS stimulation group. Thus, interfering with DUSP1 can inhibit MHC-I and MHC-II expression in LPS-stimulated HD11 cells. We also found that the CD80 (Figure 7D) and CD86 (Figure 7E) mRNA expression was inhibited within 6 h post-LPS stimulation, followed by a significant decrease also observed in the mRNA expression of CD1C mRNA expression (Figure 7F). In addition, we found that IL6 expression (Figure 7G) failed to change significantly within 6 h post-LPS stimulation, suggesting a decreased ability of HD11 cells to secrete cytokines upon interference with DUSP1 expression. In summary, our data suggested that HD11 recognition of LPS is affected by DUSP1 expression levels. Thus, interfering with DUSP1 inhibits the ability of HD11 recognition LPS, causing downstream effects in the expression of other immune-related genes.
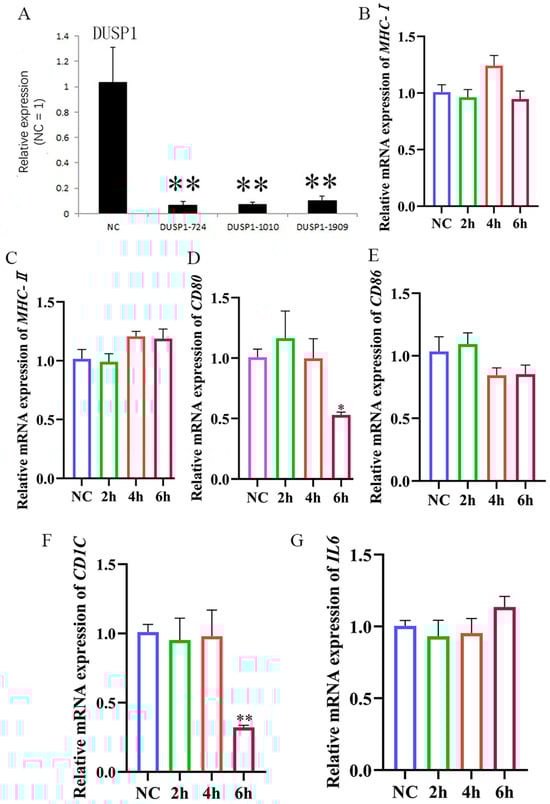
Figure 7.
HD11 presentation of LPS is affected by DUSP1 expression levels. (A) Interference effect of DUSP1 interference fragment. (B–G): After interfering with DUSP1, 1 μg/mL LPS stimulation was given at different times, followed by RT-qPCR to detect the expression of MHC-I, MHC-II, CD80, CD86, CD1C, and IL6.The NC group was only stimulated with LPS. Data presented as mean ± SEM, *: p< 0.05; **: p < 0.01.
3.10. Effect of HSPA5 on the Ability of HD11 to Recognize LPS
To ascertain the biological function of HSPA5, the pSDS-HSPA5 overexpressing vector was constructed (Figure 8A). We tested whether changes to intracellular HSPA5 expression can alter macrophage activation through the RT-qPCR. The mRNA expression level of intracellular MHC-I, MHC-II, CD80, and CD86 did not change significantly before and after HSPA5 overexpression (Figure 8B), indicating that without LPS addition, HSPA5 overexpression does not affect macrophage activation. LPS was added after overexpression. The mRNA levels of MHC-I, MHC-II, CD80, CD86, CD1C, IL1B, IL6, and TLR4 (Figure 8C–J) increased significantly at 2 h after LPS stimulation when HSPA5 was overexpressed. This increase occurred far earlier than the timing of MHC-II expression after LPS stimulation alone. Together, these data combine to demonstrate clearly that HSPA5 can facilitate and accelerate HD11′s LPS recognition.
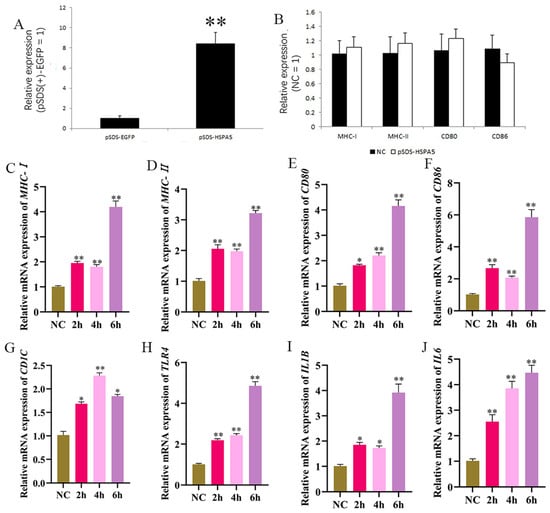
Figure 8.
HSPA5 overexpression accelerates HD11 recognition of LPS and thus allows earlier LPS presentation. (A) Verification of HSPA5 overexpression efficiency. (B) Detection of antigen passing-related genes after overexpression of HSPA5. (C–J) Overexpression of HSPA5 was followed by 1 μg/mL LPS stimulation for different times, followed by RT-qPCR to detect the expression of MHC-I, MHC-II, CD80, CD86, CD1C, TLR4, IL1B, and IL6.The NC group was only stimulated with LPS.Data presented as mean ± SEM, *: p< 0.05; **: p < 0.01.
Following the utilization of HSPA5-interfering fragment 183 (HSPA5-183) to impede HSPA5 expression (Figure 9A), HD11 cells were subjected to LPS stimulation. The results obtained at the six-hour mark demonstrated that the MHC-I (Figure 9B) and MHC-II (Figure 9C) mRNA levels did not change significantly when compared to those observed in the LPS stimulation group. Moreover, CD80 mRNA levels (Figure 9F) were also inhibited within 6 h after LPS stimulation, whereas CD1C mRNA levels (Figure 9D) decreased significantly at 2 h after LPS stimulation. Subsequently, it was observed that IL6 mRNA (Figure 9E) did not undergo a significant alteration within 6 h post-LPS stimulation, and a similar trend was noted for TLR4 mRNA (Figure 9G). In conclusion, the ability of HD11 to deliver LPS is subject to influence by HSPA5. Furthermore, it can be hypothesized that interference with HSPA5 inhibits LPS recognition through the inhibition of immune-related molecules (MHC and cytokines).
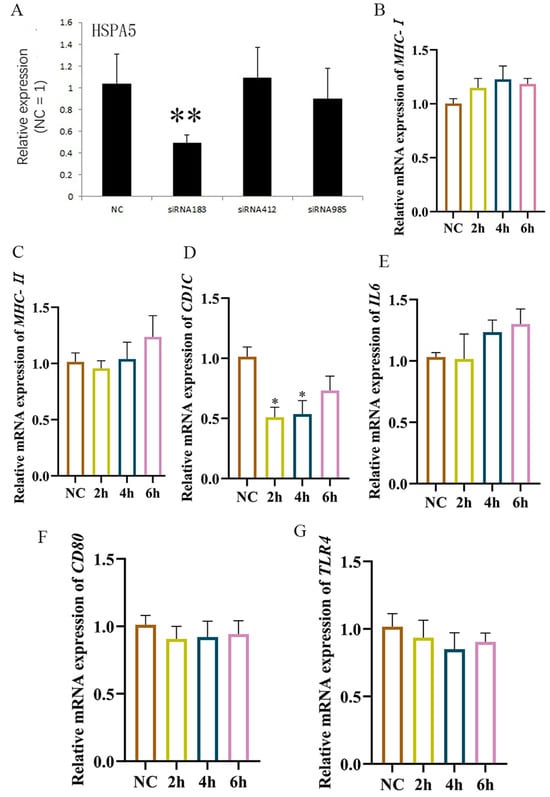
Figure 9.
HD11 presentation of LPS is affected by HSPA5 expression levels. (A) Interference effect of HSPA5 interference fragment; (B–G): After interfering with HSPA5, 1 μg/mL LPS stimulation was given at different times, followed by RT-qPCR to detect the expression of MHC-I, MHC-II, CD1C, IL6, CD80, and TLR4. Data presented as mean ± SEM, *: p< 0.05; **: p < 0.01.
4. Discussion
Acute heat stress has been demonstrated to result in some detrimental effects on poultry, including decreased feed intake, reduced meat and egg quality, and an elevated mortality rate. These phenomena are likely to cause considerable economic losses to the poultry industry [28,29,30,31,32]. Our findings suggest that the differential expression of genes in chickens subjected to heat stress likely reflects the immune response to such conditions. The majority of these biological processes are associated with immunity, implying that heat stress in the spleen can influence immune function. Notably, only a limited number of genes exhibited differential expression following heat treatment in the bursa of Fabricius, indicating that this organ may be less sensitive to high temperatures than the spleen. Corticosterone is a glucocorticoid hormone secreted by the adrenal cortex and is primarily involved in the body’s stress response. The study conducted by He et al. demonstrated that serum corticosterone levels in chickens increased significantly following exposure to heat stress, a finding that is consistent with the results of the present study [33].
Studies on the role of HSPA5 (also referred to as GRP78) in the immune system showed that GRP78 regulates inflammation and immune responses through multiple mechanisms [34,35], although such reports are predominantly in mammals. As a major endoplasmic reticulum chaperone molecule, GRP78 facilitates chemokine and cytokine processing and secretion in mammalian cells [36], as well as being a necessary binding partner for cell-surface MHC-I [37]. However, these studies are mostly in mammals, and there have been no studies in chickens. mRNA-seq analysis demonstrated that HSPA5 plays an important role in immune cell activation after examination of samples from birds under acute heat stress conditions
The majority of HSPA5 studies in chickens have employed single nucleotide polymorphism (SNP) loci and have focused on the protein’s role in apoptosis. For example, GRP78 is required for cell proliferation and apoptosis inhibition of embryonic fibroblasts [38], and BiP/GRP78 plays a key role in avian reovirus-mediated apoptosis [39]. However, a rare study examining GRP78 response to heat stress (35 °C) demonstrated that GRP78 mRNA levels in chicken heart, liver, brain, and leg muscles first increased (peaking at 3 h) and then decreased after, suggesting that the protein may function in avian immune response as well [40]. This study found that intracellular HSPA5 overexpression did not directly affect the differential expression of antigen-presenting genes but did accelerate and enhance LPS recognition by HD11. Interference with HSPA5 could inhibit LPS recognition by HD11 (inhibit MHC-II expression). Our work, combined with previous research on avian HSPA5 heat-stress response, suggests that chicken HSPA5 may play a role in immune cell activation.
In mammals, some studies have demonstrated that DUSP1 negatively regulates inflammatory cytokine production during the immune response [41]. DUSP1 expression, for example, inhibited p38 activation and GATA-3 nuclear translocation, thereby impairing T helper-2 (Th2) cells [42]. Furthermore, DUSP1 attenuates STAT1 activation through the inhibition of miR155 expression and the induction of SOCS-1 [43], as well as possibly being involved in MAP kinase-independent tumorigenesis [44]. Finally, in DUSP1-deficient mice, glucocorticoids induce DUSP1 expression to inhibit JNK and p38 activation. Therefore, DUSP1 apparently contributes to the anti-inflammatory effects of glucocorticoids [45,46]. However, none is available on its potential role in immune cell activation of chicken. Similarly to our results on HSPA5, we found that DUSP1 overexpression did not directly affect the differential expression of antigen-presenting genes but did accelerate LPS recognition by HD11, thus serving a key immune function. Interference with DUSP1 could inhibit LPS recognition by HD11. Although the exact mechanism of DUSP1’s role in antigen presentation remains to be investigated, our data strongly suggest that DUSP1 is important to immune response in chicken.
5. Conclusions
In this study, mRNA-seq was conducted on the spleen and bursae of experimental chickens, and it was observed that the expression of DUSP1 and HSPA5 in the spleen was significantly diminished in the heat stress group. The results of the cytological experiments demonstrated that the ability of HD11 to deliver LPS is subject to influence by DUSP1 and HSPA5. The inhibition of HSPA5 and DUSP1 could suppress the activation of immune cells in chicken immune organs under heat stress. This provides a foundation for further research into the impact of heat stress on immunity.
Author Contributions
Conceptualization, X.W. and X.C.; methodology, X.W., X.C. and W.Z.; software, J.W. and C.Y.; validation, Z.F., X.M. and M.L.; formal analysis, X.C. and W.Z.; investigation, X.W. and X.C.; resources, X.Z. and Q.L.; data curation, X.M. and M.L.; writing—original draft, X.W., X.C. and W.Z.; writing—review and editing, X.C. and C.F.; visualization, X.W., X.C. and W.Z.; supervision, C.F. and Q.L.; project administration, X.Z. and Q.L.; funding acquisition, C.F. and Q.L. All authors have read and agreed to the published version of the manuscript.
Funding
This work was supported by STI2030—Major Projects (2023ZD04064), and Science and Technology Program of Guangzhou City No. 2024B03J1353.
Institutional Review Board Statement
The animal experiment was approved by the Animal Health Professional Committee of South China Agricultural University.
Informed Consent Statement
Not applicable.
Data Availability Statement
The datasets that have been generated during this study are available for acquisition from the corresponding authors.
Conflicts of Interest
The authors declare that they have no conflicts of interest in the study.
Abbreviations
The following abbreviations are used in this manuscript:
| DEGs | differentially expressed genes |
| LPS | lipopolysaccharides |
| HSPs | heat shock proteins |
| APCs | antigen-presenting cells |
| NDV | Newcastle disease vaccine |
| HI | hemagglutination inhibition |
Appendix A
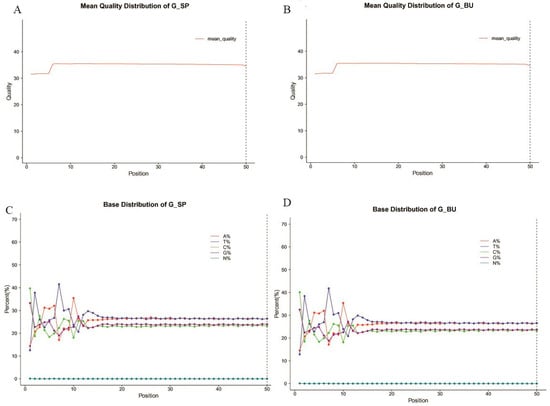
Figure A1.
Data quality of sequencing samples. (A,B) Base mass fraction of all samples sequenced reads. (C,D) Base composition of the sequenced sample.
Table A1.
The primer pairs information of the related genes.
Table A1.
The primer pairs information of the related genes.
| Gene Symbol | Primer Sequence (5′→3′) | Accession No. in NCBI | Product Size (bp) |
|---|---|---|---|
| DUSP1 | F: CTGTGCAGAGAGGCCCG | NM_001085359.1 | 186 |
| R: GTACAGAGGGGTACCGCAGG | |||
| GZMA | F: TGATCAAGCCAAGCTGGGTG | NM_204457.1 | 149 |
| R: GGGACAGTAGTCTGGGTAGC | |||
| CCL17 | F: CCACGATGCTCAGCACAAAG | NM_001293309.1 | 168 |
| R: GACAGTCGTGGGAAGTCTCAT | |||
| FGB | F: GTGGCCAAATTTTCTGACACCT | NM_001167683.1 | 195 |
| R: AAGGACCCTGAGGCTAGAGG | |||
| ALDOB | F: AGATCAGTAGCACAACGCCC | NM_001007977.2 | 101 |
| R: AATGGGCACCAAGCCATTCT | |||
| GGT1 | F: TGGGAAAGGCCTTGCATCAG | XM_015275453.1 | 173 |
| R: AGGCATCTGCTCCTTCATCG | |||
| HSPA5 | F: CCTGAGGGGGAGCGCCTGAT | NM_205491.1 | 111 |
| R: GGGGTCATTCCAGGTGCGGC | |||
| IGSF11 | F: ACGCAGCTATCAGACACTGG | XM_004938202.2 | 130 |
| R: CTTGGATTCTGCAAAGCGGG | |||
| MYL1 | F: GAACCCCACAAACGCTGAGA | NM_001044632.1 | 98 |
| R: GCATGGGCAGGAACTCTTCAA | |||
| SYT8 | F: GACTGAGGCTGGAAACAACAC | XM_015286685.1 | 73 |
| R: TAGCCTGGCCATTCCTCTGTG | |||
| AHSG | F: TTGCAGAACATGCAGTTGAGG | XM_422764.6 | 74 |
| R: AGCAAGTACTGAAAACTGTCCAT | |||
| ABCB1LB | F: GCAGAAGCAGCGAATAGCAA | NM_204894.2 | 153 |
| R: ACTACAACCGTGGTCCGTC | |||
| COL21A1 | F: ACTGCAACCACTGTCAGTCC | XM_004940463.1 | 168 |
| R: GCAATCCTCTTGTCCCACGA | |||
| CD69 | F: AGAACGCACACCTATGCAGG | XM_015300817.1 | 124 |
| R: CGCAACAACCTGGAATTGGG | |||
| TAC1 | F: ACGGCCAGATCTCTCACAAA | XM_418674.6 | 125 |
| R: TCATTTACGCCTTCGCTCGT | |||
| LECT2 | F: CACGTCGAGAACTGCGACCA | NM_205478.2 | 113 |
| R: TTCCCAGCACATACTACAGCC | |||
| MMP7 | F: GAGAGGGGCTAGGTGGAGAT | NM_001006278.1 | 132 |
| R: GGACATTTGAGTGGGCGAGT | |||
| CD80 | F: AAAGTACCTCCCAAGGCACG | NM_001079739.1 | 101 |
| R: ATTTACAGCTGTGGGGTGGG | |||
| CD86 | F: CCTTGGCCAGGAAAAACACG | NM_001037839.1 | 116 |
| R: ACTGCCCCTCATCCACAATC | |||
| CD1c | F: CGCGCGTTTTCCAGATCCACAC | NM_001017412.1 | 186 |
| R: CGGCCCGGAGGTCAGTGAGAGT | |||
| MHC-I | F: ACAAGTACCAGTGCCGCGTG | NM_001097530.1 | 197 |
| R: CGCGATGTTGTAGCCCTTCC | |||
| MHC-II | F: CCCTCGGCGTTCTTCTTCTAC | NM_001044679.1 | 128 |
| R: CCCACGTCGCTGTCGAA | |||
| IL6 | F: AACGTCGAGTCTCTGTGCTAC | NM_204628.1 | 171 |
| R: GAGGATGAGGTGCATGGTGAT | |||
| IL1B | F: GCTCTACATGTCGTGTGTGATGAG | NM_204524.2 | 80 |
| R: TGTCGATGTCCCGCATGA | |||
| TLR4 | F: AGTCTGAAATTGCTGAGCTCAAAT | NM_001030693.1 | 190 |
| R: GCGACGTTAAGCCATGGAAG | |||
| GAPDH | F: GAGGGTAGTGAAGGCTGCTG | NM_204305 | 113 |
| R: CATCAAAGGTGGAGGAATGG |
Table A2.
Interference fragment information of DUSP1 and HSPA5.
Table A2.
Interference fragment information of DUSP1 and HSPA5.
| Gene | Fragment | Sequence(5′–3′) |
|---|---|---|
| DUSP1 | DUSP1-724 | Sense: GCGAUUGACUUCAUAGAUUTT |
| Anti-sense: AAUCUAUGAAGUCAAUCGCTT | ||
| DUSP1-1010 | Sense: CCACCACAGUCUUUAACUUTT | |
| Anti-sense: AAGUUAAAGACUGUGGUGGTT | ||
| DUSP1-1909 | Sense: CCUCAUAGUUGACUAGAAATT | |
| Anti-sense: UUUCUAGUCAACUAUGAGGTT | ||
| HSPA5 | HSPA5-183 | Sense: GCGUGGAAAUCAUUGCCAATT |
| Anti-sense: UUGGCAAUGAUUUCCACGCTT | ||
| HSPA5-412 | Sense: GCCACAUAUUCAGGUCGAUTT | |
| Anti-sense: AUCGACCUGAAUAUGUGGCTT | ||
| HSPA5-985 | Sense: GGAUUUCUCUGAGACGCUUTT | |
| Anti-sense: AAGCGUCUCAGAGAAAUCCTT | ||
| GAPDH | NC | Sense: UUCUCCGAACGUGUCACGUTT |
| Anti-sense: ACGUGACACGUUCGGAGAATT |
References
- Deng, L.; Xu, H.; Liu, P.; Wu, S.; Shi, Y.; Lv, Y.; Chen, X. Prolonged exposure to high humidity and high temperature environment can aggravate influenza virus infection through intestinal flora and Nod/RIP2/NF-kappaB signaling pathway. Vet. Microbiol. 2020, 251, 108896. [Google Scholar] [CrossRef]
- Luo, X.; Zheng, C.; Xia, W.; Ruan, D.; Wang, S.; Cui, Y.; Yu, D.; Wu, Q.; Huang, D.; Zhang, Y.; et al. Effects of constant or intermittent high temperature on egg production, feed intake, and hypothalamic expression of antioxidant and pro-oxidant enzymes genes in laying ducks. J. Anim. Sci. 2018, 96, 5064–5074. [Google Scholar] [CrossRef]
- Mangan, M.; Siwek, M. Strategies to combat heat stress in poultry production-A review. J. Anim. Physiol. Anim. Nutr. 2024, 108, 576–595. [Google Scholar] [CrossRef] [PubMed]
- Nayak, N.; Bhanja, S.K.; Chakurkar, E.B.; Sahu, A.R.; Ashitha, K.; Shivasharanappa, N.; D’Mello, A.D. Impact of bioclimatic factors on physio-biochemical and molecular response of slow-growing poultry reared in tropics. Trop. Anim. Health Prod. 2023, 55, 253. [Google Scholar] [CrossRef] [PubMed]
- Kumar, M.; Ratwan, P.; Dahiya, S.P.; Nehra, A.K. Climate change and heat stress: Impact on production, reproduction and growth performance of poultry and its mitigation using genetic strategies. J. Therm. Biol. 2021, 97, 102867. [Google Scholar] [CrossRef] [PubMed]
- Xu, Y.; Lai, X.; Li, Z.; Zhang, X.; Luo, Q. Effect of chronic heat stress on some physiological and immunological parameters in different breed of broilers. Poult. Sci. 2018, 97, 4073–4082. [Google Scholar] [CrossRef]
- Nanto-Hara, F.; Yamazaki, M.; Murakami, H.; Ohtsu, H. Chronic heat stress induces renal fibrosis and mitochondrial dysfunction in laying hens. J. Anim. Sci. Biotechnol. 2023, 14, 81. [Google Scholar] [CrossRef]
- Liu, Y.L.; Ding, K.N.; Shen, X.L.; Liu, H.X.; Zhang, Y.A.; Liu, Y.Q.; He, Y.M.; Tang, L.P. Chronic heat stress promotes liver inflammation in broilers via enhancing NF-kappaB and NLRP3 signaling pathway. BMC Vet. Res. 2022, 18, 289. [Google Scholar] [CrossRef]
- Kahl, S.; Elsasser, T.H.; Rhoads, R.P.; Collier, R.J.; Baumgard, L.H. Environmental heat stress modulates thyroid status and its response to repeated endotoxin challenge in steers. Domest. Anim. Endocrinol. 2015, 52, 43–50. [Google Scholar] [CrossRef]
- Bastaki, N.K.; Albarjas, T.A.; Almoosa, F.A.; Al-Adsani, A.M. Chronic heat stress induces the expression of HSP genes in the retina of chickens (Gallus gallus). Front. Genet. 2023, 14, 1085590. [Google Scholar] [CrossRef]
- Xu, Y.; Li, Y.; Shi, F.; Zhang, S.; Zong, S.; Tao, J. Cloning and Molecular Characterization of Hsp Genes from Anoplophora glabripennis and Their Responses to Cold Stress. Int. J. Mol. Sci. 2022, 23, 11958. [Google Scholar] [CrossRef]
- Zhang, M.; Tan, H.; Gong, Y.; Faleti, O.D.; Li, D.; Yang, J.; Huang, J.; Long, J.; Luo, Q.; Wu, G.; et al. TRIM26 restricts Epstein-Barr virus infection in nasopharyngeal epithelial cells through K48-linked ubiquitination of HSP-90beta. FASEB J. 2024, 38, e23345. [Google Scholar] [CrossRef]
- Lian, P.; Braber, S.; Varasteh, S.; Wichers, H.J.; Folkerts, G. Hypoxia and heat stress affect epithelial integrity in a Caco-2/HT-29 co-culture. Sci. Rep. 2021, 11, 13186. [Google Scholar] [CrossRef]
- Vila-Casahonda, R.G.; Lozano-Aponte, J.; Guerrero-Beltran, C.E. HSP60-Derived Peptide as an LPS/TLR4 Modulator: An in silico Approach. Front. Cardiovasc. Med. 2022, 9, 731376. [Google Scholar] [CrossRef]
- Yan, Y.Q.; Zheng, R.; Liu, Y.; Ruan, Y.; Lin, Z.H.; Xue, N.J.; Chen, Y.; Zhang, B.R.; Pu, J.L. Parkin regulates microglial NLRP3 and represses neurodegeneration in Parkinson’s disease. Aging Cell 2023, 22, e13834. [Google Scholar] [CrossRef]
- Habich, C.; Kempe, K.; van der Zee, R.; Rumenapf, R.; Akiyama, H.; Kolb, H.; Burkart, V. Heat shock protein 60: Specific binding of lipopolysaccharide. J. Immunol. 2005, 174, 1298–1305. [Google Scholar] [CrossRef]
- Wang, Y.; Sedlacek, A.L.; Pawaria, S.; Xu, H.; Scott, M.J.; Binder, R.J. Cutting Edge: The Heat Shock Protein gp96 Activates Inflammasome-Signaling Platforms in APCs. J. Immunol. 2018, 201, 2209–2214. [Google Scholar] [CrossRef]
- Pileggi, G.S.; Clemencio, A.D.; Malardo, T.; Antonini, S.R.; Bonato, V.L.; Rios, W.M.; Silva, C.L. New strategy for testing efficacy of immunotherapeutic compounds for diabetes in vitro. BMC Biotechnol. 2016, 16, 40. [Google Scholar] [CrossRef]
- Basu, S.; Binder, R.J.; Suto, R.; Anderson, K.M.; Srivastava, P.K. Necrotic but not apoptotic cell death releases heat shock proteins, which deliver a partial maturation signal to dendritic cells and activate the NF-kappa B pathway. Int. Immunol. 2000, 12, 1539–1546. [Google Scholar] [CrossRef]
- Torigoe, T.; Tamura, Y.; Sato, N. Heat shock proteins and immunity: Application of hyperthermia for immunomodulation. Int. J. Hyperth. 2009, 25, 610–616. [Google Scholar] [CrossRef]
- Korkmaz, D.; Kum, S. Investigation of the antigen recognition and presentation capacity of pecteneal hyalocytes in the chicken (gallus gallus domesticus). Biotech. Histochem. 2016, 91, 212–219. [Google Scholar] [CrossRef] [PubMed]
- Slawinska, A.; Hsieh, J.C.; Schmidt, C.J.; Lamont, S.J. Heat Stress and Lipopolysaccharide Stimulation of Chicken Macrophage-Like Cell Line Activates Expression of Distinct Sets of Genes. PLoS ONE 2016, 11, e0164575. [Google Scholar] [CrossRef]
- Van Goor, A.; Slawinska, A.; Schmidt, C.J.; Lamont, S.J. Distinct functional responses to stressors of bone marrow derived dendritic cells from diverse inbred chicken lines. Dev. Comp. Immunol. 2016, 63, 96–110. [Google Scholar] [CrossRef]
- Ciraci, C.; Tuggle, C.K.; Wannemuehler, M.J.; Nettleton, D.; Lamont, S.J. Unique genome-wide transcriptome profiles of chicken macrophages exposed to Salmonella-derived endotoxin. BMC Genom. 2010, 11, 545. [Google Scholar] [CrossRef] [PubMed]
- Wang, C.; Li, X.; Zhang, C.; Wu, T.; Li, Y.; Cheng, X. A eukaryotic expression plasmid carrying chicken interleukin-18 enhances the response to newcastle disease virus vaccine. Clin. Vaccine Immunol. 2015, 22, 56–64. [Google Scholar] [CrossRef] [PubMed]
- Young, M.D.; Wakefield, M.J.; Smyth, G.K.; Oshlack, A. Gene ontology analysis for RNA-seq: Accounting for selection bias. Genome Biol. 2010, 11, R14. [Google Scholar] [CrossRef]
- Mao, X.; Cai, T.; Olyarchuk, J.G.; Wei, L. Automated genome annotation and pathway identification using the KEGG Orthology (KO) as a controlled vocabulary. Bioinformatics 2005, 21, 3787–3793. [Google Scholar] [CrossRef]
- Hosseinzadeh, S.; Hasanpur, K. Gene expression networks and functionally enriched pathways involved in the response of domestic chicken to acute heat stress. Front. Genet. 2023, 14, 1102136. [Google Scholar] [CrossRef]
- Hanafi, S.A.; Zulkifli, I.; Ramiah, S.K.; Chung, E.L.T.; Awad, E.A.; Sazili, A.Q. Prenatal thermal stress affects acute-phase proteins, heat shock protein 70, and circulating corticosterone in developing broiler embryos and neonates. J. Therm. Biol. 2022, 109, 103328. [Google Scholar] [CrossRef]
- Wang, S.H.; Cheng, C.Y.; Chen, C.J.; Chan, H.L.; Chen, H.H.; Tang, P.C.; Chen, C.F.; Lee, Y.P.; Huang, S.Y. Acute Heat Stress Changes Protein Expression in the Testes of a Broiler-Type Strain of Taiwan Country Chickens. Anim. Biotechnol. 2019, 30, 129–145. [Google Scholar] [CrossRef]
- Wu, Z.; Zhang, H.; Fang, C. Research on machine vision online monitoring system for egg production and quality in cage environment. Poult. Sci. 2025, 104, 104552. [Google Scholar] [CrossRef]
- Fang, C.; Zhuang, X.; Zheng, H.; Yang, J.; Zhang, T. The Posture Detection Method of Caged Chickens Based on Computer Vision. Animals 2024, 14, 3059. [Google Scholar] [CrossRef] [PubMed]
- He, X.; Lu, Z.; Ma, B.; Zhang, L.; Li, J.; Jiang, Y.; Zhou, G.; Gao, F. Chronic heat stress alters hypothalamus integrity, the serum indexes and attenuates expressions of hypothalamic appetite genes in broilers. J. Therm. Biol. 2019, 81, 110–117. [Google Scholar] [CrossRef] [PubMed]
- Amaresan, R.; Gopal, U. Cell surface GRP78: A potential mechanism of therapeutic resistant tumors. Cancer Cell Int. 2023, 23, 100. [Google Scholar] [CrossRef]
- Li, Z.; Li, Z. Glucose regulated protein 78: A critical link between tumor microenvironment and cancer hallmarks. Biochim. Biophys. Acta 2012, 1826, 13–22. [Google Scholar] [CrossRef] [PubMed]
- Hori, O.; Matsumoto, M.; Kuwabara, K.; Maeda, Y.; Ueda, H.; Ohtsuki, T.; Kinoshita, T.; Ogawa, S.; Stern, D.M.; Kamada, T. Exposure of astrocytes to hypoxia/reoxygenation enhances expression of glucose-regulated protein 78 facilitating astrocyte release of the neuroprotective cytokine interleukin 6. J. Neurochem. 1996, 66, 973–979. [Google Scholar] [CrossRef]
- Triantafilou, M.; Fradelizi, D.; Triantafilou, K. Major histocompatibility class one molecule associates with glucose regulated protein (GRP) 78 on the cell surface. Hum. Immunol. 2001, 62, 764–770. [Google Scholar] [CrossRef]
- Jeon, M.; Choi, H.; Lee, S.I.; Kim, J.S.; Park, M.; Kim, K.; Lee, S.; Byun, S.J. GRP78 is required for cell proliferation and protection from apoptosis in chicken embryo fibroblast cells. Poult. Sci. 2016, 95, 1129–1136. [Google Scholar] [CrossRef]
- Lin, P.Y.; Liu, H.J.; Chang, C.D.; Chen, Y.C.; Chang, C.I.; Shih, W.L. Avian reovirus S1133-induced apoptosis is associated with Bip/GRP79-mediated Bim translocation to the endoplasmic reticulum. Apoptosis 2015, 20, 481–490. [Google Scholar] [CrossRef]
- Kong, L.N.; Zhang, D.X.; Ji, C.L.; Zhang, X.Q.; Luo, Q.B. Association analysis between SNPs in the 5′-flanking region of the chicken GRP78 gene, thermotolerance parameters, and tissue mRNA expression. Genet. Mol. Res. 2015, 14, 6110–6123. [Google Scholar] [CrossRef]
- Zhao, Q.; Wang, X.; Nelin, L.D.; Yao, Y.; Matta, R.; Manson, M.E.; Baliga, R.S.; Meng, X.; Smith, C.V.; Bauer, J.A.; et al. MAP kinase phosphatase 1 controls innate immune responses and suppresses endotoxic shock. J. Exp. Med. 2006, 203, 131–140. [Google Scholar] [CrossRef] [PubMed]
- Maneechotesuwan, K.; Yao, X.; Ito, K.; Jazrawi, E.; Usmani, O.S.; Adcock, I.M.; Barnes, P.J. Suppression of GATA-3 nuclear import and phosphorylation: A novel mechanism of corticosteroid action in allergic disease. PLoS Med. 2009, 6, e1000076. [Google Scholar] [CrossRef] [PubMed]
- Wang, X.; Zhao, Q.; Matta, R.; Meng, X.; Liu, X.; Liu, C.G.; Nelin, L.D.; Liu, Y. Inducible nitric-oxide synthase expression is regulated by mitogen-activated protein kinase phosphatase-1. J. Biol. Chem. 2009, 284, 27123–27134. [Google Scholar] [CrossRef] [PubMed]
- Huang, C.Y.; Tan, T.H. DUSPs, to MAP kinases and beyond. Cell Biosci. 2012, 2, 24. [Google Scholar] [CrossRef]
- Hoppstadter, J.; Ammit, A.J. Role of Dual-Specificity Phosphatase 1 in Glucocorticoid-Driven Anti-inflammatory Responses. Front. Immunol. 2019, 10, 1446. [Google Scholar] [CrossRef]
- Liu, K.; Li, Z.; Li, L.; Heyward, S.; Wang, S.R.; He, L.; Wang, H. Mechanistic Understanding of Dexamethasone-Mediated Protection against Remdesivir-Induced Hepatotoxicity. Mol. Pharmacol. 2024, 106, 71–82. [Google Scholar] [CrossRef]
Disclaimer/Publisher’s Note: The statements, opinions and data contained in all publications are solely those of the individual author(s) and contributor(s) and not of MDPI and/or the editor(s). MDPI and/or the editor(s) disclaim responsibility for any injury to people or property resulting from any ideas, methods, instructions or products referred to in the content. |
© 2025 by the authors. Licensee MDPI, Basel, Switzerland. This article is an open access article distributed under the terms and conditions of the Creative Commons Attribution (CC BY) license (https://creativecommons.org/licenses/by/4.0/).