Communication

The Role of Energy-Dispersive X-Ray Fluorescence to Predict Mineral Content in Untreated Bovine Plasma

Department of Agronomy, Food, Natural Resources, Animals and Environment, University of Padova, Viale dell’Università 16, 35020 Legnaro, PD, Italy
*
Author to whom correspondence should be addressed.
Animals 2025, 15(8), 1133; https://doi.org/10.3390/ani15081133
Submission received: 13 March 2025 / Revised: 9 April 2025 / Accepted: 10 April 2025 / Published: 14 April 2025
(This article belongs to the Section Cattle)

Simple Summary

Minerals are essential for animal health but measuring their levels in blood with traditional methods is costly and time-consuming. While some studies have explored the use of energy-dispersive X-ray fluorescence in biological matrices, including plasma, none has assessed its applicability in untreated samples. This study evaluates the potential of energy-dispersive X-ray fluorescence to predict the concentrations of sodium, magnesium, phosphorus, chloride, potassium, calcium, selenium, and iron in unprocessed plasma samples.

Abstract

Minerals and trace elements are vital for numerous physiological processes in mammals. The current reference analysis for mineral determination in biological matrices is inductively coupled plasma mass spectrometry (ICP-MS). This analysis is costly, time-consuming, and destructive. While commercial kits are a viable alternative to ICP-MS due to the lower cost, their limit lies in the ability of determining only one mineral at a time. Energy-dispersive X-ray fluorescence (ED-XRF) has been proposed as a potential alternative for the rapid determination of mineral concentration in biological matrices. This study evaluated the accuracy of ED-XRF as an alternative to commercial diagnostic kits to predict the concentrations of sodium, magnesium, phosphorus, chloride, potassium, calcium, iron, and selenium in cattle plasma without sample pretreatment, potentially reducing the time of analysis compared to commercial kits and costs and labor compared to ICP-MS. Reference mineral concentrations were determined in 277 samples using in vitro diagnostics regulation-certified commercial diagnostic kits. The results indicated a moderate prediction accuracy only for potassium. For the other minerals, the prediction accuracy of ED-XRF was insufficient, which suggests that some degree of sample preparation is necessary to improve the determination of minerals in plasma.

1. Introduction

Inorganic elements, such as minerals and trace elements, play a crucial role in physiological processes in mammals, including cattle [1]. Maintaining a proper balance of these elements is essential, as both deficiencies and excesses lead to disorders affecting metabolic functions, immune response, and overall productivity [2]. Therefore, monitoring mineral levels allows for the early identification of imbalances, enabling timely dietary adjustments and supplementation strategies. There are several methods to assess the mineral concentration in whole blood and serum, such as inductively coupled plasma optical emission spectroscopy, inductively coupled plasma mass spectrometry (ICP-MS) [3], and commercial diagnostic kits based on ion-selective electrode analysis (ISE), colorimetry, and ultraviolet (UV) complexometry. Each of these approaches, however, has limitations. ICP-MS is time-consuming, costly, destructive, and requires sample preparation, such as matrix decomposition [4]. Similarly, ISE requires a specific electrode for each mineral, limiting the analysis to one mineral at a time. Colorimetric methods demand significant time for accurate processing [5]. As for UV complexometry, results’ interpretation can be challenging due to the overlap of absorption bands and the necessity for theoretical calculations [6].
In this context, there is significant interest in utilizing energy-dispersed X-ray fluorescence (ED-XRF) to detect mineral concentration as it requires little to no preparation and allows for the simultaneous analysis of multiple minerals and 10 to 15 samples per hour, depending on the matrix. Previous studies suggested that ED-XRF can be applied to various untreated matrices that are either solid or liquid, such as milk and cheese. Pozza et al. [7] reported a coefficient of determination (R2) of >0.65 for magnesium (Mg), phosphorus (P), potassium (K), and calcium (Ca) in non-lyophilized milk and skim milk powder. Visentin et al. [8] obtained R2 > 0.35 for P and K in non-lyophilized milk and > 0.40 for P, S, K, and Ca in cheese. For other minerals, the R2 was close to zero. To our knowledge, only a few studies have tested ED-XRF on serum or plasma, with a specific focus on humans. However, the protocols required sample preparation, such as lyophilization or dehydration, which are time-consuming [9,10,11,12]. Therefore, the present study aimed to evaluate whether ED-XRF can accurately predict the concentration of various minerals, including sodium (Na), Mg, P, chloride (Cl), K, Ca, iron (Fe), and selenium (Se), in bovine plasma without any sample pretreatment.

2. Materials and Methods

2.1. Plasma Samples

A total of 277 bovine plasma samples were obtained from previous studies [13,14]. Briefly, 231 samples were collected from Charolais young bulls during a feeding trial [14] and 46 samples from early-lactation dairy cows (days in milk < 38) [13]. The blood samples were taken from the external jugular vein in bulls and the medial caudal vein in cows, following the same standard protocol and using 9 mL Vacuette® LH—lithium heparin—blood collection tubes (Greiner Bio-One GmbH, Kremsmünster, Austria). The tubes were then placed into a box refrigerated at +4 °C until the end of the sampling session. The blood tubes were centrifuged at 1500× g for 15 min at 4 °C within 2 h of collection. The plasma was then aliquoted and stored at −80 °C until analysis. An aliquot of each plasma sample was transported to two laboratories: the Istituto Zooprofilattico Sperimentale delle Venezie (Legnaro, Italy) and EcamRicert (Malo, Italy). The determination of Na, Mg, P, Cl, K, Ca (mmol/L), and Fe (µg/L) was conducted at the Istituto Zooprofilattico Sperimentale delle Venezie using in vitro diagnostics regulation (IVDR) certified commercial diagnostic kits (Roche Diagnostics, Basilea, Switzerland). The kits, which served as reference methods for all mineral elements except Se, employed ISE for the measurement of Na, Cl, and K, colorimetric techniques for Mg, Ca, and Fe, and UV complexometric methods for P. The performance of the kits is reported in Table 1.
With regard to Se (µg/dL), this was determined at EcamRicert using ICP-MS. Fe and Se were measured only in bull plasma [14] because the trial on dairy cows did not include the collection of information on these minerals [13]. A total of 3 samples had values below the limit of detection for Fe and 57 samples for Se. The mineral element concentrations were transformed to mg/kg. For Na, Mg, P, Cl, K, and Ca, the transformation was conducted using the molecular weight (g/mol) of the individual mineral (Na = 22.99, Mg = 24.31, P = 30.97, Cl = 35.35, K = 39.10, and Ca = 40.08), and the specific weight of the plasma was assumed to be equivalent to that of water. Regarding Fe and Se, the values were converted dividing by 0.001 and 0.01, respectively. Overall, the minerals in the plasma (mg/kg) were normally distributed (Figure 1).

2.2. ED-XRF Analysis

An aliquot of untreated plasma samples (i.e., samples which did not undergo any further preparation after the centrifugation) was analyzed in the laboratory of the Department of Agronomy, Food, Natural resources, Animals and Environment of the University of Padova (Legnaro, Italy) using Spectro Xepos 5P ED-XRF (Ametek, Kleve, Germany) equipped with an X-ray tube anode of Lead and Cobalt (65–35), 50 Kev voltage, and 2 mA current. Mineral quantification was based on Na k-α (1.04 Kev), Mg k-α (1.25 Kev), P k-α (2.01 Kev), Cl k-α (2.82 Kev), K k-α (3.31 Kev), Ca k-α (3.69 Kev), Fe k-α (6.40 Kev), and Se k-α (11.22 Kev). The potential for signal overlap was addressed through the method of influence coefficients [15]. This was implemented and applied through the ED-XRF software (v. 3.9.3) as a correction factor for matrix effects and their quantification. Before spectral acquisition, the instrument was calibrated according to the manufacturer’s instructions. Each sample was placed in ED-XRF plastic cups (32 mm diameter and 24 mm height; Ametek, Kleve, Germany) and before the beginning of the analysis, matrix type and weight were provided to the instrument to enhance the precision of the ED-XRF, which depends on the weight and texture of the material that the X-rays must traverse. The chamber of the ED-XRF instrument was filled with helium to reduce the attenuation of low-energy X-rays. Helium, being less dense than air, minimized scattering and absorption, particularly for lighter minerals, thereby improving the detection sensitivity for these mineral elements. The instrument required 4 min to analyze each sample. The resulting spectra for each sample are depicted in Figure 2.

2.3. Statistical Analysis

The energy-dispersive X-ray fluorescence software (v. 3.9.3) reported raw data as energy (Kev) versus normalized impulse (counts per second) and converted normalized impulses to the predicted concentration of the ith element (Na, Mg, P, Cl, K, Ca, Fe, Se) using the following formula, based on fundamental parameters’ quantification:
C i = K 0 + K 1 * I i * μ
where Ci is the predicted concentration of the ith element; K0 is the offset of the calibration; K1 is the slope of the calibration; Ii is the fluorescence intensity of the ith element; and µ is the mass attenuation coefficient, calculated as the sum of individual influences between the ith element and other interfering elements. The ED-XRF calibration was performed on the entire dataset as a regression between the concentrations of the ith mineral element (mg/kg) measured by the commercial diagnostic kits (Na, Mg, P, Cl, K, Ca, Fe) or ICP-MS (Se) as reference against the predicted value (mg/kg) from the ED-XRF, using the fundamental parameters’ formula, as previously described. The same regression was iterated for each mineral element included in this study, leading to the development of 8 calibration equations. Before final calibration, the dataset was checked for outliers. For this purpose, the difference between the reference value from commercial diagnostic kits (Na, Mg, P, Cl, K, Ca, Fe) or ICP-MS (Se) and the predicted value from ED-XRF was calculated [16,17], and values deviating more than 3 standard deviations from the respective mean (6 outliers for Na, 2 for Mg, 6 for P, 9 for Cl, 6 for K, 5 for Ca, 3 for Fe, and 2 for Se) were discarded. Following the removal of the outliers, each regression equation was recalculated. The agreement between reference and predicted values was evaluated through R2.

3. Results and Discussion

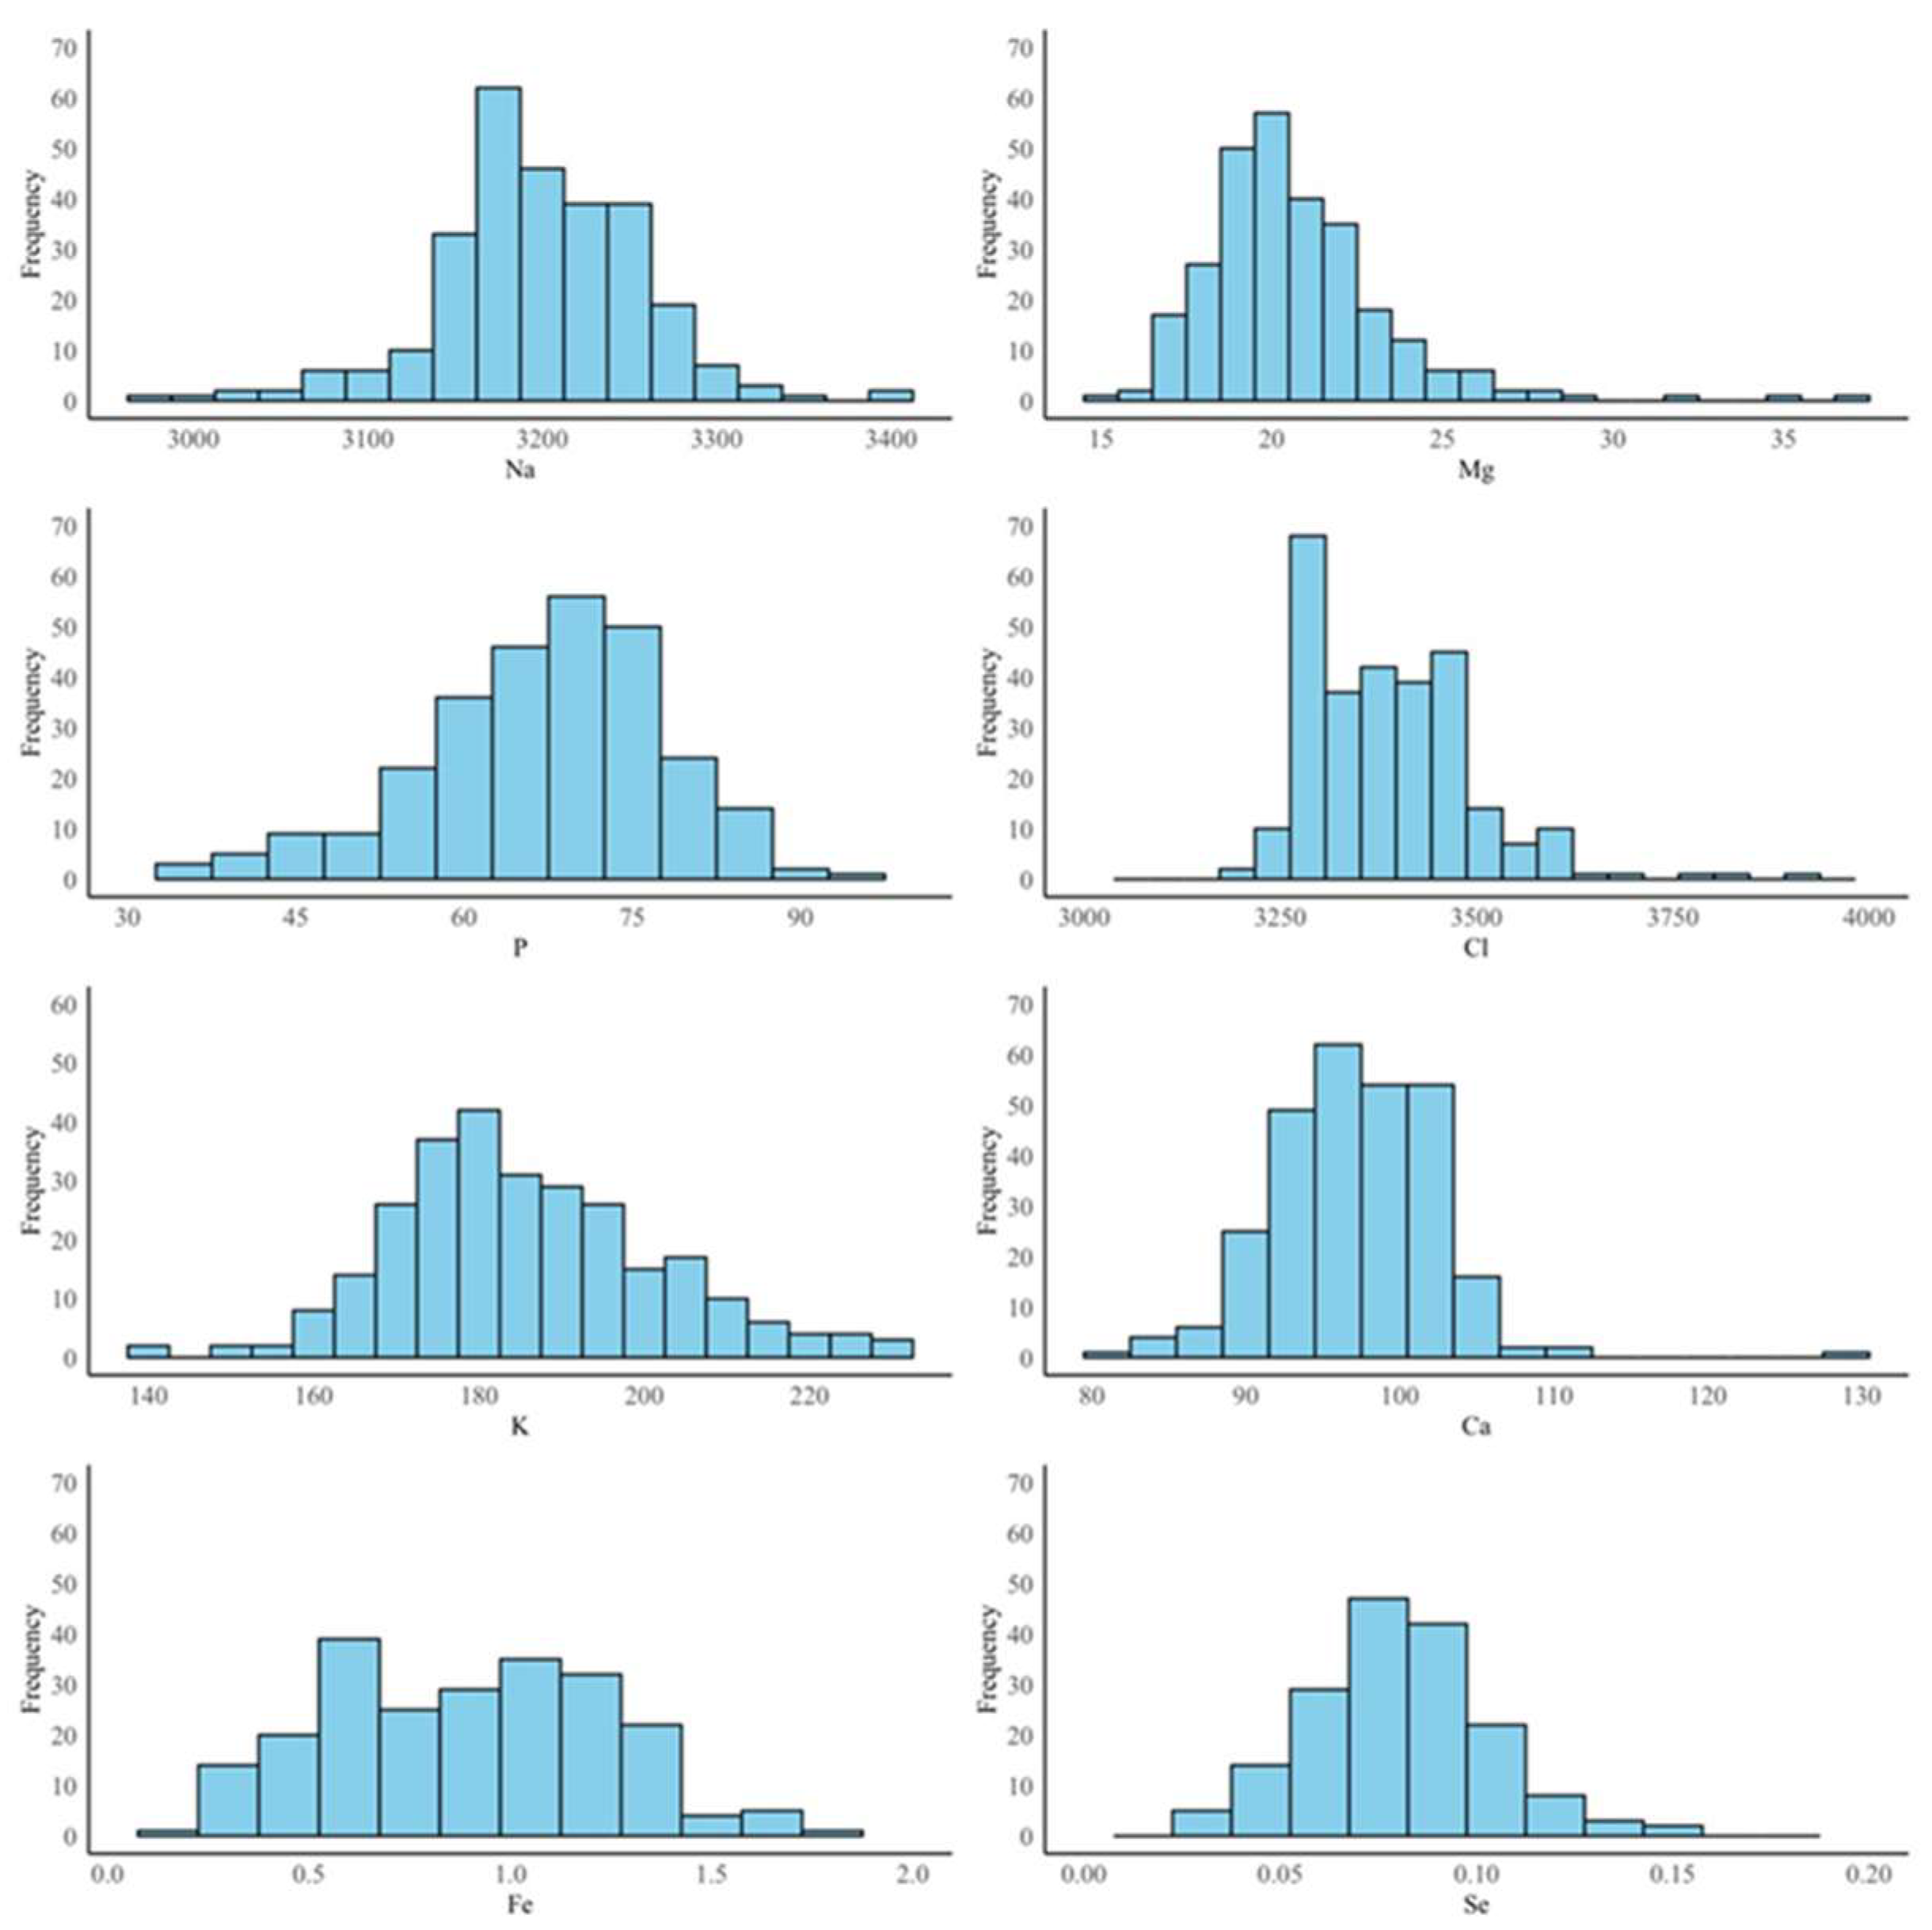
3.1. Descriptive Statistics

Descriptive statistics of the minerals determined through reference analyses are reported in Table 2. Cl and Na were the most abundant in bovine plasma, with average concentrations of 3390.21 and 3195.36 mg/kg, respectively. On the other hand, Fe and Se were the least abundant, with average concentrations of 0.90 and 0.09 mg/kg, respectively. The average concentrations of other minerals were 185.76 mg/kg for K, 97.05 mg/kg for Ca, 66.93 mg/kg for P, and 20.71 mg/kg for Mg. The concentrations of Na, Mg, P, Cl, K, and Ca were in line with those reported by McAdam and O’Dell [18], who investigated these minerals in the plasma of 20 lactating Holsteins. Luna et al. [19] conducted a study on 20 Holstein cows of parity 2 to 3 and from 60 to 90 days in milk, reporting slightly lower mean concentrations of Mg (36.00 mg/kg) and Ca (108 mg/kg) and an approximately four times greater mean concentration of P (255.00 mg/kg) compared to the present study. Herdt et al. [20] reported similar concentrations of Mg and Ca in a sample of 121 herds compared to our study. Conversely, the concentrations of Fe and Se in the present study were slightly lower than those reported by Herdt and Hoff [21] and Mehdi and Dufrasne [22]. In particular, Herdt and Hoff [21] found Fe and Se concentrations which ranged from 1.10 to 2.50 ug/mL (equivalent to mg/kg) and 65.00 to 140.00 ng/mL (i.e., 0.065 to 0.14 mg/kg), respectively, in 1585 adult cattle distributed across 165 herds. A similar range for Se (0.08 to 0.16 mg/kg) was reported in cattle in a review of Mehdi and Dufrasne [22].

3.2. Comparison Between Reference Methods and ED-XRF

After removal of the outliers, the comparison between the reference values from diagnostic kits (Na, Mg, P, Cl, K, Ca, and Fe) or ICP-MS (Se) and the predicted values from ED-XRF highlighted a moderate accuracy for K (R2 = 0.64), followed by Cl (R2 = 0.21). The other minerals had very low R2 (<0.10), which indicates the absence of a relationship between the reference and the predicted values. For clarity and relevance, only scatter plots of measured versus predicted concentrations of K and Cl and the respective calibration equations are displayed in Figure 3. The ability of ED-XRF to predict K better than the other minerals could be attributed to its relatively large molecular weight and its sufficiently high concentration in plasma. On the other hand, Cl had the greatest mean concentration among the minerals and presented a molecular weight similar to that of K. The low correlation between the reference and predicted values could have been due to Cl being more susceptible to interferences in the matrix, such as water.
Custódio et al. [12] demonstrated that ED-XRF is a reliable technique to determine K, Ca, Fe, Cu, Zn, Se, Br, Rb, and Pb in blood samples that have been lyophilized and pressed into pellets. Lyophilization reduces the water content and thus decreases the background noise from water, while compressing the sample into pellets minimizes matrix attenuation. This process allows X-rays to penetrate the full sample thickness, enhancing the accuracy and consistency of the fluoresced X-ray measurements by reducing bias caused by sample variability [23]. The predictions of Custódio et al. [12] were consistent with the values obtained from certified reference materials, falling within the established confidence intervals. The comparison of our findings with those of Pozza et al. [7] and Visentin et al. [8] highlighted that plasma analysis may exhibit heightened susceptibility to interferences, including background noise from water content, which can adversely affect the accuracy of results. Pozza et al. [7], who used the same experimental setup as the present study, reported R2 of 0.65 for Mg, 0.95 for P, 0.99 for S, 0.80 for K, and 0.98 for Ca in skim milk and whey powders during external validation. Visentin et al. [8], who adopted the same ED-XRF instrument but using the Lucas–Tooth algorithm instead of the fundamental parameter approach, obtained R2 of 0.39 for Ca in non-lyophilized milk and 0.60 in cheese. Notably, in the studies of Pozza et al. [7] and Visentin et al. [8], K was among the best predicted minerals, reflecting its less susceptibility to interferences than other minerals.
Minerals with a relatively low molecular weight, such as Na, Mg, and P, tended to have lower excitation energies, which made them more prone to interference in the spectral region, as depicted in Figure 2. In contrast, minerals with greater molecular weight such as Fe had greater excitation energies, which typically resulted in a more distinct peak in the spectrum (Figure 2). However, the poor performance observed for Fe in this study could be attributed to its low concentration in the plasma, which was close to the detection limit of the instrument. The limit of detection could also explain the inability of the instrument to quantify Se, which was the lowest concentrated mineral in plasma. Despite being the heaviest mineral, it had high background noise, similarly to lighter minerals. The poor prediction of Cl, K, and Ca may have resulted from various interferences within the matrix. These interferences could have arisen from overlapping spectral lines, matrix effects, or other minerals present in the sample that affected the accuracy of detection and quantification. In addition, other compounds in the matrix, such as proteins, could have interfered and contributed to reduce the signal-to-noise ratio. Another potential cause for the poor prediction accuracy could be attributed to the utilization of commercial diagnostic kits, which, despite being IVDR-certified, do not represent the gold standard for mineral analysis in blood samples.

4. Conclusions

ED-XRF failed to provide accurate predictions for the minerals considered in this study, except for a moderate capability in predicting K. When applied to untreated samples, ED-XRF is not an adequate method for the comprehensive mineral analysis of cattle plasma. Future research should focus on optimizing sample preparation techniques such as dehydration, which can concentrate mineral content and reduce matrix effects, or pelletization, which enhances sample uniformity and minimizes surface irregularities, thereby improving measurement accuracy. Additionally, further comparative studies with other matrices are recommended to explore the full potential and limitations of ED-XRF for mineral analysis in biological samples.

Author Contributions

Conceptualization, M.D.M.; data curation, D.M. and S.M.; formal analysis, D.M. and S.M.; funding acquisition, M.D.M.; investigation, M.D.M.; methodology, D.M. and M.P. (Marta Pozza).; project administration, M.P. (Mauro Penasa) and M.D.M.; resources, M.D.M.; software, D.M. and M.P. (Marta Pozza); supervision, S.M., M.P. (Mauro Penasa) and M.D.M.; validation, S.M. and D.M.; visualization, S.M., M.P. (Mauro Penasa) and M.D.M.; writing—original draft, D.M. and S.M.; writing—review and editing, M.P. (Mauro Penasa), M.P. (Marta Pozza) and M.D.M. All authors have read and agreed to the published version of the manuscript.

Funding

This study was carried out within the Agritech National Research Center and received funding from the European Union Next-GenerationEU (PIANO NAZIONALE DI RIPRESA E RESILIENZA (PNRR)—MISSIONE 4 COMPONENTE 2, INVESTIMENTO 1.4—D.D. 1032 17/06/2022, CN00000022). This manuscript reflects only the authors’ views and opinions, neither the European Union nor the European Commission can be considered responsible for them.

Institutional Review Board Statement

The experimental procedures that involved the Charolais young bulls and dairy cows were approved by the Animal Care and Use Committee of the University of Padova (Ethical Approval Codes n. 400074 5/2021 and n. 333175 57/2018, respectively). All the procedures were in accordance with the EU directive 2010/63/EU on the protection of animals used for scientific purposes.

Informed Consent Statement

Not applicable.

Data Availability Statement

None of the data were deposited in an official repository. The data that support this study are available from the corresponding author upon reasonable request.

Acknowledgments

Support from the ‘Ketogen’ project of the Breeders Association of Veneto Region (ARAV, Vicenza, Italy) and from Lallemand SAS (Blagnac, France) is gratefully acknowledged. The authors gratefully acknowledge the support of the University of Padova (Legnaro, Italy) through project BIRD233300/2023—“Implementazione della tecnologia a raggi X per lo studio della composizione minerale in matrici di origine animale”. The authors would like to thank Alberto Guerra, Elena Chiarin, and Matteo Santinello (University of Padova, Italy) for their technical support during sample collection.

Conflicts of Interest

The authors declare no conflict of interest. The mention of trade names or commercial products in this article is solely for the purpose of providing specific information and does not imply recommendation or endorsement by the University of Padova.

Abbreviations

The following abbreviations are used in this manuscript:
ICP-MSInductively Coupled Plasma Mass Spectrometry
ED-XRFEnergy-Dispersed X-ray Fluorescence
NaSodium
MgMagnesium
PPhosphorus
SSulfur
ClChloride
KPotassium
CaCalcium
FeIron
SeSelenium
ISEIon-Selective Electrode
UVUltraviolet
R2Coefficient of Determination
IVDRIn Vitro Diagnostics Regulation
CVCoefficient of Variation

References

  1. Galyean, M.L.; Perino, L.J.; Duff, G.C. Interaction of Cattle Health/Immunity and Nutrition. J. Anim. Sci. 1999, 77, 1120–1134. [Google Scholar] [CrossRef] [PubMed]
  2. Sherwood, L.; Klandorf, H.; Yancey, P. Animal Physiology: From Genes to Organisms; Cengage Learning: Singapore, 2012; ISBN 978-1-133-70951-0. [Google Scholar]
  3. Harrington, J.M.; Young, D.J.; Essader, A.S.; Sumner, S.J.; Levine, K.E. Analysis of Human Serum and Whole Blood for Mineral Content by ICP-MS and ICP-OES: Development of a Mineralomics Method. Biol. Trace Elem. Res. 2014, 160, 132–142. [Google Scholar] [CrossRef] [PubMed]
  4. Rawat, K.; Sharma, N.; Singh, V.K. X-Ray Fluorescence and Comparison with Other Analytical Methods (AAS, ICP-AES, LA-ICP-MS, IC, LIBS, SEM-EDS, and XRD). In X-Ray Fluorescence in Biological Sciences; John Wiley & Sons, Ltd.: Hoboken, NJ, USA, 2022; pp. 1–20. ISBN 978-1-119-64571-9. [Google Scholar]
  5. Nielsen, S.; Ismail, P. Traditional Methods for MIneral Analysis. In Nielsen’s Food Analysis; Food science text series; Springer Nature: Berlin/Heidelberg, Germany, 2024; pp. 350–351. ISBN 978-3-031-50642-0. [Google Scholar]
  6. Vogt, C.; Wondergem, C.S.; Weckhuysen, B.M. Ultraviolet-Visible (UV-Vis) Spectroscopy. In Springer Handbook of Advanced Catalyst Characterization; Springer: Berlin/Heidelberg, Germany, 2023; pp. 237–264. [Google Scholar]
  7. Pozza, M.; De Marchi, M.; Visentin, E.; Niero, G. Effectiveness of Energy Dispersive X-Ray Fluorescence for the Quantification of Mineral Elements in Skim Milk and Whey Powders. J. Dairy Sci. 2024, 107, 10352–10360. [Google Scholar] [CrossRef] [PubMed]
  8. Visentin, E.; Niero, G.; Cassandro, M.; Penasa, M.; De Marchi, M. Assessment of the ED-XRF Technique to Quantify Mineral Elements in Nonlyophilised Milk and Cheese. Int. J. Dairy Technol. 2023, 76, 102–110. [Google Scholar] [CrossRef]
  9. Rastegar, F.; Maier, E.A.; Heimburger, R.; Christophe, C.; Ruch, C.; Leroy, M.J. Simultaneous Determination of Trace Elements in Serum by Energy-Dispersive X-Ray Fluorescence Spectrometry. Clin. Chem. 1984, 30, 1300–1303. [Google Scholar] [CrossRef] [PubMed]
  10. Rautray, T.R.; Vijayan, V.; Hota, P.K. Elemental Analysis of Blood in Oral Cancer. Int. J. PIXE 2002, 12, 41–46. [Google Scholar] [CrossRef]
  11. Viksna, A.; Selin Lindgren, E.; Kjellmer, I.; Bursa, J. Analysis of Whole Blood and Placenta—A Case Study of Mothers and Their Babies. J. Trace Microprobe Tech. 2002, 20, 553–564. [Google Scholar] [CrossRef]
  12. Custódio, P.J.; Carvalho, M.L.; Nunes, F.; Pedroso, S.; Campos, A. Direct Analysis of Human Blood (Mothers and Newborns) by Energy Dispersive X-Ray Fluorescence. J. Trace Elem. Med. Biol. 2005, 19, 151–158. [Google Scholar] [CrossRef] [PubMed]
  13. Magro, S.; Costa, A.; Cavallini, D.; Chiarin, E.; De Marchi, M. Phenotypic Variation of Dairy Cows’ Hematic Metabolites and Feasibility of Non-Invasive Monitoring of the Metabolic Status in the Transition Period. Front. Vet. Sci. 2024, 11, 1437352. [Google Scholar] [CrossRef] [PubMed]
  14. Santinello, M.; Lora, I.; Villot, C.; Cozzi, G.; Penasa, M.; Chevaux, E.; Martin, B.; Guerra, A.; Righi, F.; De Marchi, M. Metabolic Profile of Charolais Young Bulls Transported over Long-Distance. Prev. Vet. Med. 2024, 231, 106296. [Google Scholar] [CrossRef] [PubMed]
  15. Rousseau, R.M. Corrections for Matrix Effects in X-Ray Fluorescence Analysis—A Tutorial. Spectrochim. Acta Part B At. Spectrosc. 2006, 61, 759–777. [Google Scholar] [CrossRef]
  16. Benedet, A.; Franzoi, M.; Penasa, M.; Pellattiero, E.; De Marchi, M. Prediction of Blood Metabolites from Milk Mid-Infrared Spectra in Early-Lactation Cows. J. Dairy Sci. 2019, 102, 11298–11307. [Google Scholar] [CrossRef] [PubMed]
  17. Goi, A.; Costa, A.; Visentin, G.; De Marchi, M. Mid-Infrared Spectroscopy for Large-Scale Phenotyping of Bovine Colostrum Gross Composition and Immunoglobulin Concentration. J. Dairy Sci. 2023, 106, 6388–6401. [Google Scholar] [CrossRef] [PubMed]
  18. McAdam, P.A.; O’Dell, G.D. Mineral Profile of Blood Plasma of Lactating Dairy Cows1. J. Dairy Sci. 1982, 65, 1219–1226. [Google Scholar] [CrossRef] [PubMed]
  19. Luna, D.; López-Alonso, M.; Cedeño, Y.; Rigueira, L.; Pereira, V.; Miranda, M. Determination of Essential and Toxic Elements in Cattle Blood: Serum vs. Plasma. Animals 2019, 9, 465. [Google Scholar] [CrossRef] [PubMed]
  20. Herdt, T.H.; Rumbeiha, W.; Braselton, W.E. The Use of Blood Analyses to Evaluate Mineral Status in Livestock. Vet. Clin. N. Am. Food Anim. Pract. 2000, 16, 423–444. [Google Scholar] [CrossRef] [PubMed]
  21. Herdt, T.H.; Hoff, B. The Use of Blood Analysis to Evaluate Trace Mineral Status in Ruminant Livestock. Vet. Clin. Food Anim. Pract. 2011, 27, 255–283. [Google Scholar] [CrossRef] [PubMed]
  22. Mehdi, Y.; Dufrasne, I. Selenium in Cattle: A Review. Molecules 2016, 21, 545. [Google Scholar] [CrossRef] [PubMed]
  23. Byers, H.L.; McHenry, L.J.; Grundl, T.J. XRF Techniques to Quantify Heavy Metals in Vegetables at Low Detection Limits. Food Chem. X 2019, 1, 100001. [Google Scholar] [CrossRef]
Figure 1. Distribution of minerals in bovine plasma (mg/kg) determined through commercial diagnostic kits for sodium (Na), magnesium (Mg), phosphorus (P), chloride (Cl), potassium (K), calcium (Ca) (n = 277), and iron (Fe) (n = 228), and inductively coupled plasma optical emission spectroscopy for selenium (Se) (n = 174).
Animals 15 01133 g001
Figure 2. X-ray fluorescence spectrum of untreated bovine plasma samples (n = 277, except for Fe with n = 228 and Se with n = 174) and excitation energies associated with mineral elements.
Animals 15 01133 g002
Figure 3. Plot of measured (through commercial diagnostic kits) versus predicted (through energy-dispersive X-ray fluorescence) concentration (mg/kg) of minerals (chloride, Cl, and potassium, K) with coefficient of determination (R2) > 0.10.
Animals 15 01133 g003
Table 1. Analytical techniques 1 used in the assay kits for the measurement of minerals, along with their sensitivity and intra-assay/inter-assay coefficient of variation (CV).
Mineral 2Analytical TechniqueSensitivity (mmol/L)Intra-Assay CV (%)Inter-Assay CV (%)
NaISE800.30.5
MgColorimetric (xylidine Blue)0.11.11.3
PUV Complexometric (phosphomolybdate without reduction)0.10.71.4
KISE1.50.50.7
ClISE600.30.6
CaColorimetric (o-Cresolphthalein)0.21.01.6
FeColorimetric (ferrozine without deproteinization)0.91.31.8
1 ISE = ion-selective electrode; UV = ultraviolet. 2 Na = sodium; Mg = magnesium; P = phosphorus; K = potassium; Cl = chloride; Ca = calcium; and Fe = iron.
Table 2. Descriptive statistics 1 of reference values for minerals concentration (mg/kg) in plasma determined by commercial diagnostic kits for Na, Mg, P, Cl, K, Ca, and Fe, and inductively coupled plasma mass spectrometry for Se, alongside fitting statistics of the prediction models 2.
Mineral 3ReferenceReference vs.
ED-XRF 4
MeanSDCV, %RangeR2SE
Na3195.3656.061.752965.71–3402.710.0156.33
Mg20.712.7113.0915.07–37.190.002.72
P66.9311.6117.3532.21–93.530.0110.75
Cl3390.21102.723.033203.85–3934.950.2183.97
K185.7619.3910.44140.76–230.690.649.52
Ca97.055.295.4581.76–128.650.065.13
Fe0.900.4752.230.06–1.900.030.35
Se0.090.0780.120.03–0.150.090.02
1 SD = standard deviation; and CV = coefficient of variation. 2 R2 = coefficient of determination; and SE = standard error. 3 Na = sodium; Mg = magnesium; P = phosphorus; Cl = chloride; K = potassium; Ca = calcium; Fe = iron; and Se = selenium. 4 ED-XRF = energy-dispersed X-ray fluorescence.
Disclaimer/Publisher’s Note: The statements, opinions and data contained in all publications are solely those of the individual author(s) and contributor(s) and not of MDPI and/or the editor(s). MDPI and/or the editor(s) disclaim responsibility for any injury to people or property resulting from any ideas, methods, instructions or products referred to in the content.

