Article

Differential Mitochondrial Genome Expression of Four Skink Species Under High-Temperature Stress and Selection Pressure Analyses in Scincidae

by
Xuxiang Wu
1,†,
Lemei Zhan
1,†,
Kenneth B. Storey
2,
Jiayong Zhang
1 and
Danna Yu
1,3,*
1
College of Life Sciences, Zhejiang Normal University, Jinhua 321004, China
2
Department of Biology, Carleton University, Ottawa, ON K1S 5B6, Canada
3
Key Lab of Wildlife Biotechnology, Conservation and Utilization of Zhejiang Province, Zhejiang Normal University, Jinhua 321004, China
*
Author to whom correspondence should be addressed.
These authors contributed equally to this work.
Animals 2025, 15(7), 999; https://doi.org/10.3390/ani15070999
Submission received: 14 February 2025 / Revised: 27 March 2025 / Accepted: 27 March 2025 / Published: 30 March 2025
(This article belongs to the Section Animal Genetics and Genomics)

Simple Summary

The increasing occurrence of extreme heatwaves globally affects the stability of species populations and their distribution ranges. The present study shows that the ND6 gene of the skink, Sphenomorphus indicus, has undergone positive selection. We then compared the differences in mitochondrial genome expression levels under high-temperature stress among four skink species distributed across different latitudes: Plestiodon capito, Plestiodon chinensis, Sphenomorphus indicus, and Scincella modesta. Two metabolic strategies of mitochondrial genome expression that vary with latitude were identified.

Abstract

As ectotherms highly sensitive to environmental temperature fluctuations, skinks (a small lizard) are increasingly vulnerable to population instability due to global heatwaves. A clade model analysis of four Chinese skink species (Plestiodon capito, Plestiodon chinensis, Sphenomorphus indicus, and Scincella modesta) revealed positive selection acting on the ND6 gene in Sp. indicus. This species exhibits codon alterations in ND6, shifts its expression pathway and potentially decouples ND6 from high-temperature stress response mechanisms. To validate these findings, transcriptomic profiling was conducted to assess mitochondrial protein-coding gene (PCG) expression patterns under thermal stress. Using RT-qPCR, liver mitochondrial PCG transcript levels were compared between high-temperature (34 °C) and control (25 °C) groups in skink populations from distinct latitudes. Low-latitude species (P. chinensis and Sc. modesta) exhibited metabolic downregulation, characterized by a significant suppression of mitochondrial gene expression. Specifically, P. chinensis showed the downregulation of six mitochondrial genes (COII, COIII, ATP6, ND2, ND4, ND6) while upregulating one (ND1). By contrast, Sc. modesta showed the downregulation of nine genes (COI, COII, COIII, ATP8, ND1, ND3, ND4, ND4L, CYTB) and upregulated two (ND5, ND6). By contrast, high-latitude species exhibited divergent patterns: P. capito downregulated four genes (COI, COII, COIII, ND4L) and upregulated four others (ND1, ND2, ND3, ND4), whereas Sp. indicus downregulated six genes (COI, COII, ND2, ND3, ND4, ND4L) and upregulated one (ND5). These regulatory disparities suggest that low-latitude skinks have a greater capacity for metabolic depression to cope with chronic stress, whereas their high-latitude counterparts exhibit different adaptations. The findings provide valuable insights into assessing the adaptive potential of species in warming environments, particularly for ectotherms with limited thermoregulatory capacities.

1. Introduction

Against a backdrop of global warming and the increasing frequency of extreme climate events, the global average temperature continues to rise, and temperature fluctuations within small-scale regions have become more pronounced [1,2]. For skinks, which rely predominantly on environmental temperature for thermoregulation, this presents a considerable challenge, particularly in high-temperature environments [3,4]. Temperature variations can disrupt the inherent homeostasis of skinks and elicit their responses to adapt to new environmental temperatures. Therefore, the ongoing rapid increase in global temperatures is likely to change the strategies that skinks have evolved for adapting to environmental temperature changes over millions of years [5]. This inevitably results in a decline in the biodiversity of reptiles worldwide (www.iucnredlist.org, accessed on 14 November 2024). Skinks exhibit exceptionally high ecological value, which is manifested in their near-global distribution, high species richness, and remarkable interspecific diversity [6]. For instance, they display significant variation in body size [7], reproductive strategies (including both oviparous and viviparous modes) [8], and morphological adaptations such as reduced or absent limbs in certain species [9]. Their ecological and life-history traits also encompass extensive diversity, including thermal preferences, activity periods, social behavior, and dietary specialization [6]. Such multifaceted variation underscores their critical roles in ecosystem functioning. Consequently, global temperature changes may therefore drive population declines in skinks, potentially destabilizing ecosystem stability.
Skink populations distributed along latitudinal or altitudinal gradients may be subject to varying intensities and durations of environmental thermal stress, which could lead to differences in their evolutionary response mechanisms over the long term [10,11,12]. Consequently, under different levels of historical exposure, the adaptive mechanisms of species vary [13,14,15]. Species from regions with high temperatures tend to employ metabolic strategies that are better suited for coping with heat, whereas those that do not frequently encounter high temperatures may instead adopt a contrasting metabolic approach [16,17,18]. This is specifically reflected in the variation of mitochondrial PCGs or other genes associated with metabolism, where some genes may undergo selection, and there may also be variations in the expression levels of certain genes.
Mitochondria, as the energy factories of the cell, are intimately connected with the energy metabolism of organisms, particularly in close association with temperature factors [19,20]. They are also believed to have important indicative roles in biogeography and species ecology [21,22]. Through a deeper comprehension of the mechanisms by which species respond to climate, it becomes feasible to determine the distribution ranges of species populations, which is instrumental in conserving biodiversity and in proactively responding to climate change. The mitochondrial genome includes 13 PCGs that encode proteins that are integral parts of the mitochondrial respiratory complexes I–V, and they play a significant role in establishing the proton gradient that facilitates the generation of ATP [23,24]. Beyond their primary functions, mitochondria mediate signaling cascades, modulate cellular viability, regulate calcium ion balance, and participate in immunological processes [25,26,27]. Therefore, selecting mitochondrial genes as the focal subject of this study facilitates a deeper understanding of the relationship between energy metabolism variations and species’ geographical distribution.
The selection pressures exerted by climatic and geographical variations on mitochondrial genes, as well as the associated differences in gene expression levels, have been elucidated in previous studies. Lineage-specific selection pressures acting on mitochondrial DNA may arise from habitat heterogeneity or spatial segregation across biogeographical ranges. Evolutionary analyses employing codon-substitution models within maximum likelihood frameworks quantify adaptive evolution through ω (dN/dS) [28]. If ω < 1, it is considered that purifying selection has occurred, whereas if ω > 1, it is considered that positive selection has occurred. If ω = 1, then neutral selection has occurred [29]. Through selection pressure analysis of Takydromus intermedius, the present study shows that ATP6, ATP8, and ND3 underwent positive selection and were most strongly correlated with climatic variables [30]. Phylogenetic selection analyses across 15 Phrynocephalus taxa inhabiting the Tibetan Plateau’s high-altitude ecosystems revealed conserved selective regimes among five recognized species complexes. Notably, lineages experiencing upward elevational transitions exhibited significantly enhanced signatures of adaptive evolution compared to their downward-migrating counterparts [31]. After being influenced by environmental factors, not only will the genes themselves be subject to selective pressure, but their expression levels will also respond accordingly. For example, under higher temperatures, the activity of the electron transport chain in the clam, Mytilus galloprovincialis, was enhanced, as evidenced by increased transcript levels of ND2 and COⅠ. This contributes to the provision of ATP to meet the high energy demands of cells, thereby alleviating heat-induced energy stress and supporting energy homeostasis [32]. Mitochondrial gene expression patterns also exhibit species-specific divergence. For example, under low-temperature stress, comparative analysis revealed distinct ND5 regulation between subspecies of Hoplobatrachus rugulosus, with these Chinese tiger frogs showing the significant downregulation of two identical ND5 copies under low-temperature stress. By contrast, Thai tiger frogs maintained stable expression of their distinct ND5 paralogs [33]. A similar pattern was observed in Dryophytes immaculata, where 12 out of 13 mitochondrial genes exhibited significantly reduced transcript levels under low-temperature stress. By contrast, Hyla zhaopingensis demonstrated the marked upregulation of ND2 and ATP6 transcripts under low-temperature stress, a response that may be associated with its restricted distribution in low-latitude regions [34].
Previous studies have predominantly focused on mitochondrial responses to low-temperature stress [33,34,35,36], whereas research on gene expression under high-temperature stress remains limited. We designated 34 °C as the high-temperature experimental group and 25 °C as the control. This experiment selected 34 °C as the high-temperature stress condition because higher temperatures would induce near-universal upregulation of mitochondrial PCGs, rendering comparative analysis infeasible—for instance, all 13 PCGs in Sphenomorphus incognitus exhibited significantly elevated expression levels at 38 °C, whereas distinct differential expression patterns were observable at 34 °C. Lower temperatures, in contrast, failed to generate sufficient expression variability for meaningful statistical or functional interpretation [37]. In this study, we constructed a phylogenetic tree (using ML and BI) encompassing all four species, applied the CmC versus M2a-rel model to test for selection pressure on mitochondrial PCGs across the studied species, and quantified mitochondrial PCG expression levels under high-temperature conditions. And our aims were (1) to perform selection pressure analysis across four skink species (Plestiodon capito, Plestiodon chinensis, Sphenomorphus indicus, and Scincella modesta) to identify positively selected mitochondrial genes, (2) to evaluate whether species-specific expression-level differences of these genes exist under high-temperature stress and to provide rational explanations for such divergence, and (3) to further analyze interspecific mitochondrial expression variations to summarize whether skink species from different latitudes exhibit distinct thermal adaptation strategies in response to elevated temperatures.

2. Materials and Methods

2.1. Temperature Preferences, Distribution Range, and Grouping Strategies of Sampled Species

The Scincidae family (Reptilia: Squamata), known as skinks, is rich in diversity and has a wide distribution. Indeed, this family is estimated to comprise approximately one-four of the overall skink species diversity [38]. Plestiodon capito is primarily distributed in the northern regions of China (Figure 1A). It mainly inhabits mountainous areas with dense vegetation and is active from late April to early October. This species is most active at temperatures of 25 °C and may seek shade to avoid the heat when temperatures exceed 30 °C [39]. Plestiodon chinensis is primarily distributed in southern China (Figure 1A) and has also been observed in Vietnam [40]. This species mainly inhabits low-altitude plain areas [41]. With the continuous increase in environmental temperature, its locomotor ability also increases, reaching a watershed at 34 °C [42]. Sphenomorphus indicus is primarily distributed in southern China and has also been observed in Sikkim, Myanmar, and Thailand. It is also found in Chinese provinces with higher latitudes, such as Gansu and Shanxi provinces (Figure 1A). The thermal preference temperature for Sp. indicus is 25.7 °C, making the environmental temperatures in the morning and evening more suitable for these skinks than those at noon [43]. Scincella modesta has a wide distribution, with populations spanning tropical and temperate regions, for example, Henan and Guangdong provinces (Figure 1A). A temperature range of 23 °C to 25 °C is considered optimal for its physiological activities. The species exhibits behavior of seeking shade when temperatures exceed 28 °C, and temperatures below 8 °C can induce hibernation [35].
Specifically, we established two comparative groups. The first group was defined within the genus Plestiodon, comprising P. capito, which is primarily distributed in high-latitude regions of northern China, and P. chinensis from low-latitude areas, with P. capito’s collection sites located at significantly higher latitudes than those of P. chinensis. The second group included two Sphenomorphinae species from distinct genera (Scincella and Sphenomorphus): Sc. modesta and Sp. indicus. These species partially overlap in geographic ranges, but Sp. indicus was collected from more northern sites, whereas Sc. modesta was sampled from southern locations near 30°N.

2.2. Sample Collection, Acclimation, and High-Temperature Stress

During late April to early May 2023, adult males of four skink species—P. capito (33°03′ N 112°29′ E, Nanyang, Henan), P. chinensis (23°10′ N 113°17′ E, Guangzhou, Guangdong), Sp. indicus (33°03′ N 112°29′ E, Nanyang, Henan), and Sc. modesta (29°34′ N 114°29′ E, Xianning, Hubei)—were collected across central and southern China (Figure 1A). We exclusively selected individuals of male to minimize experimental variability, as significant intersexual differences (e.g., sex-biased expression in the GH/IGF network [44] and hormonally regulated gene expression patterns [45]) could introduce confounding effects that compromise result reliability. Skinks of each species were collected, transported to the laboratory, and housed in identical plastic incubators (120 × 90 × 110 cm) under controlled conditions for one week acclimation prior to experiments. After acclimation, 20 skinks of appropriate size were randomly selected from each species to serve as experimental materials, with 10 individuals assigned to the control group (25 °C) and 10 to the high-temperature group (34 °C). The duration of the experiment was controlled at 24 h.

2.3. DNA Extraction and Sequencing

To mitigate potential interspecific variation interference in RT-qPCR analysis, mitochondrial sequence data were obtained for each species, and the COI gene was sequenced for 20 individuals per species. Genomic DNA was isolated from tail tissues using an Ezup Column Animal Genomic DNA Purification Kit (Sangon Biotech, Shanghai, China) following standard protocols. High-quality extractions (>25 µg/mL) underwent NGS (Illumina HiSeq 2000, PE150) by BGI Tech. (Shenzhen, China). Raw reads were quality-filtered through fastQC v0.11.6 prior to mitogenome assembly.

2.4. Mitochondrial Genome Assembly and Annotation

Sequencing reads were de novo assembled into complete mitogenomes using NOVOPlasty v4.2 [46] and GetOrganelle v1.7.1 [47]. The tRNA positions were determined using the Galaxy Europe version 23.1 platform (https://usegalaxy.eu/, accessed on 27 November 2023). The annotation of 13 PCGs, 2 rRNAs, and the non-coding control region across all four species was validated via manual curation with Mega v7.0 [48] and SnapGene Viewer v6.2.2.

2.5. Phylogenetic Analyses

A phylogenetic tree was constructed using 13 PCGs from 31 mitochondrial genomes, including the mitochondrial genomes of P. capito, P. chinensis, Sp. indicus, and Sc. modesta, as well as 27 mitochondrial genomes obtained from NCBI [35,49,50,51,52,53,54,55]. Heloderma suspectum, Lepidophyma flavimaculatum, Smaug warreni, and Varanus salvator [56,57,58] were used as outgroups (Table S1).
All of the above sequences were imported into PhyloSuite v1.2.3 [59] for sequence extraction. Subsequently, MAFFT v7.475 [60] was utilized to align the nucleotides of the 13 PCGs. Sequence conservation was assessed using Gblocks v0.91b [61], followed by concatenation via the built-in sequence module. A codon saturation analysis of the third positional sites performed in DAMBE v7.3.32 [62] confirmed no saturation, allowing the inclusion of all three codon positions for phylogenetic reconstruction. Optimal partitioning strategies and substitution models (Table S2) were identified through PartitionFinder v2.2.1 [63]. BI was implemented in MrBayes v3.2 [64], with partitioned data, running 10 million generations (tree sampling interval: 1000 generations), terminating at average standard deviation <0.01 to calculate posterior probabilities. ML analysis utilized RAxML-NG v1.2 [65], conducting a total of 1000 runs and utilizing a bootstrap value of 100 to assess the robustness of the ML tree.

2.6. Selective Pressure Analyses

The calculation of the ratio of dN/dS was conducted using EasyCodeML v1.41 [66] in the context of Maximum Likelihood phylogenetic analysis. The ω ratio is a widely utilized measure to assess the selective pressures acting on genes. In the analysis, the CmC was employed to accommodate divergence by estimating separate ω values for two or more clades. The M2a_rel model was used as a null model, which is derived from CmC by applying a single nonboundary constraint such that ω2 = ω3 [67]. Each species under study was individually considered as the foreground branch, with the remaining branches serving as the background. This approach enabled us to employ the computation of LRT p values and parameter estimates for the 13 PCGs. Site-specific divergence across clades was assessed via LRT comparing the CmC model against the M2a_rel null model.

2.7. RNA Extraction and cDNA Synthesis

For each species under study, we randomly selected four samples from both the control (25 °C) and high-temperature (34 °C) groups. A longitudinal incision was meticulously made along the ventral aspect of the abdomen. The liver was then carefully removed and positioned in a 1.5 mL microcentrifuge tube containing an RNA-free environment, ensuring optimal preservation of RNA integrity for subsequent molecular analysis. The liver was chosen as the tissue of study due to its high mitochondrial content and its role as a primary organ for energy metabolism in the body, resulting in significant expression levels [33,68]. Tissue samples were rapidly frozen in liquid nitrogen and subsequently stored at −80 °C. The total RNA was isolated from all 32 samples using the Animal Tissue Total RNA Extraction Kit (Forgene Company, Chengdu, China), with RNA integrity assessed by visualizing distinct 28S/18S rRNA bands on agarose gels. To eliminate genomic DNA contamination, RNA underwent DNase treatment at 42 °C for 2 min using the PrimeScript™ RT Reagent Kit (Takara, Japan). cDNA synthesis was then performed with the same kit under the following conditions: 37 °C for 15 min (reverse transcription), 85 °C for 5 s (enzyme inactivation), and final hold at 4 °C.

2.8. RT-qPCR Primer Design and Reaction

Leveraging the mitochondrial gene sequences that were acquired for each species under study, RT-qPCR primers were designed using Primer Premier v6.0 (Premier Biosoft International, Palo Alto, CA, USA). The β-actin gene was selected as the endogenous control based on its stable expression across differing temperature conditions [69]. The primer sequences for the β-actin gene amplification were crafted as follows: the forward primer sequence was GATCTGGCATCACACTTTCT, and the reverse primer was GTGACACCATCACCAGA [70]. Our selection of primers (Table S3) was informed by the outcomes of RT-qPCR reactions. Utilizing the EASY Dilution method, cDNA obtained from each sample was subjected to serial dilution to attain five discrete concentration gradients, specifically 10−1, 10−2, 10−3, 10−4, and 10−5. To ensure precision, we conducted three technical replicates for each primer pair to evaluate the gene expression levels. For quantification of the 13 PCGs’ transcript levels, we deployed the StepOnePlus™ Real-Time PCR System, a product of Life Technologies (Carlsbad, CA, USA). Except for the cDNA template, all other components of the reaction system were first prepared in EP tubes, vortexed, and thoroughly mixed. The thermal cycling protocol included an initial denaturation at 95 °C for 30 s, followed by 40 cycles of denaturation (95 °C, 5 s) and annealing/extension (55 °C, 30 s).

2.9. RT-qPCR Data Analysis

The transcript quantification of 13 mitochondrial PCGs was determined via cycle threshold (Ct) values, defined as the amplification cycles required for fluorescent signals to cross the detection threshold. Gene expression levels were computed using the 2^(−ΔΔCt) method, where ΔCt = (Cttarget − Ctβ-actin). Data from four biological replicates were aggregated and expressed as mean ± standard error (SE). Inter-group comparisons were conducted using independent-sample t-tests in SPSS v21.0 (SPSS, Inc., Chicago, IL, USA) [71] with graphical outputs generated using Origin v8.0 [72]. Comparative expression profiles were additionally visualized through constructed heatmaps.

3. Results

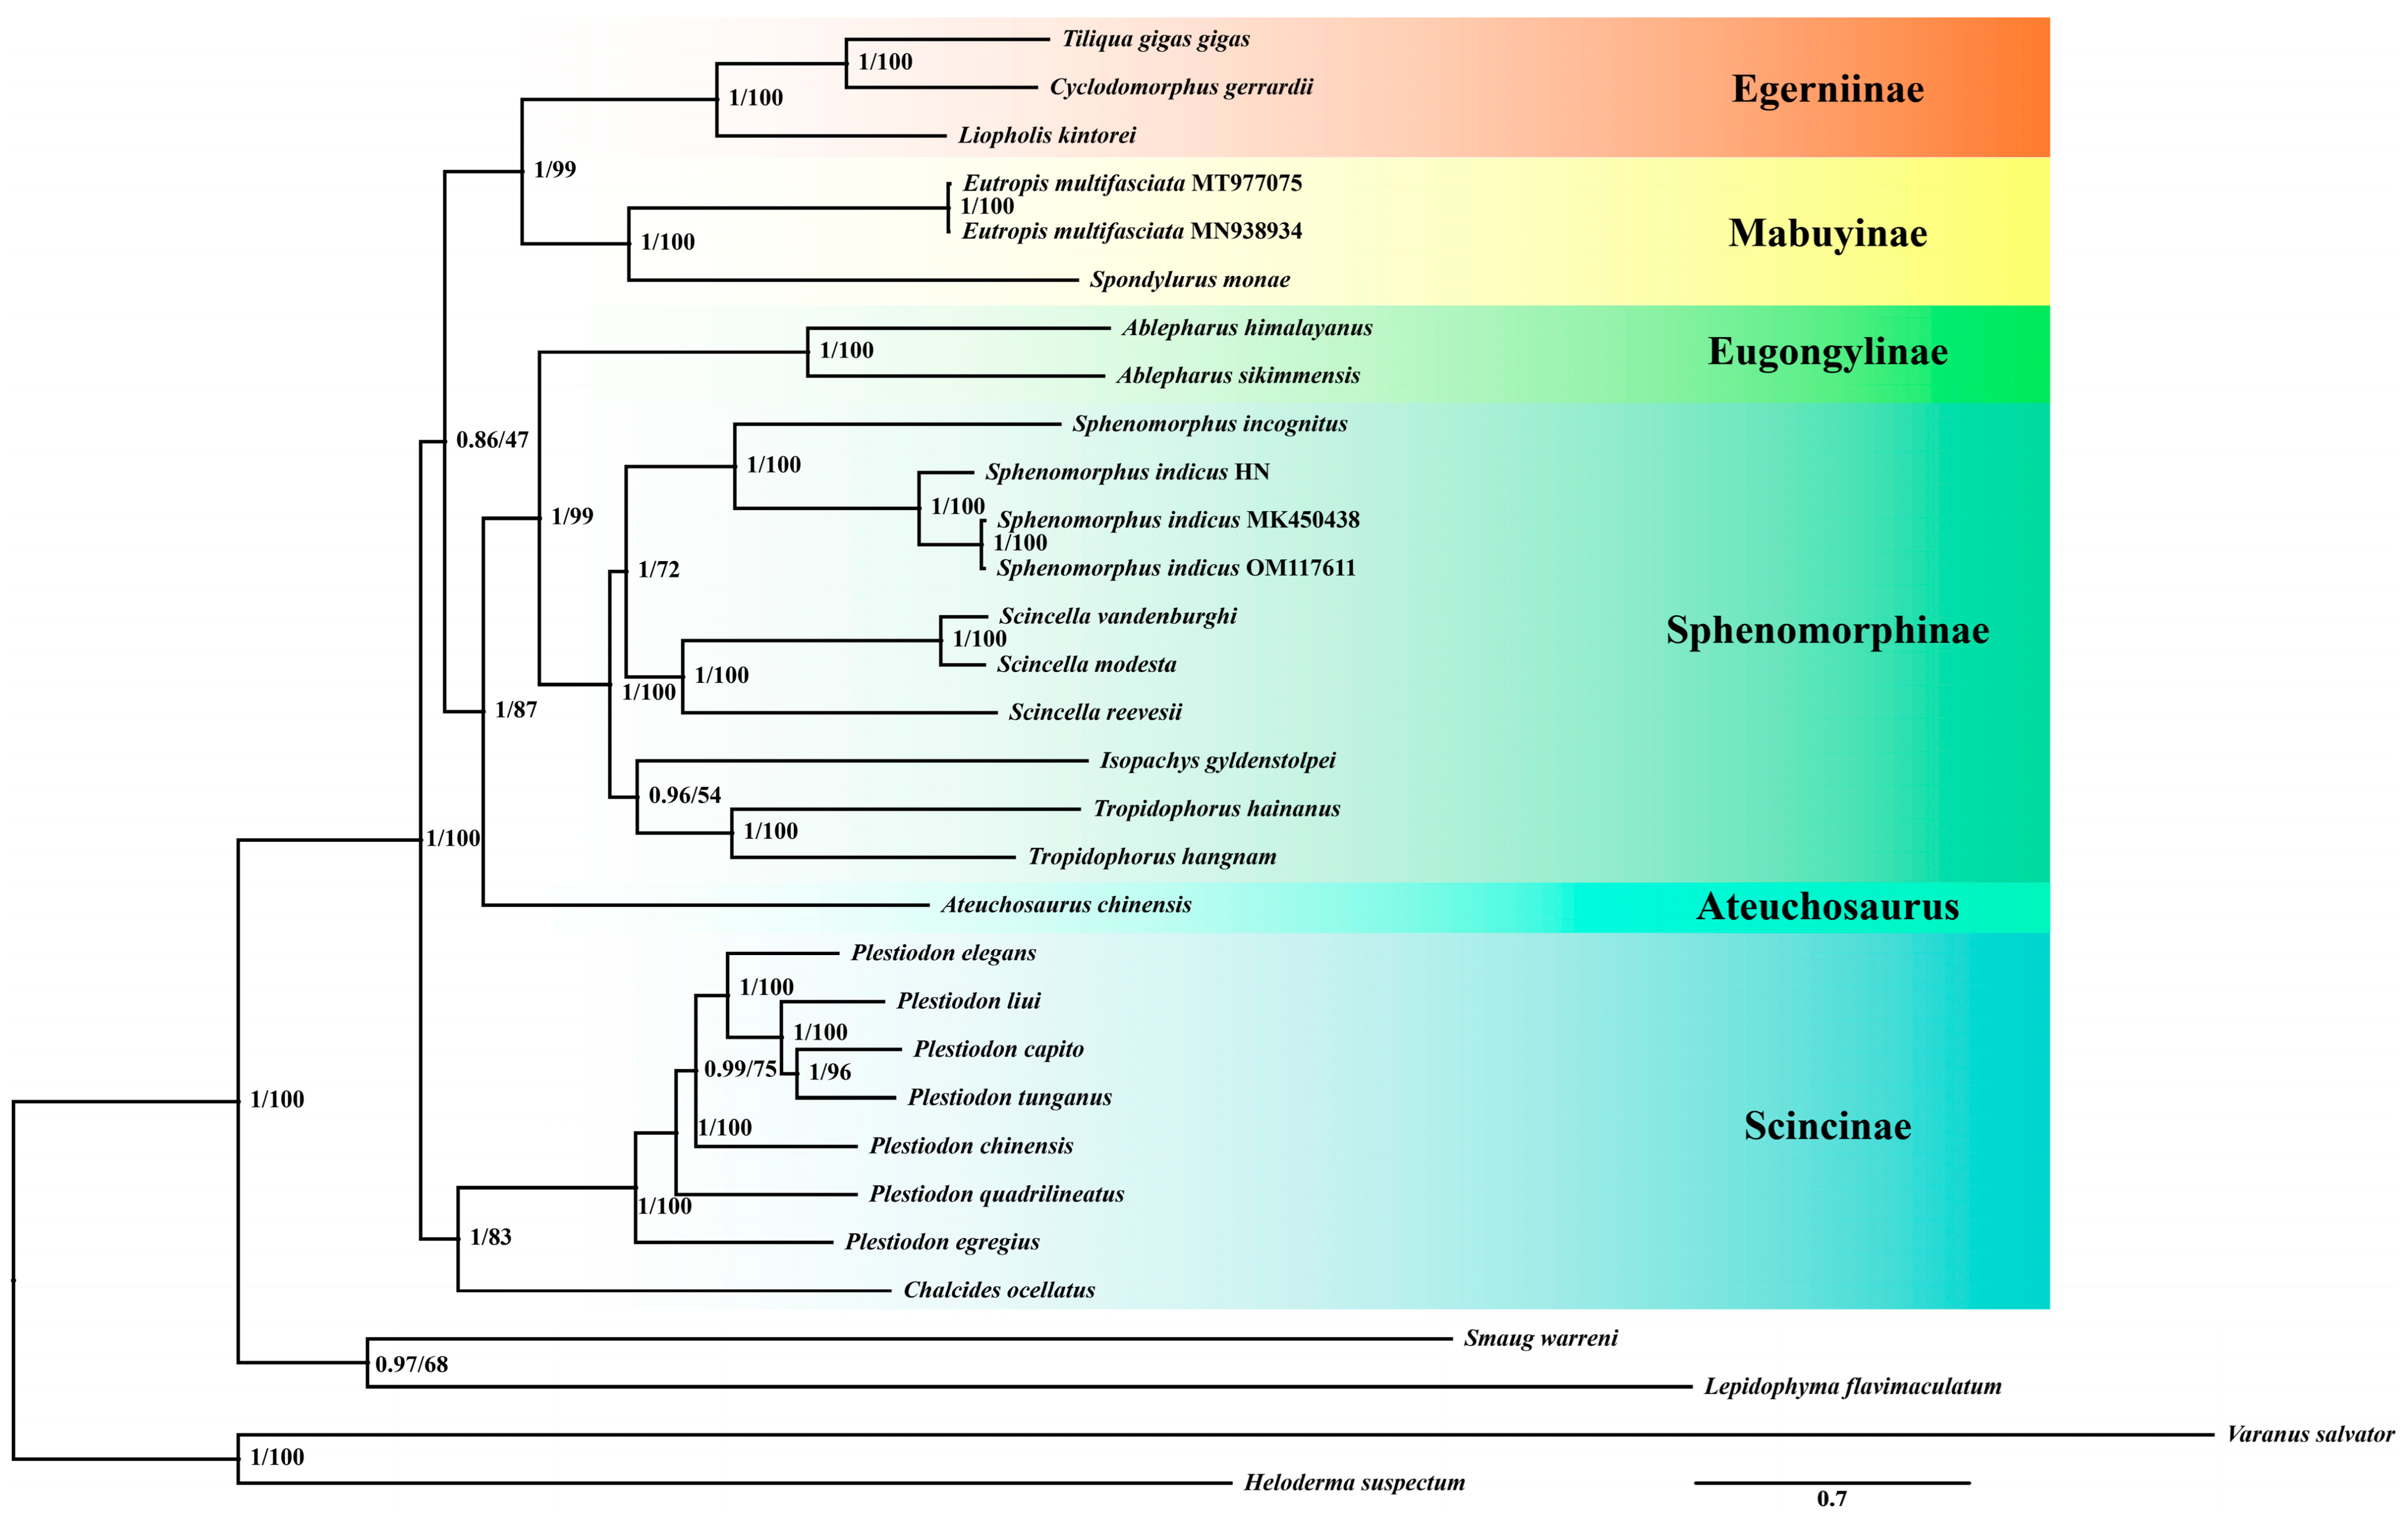
3.1. Phylogenetic Relationships and Selective Pressure Analysis

Based on 31 species and 13 mitochondrial PCGs, we generated phylogenetic trees using both Bayesian Inference (BI) and Maximum Likelihood (ML) methods (Figure 2). The identical topological structures of these two trees indicated that the phylogenetic relationships obtained are reliable. The resulting monophyletic groups, Egerniinae, Mabuyinae, Eugonglinae, Sphenomorphinae, and Scincinae all have high support values. Furthermore, these groups can be divided into three clades: Egerniinae and Mabuyinae form one clade, Eugonglinae and Sphenomorphinae form another clade, and Scincinae stands as a separate clade.
Using the CmC versus M2a_rel model, the ND4 gene in P. capito was identified as being under purifying selection (ω < 1), with a strong significant Likelihood Ratio Test (LRT) p < 0.01. In P. chinensis, both the ND2 and ND5 genes were identified as under purifying selection (ω < 1), with the ND2 gene showing a strong significant p < 0.01, and the ND5 gene showing a significant p < 0.05. In Sp. indicus, the ND6 gene was confirmed to be under positive selection (ω > 1), with a strong significant p < 0.01. In Sc. modesta, the COI and ND4 genes were suggested to be under purifying selection (ω < 1), with significance p < 0.05 (Table 1).

3.2. Effect of High-Temperature Stress on Transcript Levels of Mitochondrial PCGs

Plestiodon capito, inhabiting mid-to-high latitude regions, exhibited significant variation in the expression levels of four mitochondrial PCGs, the ND1, ND2, ND3, and ND4 genes showing a strong significant upregulation, to values of 2.22 ± 0.17, 1.68 ± 0.13, 2.29 ± 0.18, and 1.48 ± 0.08, respectively. By contrast, the transcript levels of several other genes were significantly downregulated, specifically for COI, COII, COIII, and ND4L genes, to values of 0.73 ± 0.07, 0.49 ± 0.07, 0.50 ± 0.06, and 0.69 ± 0.05, respectively (Figure 3A). In the low-latitude P. chinensis, only ND1 gene showed an upregulation of transcript levels, to values of 1.53 ± 0.08. The transcript levels of most other mitochondrial PCGs were significantly downregulated. Specifically, COII, COIII, ND2, ND4, ND6, and ATP6 genes, fell to values of 0.34 ± 0.06, 0.52 ± 0.12, 0.27 ± 0.06, 0.35 ± 0.06, 0.61 ± 0.08, and 0.69 ± 0.09, respectively (Figure 3B).
The transcript levels of mitochondrial PCGs in Sp. indicus, which primarily inhabits mid-to-high latitude regions, showed changes only in the ND5 gene and showed a strong significant upregulation to values of 1.96 ± 0.22 (Figure 3C). By contrast, six significantly downregulated mitochondrial PCGs were identified. Specifically, COI, COII, ND2, ND3, ND4, and ND4L expression decreased to values of 0.54 ± 0.06, 0.48 ± 0.05, 0.66 ± 0.04, 0.43 ± 0.02, 0.64 ± 0.05, and 0.43 ± 0.04, respectively. In Sc. modesta, which is found at lower latitude collection sites, the ND5 and ND6 genes showed strong significant upregulation, to values of 1.96 ± 0.14, and 3.57 ± 0.30, respectively (Figure 3D). By contrast, the transcript levels of other genes were significantly downregulated, including COI, COII, COIII, ATP8, ND1, ND3, ND4, ND4L, and CYTB genes, to values of 0.68 ± 0.05, 0.63 ± 0.04, 0.37 ± 0.06, 0.56 ± 0.06, 0.53 ± 0.04, 0.57 ± 0.06, 0.33 ± 0.05, 0.59 ± 0.07, and 0.32 ± 0.05, respectively. To enable direct visual comparison of expression levels, we constructed heatmaps and annotated statistically significant genes with asterisks to highlight their differential expression patterns (Figure 4).

4. Discussion

4.1. Selective Pressure Analysis

Established through phylogenetic tree development, we conducted a selection pressure analysis to further explore the possible reasons. The phylogenetic relationships of the Scincidae based on mitochondrial PCGs are largely consistent with previous findings, ensuring the accuracy of subsequent studies [73,74,75]. By employing the CmC versus M2a_rel model, with each of the four species as the foreground branch, it was found that the ND4 gene in P. capito underwent purifying selection. In P. chinensis, the ND2 and ND5 genes experienced purifying selection. For Sc. modesta, both the COI and ND4 genes underwent purifying selection. Notably, the ND6 gene in Sp. indicus experienced positive selection, yet the expression level of this gene exhibited no significant variation relative to the control group.
Overall, we have noted the unique characteristics of the ND6 gene in Sp. indicus and undertook efforts to gather additional evidence, aiming to elucidate the underlying causes of this variation and its potential implications for mitochondrial function and thermal adaptation. The expression product of the ND6 gene, as a key subunit of Complex I (NADH dehydrogenase), plays an important role. Complex I, the largest protein in the respiratory chain (comprising 41 subunits), transfers electrons from NADH to ubiquinone while coupling this redox reaction to proton pumping across the inner mitochondrial membrane. This coupling mechanism drives the proton gradient required for ATP synthesis [76,77]. This also includes the subunits encoded by the mitochondrial ND1-6 and ND4L genes [78,79]. The ND6 gene has been proven to play an irreplaceable role in Complex I, located on the membrane arm of Complex I, and is involved in the proton translocation process [80,81]. The detection of positive selection in the ND6 gene implies that there may be changes in the structure or proton transport efficiency of Complex I in Sp. indicus. It was also observed that, in the second comparative group, the upregulated gene in Sp. indicus was only ND5, whereas in Sc. modesta, the upregulated genes included both ND5 and ND6. We speculate that this may be because the ND6 gene in Sp. indicus has undergone positive selection, with amino acid changes to meet the selection of the thermal environment. This can lead to changes in metabolic pathways, which may render the ND6 gene as no longer involved in the mechanisms under high temperature. The positive selection of the ND6 in skinks has been reported in a related study [49]. Additionally, a separate study revealed that within the genus Sphenomorphus, the ND5 gene of Sphenomorphus incognitus exhibited significant upregulation under 34 °C thermal stress [37]. Similar to Sp. incognitus, the ancestors of Sp. indicus likely exhibited significant upregulation of only the ND5 gene under thermal environmental temperatures, suggesting a conserved thermoadaptive mechanism.
Similar to human mitochondrial transcription, in skinks the expression of ND6 mRNA and eight tRNAs is driven by the Light-Strand Promoter (LSP), while the 12 mRNAs, two rRNAs, and remaining tRNAs are regulated by the Heavy-Strand Promoter (HSP). These two promoters drive transcription in opposite directions [82]. The mitochondrial transcription factor A (TFAM) binds to the mid-region (upstream) of both LSP and HSP, subsequently recruiting transcription factor B2 mitochondrial (TFB2M) and mitochondrial RNA polymerase (mt-RNAP) to initiate transcription [83]. The LSP terminates upstream of rRNA genes, whereas the HSP terminates within the D-loop region [82]. In our study, the differential gene expression observed between Sp. indicus and Sc. modesta was directly correlated with the differential activation of LSP and HSP. Notably, among the 12 HSP-driven mRNAs, only the ND5 gene exhibited significant upregulation, while the remaining mRNAs underwent degradation—a phenomenon whose underlying mechanism remains unclear. The LSP-mediated expression of the ND6 gene may primarily stem from differential regulation by key mitochondrial regulators. This phenomenon may be associated with peroxisome proliferator-activated receptor coactivator 1α (PGC-1α) and nuclear respiratory factors 1 and 2 (NRF-1/2), which are key regulators of the antioxidant stress response [84].
In the entire selection pressure analysis, we observed that purifying selection predominantly occurred on the ND genes, specifically ND2, ND4, and ND5. This suggests that the Complex I subunit genes are essential for cellular function, serving an indispensable role in the proton translocation process of the electron transport chain. The process of purifying selection acts to remove detrimental mutations, allowing these genes to preserve their original functions. In the ND2 and ND4 genes, P. capito showed significant upregulation, whereas in P. chinensis significant downregulation appeared. This is associated with the purifying selection on the ND2 and ND4 genes. Temperature has been described as the most significant environmental factor affecting genotypic variation among species living at different latitudes [85]. A strong relationship between environmental temperature and pressures selection on Complex I subunit genes has been described in many studies [30,86,87]. This is consistent with our observed results.

4.2. Analysis of Mitochondrial Genome Expression in High-Temperature Stress

In this study, we took into account various factors that influence the precise regulation of mitochondrial genomes, including the distribution range of species from external sources, differences in latitude, and phylogenetic relationships derived from genetics [88,89]. These factors can reveal the energy allocation strategies and thermal tolerance of organisms. By considering external evidence and differences in mitochondrial gene expression levels, we aim to explain the potential reasons behind mitochondrial energy allocation strategies and gene expression differences between these two comparative groups.
Our experiment did not employ extreme high-temperature stress, such as subjecting the skinks to 40 °C, but rather we used 34 °C, a temperature that may cause discomfort and potentially prompt an adjustment in mitochondrial expression levels. The 34 °C temperature was also a temperature that the four species of skinks, collected for this study, frequently encounter in their natural environment. Furthermore, as latitude decreases, the number of days per year that approach or exceed 34 °C gradually increases (Figure 1B). In the first comparative group, within the genus Plestiodon, P. capito, which has a geographical distribution and collection sites from higher latitudes, is stressed at high temperatures for a shorter period. By contrast, P. chinensis, which has a geographical distribution and collection sites from lower latitudes, is correspondingly stressed at temperatures exceeding or nearing 34 °C for a significantly longer period. In our experiment, six genes in P. chinensis, including Complex I, Complex IV, and Complex V subunit genes, showed a down regulation in transcript levels, whereas in P. capito only four genes exhibited a decrease, including Complex I and Complex IV subunit genes. Relative to the control group, P. chinensis exhibited a higher quantity of downregulated genes, with mitochondrial gene transcript levels being significantly lower. This suggests that P. chinensis is actively downregulating multiple mitochondrial PCGs, leading to a reduction in the quantity of various mitochondrial proteins, including those in Complex I, Complex IV (cytochrome c oxidase), and Complex V (ATP synthase), as a response to high-temperature environments. Under high-temperature conditions, mitochondria tend to engage in reverse electron transport [89], making complex I a primary producer of ROS (reactive oxygen species) [90,91,92]. ROS, as highly reactive chemical molecules, can damage cellular membranes and disrupt normal cellular physiological and molecular structures [93,94,95]. By actively reducing the amount of Complex I, P. chinensis can decrease the production of ROS, thereby mitigating oxidative damage potential and actively coping with a high-temperature environment.
P. capito exhibited the upregulation of four genes, specifically the Complex I subunits, a greater number than observed in the lower-latitude congener P. chinensis. This indicates that, under high-temperature stress, P. capito adopts a different strategy from P. chinensis. High-temperature environments induce mitochondrial proton leakage, reduce the effective P/O ratio (phosphorylation efficiency per oxygen consumed), and directly impair respiratory complex activity. Collectively, these effects diminish ATP synthesis efficiency and lower cellular energy reserves [96,97]. To compensate, P. capito upregulates genes that sustain ATP production capacity. This adaptation may support antioxidant defense systems (e.g., SOD synthesis), counteracting ROS surges induced by both thermal stress and Complex I activity [98,99,100]. The results indicate that, under high-temperature conditions, species from lower latitudes may opt to reduce their metabolic rate to cope with prolonged exposure to heat. This strategy has been confirmed in numerous studies, demonstrating that organisms can extend their survival time in adverse environments by suppressing their metabolic rates and thus decreasing their energy requirements. This indirectly suggests that animals would then exhibit stronger heat tolerance [35,36,101]. By contrast, species from mid-to-high latitudes that have fewer opportunities to experience high-temperatures are more likely to increase the expression levels of certain genes directly. This suggests that they may be in a state of thermal stress, actively upregulating gene expression as a response to high-temperature challenges [37].
In another comparative group, we observed a similar phenomenon. Sc. modesta, which is from a lower latitude, showed transcript levels of nine downregulated genes, including Complex I, Complex Ⅲ, Complex IV, and Complex V subunit genes, whereas Sp. indicus, from a higher latitude, showed transcript levels of only six downregulated genes, including Complex I and Complex IV subunit genes. Overall, the downregulation of mitochondrial gene transcript levels in Sc. modesta was more pronounced, akin to that observed in P. chinensis. This suggests that Sc. modesta may have adopted the same coping strategy, reducing its mitochondrial energy metabolic levels to maintain homeostasis in a more prolonged high-temperature environment. In terms of upregulated genes, Sc. modesta, which is from a lower latitude, actually showed the upregulation of two genes, ND5 and ND6, as compared to Sp. indicus, which only upregulated ND5.
The same conclusion, that low-latitude populations will have stronger heat adaptation capabilities, has also been reported in studies of other animals. For example, the distribution of clade A of Engraulis encrasicolus is correlated with latitude, with abundance increasing at lower latitudes, whereas clade B showed the opposite pattern. This is related to the different patterns of positive and negative selection acting on the CYTB gene, hence allowing varying capacities for heat adaptation [85]. In a study of Drosophila melanogaster [17], all haplotypes obtained were divided into two major haplogroups, one that was dominant at lower latitudes and the other at higher latitudes, with the abundance of both haplogroups showing a linear relationship with latitude. Using high-temperature experiments, it was directly observed that the haplogroup from lower latitudes had stronger heat tolerance. This may be related to its unique SNP types, higher GC content, and codon bias resulting in rarer codons. The expression levels of Complex I subunit genes detected in the haplogroup from lower latitudes were lower compared to those from higher latitudes, consistent with our observed data. Compared to other complex genes, genetic variation in Complex I subunit genes may have a more profound impact on mitochondrial energy metabolism and the organism’s own strategy selection [102,103]. The differences in gene expression patterns between skinks from low and high latitudes are also mainly concentrated on Complex I subunit genes. Relatively speaking, Complex IV contains genes with the lowest dN/dS levels, and these mitochondrial genes are subject to stronger selective pressures [104]. This is consistent with our results, where the COI, COII, and COIII genes of the four skink species were almost all downregulated compared to the control group, indicating a high degree of conservation of Complex IV subunit genes.
In summary, we propose a preliminary model of two distinct thermal adaptation strategies in skinks: (1) low-latitude species may downregulate mitochondrial gene expression to mitigate oxidative stress, providing a survival advantage in enduring prolonged high-temperature conditions prevalent. (2) Higher-latitude species, conversely, may upregulate mitochondrial gene expression to actively counteract oxidative stress, offering a tactical advantage for coping with short-term thermal stress characteristic of temperate regions with seasonal temperature fluctuations. This divergence in gene regulation aligns with their respective ecological pressures, suggesting that latitude-driven environmental variability shapes mitochondrial functional plasticity as a key mechanism for thermal adaptation.

5. Conclusions

In this study, we observed two distinct thermal adaptation strategies among four species of skink. Species from lower latitudes, which are stressed at high temperatures for extended periods, tend to downregulate mitochondrial genome expression levels under high-temperature, reducing the expression of many genes in order to survive continuous high-temperature conditions. For instance, P. chinensis and Sc. modesta, which are from lower latitudes, exhibited more extensive gene suppression (six and nine downregulated genes respectively) than their higher latitude counterparts. Conversely, temperate species experiencing acute thermal fluctuations preferentially upregulated key metabolic genes. This pattern was evident in P. capito which showed four significantly upregulated genes. Notably, whereas Sc. modesta exhibited the co-upregulation of ND5 and ND6 under thermal challenge, its congener Sp. indicus displayed selective ND5 activation. We hypothesize that positive selection on ND6 in Sp. indicus may have reduced its thermal responsiveness. The phylogenetic reconstruction of these taxa provided an evolutionary framework for subsequent selection pressure analyses. The high sensitivity of skink mitochondrial genes to high temperatures can reflect the climatic characteristics of their living environments, serving as an important biological indicator for assessing climate change. Future studies should conduct in-depth investigations on the ND6 gene of Sphenomorphus species, including thermal stress experiments on additional species to obtain expression level data and further analyze its association with phylogenetic relationships. Further analysis should focus on identifying amino acid sites under positive selection in the ND6 gene and providing detailed explanations for its altered molecular mechanisms within the respiratory chain. Expanding the research scope to encompass broader taxonomic groups is necessary to elucidate more universally applicable thermal adaptation mechanisms.

Supplementary Materials

The following supporting information can be downloaded at: https://www.mdpi.com/article/10.3390/ani15070999/s1. Table S1. The species names and accession names included in this phylogenetic tree. Table S2. The best partition schemes and nucleotide substitution models for mitochondrial data using PartitionFinder. Table S3. RT-qPCR primer of the 13 mitochondrial PCGs and β-actin in this study. Note: “NBHW” means P. capito, “ZHSLZ” means P. chinensis, “HNTTX” means Sp. indicus, and “DLHW” means Sc. modesta.

Author Contributions

Conceptualization, X.W., L.Z., K.B.S., J.Z. and D.Y.; methodology, L.Z. and X.W.; validation, D.Y.; formal analysis, X.W. and L.Z.; resources, J.Z.; writing—original draft, X.W. and L.Z.; writing—review and editing, X.W., L.Z., K.B.S., J.Z. and D.Y.; visualization, X.W. and L.Z.; supervision, K.B.S.; project administration, D.Y.; funding acquisition, D.Y. All authors have read and agreed to the published version of the manuscript.

Funding

This research was supported by the National Natural Science Foundation of China (No. 31801963). The funders had no role in study design, data collection and analysis, decision to publish, or preparation of the manuscript.

Institutional Review Board Statement

All animal care protocols were previously approved by the Animal Care Committee (protocol # ZSDW2024038) of Zhejiang Normal University in accordance with guidelines provided by the Chinese Council on Animal Care.

Informed Consent Statement

Not applicable.

Data Availability Statement

Data to support this study are available from the National Center for Biotechnology Information (https://www.ncbi.nlm.nih.gov, accessed on 24 October 2024). The accession numbers are PP946409, PP946411, PV085447, and PV085448.

Acknowledgments

The authors are grateful for the contributions to visualization made by Hao Wu.

Conflicts of Interest

The authors declare no conflicts of interest.

References

  1. Ray, A.; Hughes, L.; Konisky, D.M.; Kaylor, C. Extreme weather exposure and support for climate change adaptation. Glob. Environ. Change 2017, 46, 104–113. [Google Scholar] [CrossRef]
  2. Johnson, N.C.; Xie, S.P.; Kosaka, Y.; Li, X. Increasing occurrence of cold and warm extremes during the recent global warming slowdown. Nat. Commun. 2018, 9, 1724. [Google Scholar] [CrossRef] [PubMed]
  3. Sinervo, B.; Méndez-de-la-Cruz, F.; Miles, D.B.; Heulin, B.; Bastiaans, E.; Villagrán-Santa Cruz, M.; Lara-Resendiz, R.; Martínez-Méndez, N.; Calderón-Espinosa, M.L.; Meza-Lázaro, R.N.; et al. Erosion of lizard diversity by climate change and altered thermal niches. Science 2010, 328, 894–899. [Google Scholar] [CrossRef]
  4. Dubey, S.; Pike, D.A.; Shine, R. Predicting the impacts of climate change on genetic diversity in an endangered lizard species. Clim. Change 2013, 117, 319–327. [Google Scholar] [CrossRef]
  5. Garcia-Porta, J.; Irisarri, I.; Kirchner, M.; Rodríguez, A.; Kirchhof, S.; Brown, J.L.; MacLeod, A.; Turner, A.P.; Ahmadzadeh, F.; Albaladejo, G.; et al. Environmental temperatures shape thermal physiology as well as diversification and genome-wide substitution rates in lizards. Nat. Commun. 2019, 10, 4077. [Google Scholar] [CrossRef] [PubMed]
  6. Chapple, D.G.; Roll, U.; Böhm, M.; Aguilar, R.; Amey, A.P.; Austin, C.C.; Baling, M.; Barley, A.J.; Bates, M.F.; Bauer, A.M.; et al. Conservation status of the world’s skinks (scincidae): Taxonomic and geographic patterns in extinction risk. Biol. Conserv. 2021, 257, 109101. [Google Scholar] [CrossRef]
  7. Meiri, S. Small, rare and trendy: Traits and biogeography of lizards described in the 21st century. J. Zool. 2016, 299, 251–261. [Google Scholar] [CrossRef]
  8. Blackburn, D.G. Evolution of viviparity in squamate reptiles: Reversibility reconsidered. J. Exp. Zoolog. B Mol. Dev. Evol. 2015, 324, 473–486. [Google Scholar] [CrossRef]
  9. Greer, A.E. Limb reduction in squamates: Identification of the lineages and discussion of the trends. J. Herpetol. 1991, 25, 166. [Google Scholar] [CrossRef]
  10. Caldwell, A.J.; While, G.M.; Wapstra, E. Plasticity of thermoregulatory behaviour in response to the thermal environment by widespread and alpine reptile species. Anim. Behav. 2017, 132, 217–227. [Google Scholar] [CrossRef]
  11. Artacho, P.; Saravia, J.; Perret, S.; Bartheld, J.L.; Le Galliard, J.F. Geographic variation and acclimation effects on thermoregulation behavior in the widespread lizard Liolaemus pictus. J. Therm. Biol. 2017, 63, 78–87. [Google Scholar] [CrossRef]
  12. Domínguez Guerrero, S.F.; Muñoz, M.M.; Pasten Téllez, D.D.J.; Arenas Moreno, D.M.; Rodríguez Miranda, L.A.; Manríquez Morán, N.L.; Méndez de La Cruz, F.R. Interactions between thermoregulatory behavior and physiological acclimatization in a wild lizard population. J. Therm. Biol. 2019, 79, 135–143. [Google Scholar] [CrossRef]
  13. Tewksbury, J.J.; Huey, R.B.; Deutsch, C.A. Putting the heat on tropical animals. Science 2008, 320, 1296–1297. [Google Scholar] [CrossRef] [PubMed]
  14. Sunday, J.M.; Bates, A.E.; Dulvy, N.K. Thermal tolerance and the global redistribution of animals. Nat. Clim. Change 2012, 2, 686–690. [Google Scholar] [CrossRef]
  15. Ghalambor, C.K. Are mountain passes higher in the tropics? Janzen’ s hypothesis revisited. Integr. Comp. Biol. 2006, 46, 5–17. [Google Scholar] [CrossRef]
  16. Calosi, P.; Bilton, D.T.; Spicer, J.I.; Votier, S.C.; Atfield, A. What determines a species’ geographical range? Thermal biology and latitudinal range size relationships in European diving beetles (Coleoptera: Dytiscidae). J. Anim. Ecol. 2010, 79, 194–204. [Google Scholar] [CrossRef] [PubMed]
  17. Camus, M.F.; Wolff, J.N.; Sgrò, C.M.; Dowling, D.K. Experimental support that natural selection has shaped the latitudinal distribution of mitochondrial haplotypes in Australian Drosophila melanogaster. Mol. Biol. Evol. 2017, 34, 2600–2612. [Google Scholar] [CrossRef]
  18. Wang, J.Y.; Zhang, L.H.; Hong, Y.H.; Cai, L.N.; Storey, K.B.; Zhang, J.Y.; Zhang, S.S.; Yu, D.N. How does mitochondrial protein-coding gene expression in Fejervarya kawamurai (Anura: Dicroglossidae) respond to extreme temperatures? Animals 2023, 13, 3015. [Google Scholar] [CrossRef]
  19. Sun, B.J.; Li, T.; Gao, J.; Ma, L.; Du, W.G. High incubation temperatures enhance mitochondrial energy metabolism in reptile embryos. Sci. Rep. 2015, 5, 8861. [Google Scholar] [CrossRef]
  20. Chung, D.J.; Morrison, P.R.; Bryant, H.J.; Jung, E.; Brauner, C.J.; Schulte, P.M. Intraspecific variation and plasticity in mitochondrial oxygen binding affinity as a response to environmental temperature. Sci. Rep. 2017, 7, 16238. [Google Scholar] [CrossRef]
  21. Stöck, M.; Moritz, C.; Hickerson, M.; Frynta, D.; Dujsebayeva, T.; Eremchenko, V.; Macey, J.R.; Papenfuss, T.J.; Wake, D.B. Evolution of mitochondrial relationships and biogeography of Palearctic green toads (Bufo viridis subgroup) with insights in their genomic plasticity. Mol. Phylogenet. Evol. 2006, 41, 663–689. [Google Scholar] [CrossRef] [PubMed]
  22. Sokolova, I.M. Ectotherm mitochondrial economy and responses to global warming. Acta Physiol. 2023, 237, e13950. [Google Scholar] [CrossRef]
  23. Friedman, J.R.; Nunnari, J. Mitochondrial form and function. Nature 2014, 505, 335–343. [Google Scholar] [CrossRef] [PubMed]
  24. Ballard, J.W.O.; Pichaud, N. Mitochondrial DNA: More than an evolutionary bystander. Funct. Ecol. 2014, 28, 218–231. [Google Scholar] [CrossRef]
  25. Sokolova, I. Mitochondrial adaptations to variable environments and their role in animals’ stress tolerance. Integr. Comp. Biol. 2018, 58, 519–531. [Google Scholar] [CrossRef]
  26. Monlun, M.; Hyernard, C.; Blanco, P.; Lartigue, L.; Faustin, B. Mitochondria as molecular platforms integrating multiple innate immune signalings. J. Mol. Biol. 2017, 429, 1–13. [Google Scholar] [CrossRef]
  27. Brown, J.A.; Sammy, M.J.; Ballinger, S.W. An evolutionary, or “mitocentric” perspective on cellular function and disease. Redox Biol. 2020, 36, 101568. [Google Scholar] [CrossRef]
  28. Pond, S.L.K.; Frost, S.D.W. A genetic algorithm approach to detecting lineage-specific variation in selection pressure. Mol. Biol. Evol. 2005, 22, 478–485. [Google Scholar] [CrossRef]
  29. Yang, Z.H. PAML 4: Phylogenetic analysis by maximum likelihood. Mol. Biol. Evol. 2007, 24, 1586–1591. [Google Scholar] [CrossRef]
  30. Zhang, X.; Chen, J.; Luo, H.Y.; Chen, X.; Zhong, J.; Ji, X. Climate-driven mitochondrial selection in lacertid lizards. Ecol. Evol. 2024, 14, e11176. [Google Scholar] [CrossRef]
  31. Jin, Y.T.; Brandt, D.Y.C.; Li, J.S.; Wo, Y.B.; Tong, H.J.; Shchur, V. Elevation as a selective force on mitochondrial respiratory chain complexes of the Phrynocephalus lizards in the Tibetan plateau. Curr. Zool. 2021, 67, 191–199. [Google Scholar] [CrossRef] [PubMed]
  32. Georgoulis, I.; Feidantsis, K.; Giantsis, I.A.; Kakale, A.; Bock, C.; Pörtner, H.O.; Sokolova, I.M.; Michaelidis, B. Heat hardening enhances mitochondrial potential for respiration and oxidative defence capacity in the mantle of thermally stressed Mytilus galloprovincialis. Sci. Rep. 2021, 11, 17098. [Google Scholar] [CrossRef] [PubMed]
  33. Jin, W.T.; Guan, J.Y.; Dai, X.Y.; Wu, G.J.; Zhang, L.P.; Storey, K.B.; Zhang, J.Y.; Zheng, R.Q.; Yu, D.N. Mitochondrial gene expression in different organs of Hoplobatrachus rugulosus from China and Thailand under low-temperature stress. BMC Zool. 2022, 7, 24. [Google Scholar] [CrossRef]
  34. Hong, Y.H.; Yuan, Y.N.; Li, K.; Storey, K.B.; Zhang, J.Y.; Zhang, S.S.; Yu, D.N. Differential mitochondrial genome expression of four hylid frog species under low-temperature stress and its relationship with Amphibian temperature adaptation. Int. J. Mol. Sci. 2024, 25, 5967. [Google Scholar] [CrossRef]
  35. Zhan, L.M.; He, J.Y.; Ding, L.Y.; Storey, K.B.; Zhang, J.Y.; Yu, D.N. Comparison of mitochondrial genome expression differences among four skink species distributed at different latitudes under low-temperature stress. Int. J. Mol. Sci. 2024, 25, 10637. [Google Scholar] [CrossRef]
  36. He, J.Y.; Zhan, L.M.; Meng, S.Q.; Wang, Z.; Gao, L.L.; Wang, W.J.; Storey, K.B.; Zhang, Y.P.; Yu, D.N. Differential mitochondrial genome expression of three sympatric lizards in response to low-temperature stress. Animals 2024, 14, 1158. [Google Scholar] [CrossRef] [PubMed]
  37. Zhan, L.M.; He, J.Y.; Meng, S.Q.; Guo, Z.Q.; Chen, Y.X.; Storey, K.B.; Zhang, J.Y.; Yu, D.N. Mitochondrial protein-coding gene expression in the lizard Sphenomorphus incognitus (Squamata: Scincidae) responding to different temperature stresses. Animals 2024, 14, 1671. [Google Scholar] [CrossRef]
  38. Hedges, S.B. The high-level classification of skinks (Reptilia, Squamata, Scincomorpha). Zootaxa 2014, 3765, 317–338. [Google Scholar] [CrossRef]
  39. Jiang, Y. A study on habit of Eumeces capito. Sichuan J. Zool. 2005, 24, 370–372. [Google Scholar]
  40. Zhao, E.; Adler, K. Herpetology of China; Society for the Study of Amphibians & Reptiles: Oxford, OH, USA, 1993. [Google Scholar]
  41. Hu, J.R.; Du, J.Z.; Ji, X. Pattern of plasma sex steroid hormone levels during the breeding season of male and female skink: Eumeces chinensis. Shi Yan Sheng Wu Xue Bao 2004, 37, 443–448. [Google Scholar]
  42. Ji, X. Some aspects of thermal biology of the skink (Eumeces chinensis). Chin. Sci. Abstr. Ser. B 1995, 6, 27. [Google Scholar]
  43. Ji, X.; Sun, P.Y.; Du, W.G. Selected body temperature, thermal tolerance and food assimilation in a Viviparous skink, Sphenomorphus indicus. Neth. J. Zool. 1996, 47, 103–110. [Google Scholar] [CrossRef]
  44. Cox, C.L.; Logan, M.L.; Nicholson, D.J.; Chung, A.K.; Rosso, A.A.; McMillan, W.O.; Cox, R.M. Species-specific expression of growth-regulatory genes in 2 anoles with divergent patterns of sexual size dimorphism. Integr. Org. Biol. 2022, 4, obac025. [Google Scholar] [CrossRef]
  45. Robinson, C.D.; Hale, M.D.; Cox, C.L.; John-Alder, H.B.; Cox, R.M. Effects of testosterone on gene expression are concordant between sexes but divergent across species of Sceloporus lizards. Am. Nat. 2024, 204, 517–532. [Google Scholar] [CrossRef] [PubMed]
  46. Dierckxsens, N.; Mardulyn, P.; Smits, G. NOVOPlasty: De novo assembly of organelle genomes from whole genome data. Nucleic Acids Res. 2016, 45, gkw955. [Google Scholar] [CrossRef]
  47. Jin, J.J.; Yu, W.B.; Yang, J.B.; Song, Y.; de Pamphilis, C.W.; Yi, T.S.; Li, D.Z. GetOrganelle: A fast and versatile toolkit for accurate de novo assembly of organelle genomes. Genome Biol. 2020, 21, 241. [Google Scholar] [CrossRef]
  48. Kumar, S.; Stecher, G.; Tamura, K. MEGA7: Molecular evolutionary genetics analysis version 7.0 for bigger datasets. Mol. Biol. Evol. 2016, 33, 1870–1874. [Google Scholar] [CrossRef]
  49. Zhan, L.M.; Chen, Y.X.; He, J.Y.; Guo, Z.Q.; Wu, L.; Storey, K.B.; Zhang, J.Y.; Yu, D.N. The phylogenetic relationships of major lizard families using mitochondrial genomes and selection pressure analyses in Anguimorpha. Int. J. Mol. Sci. 2024, 25, 8464. [Google Scholar] [CrossRef]
  50. Chen, L.; Lin, Y.F.; Xiao, Q.; Lin, Y.; Du, Y.; Lin, C.X.; Ward-Fear, G.; Hu, C.C.; Qu, Y.F.; Li, H. Characterization of the complete mitochondrial genome of the many-lined sun skink (Eutropis multifasciata) and comparison with other Scincomorpha species. Genomics 2021, 113, 2526–2536. [Google Scholar] [CrossRef]
  51. Kumazawa, Y.; Nishida, M. Complete mitochondrial DNA sequences of the green turtle and blue-tailed mole skink: Statistical evidence for Archosaurian affinity of turtles. Mol. Biol. Evol. 1999, 16, 784–792. [Google Scholar] [CrossRef]
  52. Song, T.; Zhang, C.L.; Huang, X.; Zhang, B.W. Complete mitochondrial genome of Eumeces elegans (Squamata: Scincidae). Mitochondrial DNA Part A 2016, 27, 719–720. [Google Scholar] [CrossRef]
  53. Wu, N.; Cai, B.; Chen, M.L.; Guo, X.G. Next-generation sequencing yields a nearly complete mitochondrial genome of Plestiodon liui (Reptilia, Squamata, Scincidae) endemic to China. Mitochondrial DNA Part B 2020, 5, 3637–3638. [Google Scholar] [CrossRef]
  54. Chen, M.L.; Liu, J.L.; Chen, D.L.; Guo, X.G. The complete mitochondrial genome of a blue-tailed skink (Plestiodon tunganus) endemic to Sichuan Basin. Mitochondrial DNA Part B 2019, 4, 1109–1110. [Google Scholar] [CrossRef]
  55. Wu, L.; Tong, Y.; Ayivi, S.P.G.; Storey, K.B.; Zhang, J.Y.; Yu, D.N. The complete mitochondrial genomes of three Sphenomorphinae species (Squamata: Scincidae) and the selective pressure analysis on mitochondrial genomes of limbless Isopachys gyldenstolpei. Animals 2022, 12, 2015. [Google Scholar] [CrossRef] [PubMed]
  56. Kumazawa, Y. Mitochondrial genomes from major lizard families suggest their phylogenetic relationships and ancient radiations. Gene 2007, 388, 19–26. [Google Scholar] [CrossRef]
  57. Castoe, T.A.; Jiang, Z.J.; Gu, W.; Wang, Z.O.; Pollock, D.D. Adaptive evolution and functional redesign of core metabolic proteins in snakes. PLoS ONE 2008, 3, e2201. [Google Scholar] [CrossRef]
  58. Kumazawa, Y. Mitochondrial genome of the Komodo Dragon: Efficient sequencing method with reptile-oriented primers and novel gene rearrangements. DNA Res. 2004, 11, 115–125. [Google Scholar] [CrossRef]
  59. Xiang, C.Y.; Gao, F.L.; Jakovlić, I.; Lei, H.P.; Hu, Y.; Zhang, H.; Zou, H.; Wang, G.T.; Zhang, D. Using phylosuite for molecular phylogeny and tree-based analyses. iMeta 2023, 2, e87. [Google Scholar] [CrossRef]
  60. Katoh, K.; Standley, D.M. MAFFT multiple sequence alignment software version 7: Improvements in performance and usability. Mol. Biol. Evol. 2013, 30, 772–780. [Google Scholar] [CrossRef]
  61. Castresana, J. Selection of conserved blocks from multiple alignments for their use in phylogenetic analysis. Mol. Biol. Evol. 2000, 17, 540–552. [Google Scholar] [CrossRef]
  62. Xia, X.H. DAMBE7: New and improved tools for data analysis in molecular biology and evolution. Mol. Biol. Evol. 2018, 35, 1550–1552. [Google Scholar] [CrossRef]
  63. Lanfear, R.; Calcott, B.; Ho, S.Y.W.; Guindon, S. PartitionFinder: Combined selection of partitioning schemes and substitution models for phylogenetic analyses. Mol. Biol. Evol. 2012, 29, 1695–1701. [Google Scholar] [CrossRef] [PubMed]
  64. Ronquist, F.; Teslenko, M.; Van Der Mark, P.; Ayres, D.L.; Darling, A.; Höhna, S.; Larget, B.; Liu, L.; Suchard, M.A.; Huelsenbeck, J.P. MrBayes 3.2: Efficient bayesian phylogenetic inference and model choice across a large model space. Syst. Biol. 2012, 61, 539–542. [Google Scholar] [CrossRef] [PubMed]
  65. Kozlov, A.M.; Darriba, D.; Flouri, T.; Morel, B.; Stamatakis, A. RAxML-ng: A fast, scalable, and user-friendly tool for maximum likelihood phylogenetic inference. Bioinformatics 2019, 35, 4453–4455. [Google Scholar]
  66. Gao, F.L.; Chen, C.J.; Arab, D.A.; Du, Z.G.; He, Y.H.; Ho, S.Y.W. EasyCodeML: A visual tool for analysis of selection using codeml. Ecol. Evol. 2019, 9, 3891–3898. [Google Scholar] [CrossRef] [PubMed]
  67. Weadick, C.J.; Chang, B.S.W. An improved likelihood ratio test for detecting site-specific functional divergence among clades of protein-coding genes. Mol. Biol. Evol. 2012, 29, 1297–1300. [Google Scholar] [CrossRef]
  68. Zang, X.Y.; Guo, J.L.; Geng, X.F.; Li, P.F.; Sun, J.Y.; Wang, Q.W.; Xu, C.S. Proteome analysis of the liver in the chinese fire-bellied newt cynops orientalis. Genet. Mol. Res. 2016, 15, 10–4238. [Google Scholar] [CrossRef]
  69. Biederman, J.; Yee, J.; Cortes, P. Validation of internal control genes for gene expression analysis in diabetic glomerulosclerosis. Kidney Int. 2004, 66, 2308–2314. [Google Scholar] [CrossRef]
  70. Cai, L.N.; Zhang, L.H.; Lin, Y.J.; Wang, J.Y.; Storey, K.B.; Zhang, J.Y.; Yu, D.N. Two-fold ND5 genes, three-fold control regions, lncRNA, and the “missing” ATP8 found in the mitogenomes of Polypedates megacephalus (Rhacophridae: Polypedates). Animals 2023, 13, 2857. [Google Scholar] [CrossRef]
  71. Moeller, A.H.; Ivey, K.; Cornwall, M.B.; Herr, K.; Rede, J.; Taylor, E.N.; Gunderson, A.R. The lizard gut microbiome changes with temperature and is associated with heat tolerance. Appl. Environ. Microbiol. 2020, 86, e01181-20. [Google Scholar] [CrossRef]
  72. May, R.A.; Stevenson, K.J. Software review of origin 8. J. Am. Chem. Soc. 2009, 131, 872. [Google Scholar] [CrossRef]
  73. Austin, J.J.; Arnold, E.N. Using ancient and recent DNA to explore relationships of extinct and endangered Leiolopisma skinks (Reptilia: Scincidae) in the Mascarene islands. Mol. Phylogenet. Evol. 2006, 39, 503–511. [Google Scholar] [CrossRef] [PubMed]
  74. Whiting, A. Phylogenetic relationships and limb loss in sub-Saharan African Scincine lizards (Squamata: Scincidae). Mol. Phylogenet. Evol. 2003, 29, 582–598. [Google Scholar] [CrossRef] [PubMed]
  75. Linkem, C.W.; Hesed, K.M.; Diesmos, A.C.; Brown, R.M. Species boundaries and cryptic lineage diversity in a Philippine forest skink complex (Reptilia; Squamata; Scincidae: Lygosominae). Mol. Phylogenet. Evol. 2010, 56, 572–585. [Google Scholar] [CrossRef]
  76. Brandt, U. Energy converting NADH: Quinone oxidoreductase (complex I). Annu. Rev. Biochem. 2006, 75, 69–92. [Google Scholar] [CrossRef]
  77. Wirth, C.; Brandt, U.; Hunte, C.; Zickermann, V. Structure and function of mitochondrial complex I. Biochim. Biophys. Acta BBA Bioenerg. 2016, 1857, 902–914. [Google Scholar] [CrossRef]
  78. Bridges, H.R.; Birrell, J.A.; Hirst, J. The mitochondrial-encoded subunits of respiratory complex I (NADH: Ubiquinone oxidoreductase): Identifying residues important in mechanism and disease. Biochem. Soc. Trans. 2011, 39, 799–806. [Google Scholar] [CrossRef]
  79. Vartak, R.; Deng, J.; Fang, H.Z.; Bai, Y.D. Redefining the roles of mitochondrial DNA-encoded subunits in respiratory complex I assembly. Biochim. Biophys. Acta BBA Mol. Basis Dis. 2015, 1852, 1531–1539. [Google Scholar] [CrossRef]
  80. Bai, Y.D.; Attardi, G. The mtDNA-encoded ND6 subunit of mitochondrial NADH dehydrogenase is essential for the assembly of the membrane arm and the respiratory function of the enzyme. EMBO J. 1998, 17, 4848–4858. [Google Scholar] [CrossRef]
  81. Sazanov, L.A.; Hinchliffe, P. Structure of the hydrophilic domain of respiratory complex I from Thermus thermophilus. Science 2006, 311, 1430–1436. [Google Scholar] [CrossRef]
  82. Basu, U.; Bostwick, A.M.; Das, K.; Dittenhafer-Reed, K.E.; Patel, S.S. Structure, mechanism, and regulation of mitochondrial dna transcription initiation. J. Biol. Chem. 2020, 295, 18406–18425. [Google Scholar] [CrossRef] [PubMed]
  83. Hillen, H.S.; Morozov, Y.I.; Sarfallah, A.; Temiakov, D.; Cramer, P. Structural basis of mitochondrial transcription initiation. Cell 2017, 171, 1072–1081.e10. [Google Scholar] [CrossRef]
  84. Seebacher, F.; Murray, S.A.; Else, P.L. Thermal acclimation and regulation of metabolism in a reptile (Crocodylus porosus): The importance of transcriptional mechanisms and membrane composition. Physiol. Biochem. Zool. 2009, 82, 766–775. [Google Scholar] [CrossRef] [PubMed]
  85. Silva, G.; Lima, F.P.; Martel, P.; Castilho, R. Thermal adaptation and clinal mitochondrial DNA variation of European anchovy. Proc. R. Soc. B Biol. Sci. 2014, 281, 20141093. [Google Scholar] [CrossRef]
  86. Lamb, A.M.; Gan, H.M.; Greening, C.; Joseph, L.; Lee, Y.P.; Morán-Ordóñez, A.; Sunnucks, P.; Pavlova, A. Climate-driven mitochondrial selection: A test in Australian songbirds. Mol. Ecol. 2018, 27, 898–918. [Google Scholar] [CrossRef]
  87. Ben Slimen, H.; Schaschl, H.; Knauer, F.; Suchentrunk, F. Selection on the mitochondrial ATP synthase 6 and the NADH dehydrogenase 2 genes in hares (Lepus capensis L., 1758) from a steep ecological gradient in North Africa. BMC Evol. Biol. 2017, 17, 46. [Google Scholar] [CrossRef]
  88. Wu, Z.; Sainz, A.G.; Shadel, G.S. Mitochondrial DNA: Cellular genotoxic stress sentinel. Trends Biochem. Sci. 2021, 46, 812–821. [Google Scholar] [CrossRef] [PubMed]
  89. Gustafsson, C.M.; Falkenberg, M.; Larsson, N.G. Maintenance and expression of mammalian mitochondrial DNA. Annu. Rev. Biochem. 2016, 85, 133–160. [Google Scholar] [CrossRef]
  90. Okoye, C.N.; Koren, S.A.; Wojtovich, A.P. Mitochondrial complex I ROS production and redox signaling in hypoxia. Redox Biol. 2023, 67, 102926. [Google Scholar] [CrossRef]
  91. Pharaoh, G.; Ostrom, E.L.; Stuppard, R.; Campbell, M.; Borghardt, J.M.; Franti, M.; Filareto, A.; Marcinek, D.J. A novel mitochondrial complex I ROS inhibitor partially improves muscle regeneration in adult but not old mice. Redox Biol. 2023, 64, 102770. [Google Scholar] [CrossRef]
  92. Okoye, C.; Onukwufor, J.; Wojtovich, A. Mechanisms of mitochondrial complex I-ROS mediated behavioral response. Free Radic. Biol. Med. 2022, 192, 89. [Google Scholar] [CrossRef]
  93. Chai, L.H.; Chen, A.X.; Luo, P.P.; Zhao, H.F.; Wang, H.Y. Histopathological changes and lipid metabolism in the liver of Bufo gargarizans tadpoles exposed to Triclosan. Chemosphere 2017, 182, 255–266. [Google Scholar] [CrossRef] [PubMed]
  94. Wu, C.; Zhang, Y.H.; Chai, L.H.; Wang, H.Y. Histological changes, lipid metabolism and oxidative stress in the liver of Bufo gargarizans exposed to cadmium concentrations. Chemosphere 2017, 179, 337–346. [Google Scholar] [CrossRef] [PubMed]
  95. Downs, C.A.; Heckathorn, S.A. The mitochondrial small heat-shock protein protects NADH: Ubiquinone oxidoreductase of the electron transport chain during heat stress in plants. FEBS Lett. 1998, 430, 246–250. [Google Scholar] [CrossRef]
  96. Michaelsen, J.; Fago, A.; Bundgaard, A. High temperature impairs mitochondrial function in rainbow trout cardiac mitochondria. J. Exp. Biol. 2021, 224, jeb242382. [Google Scholar] [CrossRef]
  97. Brand, M.D.; Chien, L.F.; Ainscow, E.K.; Rolfe, D.F.S.; Porter, R.K. The causes and functions of mitochondrial proton leak. Biochim. Biophys. Acta BBA Bioenerg. 1994, 1187, 132–139. [Google Scholar] [CrossRef]
  98. Vaanholt, L.M.; Speakman, J.R.; Garland, T.; Lobley, G.E.; Visser, G.H. Protein synthesis and antioxidant capacity in aging mice: Effects of long-term voluntary exercise. Physiol. Biochem. Zool. 2008, 81, 148–157. [Google Scholar] [CrossRef]
  99. Okado-Matsumoto, A.; Fridovich, I. Subcellular distribution of superoxide dismutases (SOD) in rat liver. J. Biol. Chem. 2001, 276, 38388–38393. [Google Scholar] [CrossRef]
  100. Ighodaro, O.M.; Akinloye, O.A. First line defence antioxidants-superoxide dismutase (SOD), catalase (CAT) and glutathione peroxidase (GPX): Their fundamental role in the entire antioxidant defence grid. Alex. J. Med. 2018, 54, 287–293. [Google Scholar] [CrossRef]
  101. Guppy, M.; Fuery, C.J.; Flanigan, J.E. Biochemical principles of metabolic depression. Comp. Biochem. Physiol. Part B Comp. Biochem. 1994, 109, 175–189. [Google Scholar] [CrossRef]
  102. Garvin, M.R.; Bielawski, J.P.; Sazanov, L.A.; Gharrett, A.J. Review and meta-analysis of natural selection in mitochondrial complex I in metazoans. J. Zool. Syst. Evol. Res. 2015, 53, 1–17. [Google Scholar] [CrossRef]
  103. Morales, H.E.; Pavlova, A.; Joseph, L.; Sunnucks, P. Positive and purifying selection in mitochondrial genomes of a bird with mitonuclear discordance. Mol. Ecol. 2015, 24, 2820–2837. [Google Scholar] [CrossRef] [PubMed]
  104. Nabholz, B.; Ellegren, H.; Wolf, J.B.W. High levels of gene expression explain the strong evolutionary constraint of mitochondrial protein-coding genes. Mol. Biol. Evol. 2013, 30, 272–284. [Google Scholar] [CrossRef] [PubMed]
Figure 1. (A) Collection sites and geographical distribution by province (China) for P. capito, P. chinensis, Sp. indicus, and Sc. modesta. Solid lines represent provinces where the species have been observed, whereas dashed lines indicate provinces where they have not been observed. Different colors represent different species. Blue represents P. capito, with collection sites located in Nanyang, Henan (33°03′ N, 112°29′ E). Yellow represents P. chinensis, with collection sites in Guangzhou, Guangdong (23°10′ N, 113°17′ E). Red represents Sp. indicus, with collection sites coinciding with those of P. capito. Green represents Sc. modesta, with collection sites in Xianning, Hubei (29°34′ N, 114°29′ E). (B) Map of the average temperature in May in China, where red indicates a high temperature, and blue indicates a low temperature. (https://www.worldclim.org/data, accessed on 6 November 2024). ArcMap v10.8 (Esri, Redlands, CA, USA) was used to make the maps for this study.
Animals 15 00999 g001
Figure 2. A phylogenetic tree was constructed using 13 mitochondrial PCGs from 27 species of Scincidae and 4 outgroup species using BI and ML methods. The numbers at the nodes represent the support values for those nodes, with the first number indicating the posterior probability from the BI tree and the second number representing the bootstrap value from the ML tree. Species grouped under the same color on the right side of the tree belong to the same taxonomic unit. The species Sp. indicus used in this study corresponds to Sphenomorphus indicus HN as depicted in the figure.
Animals 15 00999 g002
Figure 3. Mitochondrial-related mRNA expression in Plestiodon capito (A), Plestiodon chinensis (B), Sphenomorphus indicus (C), and Scincella modesta (D) under high-temperature stress. The expression levels of 13 mitochondrial PCGs under control conditions (25 °C) and high-temperature stress (34 °C). The x–axis indicates the individual genes, and the y-axis denotes the relative mRNA expression levels. Standard Error (SE) is used as the error bars. An asterisk “*” signifies a significant difference (p < 0.05), whereas “**” signifies a strong significant difference (p < 0.01). The expression levels were standardized relative to the β-actin gene as the internal control gene.
Animals 15 00999 g003
Figure 4. Integrating the expression levels of 13 PCGs from P. capito, P. chinensis, Sp. indicus, and Sc. modesta. The data are presented in the form of a heatmap. Red signifies high expression levels, blue signifies low expression levels, and white was used as the baseline to represent expression levels that are consistent with the control group. Asterisks denote significant differences in expression levels relative to the control group: “*” signifies p < 0.05, and “**” signifies p < 0.01.
Animals 15 00999 g004
Table 1. Using the CmC versus M2a_rel model, evolutionary clade model calculations were performed on 13 PCGs with the species under study as the foreground branch. Significant LRT results with p values < 0.05 are indicated with an asterisk “*”, and strong significant LRT results with p values < 0.01 are indicated with “**”. Data were filtered to include only significant results.
SpeciesGenesModelsNumber of
Parameters
Log-Likelihood
Values
Parameter EstimatesLRT p Values
Plestiodon capitoND4CmC
M2a-rel
58
57
−17,582.82
−17,587.35
ω0 = 0.01, p0 = 0.66; ω1 = 1.00, p1 = 0.03; ω2 = 0.53, p2 = 0.31
ω0 = 0.01, p0 = 0.65; ω1 = 1.00, p1 = 0.04; ω2 = 0.15, p2 = 0.31
0.00 **
Plestiodon chinensisND2CmC
M2a-rel
58
57
−13,841.47
−13,845.21
ω0 = 0.01, p0 = 0.54; ω1 = 1.00, p1 = 0.01; ω2 = 0.22, p2 = 0.45
ω0 = 0.01, p0 = 0.54; ω1 = 1.00, p1 = 0.01; ω2 = 0.16, p2 = 0.45
0.00 **
Plestiodon chinensisND5CmC
M2a-rel
58
57
−23,658.81
−23,660.96
ω0 = 0.01, p0 = 0.62; ω1 = 1.00, p1 = 0.04; ω2 = 0.30, p2 = 0.34
ω0 = 0.01, p0 = 0.62; ω1 = 1.00, p1 = 0.03; ω2 = 0.19, p2 = 0.34
0.04 *
Sphenomorphus indicusND6CmC
M2a-rel
58
57
−6020.09
−6024.34
ω0 = 0.01, p0 = 0.70; ω1 = 1.00, p1 = 0.03; ω2 = 9.82, p2 = 0.27
ω0 = 0.01, p0 = 0.70; ω1 = 1.00, p1 = 0.03; ω2 = 0.12, p2 = 0.27
0.00 **
Scincella modestaCOICmC
M2a-rel
58
57
−15,138.68
−15,141.70
ω0 = 0.00, p0 = 0.88; ω1 = 1.00, p1 = 0.00; ω2 = 0.47, p2 = 0.12
ω0 = 0.00, p0 = 0.88; ω1 = 1.00, p1 = 0.00; ω2 = 0.11, p2 = 0.12
0.01 *
Scincella modestaND4CmC
M2a-rel
58
57
−17,585.31
−17,587.35
ω0 = 0.01, p0 = 0.65; ω1 = 1.00, p1 = 0.04; ω2 = 0.65, p2 = 0.31
ω0 = 0.01, p0 = 0.65; ω1 = 1.00, p1 = 0.04; ω2 = 0.15, p2 = 0.31
0.04 *
Disclaimer/Publisher’s Note: The statements, opinions and data contained in all publications are solely those of the individual author(s) and contributor(s) and not of MDPI and/or the editor(s). MDPI and/or the editor(s) disclaim responsibility for any injury to people or property resulting from any ideas, methods, instructions or products referred to in the content.

