
Impacts of the COVID-19 Pandemic on Wildlife in Huangshan Scenic Area, Anhui Province, China


 , ,
, ,
Simple Summary
Abstract
1. Introduction
2. Materials and Methods
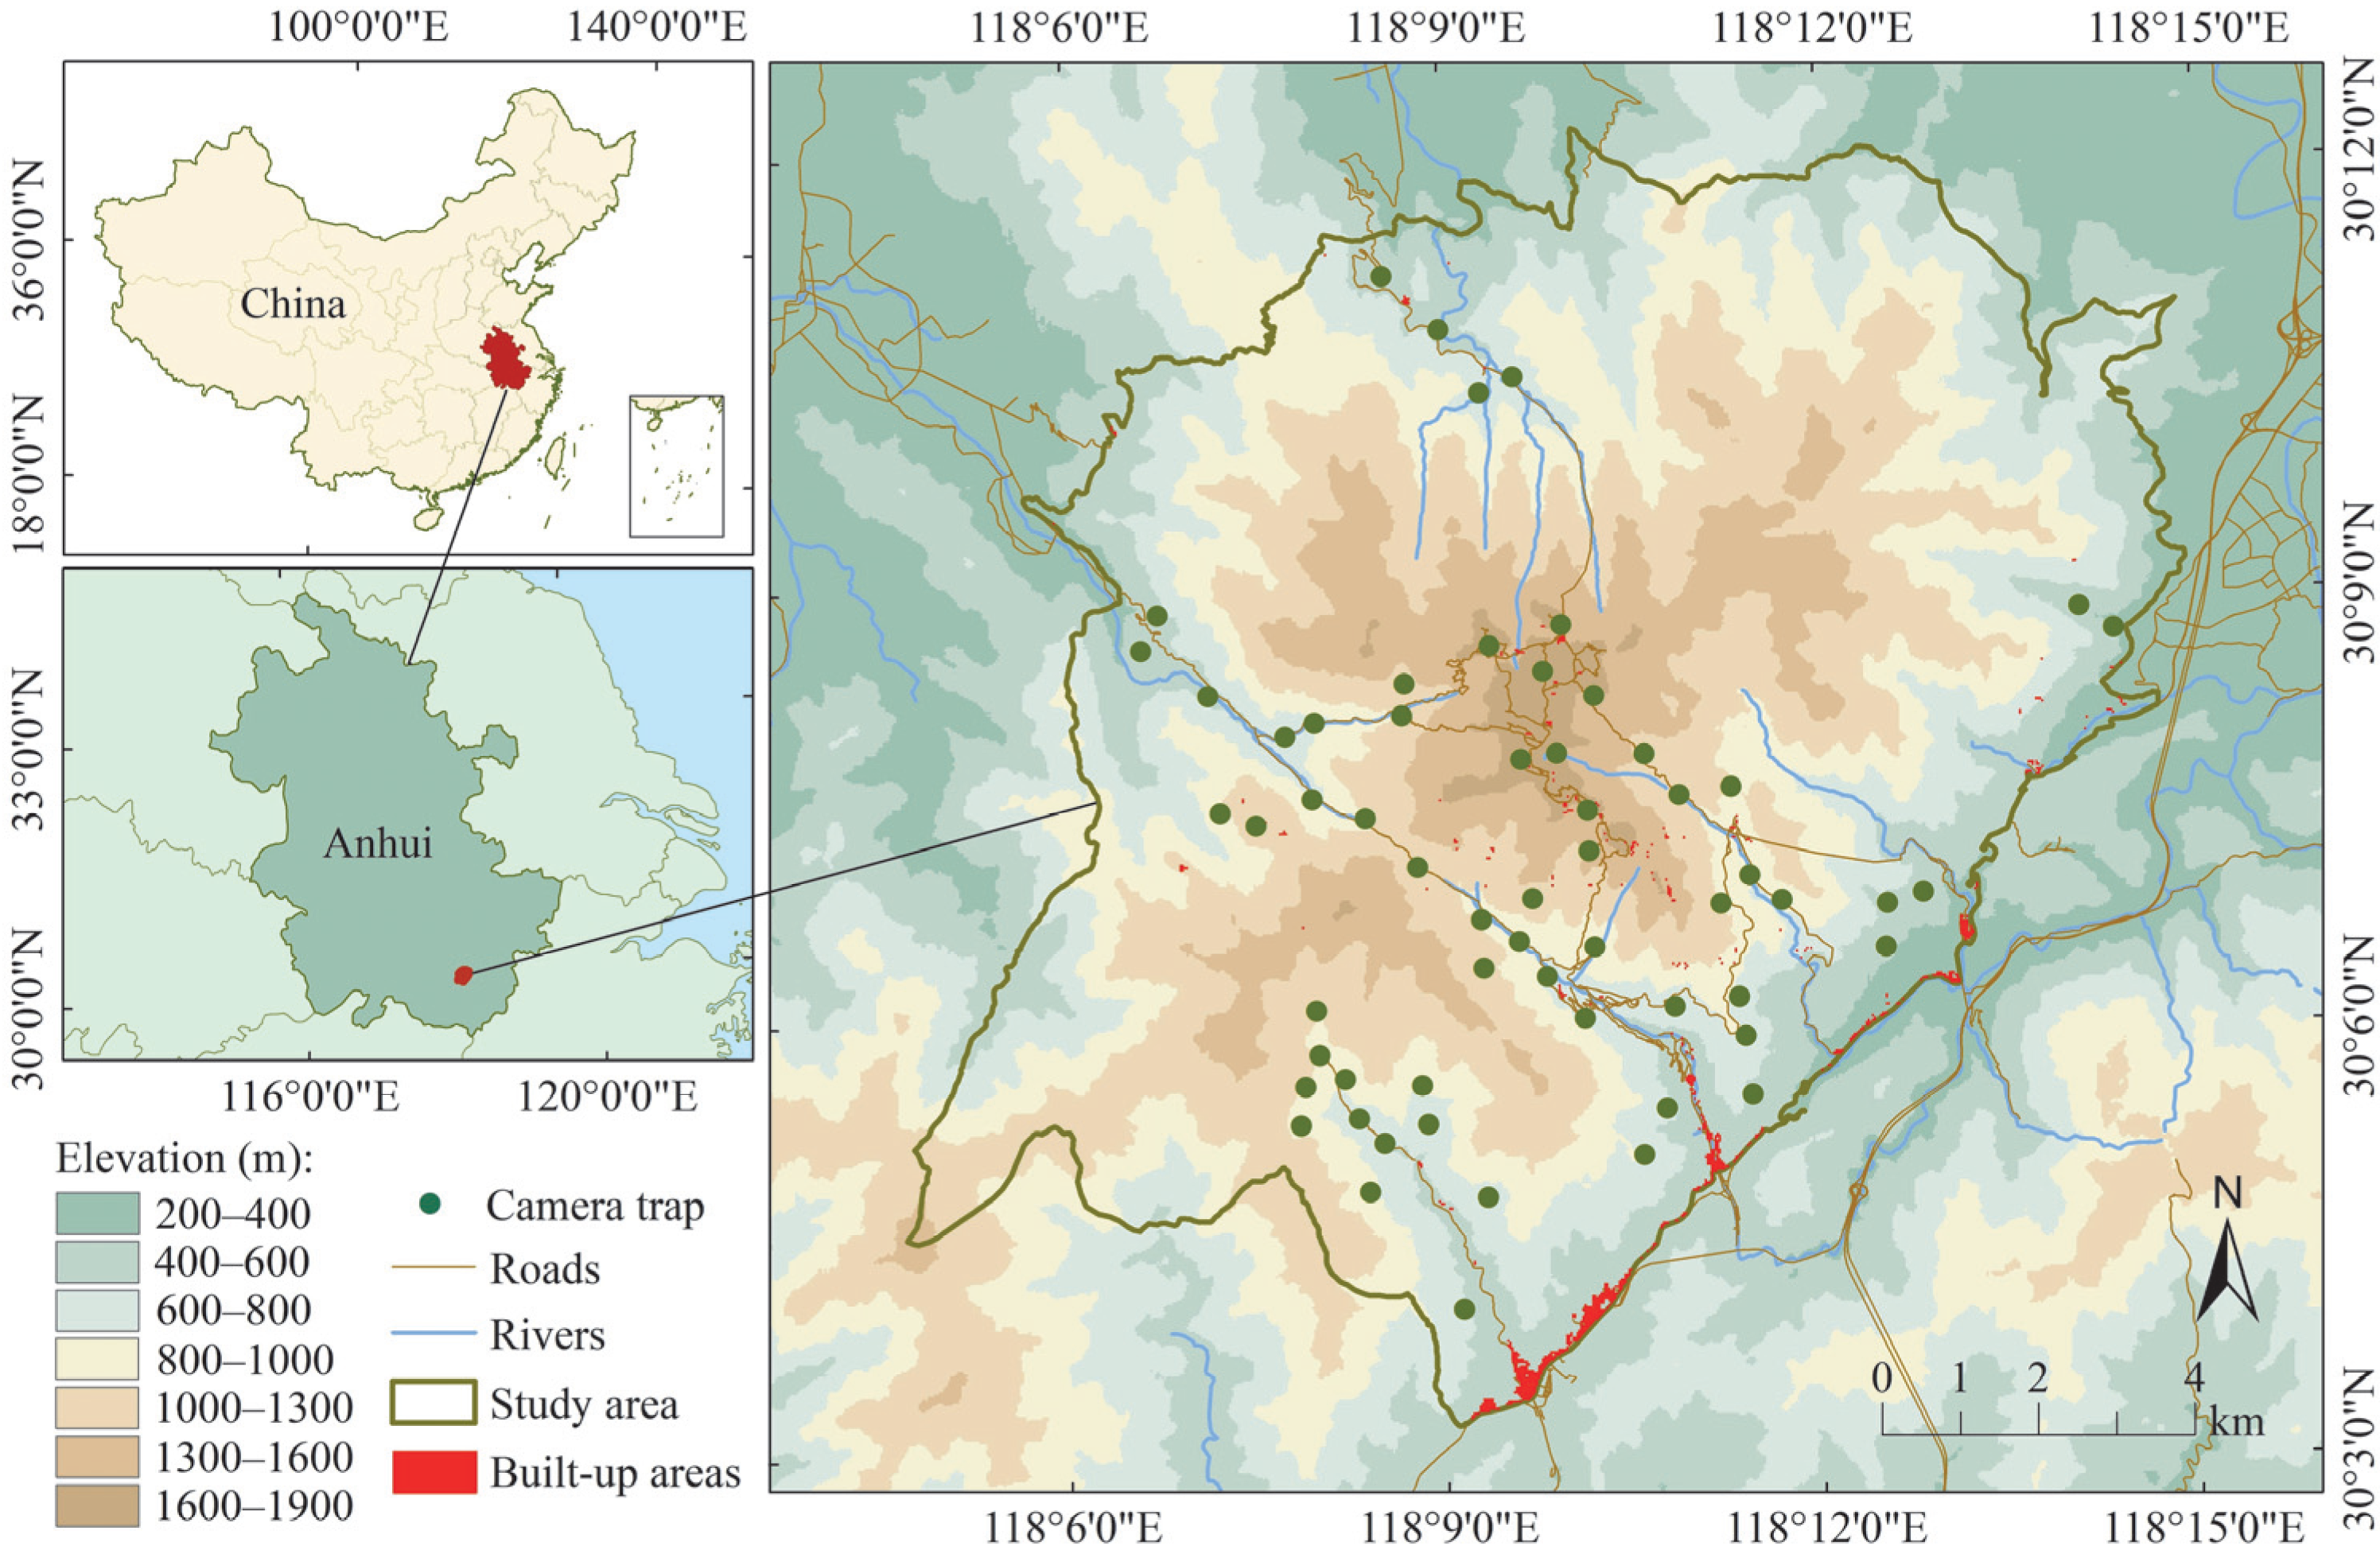
2.1. Study Area
2.2. Data Collection
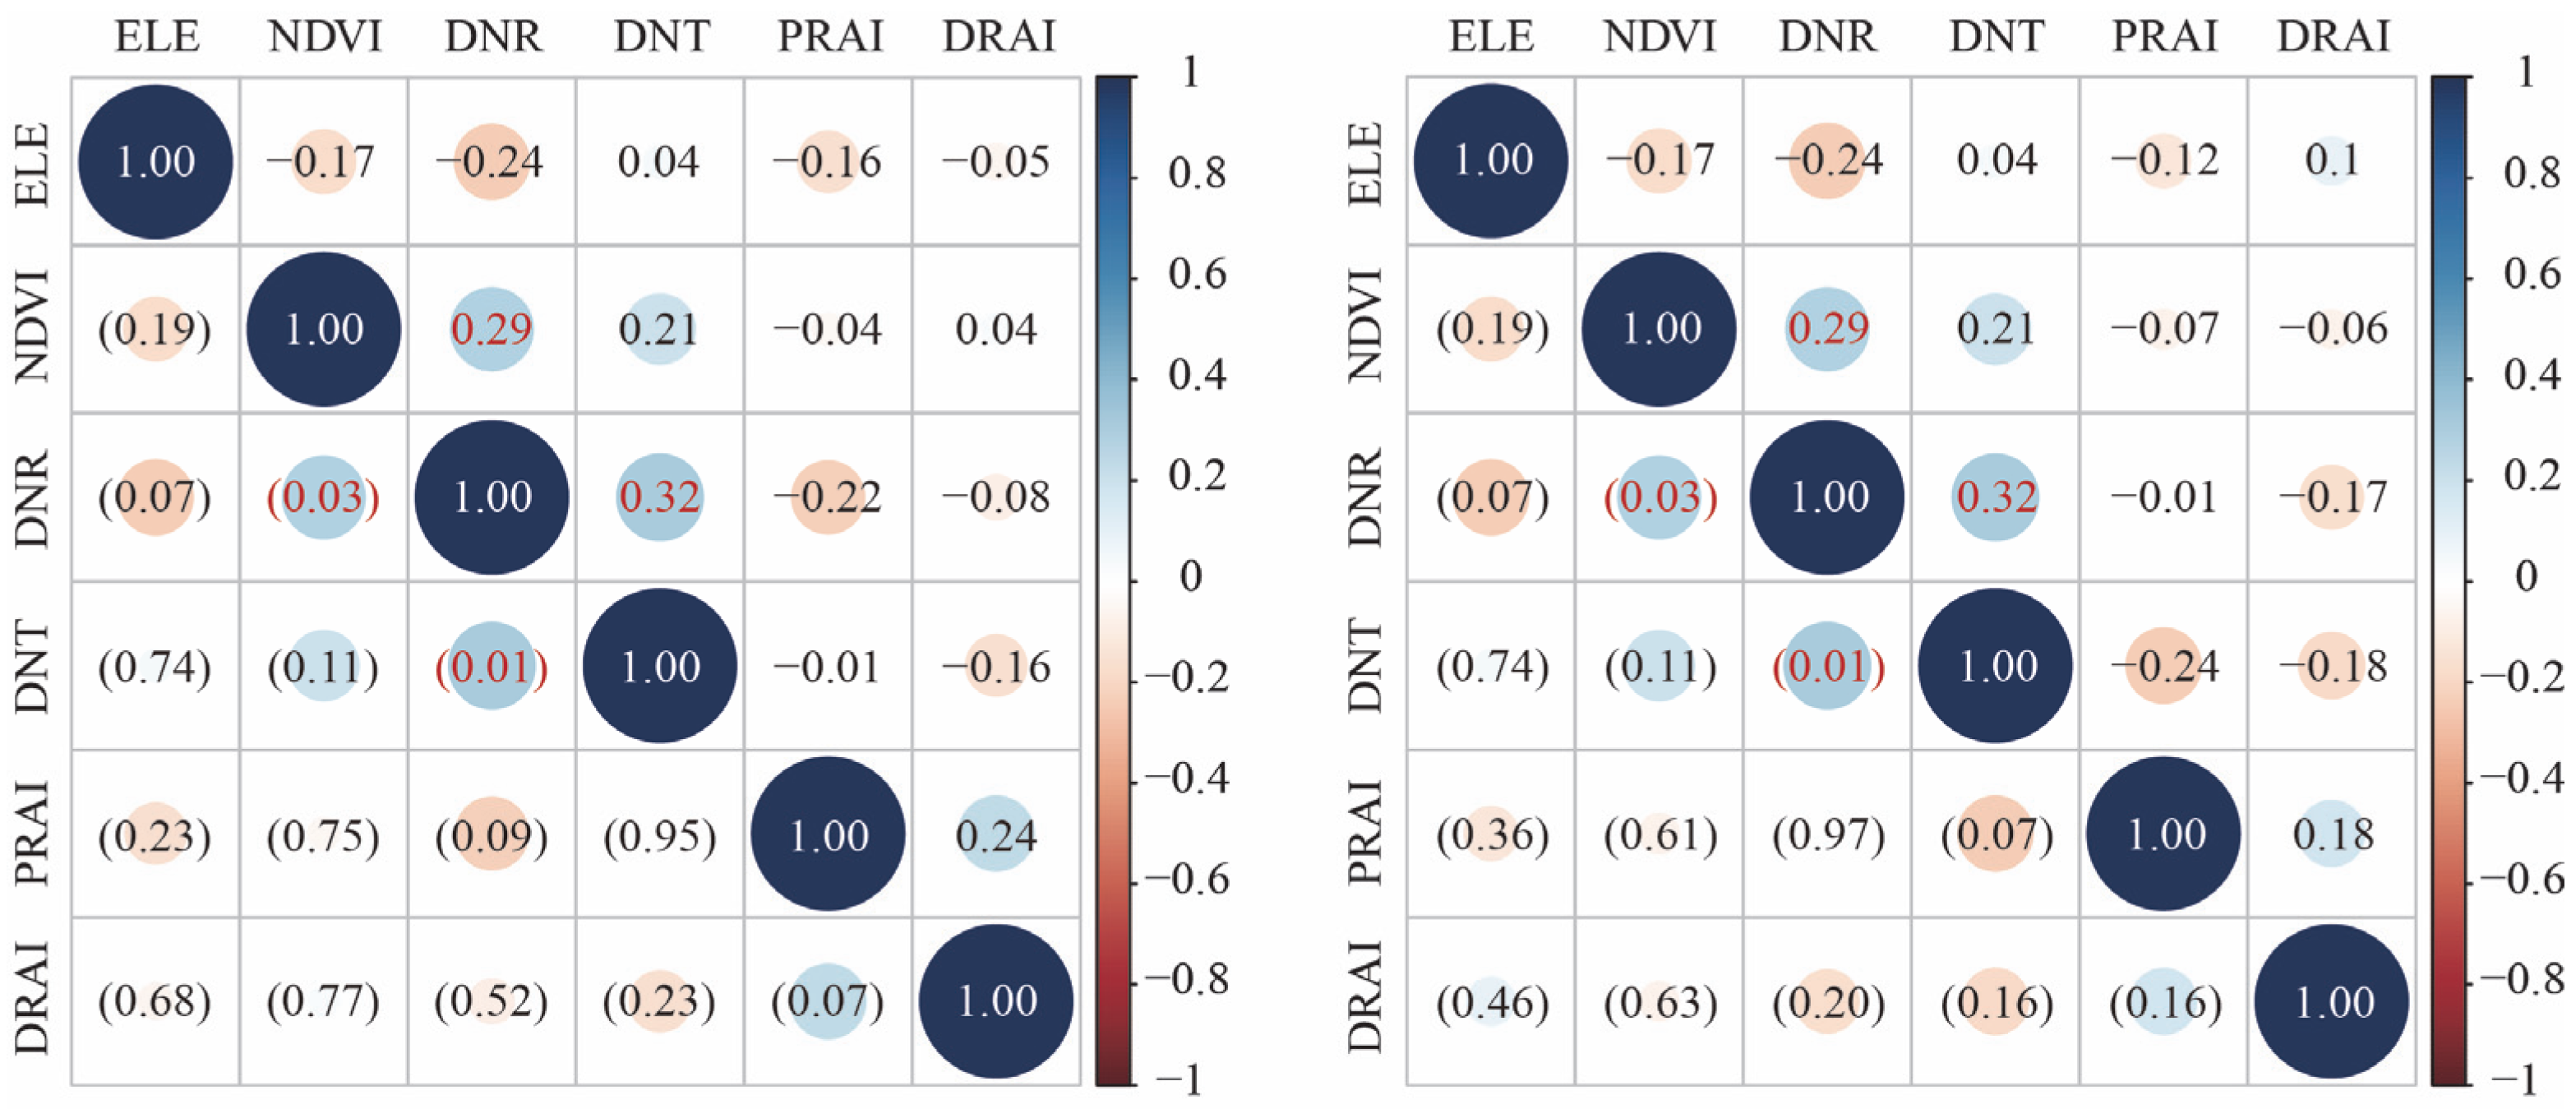
2.3. Data Analysis
2.3.1. Relative Abundance Index
2.3.2. Occupancy and Detection Probability
2.3.3. Activity Pattern Overlap
3. Results
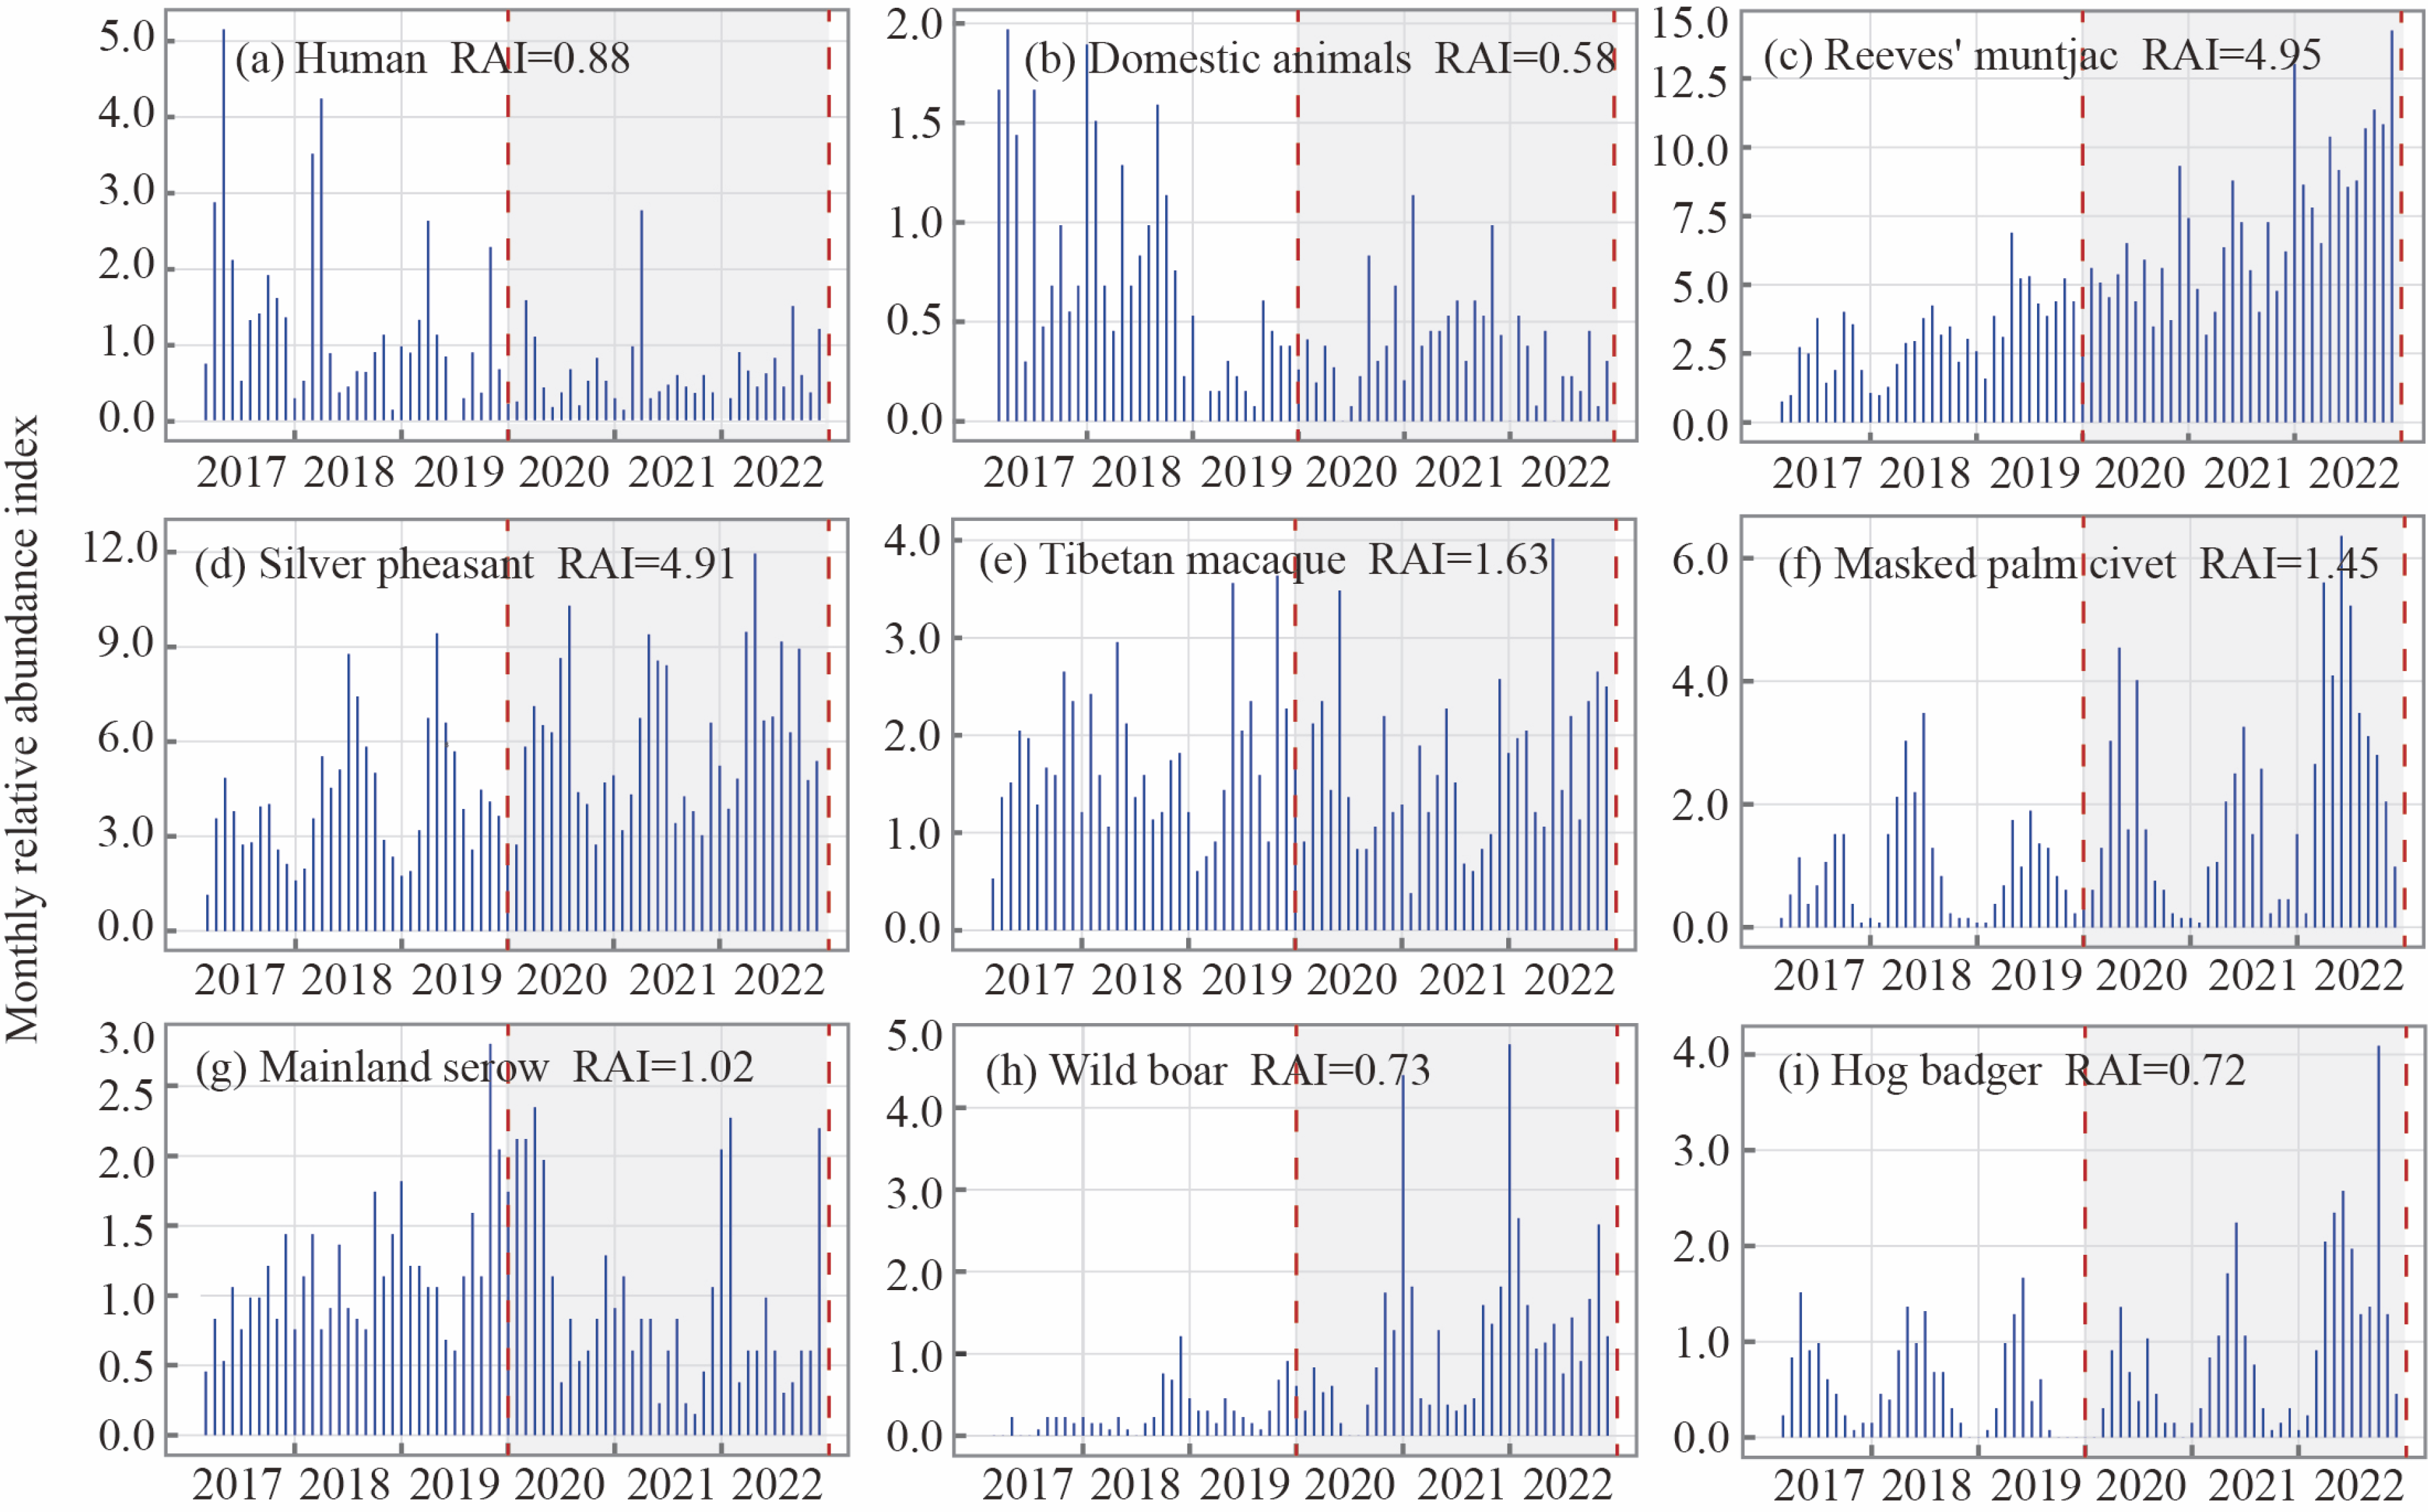
3.1. RAI
3.2. Habitat Use
3.3. Temporal Overlap
4. Discussion
5. Conclusions
Author Contributions
Funding
Institutional Review Board Statement
Informed Consent Statement
Data Availability Statement
Acknowledgments
Conflicts of Interest
Abbreviations
| AIC | Akaike information criterion |
| BP | Before pandemic |
| DP | During pandemic |
| NRAI | Night-time relative abundance index |
| RAI | Relative abundance index |
| RR | Risk ratio |
Appendix A
References
- Liu, K.; He, J.; Zhang, J.H.; Feng, J.; Yu, Q.; Gu, C.M.; Wu, H.L. Mammal resource status in the mountain forest ecosystems of southern Anhui Province based on camera trap data. Biodivers. Sci. 2017, 25, 896–903. [Google Scholar] [CrossRef]
- Huang, S.; Hu, Q.; Wang, S.; Li, H. Ecological risk assessment of world heritage sites using RS and GIS: A case study of Huangshan Mountain, China. Chin. Geogr. Sci. 2022, 32, 808–823. [Google Scholar] [CrossRef]
- Singh, S. Hunagshan Scenic Area in China: Towards Sustainable Tourism Development. Tour. Recreat. Res. 1991, 16, 63–64. [Google Scholar] [CrossRef]
- Zhong, L.S.; Deng, J.Y.; Song, Z.W.; Ding, P.Y. Research on environmental impacts of tourism in China: Progress and prospect. J. Environ. Manag. 2011, 92, 2972–2983. [Google Scholar] [CrossRef]
- Geffroy, B.; Samia, D.S.; Bessa, E.; Blumstein, D.T. How nature-based tourism might increase prey vulnerability to predators. Trends Ecol. Evol. 2015, 30, 755–765. [Google Scholar] [CrossRef]
- Shannon, G.; Larson, C.L.; Reed, S.E.; Crooks, K.R.; Angeloni, L.M. Ecological Consequences of Ecotourism for Wildlife Populations and Communities. In Ecotourism’s Promise and Peril: A Biological Evaluation; Blumstein, D.T., Geffroy, B., Samia, D.S.M., Bessa, E., Eds.; Springer International Publishing: Cham, Switzerland, 2017; pp. 29–46. [Google Scholar]
- Han, J.; Wu, F.; Tian, M.; Li, W. From geopark to sustainable development: Heritage conservation and geotourism promotion in the Huangshan UNESCO Global Geopark (China). Geoheritage 2018, 10, 79–91. [Google Scholar] [CrossRef]
- Dirzo, R.; Young, H.S.; Galetti, M.; Ceballos, G.; Isaac, N.J.B.; Collen, B. Defaunation in the Anthropocene. Science 2014, 345, 401–406. [Google Scholar] [CrossRef]
- Tucker, M.A.; Böhning-Gaese, K.; Fagan, W.F.; Fryxell, J.M.; Van Moorter, B.; Alberts, S.C.; Ali, A.H.; Allen, A.M.; Attias, N.; Avgar, T.; et al. Moving in the Anthropocene: Global reductions in terrestrial mammalian movements. Science 2018, 359, 466–469. [Google Scholar] [CrossRef]
- Walther, G.-R.; Post, E.; Convey, P.; Menzel, A.; Parmesan, C.; Beebee, T.J.; Fromentin, J.-M.; Hoegh-Guldberg, O.; Bairlein, F. Ecological responses to recent climate change. Nature 2002, 416, 389–395. [Google Scholar] [CrossRef]
- Jones, K.R.; Venter, O.; Fuller, R.A.; Allan, J.R.; Maxwell, S.L.; Negret, P.J.; Watson, J.E.M. One-third of global protected land is under intense human pressure. Science 2018, 360, 788–791. [Google Scholar] [CrossRef]
- Suraci, J.P.; Clinchy, M.; Zanette, L.Y.; Wilmers, C.C. Fear of humans as apex predators has landscape-scale impacts from mountain lions to mice. Ecol. Lett. 2019, 22, 1578–1586. [Google Scholar] [CrossRef] [PubMed]
- Frid, A.; Dill, L. Human-caused disturbance stimuli as a form of predation risk. Conserv. Ecol. 2002, 6, 11. [Google Scholar] [CrossRef]
- Kronfeld-Schor, N.; Dayan, T. Partitioning of time as an ecological resource. Annu. Rev. Ecol. Evol. Syst. 2003, 34, 153–181. [Google Scholar] [CrossRef]
- Preisser, E.L.; Bolnick, D.I.; Benard, M.F. Scared to death? The effects of intimidation and consumption in predator–prey interactions. Ecology 2005, 86, 501–509. [Google Scholar] [CrossRef]
- Baloch, S.; Baloch, M.A.; Zheng, T.L.; Pei, X.F. The Coronavirus Disease 2019 (COVID-19) Pandemic. Tohoku J. Exp. Med. 2020, 250, 271–278. [Google Scholar] [CrossRef]
- Nuñez, M.A.; Pauchard, A.; Ricciardi, A. Invasion Science and the Global Spread of SARS-CoV-2. Trends Ecol. Evol. 2020, 35, 642–645. [Google Scholar] [CrossRef]
- Rutz, C.; Loretto, M.C.; Bates, A.E.; Davidson, S.C.; Duarte, C.M.; Jetz, W.; Johnson, M.; Kato, A.; Kays, R.; Mueller, T.; et al. COVID-19 lockdown allows researchers to quantify the effects of human activity on wildlife. Nat. Ecol. Evol. 2020, 4, 1156–1159. [Google Scholar] [CrossRef]
- Corradini, A.; Peters, W.; Pedrotti, L.; Hebblewhite, M.; Bragalanti, N.; Tattoni, C.; Ciolli, M.; Cagnacci, F. Animal movements occurring during COVID-19 lockdown were predicted by connectivity models. Glob. Ecol. Conserv. 2021, 32, e01895. [Google Scholar] [CrossRef]
- Bates, A.E.; Primack, R.B.; Moraga, P.; Duarte, C.M. COVID-19 pandemic and associated lockdown as a “Global Human Confinement Experiment” to investigate biodiversity conservation. Biol. Conserv. 2020, 248, 108665. [Google Scholar] [CrossRef]
- Chowdhury, R.B.; Khan, A.; Mahiat, T.; Dutta, H.; Tasmeea, T.; Arman, A.B.B.; Fardu, F.; Roy, B.B.; Hossain, M.M.; Khan, N.A.; et al. Environmental externalities of the COVID-19 lockdown: Insights for sustainability planning in the Anthropocene. Sci. Total Environ. 2021, 783, 147015. [Google Scholar] [CrossRef]
- Lecchini, D.; Brooker, R.M.; Waqalevu, V.; Gairin, E.; Minier, L.; Berthe, C.; Besineau, R.; Blay, G.; Maueau, T.; Sturny, V.; et al. Effects of COVID-19 pandemic restrictions on coral reef fishes at eco-tourism sites in Bora-Bora, French Polynesia. Mar. Environ. Res. 2021, 170, 105451. [Google Scholar] [CrossRef] [PubMed]
- Liu, L.; Lin, Q.H.; Liang, Z.R.; Du, R.G.; Zhang, G.Z.; Zhu, Y.H.; Qi, B.; Zhou, S.Z.; Li, W.J. Variations in concentration and solubility of iron in atmospheric fine particles during the COVID-19 pandemic: An example from China. Gondwana Res. 2021, 97, 138–144. [Google Scholar] [CrossRef] [PubMed]
- Lodberg-Holm, H.K.; Gelink, H.W.; Hertel, A.G.; Swenson, E.; Domevscik, M.; Steyaert, S. A human-induced landscape of fear influences foraging behavior of brown bears. Basic Appl. Ecol. 2019, 35, 18–27. [Google Scholar] [CrossRef]
- Derryberry, E.P.; Phillips, J.N.; Derryberry, G.E.; Blum, M.J.; Luther, D. Singing in a silent spring: Birds respond to a half-century soundscape reversion during the COVID-19 shutdown. Science 2020, 370, 575–579. [Google Scholar] [CrossRef]
- Arora, S.; Bhaukhandi, K.D.; Mishra, P.K. Coronavirus lockdown helped the environment to bounce back. Sci. Total Environ. 2020, 742, 140573. [Google Scholar] [CrossRef]
- Dutheil, F.; Baker, J.S.; Navel, V. COVID-19 as a factor influencing air pollution? Environ. Pollut. 2020, 263, 114466. [Google Scholar] [CrossRef]
- Bates, A.E.; Primack, R.B.; Biggar, B.S.; Bird, T.J.; Clinton, M.E.; Command, R.J.; Richards, C.; Shellard, M.; Geraldi, N.R.; Vergara, V.; et al. Global COVID-19 lockdown highlights humans as both threats and custodians of the environment. Biol. Conserv. 2021, 263, 109175. [Google Scholar] [CrossRef]
- Manenti, R.; Mori, E.; Di Canio, V.; Mercurio, S.; Picone, M.; Caffi, M.; Brambilla, M.; Ficetola, G.F.; Rubolini, D. The good, the bad and the ugly of COVID-19 lockdown effects on wildlife conservation: Insights from the first European locked down country. Biol. Conserv. 2020, 249, 108728. [Google Scholar] [CrossRef]
- Silva-Rodríguez, E.A.; Gálvez, N.; Swan, G.J.F.; Cusack, J.J.; Moreira-Arce, D. Urban wildlife in times of COVID-19: What can we infer from novel carnivore records in urban areas? Sci. Total Environ. 2021, 765, 142713. [Google Scholar] [CrossRef]
- Buckley, R. Conservation implications of COVID19: Effects via tourism and extractive industries. Biol. Conserv. 2020, 247, 108640. [Google Scholar] [CrossRef]
- Mendiratta, U.; Khanyari, M.; Velho, N.; Suryawanshi, K.R.; Kulkarni, N. Key informant perceptions on wildlife hunting in India during the COVID-19 lockdown. bioRxiv 2021. [Google Scholar] [CrossRef]
- Shi, J.; Wen, Z.; Zhong, G.; Yang, H.; Wang, C.; Huang, B.; Liu, R.; He, X.; Shuai, L.; Sun, Z. Susceptibility of ferrets, cats, dogs, and other domesticated animals to SARS–coronavirus 2. Science 2020, 368, 1016–1020. [Google Scholar] [CrossRef] [PubMed]
- Sharun, K.; Dhama, K.; Pawde, A.M.; Gortázar, C.; Tiwari, R.; Bonilla-Aldana, D.K.; Rodriguez-Morales, A.J.; de la Fuente, J.; Michalak, I.; Attia, Y.A. SARS-CoV-2 in animals: Potential for unknown reservoir hosts and public health implications. Vet. Q. 2021, 41, 181–201. [Google Scholar] [CrossRef] [PubMed]
- McGinlay, J.; Gkoumas, V.; Holtvoeth, J.; Fuertes, R.F.A.; Bazhenova, E.; Benzoni, A.; Botsch, K.; Martel, C.C.; Sánchez, C.C.; Cervera, I.; et al. The Impact of COVID-19 on the Management of European Protected Areas and Policy Implications. Forests 2020, 11, 1214. [Google Scholar] [CrossRef]
- Neupane, D. How conservation will be impacted in the COVID-19 pandemic. Wildl. Biol. 2020, 2020, 1–2. [Google Scholar] [CrossRef]
- Smith, M.K.S.; Smit, I.P.J.; Swemmer, L.K.; Mokhatla, M.M.; Freitag, S.; Roux, D.J.; Dziba, L. Sustainability of protected areas: Vulnerabilities and opportunities as revealed by COVID-19 in a national park management agency. Biol. Conserv. 2021, 255, 108985. [Google Scholar] [CrossRef]
- Hua, J.Q.; Tian, S.; Lu, S.; Zhu, Z.Q.; Huang, X.J.; Tao, J.S.; Li, J.Q.; Xu, J.L. COVID-19 lockdown has indirect, non-equivalent effects on activity patterns of Reeves’s Pheasant (Syrmaticus reevesii) and sympatric species. Avian Res. 2023, 14, 100092. [Google Scholar] [CrossRef]
- Burton, A.C.; Neilson, E.; Moreira, D.; Ladle, A.; Steenweg, R.; Fisher, J.T.; Bayne, E.; Boutin, S. Wildlife camera trapping: A review and recommendations for linking surveys to ecological processes. J. Appl. Ecol. 2015, 52, 675–685. [Google Scholar] [CrossRef]
- Wearn, O.R.; Glover-Kapfer, P. Snap happy: Camera traps are an effective sampling tool when compared with alternative methods. R. Soc. Open Sci. 2019, 6, 181748. [Google Scholar] [CrossRef]
- McCallum, J. Changing use of camera traps in mammalian field research: Habitats, taxa and study types. Mamm. Rev. 2013, 43, 196–206. [Google Scholar] [CrossRef]
- Kays, R.; Arbogast, B.S.; Baker-Whatton, M.; Beirne, C.; Boone, H.M.; Bowler, M.; Burneo, S.F.; Cove, M.V.; Ding, P.; Espinosa, S. An empirical evaluation of camera trap study design: How many, how long and when? Methods Ecol. Evol. 2020, 11, 700–713. [Google Scholar] [CrossRef]
- Bi, S.F. The resources of rate and endangered plants in Huangshan scenic spot. Territ. Nat. Resour. Study 2004, 4, 95–96. [Google Scholar] [CrossRef]
- Li, W.B.; Li, J.H.; Yang, P.P.; Li, B.W.; Liu, C.; Sun, L.X. Habitat characteristics or protected area size: What is more important for the composition and diversity of mammals in nonprotected areas? Ecol. Evol. 2021, 11, 7250–7263. [Google Scholar] [CrossRef] [PubMed]
- Si, X.; Kays, R.; Ding, P. How long is enough to detect terrestrial animals? Estimating the minimum trapping effort on camera traps. PeerJ 2014, 2, e374. [Google Scholar] [CrossRef]
- O’Brien, T.G.; Kinnaird, M.F.; Wibisono, H.T. Crouching tigers, hidden prey: Sumatran tiger and prey populations in a tropical forest landscape. Anim. Conserv. Forum 2003, 6, 131–139. [Google Scholar] [CrossRef]
- Sollmann, R. A gentle introduction to camera-trap data analysis. Afr. J. Ecol. 2018, 56, 740–749. [Google Scholar] [CrossRef]
- Carbone, C.; Christie, S.; Conforti, K.; Coulson, T.; Franklin, N.; Ginsberg, J.; Griffiths, M.; Holden, J.; Kawanishi, K.; Kinnaird, M. The use of photographic rates to estimate densities of tigers and other cryptic mammals. Anim. Conserv. Forum 2001, 4, 75–79. [Google Scholar] [CrossRef]
- Taheri, S.; Hesamian, G. A generalization of the Wilcoxon signed-rank test and its applications. Stat. Pap. 2013, 54, 457–470. [Google Scholar] [CrossRef]
- MacKenzie, D.I.; Nichols, J.D.; Lachman, G.B.; Droege, S.; Andrew Royle, J.; Langtimm, C.A. Estimating site occupancy rates when detection probabilities are less than one. Ecology 2002, 83, 2248–2255. [Google Scholar] [CrossRef]
- Burnham, K.P.; Overton, W.S. Robust estimation of population size when capture probabilities vary among animals. Ecology 1979, 60, 927–936. [Google Scholar] [CrossRef]
- Rich, L.N.; Miller, D.A.W.; Robinson, H.S.; McNutt, J.W.; Kelly, M.J. Using camera trapping and hierarchical occupancy modelling to evaluate the spatial ecology of an African mammal community. J. Appl. Ecol. 2016, 53, 1225–1235. [Google Scholar] [CrossRef]
- Dias, D.D.; Massara, R.L.; de Campos, C.B.; Rodrigues, F.H.G. Human activities influence the occupancy probability of mammalian carnivores in the Brazilian Caatinga. Biotropica 2019, 51, 253–265. [Google Scholar] [CrossRef]
- Hauke, J.; Kossowski, T. Comparison of values of Pearson’s and Spearman’s correlation coefficients on the same sets of data. Quaest. Geogr. 2011, 30, 87–93. [Google Scholar] [CrossRef]
- Team, R.C. R: A Language and Environment for Statistical Computing; Foundation for Statistical Computing: Vienna, Austria, 2013. [Google Scholar]
- Fiske, I.J.; Chandler, R.B. Unmarked: An R Package for Fitting Hierarchical Models of Wildlife Occurrence and Abundance. J. Stat. Softw. 2011, 43, 1–23. [Google Scholar] [CrossRef]
- Burnham, K.P.; Anderson, D.R. Multimodel inference: Understanding AIC and BIC in model selection. Sociol. Methods Res. 2004, 33, 261–304. [Google Scholar] [CrossRef]
- Ridout, M.S.; Linkie, M. Estimating overlap of daily activity patterns from camera trap data. J. Agric. Biol. Environ. Stat. 2009, 14, 322–337. [Google Scholar] [CrossRef]
- Nouvellet, P.; Rasmussen, G.S.A.; Macdonald, D.W.; Courchamp, F. Noisy clocks and silent sunrises: Measurement methods of daily activity pattern. J. Zool. 2012, 286, 179–184. [Google Scholar] [CrossRef]
- Di Blanco, Y.E.; Sporring, K.L.; Di Bitetti, M.S. Daily activity pattern of reintroduced giant anteaters (Myrmecophaga tridactyla): Effects of seasonality and experience. Mammalia 2017, 81, 11–21. [Google Scholar] [CrossRef]
- Cusack, J.J.; Dickman, A.J.; Kalyahe, M.; Rowcliffe, J.M.; Carbone, C.; MacDonald, D.W.; Coulson, T. Revealing kleptoparasitic and predatory tendencies in an African mammal community using camera traps: A comparison of spatiotemporal approaches. Oikos 2017, 126, 812–822. [Google Scholar] [CrossRef]
- Liu, X.H.; Wu, P.F.; Songer, M.; Cai, Q.; He, X.B.; Zhu, Y.; Shao, X.M. Monitoring wildlife abundance and diversity with infra-red camera traps in Guanyinshan Nature Reserve of Shaanxi Province, China. Ecol. Indic. 2013, 33, 121–128. [Google Scholar] [CrossRef]
- Gaynor, K.M.; Hojnowski, C.E.; Carter, N.H.; Brashares, J.S. The influence of human disturbance on wildlife nocturnality. Science 2018, 360, 1232–1235. [Google Scholar] [CrossRef]
- Mahato, S.; Pal, S.; Ghosh, K.G. Effect of lockdown amid COVID-19 pandemic on air quality of the megacity Delhi, India. Sci. Total Environ. 2020, 730, 139086. [Google Scholar] [CrossRef] [PubMed]
- Talukdar, A.; Bhattacharya, S.; Pal, S.; Pal, P.; Chowdhury, S. Positive and negative impacts of COVID-19 on the environment: A critical review with sustainability approaches. Hyg. Environ. Health Adv. 2024, 12, 100107. [Google Scholar] [CrossRef]
- Paital, B. Nurture to nature via COVID-19, a self-regenerating environmental strategy of environment in global context. Sci. Total Environ. 2020, 729, 139088. [Google Scholar] [CrossRef] [PubMed]
- Behera, A.K.; Kumar, P.R.; Priya, M.M.; Ramesh, T.; Kalle, R. The impacts of COVID-19 lockdown on wildlife in Deccan Plateau, India. Sci. Total Environ. 2022, 822, 153268. [Google Scholar] [CrossRef]
- Liu, Q.; Sha, D.; Liu, W.; Houser, P.; Zhang, L.; Hou, R.; Lan, H.; Flynn, C.; Lu, M.; Hu, T. Spatiotemporal patterns of COVID-19 impact on human activities and environment in mainland China using nighttime light and air quality data. Remote Sens. 2020, 12, 1576. [Google Scholar] [CrossRef]
- Cooke, S.J.; Cramp, R.L.; Madliger, C.L.; Bergman, J.N.; Reeve, C.; Rummer, J.L.; Hultine, K.R.; Fuller, A.; French, S.S.; Franklin, C.E. Conservation physiology and the COVID-19 pandemic. Conserv. Physiol. 2021, 9, coaa139. [Google Scholar] [CrossRef]
- Corlett, R.T.; Primack, R.B.; Devictor, V.; Maas, B.; Goswami, V.R.; Bates, A.E.; Koh, L.P.; Regan, T.J.; Loyola, R.; Pakeman, R.J.; et al. Impacts of the coronavirus pandemic on biodiversity conservation. Biol. Conserv. 2020, 246, 108571. [Google Scholar] [CrossRef]
- Ramesh, T.; Downs, C.T. Impact of farmland use on population density and activity patterns of serval in South Africa. J. Mammal. 2013, 94, 1460–1470. [Google Scholar] [CrossRef]
- Gaynor, K.M.; Brown, J.S.; Middleton, A.D.; Power, M.E.; Brashares, J.S. Landscapes of Fear: Spatial Patterns of Risk Perception and Response. Trends Ecol. Evol. 2019, 34, 355–368. [Google Scholar] [CrossRef]
- Dorresteijn, I.; Schultner, J.; Nimmo, D.G.; Fischer, J.; Hanspach, J.; Kuemmerle, T.; Kehoe, L.; Ritchie, E.G. Incorporating anthropogenic effects into trophic ecology: Predator-prey interactions in a human-dominated landscape. Proc. R. Soc. B 2015, 282, 105–112. [Google Scholar] [CrossRef] [PubMed]
- Knight, J. Making Wildlife Viewable: Habituation and Attraction. Soc. Anim. 2009, 17, 167–184. [Google Scholar] [CrossRef]
- Blumstein, D.T. Habituation and sensitization: New thoughts about old ideas. Anim. Behav. 2016, 120, 255–262. [Google Scholar] [CrossRef]
- Singh, M.; Rao, N.R. Population dynamics and conservation of commensal bonnet macaques. Int. J. Primatol. 2004, 25, 847–859. [Google Scholar] [CrossRef]
- Li, J.J.; Fang, Y.H.; Li, N.; Huang, C.B.; Li, Y.P.; Huang, Z.P.; Pan, R.L.; Xiao, W. The Impacts of COVID-19 Lockdown on Human-Primate Coexistence: Insights and Recommendations. Ecosyst. Health Sustain. 2024, 10, 0144. [Google Scholar] [CrossRef]
- Massei, G.; Kindberg, J.; Licoppe, A.; Gačić, D.; Šprem, N.; Kamler, J.; Baubet, E.; Hohmann, U.; Monaco, A.; Ozoliņš, J. Wild boar populations up, numbers of hunters down? A review of trends and implications for Europe. Pest. Manag. Sci. 2015, 71, 492–500. [Google Scholar] [CrossRef]
- Fulgione, D.; Buglione, M. The boar war: Five hot factors unleashing boar expansion and related emergency. Land 2022, 11, 887. [Google Scholar] [CrossRef]
- Olejarz, A.; Faltusová, M.; Börger, L.; Güldenpfennig, J.; Jarsky, V.; Jezek, M.; Mortlock, E.; Silovsky, V.; Podgórski, T. Worse sleep and increased energy expenditure yet no movement changes in sub-urban wild boar experiencing an influx of human visitors (anthropulse) during the COVID-19 pandemic. Sci. Total Environ. 2023, 879, 163106. [Google Scholar] [CrossRef]
- Pacifici, M.; Rondinini, C.; Rhodes, J.R.; Burbidge, A.A.; Cristiano, A.; Watson, J.E.M.; Woinarski, J.C.Z.; Di Marco, M. Global correlates of range contractions and expansions in terrestrial mammals. Nat. Commun. 2020, 11, 2840. [Google Scholar] [CrossRef]
- Creel, S.; Christianson, D. Relationships between direct predation and risk effects. Trends Ecol. Evol. 2008, 23, 194–201. [Google Scholar] [CrossRef]


| Species | Scenario | Best Model | Naïve Occupancy | AIC | nPars |
|---|---|---|---|---|---|
| (c) Reeves’ muntjac | BP | Ψ (ELE), p (PRAI, DRAI) | 0.40 | 651.14 | 5 |
| DP | Ψ (ELE, PRAI), p (ELE, DRAI) | 0.72 | 1022.47 | 6 | |
| (d) Silver pheasant | BP | Ψ (DRAI), p (ELE, NDVI) | 0.46 | 1012.43 | 5 |
| DP | Ψ (ELE, NDVI), p (DNR, PRAI) | 0.62 | 906.31 | 6 | |
| (e) Tibetan macaque | BP | Ψ (DNT), p (ELE, DNR) | 0.55 | 562.94 | 5 |
| DP | Ψ (ELE, NDVI), p (ELE, DNR) | 0.57 | 505.28 | 6 | |
| (f) Masked palm civet | BP | Ψ (PRAI, DRAI), p (NDVI, DNT) | 0.35 | 345.51 | 6 |
| DP | Ψ (.), p (NDVI, DNT) | 0.74 | 809.35 | 4 | |
| (g) Mainland serow | BP | Ψ (ELE, PRAI), p (NDVI, DNT) | 0.26 | 207.1 | 6 |
| DP | Ψ (DNT, PRAI), p (NDVI, PRAI) | 0.29 | 182.63 | 6 | |
| (h) Wild boar | BP | Ψ (PRAI, DRAI), p (ELE) | 0.21 | 104.83 | 5 |
| DP | Ψ (NDVI, DRAI), p (ELE, DNT) | 0.28 | 265.07 | 6 | |
| (i) Hog badger | BP | Ψ (PRAI, DRAI), p (NDVI, PRAI) | 0.34 | 333.38 | 6 |
| DP | Ψ (DNR), p (DNR, DRAI) | 0.71 | 544.38 | 5 |
| Species | Scenario | Occupancy | Detection | ||
|---|---|---|---|---|---|
| Occupancy Rate | SE | Detection Rate | SE | ||
| Reeves’ muntjac | BP | 0.53 | 0.10 | 0.18 | 0.02 |
| DP | 0.73 | 0.09 | 0.25 | 0.02 | |
| Silver pheasant | BP | 0.55 | 0.10 | 0.16 | 0.02 |
| DP | 0.64 | 0.22 | 0.25 | 0.02 | |
| Tibetan macaque | BP | 0.58 | 0.08 | 0.10 | 0.01 |
| DP | 0.67 | 0.12 | 0.12 | 0.02 | |
| Masked palm civet | BP | 0.43 | 0.08 | 0.11 | 0.03 |
| DP | 0.85 | 0.07 | 0.14 | 0.02 | |
| Mainland serow | BP | 0.41 | 0.16 | 0.05 | 0.02 |
| DP | 0.36 | 0.12 | 0.08 | 0.03 | |
| Wild boar | BP | 0.32 | 0.09 | 0.02 | 0.01 |
| DP | 0.36 | 0.13 | 0.08 | 0.02 | |
| Hog badger | BP | 0.41 | 0.11 | 0.07 | 0.02 |
| DP | 0.76 | 0.11 | 0.12 | 0.02 |
| Species | Scenario | Occupancy | Detection | ||||
|---|---|---|---|---|---|---|---|
| Covariates | βEstimates | SE | Covariates | βEstimates | SE | ||
| Reeves’ muntjac | BP | ELE | −0.84 * | 0.44 | PRAI | −5.97 *** | 1.44 |
| DRAI | −2.09 ** | 0.64 | |||||
| DP | ELE | −1.04 * | 0.42 | ELE | −0.35 *** | 0.11 | |
| PRAI | 1.38 | 2.23 | DRAI | −0.02 | 0.13 | ||
| Silver pheasant | BP | ELE | −0.83 * | 0.39 | PRAI | −2.10 ** | 0.77 |
| DRAI | −1.44 * | 0.61 | |||||
| DP | ELE | −1.34 * | 0.47 | DNR | −0.43 *** | 0.12 | |
| NDVI | −0.92 * | 0.47 | PRAI | −0.20 * | 0.09 | ||
| Tibetan macaque | BP | DNT | 0.31 | 0.41 | ELE | −0.58 * | 0.25 |
| DNR | 0.26 * | 0.13 | |||||
| DP | ELE | 4.41 | 2.34 | ELE | −0.97 *** | 0.18 | |
| NDVI | −2.73 | 1.58 | DNR | 0.84 *** | 0.21 | ||
| Masked palm civet | BP | PRAI | −4.82 | 3.56 | NDVI | −0.36 * | 0.15 |
| DRAI | 10.88 | 8.93 | DNT | 0.88 *** | 0.22 | ||
| DP | NDVI | −0.79 *** | 0.11 | ||||
| DNT | 0.57 *** | 0.09 | |||||
| Mainland serow | BP | ELE | −0.49 | 0.90 | NDVI | −0.45 * | 0.19 |
| PRAI | −7.05 | 8.18 | DNT | 1.01 *** | 0.30 | ||
| DP | DNT | 0.95 | 0.85 | NDVI | −0.48 | 0.30 | |
| PRAI | 7.32 | 4.57 | PRAI | −1.61 * | 0.79 | ||
| Wild boar | BP | PRAI | −36.39 | 137.10 | ELE | −0.89 | 0.80 |
| DRAI | 18.45 | 65.96 | |||||
| DP | NDVI | 0.24 | 0.47 | ELE | −1.04 * | 0.43 | |
| DRAI | 0.80 | 0.95 | DNT | 0.72 *** | 0.17 | ||
| Hog badger | BP | PRAI | 2.15 | 3.63 | NDVI | −0.10 | 0.15 |
| DRAI | 0.92 | 1.06 | PRAI | −0.14 | 0.19 | ||
| DP | DNR | −1.41 | 0.79 | DNR | 0.93 *** | 0.22 | |
| DRAI | 0.28 *** | 0.07 |
Disclaimer/Publisher’s Note: The statements, opinions and data contained in all publications are solely those of the individual author(s) and contributor(s) and not of MDPI and/or the editor(s). MDPI and/or the editor(s) disclaim responsibility for any injury to people or property resulting from any ideas, methods, instructions or products referred to in the content. |
© 2025 by the authors. Licensee MDPI, Basel, Switzerland. This article is an open access article distributed under the terms and conditions of the Creative Commons Attribution (CC BY) license (https://creativecommons.org/licenses/by/4.0/).
Share and Cite
Lu, Y.; Wan, Y.; Wang, L.; Pang, D.; Cai, Y.; Wu, Y.; Tang, M.; Li, J.; Zhang, B. Impacts of the COVID-19 Pandemic on Wildlife in Huangshan Scenic Area, Anhui Province, China. Animals 2025, 15, 857. https://doi.org/10.3390/ani15060857
Lu Y, Wan Y, Wang L, Pang D, Cai Y, Wu Y, Tang M, Li J, Zhang B. Impacts of the COVID-19 Pandemic on Wildlife in Huangshan Scenic Area, Anhui Province, China. Animals. 2025; 15(6):857. https://doi.org/10.3390/ani15060857
Chicago/Turabian StyleLu, Yuting, Yaqiong Wan, Lanrong Wang, Dapeng Pang, Yinfan Cai, Yijun Wu, Mingxia Tang, Jiaqi Li, and Baowei Zhang. 2025. "Impacts of the COVID-19 Pandemic on Wildlife in Huangshan Scenic Area, Anhui Province, China" Animals 15, no. 6: 857. https://doi.org/10.3390/ani15060857
APA StyleLu, Y., Wan, Y., Wang, L., Pang, D., Cai, Y., Wu, Y., Tang, M., Li, J., & Zhang, B. (2025). Impacts of the COVID-19 Pandemic on Wildlife in Huangshan Scenic Area, Anhui Province, China. Animals, 15(6), 857. https://doi.org/10.3390/ani15060857