Article

Genetic Diversity in the Diminazene Resistance-Associated P2 Adenosine Transporter-1 (AT-1) Gene of Trypanosoma evansi

1
College of Veterinary Sciences, Riphah International University, Lahore 54660, Punjab, Pakistan
2
Cumming School of Medicine, University of Calgary, Calgary, AB T2N 1N4, Canada
3
Department of Parasitology, University of Veterinary and Animal Sciences Lahore, Lahore 54000, Punjab, Pakistan
4
Department of Parasitology, University of Agriculture D. I. Khan, Dera Ismail Khan Khyber 29050, Pakhtunkhwa, Pakistan
5
Department of Zoology, Faculty of Biological Sciences, Quaid-i-Azam University, Islamabad 45320, Punjab, Pakistan
6
School of Veterinary Medicine, University of Surrey, Guildford GU2 7XH, UK
7
Royal (Dick) School of Veterinary Studies, University of Edinburgh, Edinburgh EH8 9JU, UK
8
Lewyt College of Veterinary Medicine, Long Island University, New York, NY 11548, USA
*
Author to whom correspondence should be addressed.
Animals 2025, 15(5), 756; https://doi.org/10.3390/ani15050756
Submission received: 3 February 2025 / Revised: 24 February 2025 / Accepted: 4 March 2025 / Published: 6 March 2025

Simple Summary

Trypanosoma evansi is a highly pathogenic bloodborne protozoan parasite of many animals. It is widespread in South Asia, North Africa, and the Middle East. It has also been exported to Australia, Latin America, and Europe through animal movement. The underlying disease causes high production losses and mortality in affected livestock species. Diminazene is consistently used to treat T. evansi, and resistance to this drug is an emerging threat in ruminant livestock (such as sheep, goats, and cows) and camels, resulting in huge economic losses. The present study aimed to develop a high-throughput strategy based on molecular approaches to improve the understanding of diminazene resistance in T. evansi.

Abstract

Trypanosomes are parasitic protozoa that cause severe diseases in humans and animals. The most important species of Trypanosmes include Trypanosoma evansi and Trypanosoma brucei gambiense. The most well-known human diseases are sleeping sickness in Africa and Chagas disease in South America. The most identified animal diseases include Nagana in the African tsetse fly belt and Surra in South Asia, North Africa, and the Middle East. Surra is caused by Trypanosoma evansi. Diminazene resistance is an emerging threat caused by T. evansi infecting animals. The underlying mechanism of diminazene resistance is poorly understood. Trypanosoma brucei gambiense causes African sleeping sickness. The development of diminazene resistance in Trypanosoma brucei gambiense is associated with the alterations in the corresponding P2 adenosine transporter-1 (AT-1) gene. In the present study, by extrapolating the findings from Trypanosoma brucei gambiense, we analyzed genetic diversity in the P2 adenosine transporter-1 gene (AT-1) from T. evansi to explore a potential link between the presence of mutations in this locus and diminazene treatment in ruminants. We examined T. evansi-infected blood samples collected from goats, sheep, camels, buffalo, and cattle in seven known endemic regions of the Punjab province of Pakistan. Heterozygosity (He) indices indicated a high level of genetic diversity between seven T. evansi field isolates that had resistance-type mutations at codons 178E/S, 239Y/A/E, and 286S/H/I/D/T of the P2 adenosine transporter-1 (AT-1) locus. A low level of genetic diversity was observed in 19 T. evansi field isolates with susceptible-type mutations at codons A178, G181, D239, and N286 of the P2 adenosine transporter-1 (AT-1) locus. Our results on T. evansi warrant further functional studies to explore the relationship between diminazene resistance and the mutations in AT-1.

1. Introduction

Trypanosoma evansi is a highly pathogenic bloodborne protozoan parasite of a wide range of animals that causes the disease known as Surra [1]. T. evansi is widespread in South Asia, North Africa, and the Middle East. Trypanosoma brucei predominates outside the African tsetse fly belt and causes African sleeping sickness. Both species have been exported through animal movement to Australia, Latin America, and Europe [2]. Tabanus and Stomoxys flies transmit the disease and act as a reservoir between different animal hosts [3]. Trypanosomiasis causes huge production losses, high morbidity, and mortality in the affected livestock species.
Surra is usually treated with antiprotozoal drugs such as diminazene, which was first introduced in 1955 [4]. The P2 adenosine transporter-1 (AT-1) protein is required for the uptake of diminazene in Trypanosoma spp. [5]. Once diminazene is taken up, it enters the mitochondria, where it binds to a minor groove of kDNA. By doing so, the drug induces changes in DNA topology and inhibits the topoisomerase enzyme. Consequently, the functioning of the mitochondrion is impaired as DNA is cleaved [6].
Diminazene resistance in trypanosomes is an emerging threat in ruminant livestock species and camels causing staggering annual losses of over PKR one billion due to trypanosomiasis. Even though resistance to diminazene has emerged, it is unlikely that new alternative drugs will be developed in the near future. In Trypanosoma brucei gambiense, several studies have demonstrated a functional relationship between diminazene resistance and the inhibition of the P2 adenosine transporter-1 (AT-1) locus [7]. Diminazene resistance-associated P2 adenosine transporter-1 (AT-1) mutations have been reported in at least seven codons (71, 178, 181, 239, 286, and 380) of Trypanosoma brucei gambiense [8,9,10,11]. The current understanding of T. evansi genetic diversity at the AT-1 locus is limited, and potential links between mutations in this transporter and diminazene resistance remain elusive. As Trypanosoma brucei gambiense and Trypanosoma evansi are closely related species, it is plausible that mutations at this locus may also contribute to diminazene resistance in T. evansi. In this context, the role of this locus in the resistance to diminazene in T. evansi is not fully understood [11,12,13]. Genetic diversity has been described in protozoan parasites. Studies have reaffirmed the contribution of high parasitic population size to genetic diversity strongly linked with mutations in cytochrome b and buparvaquone resistance [14]. The current understanding of T. evansi genetic diversity at the P2 adenosine transporter-1 (AT-1) locus is limited, and potential links between mutations in P2 adenosine transporter-1 (AT-1) and diminazene resistance have yet to be demonstrated.
Low-throughput methods, including various types of PCRs, accompanied by Sanger sequencing, have been used for assessing genetic diversity [15]. However, these methods are more error-prone and expensive for large numbers of samples versus the high-throughput methods, such as deep amplicon sequencing (ADS) [16]. To this end, performing ADS by leveraging the Illumina Mi-Seq platform is a more reliable approach to identifying parasite amplicon sequence variants. This technique can generate sequence depth reads of up to 600 bp in length. Furthermore, primers that are barcoded can be pooled and can sequence up to 384 samples in a single run. This method has been used to study genetic diversity in the Plasmodium [17] and Theileria [18] species. Thus, the present study aimed to develop a high-throughput approach to exploiting ADS to improve the understanding of the T. evansi P2 adenosine transporter-1 (AT-1) locus.

2. Materials and Methods

2.1. Study Design, Field Sample, and Genomic DNA Extraction

A cross-sectional survey of Trypanosoma endemic regions in livestock was conducted in 7 areas, including Multan, Layyah, Rahim Yar Khan, Bahawalpur, Muzafargar, Lodhraan, and Dera Ghazi Khan of the Punjab province of Pakistan. The samples were collected between 2021 and 2023 from May to August during the peak transmission seasons of trypanosomiasis.
Twenty-six blood samples were collected from buffalo (n = 2), cattle (n = 14), camels (n = 7), goats (n = 1), and sheep (n = 2) presenting with clinical signs at veterinary hospitals. Once consent was obtained from the animal owners, the blood samples were collected by trained veterinarians. Briefly, the samples were collected by jugular venipuncture, and 5 mL of blood was withdrawn into EDTA tubes, which were further stored at −20 °C. Dr Morrison, Roslin Institute, University of Edinburgh, kindly provided Trypanosoma-negative control cattle blood samples. A total of 50 μL of blood was used for genomic DNA from each field sample following the protocols described in the TIANamp Blood DNA kit (Beijing Biopeony Co., Ltd., Beijing, China) [14]. Following this, a ’haemoprotobiome’ high-throughput sequencing methodology described in our previous study [19] was leveraged to confirm the T. evansi species from the collected samples (Supplementary Table S2).

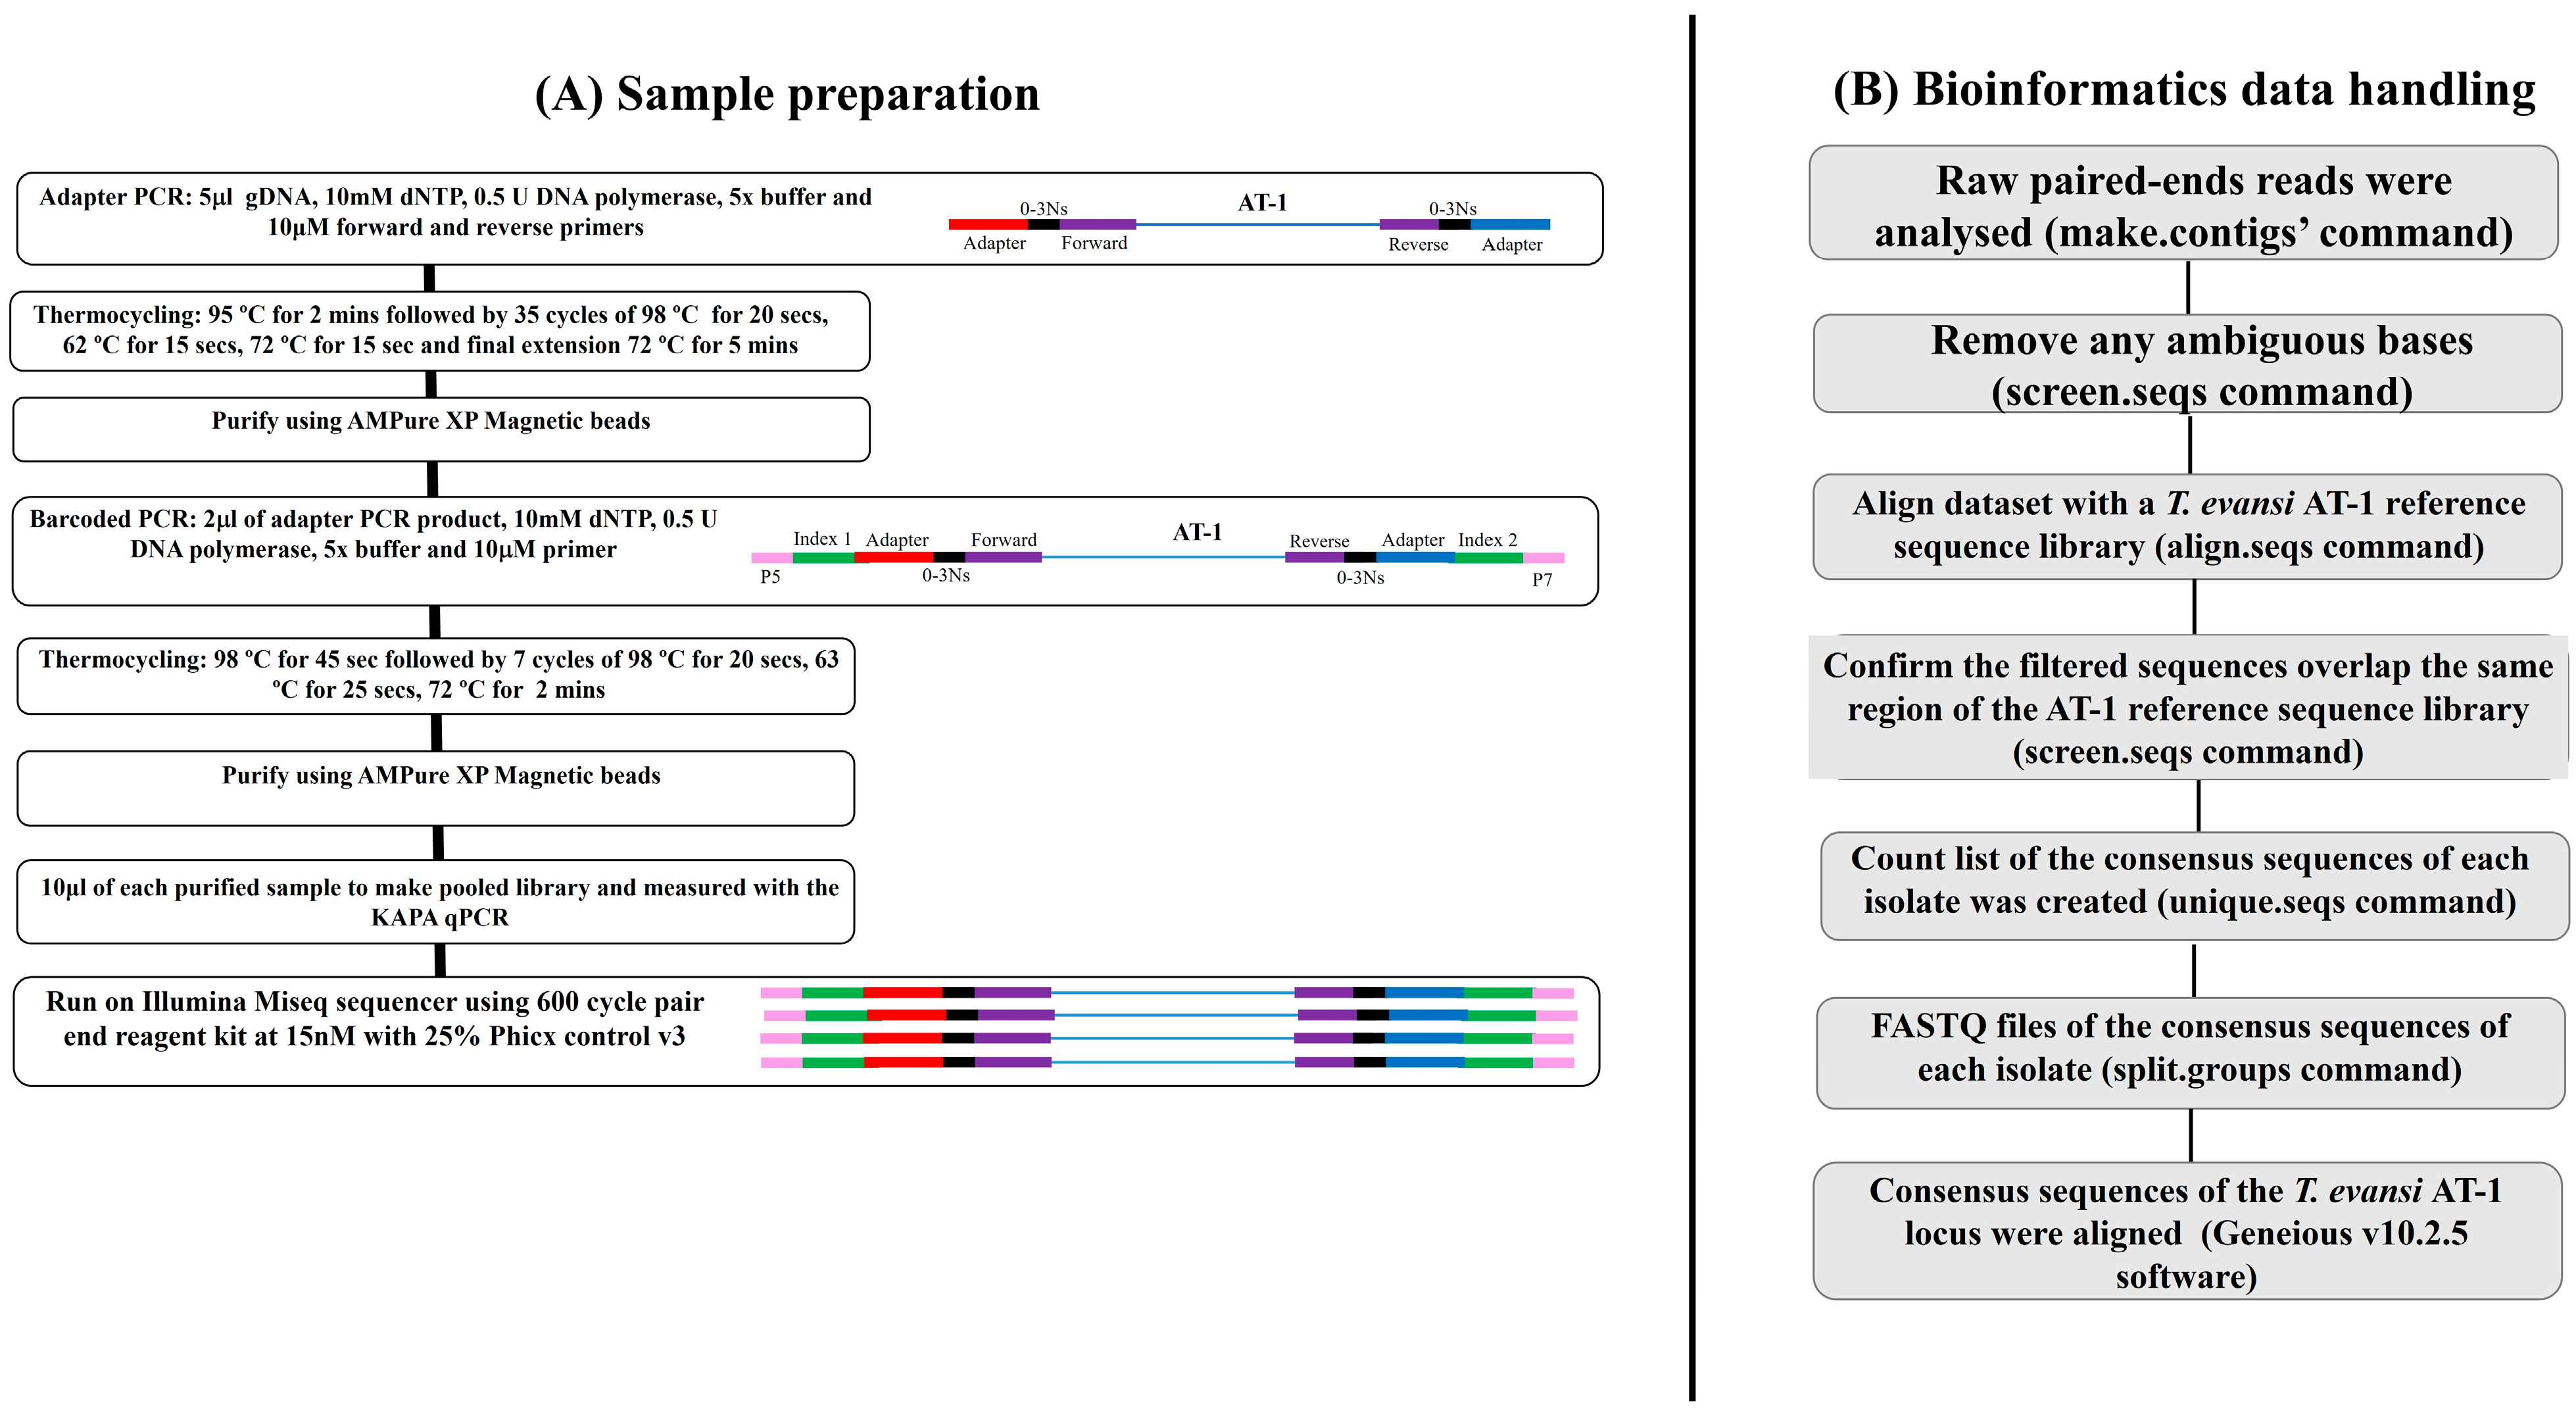
2.2. Adapter and Barcoded PCR Amplification

A 555 bp fragment encompassing codons 178, 181, 239, and 286 of the T. evansi P2 adenosine transporter-1 (AT-1) locus was amplified with a de novo primer set (Supplementary Table S1). The overall scheme of the adapter and barcoded PCR approach is summarized in Figure 1 The de novo primer set was modified by adding adapters to each primer, allowing annealing. N indicated the number of random nucleotides between the primers and adapter sequence (Supplementary Table S1). Four forward (TeAT_For, TeAT_For-1N, TeAT_For-2N, and TeAT_For-3N) and four reverse primers (TeAT_Rev, TeAT_Rev-1N, TeAT_Rev-2N, and TeAT_Rev-3N) were mixed in equal proportions. The first-round PCR master mix included 1X KAPA HiFi Hot START Fidelity buffer, 10 mM dNTPs, 10 µM forward and reverse adapter primers, 0.5 U KAPA HiFi Hot START Fidelity Polymerase (KAPA Biosystems, Wilmington, Massachusetts, USA), 14.25 μL of ddH2O, and 5 μL of gDNA. The thermocycling conditions of the adapter PCR were: 95 °C for 2 min, followed by 35 cycles of 98 °C for 20 s, 62 °C for 15 s, 72 °C for 15 s, and a final extension of 72 °C for 5 min. The PCR products were then purified with AMPure XP Magnetic Beads (1X) (Beckman Coulter, Inc. California, United States) using a unique magnetic stand and plate (described by Yasein et al. (2022)) [19].
Finally, the barcoded PCR was performed using 8 forward and 12 reverse primer sets [14]. The barcoded PCR conditions were: 10 mM dNTPs, 1X KAPA HiFi Hot START Fidelity buffer, 14.25 μL of ddH2O, 0.5 U KAPA HiFi Hot START Fidelity Polymerase, and 2 μL of adapter PCR product as the DNA template. The barcoded forward (N501–N508) and reverse (N701-N712) primers (10 μM each) were obtained using Illumina Mi-Seq methods. The PCR thermocycling conditions were 98 °C for 45 s, followed by 7 cycles of 98 °C for 20 s, 63 °C for 20 s, and 72 °C for 2 min.

2.3. Amplicon Deep Sequencing

The schematic of the ADS approach using the Illumina Mi-Seq platform is shown in Figure 1 and described below. An amount of 10 μL of individually barcoded PCR products were combined to a pooled library and visualized/separated by agarose gel electrophoresis. The PCR products were then excised from the agarose gel using a commercial kit (QIAquick Gel Extraction Kit, Qiagen, Hilden, Germany), and 20 μL of the eluted DNA was further purified using AMPure XP magnetic beads (1X) to build a single purified DNA pooled library. The library was then measured by the KAPA qPCR library quantification kit (KAPA Biosystems, Wilmington, MA, USA). The library was then run on an Illumina Mi-Seq sequencer using a 600-cycle pair-end reagent kit (Mi-Seq Reagent Kits v2, MS-103-2003). The final library concentration was 15 nM with the addition of 15% Phix Control v3 (Illumina, FC-11-2003) [14,20].

2.4. Bioinformatic Analyses

For the post-run processing of Mi-Seq data, the platform used the barcoded indices to split all sequences by sample type and generate FASTQ files. FASTQ files were then analyzed by the Mothur v1.39.5 software [21,22], with slight modifications to the standard operating procedure (SOP) (Illumina Mi-Seq, available through the Mendeley database DOI: 10.17632/4cvwmvdgnj.1 Command Prompt pipeline). The overall bioinformatic analyses were described in our previous studies [14,18] and are shown in Figure 1. Briefly, the raw paired-end reads were run in the ‘make.contigs’ command for combining the two sets of reads (for each sample). By doing so, the sequences were extracted, and the quality score was assessed from the FASTQ files. This complemented the reverse and forward reads and then joined them into contigs. After this, the ambiguous sequence reads were removed, and the remaining data were aligned with the T. evansi P2 adenosine transporter-1 (AT-1) reference sequence library (through the Mendeley database DOI: 10.17632/4cvwmvdgnj.1), deploying the ‘align. seqs’ command. Only the samples yielding > 500 reads were included in the downstream analyses. The sequences that were not matched to the T. evansi P2 adenosine transporter-1 (AT-1) reference library were removed from the ‘summary. seqs’ command. Then, the T. evansi P2 adenosine transporter-1 (AT-1) sequence reads were further run on the ‘screen. seqs’ command to generate the FASTQ file. Finally, once the sequence reads were labeled as P2 adenosine transporter-1 (AT-1), a count list of the amplicon sequence variant of each isolate was created using the ‘unique. seqs’ command. The count list was then further used to create FASTQ files of the amplicon sequence variant of each isolate using the ‘split. groups’ command (Mendeley database DOI: 10.17632/4cvwmvdgnj.1).

2.5. Statistical Analyses of the Amplicon Variance

The amplicon sequence variants for the P2 adenosine transporter-1 (AT-1) locus were aligned using the MUSCLE alignment tool in the Geneious v9.1 software (Biomatters Ltd., Auckland Central, New Zealand) for the analyses of mutations associated with diminazene resistance at codons 178, 181, 239, and 286. The relative allele frequencies of T. evansi P2 adenosine transporter-1 (AT-1) resistance-associated mutations identified in the field isolates were estimated by dividing each isolate’s sequence reads by the total number of reads (R Core Team, 2013; package ggplot2). The genetic diversities of the P2 adenosine transporter-1 (AT-1) amplicon sequence variants were calculated among the isolates by using the DnaSP 5.10 software package [23]. The following values were obtained from the analyses: the number of segregating sites (S), heterozygosity (He), nucleotide diversity (π), and the mean number of pairwise differences (k).

3. Results

3.1. Genetic Diversity in the T. evansi P2 Adenosine Transporter-1 (AT-1) Locus

In total, 26 positive field samples [cattle (n = 14), buffalo (n = 2), camels (n = 7), sheep (n = 2), goats (n = 1), and negative control (n = 5)] were used to investigate genetic diversity in the T. evansi P2 adenosine transporter-1 (AT-1) locus. High levels of gene diversity were seen in the P2 adenosine transporter-1 (AT-1) locus of seven T. evansi isolates (Table 1) with potential resistance-type mutations (Table 2). The mean nucleotide diversity (π) of the seven isolates ranged from 0.013–0.041; segregating sites (S) ranged from 53–111; and pairwise differences (k) ranged from 7.36–9.90. Genetic diversity was comparatively low in seven T. evansi isolates (Table 1) with potential susceptible-type mutations (Table 2). The mean nucleotide diversities (π) of the seven isolates ranged from 0.003–0.009; segregating sites (S) ranged from 5–42; and pairwise differences (k) ranged from 3.24–8.53. Genetic diversity could not be calculated in twelve T. evansi isolates (Table 1) due to the presence of identical alleles with potential susceptible-type mutations (Table 2).

3.2. Potential Diminazene Resistance-Type Mutations

The presence of four potential diminazene resistance-type mutations at codons 178, 181, 239, and 286 of the P2 adenosine transporter-1 (AT-1) locus was determined by deep amplicon sequencing (Table 2). Diminazene resistance-type mutation GAA(178E) and TCA(178S) were detected in one isolate (Pop277). The GGT(239Y) resistance-type mutation was present in three isolates (Pop203, Pop278, and Pop287), GCT(239A) was present in one isolate (Pop266), and GCT(239A)/GAG(239E) was present in one isolate (Pop277) (Table 2). Diminazene resistance-type mutations AGC(286S), AGC(286H), ATC(286I), AAC(286N), and GAC(286D) were present in three isolates (Pop203, Pop207, and Pop279). The ATC(286I), GAC(286D), and ACC(286T) resistance-type mutations were present in three isolates (Pop266, Pop279, and Pop287) (Table 2). The GCA(A178), GGA(G181), GAT(D239), and AAC(N286) susceptible-type mutations were present in nineteen isolates (Table 2).

3.3. Allele Frequencies of Diminazene Resistance-Type Mutations

The frequencies of four diminazene resistance-type mutations at codons 178, 181, 239, and 286 of the P2 adenosine transporter-1 (AT-1) locus were determined in 26 T. evansi field isolates. The GAA(178E) and TCA(178S) resistance-type mutations were present at frequencies of 6.17% and 4.80% in one isolate (Pop277). The GAT(239Y), GCT(239A), and GTT(239E) resistance-type mutations were present at frequencies ranging between 5.59% and 14.26% in five isolates (Pop203, Pop266, Pop277, Pop278, and Pop287) (Table 3, Supplementary Table S3). The AGC(286S), AGC(286H), ATC(286I), GAC(286D), and ACC(286T) resistance-type mutations were present at frequencies ranging between 6.08% and 14.55% in six isolates (Pop203, Pop207, Pop266, Pop278, Pop279, and Pop 287) (Table 3, Supplementary Table S3). The GGA(G181), GCA(A178), GAT(D239), and AAC(N286) susceptible-type mutations were present at a frequency of 100% in nineteen isolates (Table 3, Supplementary Table S3).

4. Discussion

The current study used ADS for the first time to explore the genetic diversity of the T. evansi P2 adenosine transporter-1 (AT-1) locus and its potential link to diminazene resistance in endemic regions of Pakistan. These regions were chosen because animals are treated sporadically, often with generic diminazene drugs of unknown quality. Drug brands containing diminazene have been widely used throughout the globe to treat trypanosomiasis because they are relatively inexpensive and safe. Therefore, studying the genetic diversity in T. evansi species is essential to designing future strategies for the functional linkage of the P2 adenosine transporter-1 (AT-1) locus to diminazene resistance in this organism.
The genetic data demonstrate that the P2 adenosine transporter-1 (AT-1) locus of the T. evansi isolates is diverse. The high level of gene diversity combined with the high biotic potential of the parasite will inevitably confer genetic adaptability, eventually enabling the development of drug-resistance mutations. Livestock worldwide, including in Pakistan, are frequently treated with diminazene, and anecdotal evidence suggests that resistance is emerging (as per comm by Prof Kamran Ashraf). This worrisome situation implies that there is likely to be intense selection pressure for the development of drug resistance in the case of diaminazine. Furthermore, the underlying study has significant implications, considering that diminazene is among the few drugs available to treat trypanosomiasis in Pakistani livestock.
In the current study, we further reported the resistance-type mutations at codons 178E/178S, 239Y/239A/239E, and 286S/286H/286I/286D/286T of the P2 adenosine transporter-1 (AT-1) locus in T. evansi field isolates across all the seven cities of Pakistan. Our results demonstrated that 7 out of 26 T. evansi isolates had potential diminazene resistance-type mutations, with the allele frequencies ranging from 4.80–14.26%. In addition, contrary to the mutations found in this study, previous studies have documented diminazene resistance-associated P2 adenosine transporter-1 (AT-1) mutations at codons 178T, 239G, and 286S of T. brucei gambiense [8,9,10,11]. To this end, varying drug doses may explain the differences in these mutations in T. evansi and T. brucei and their observed frequency. Another highly speculative explanation may be that the mutations confer a fitness cost, depending on the parasites’ genetic background. A third explanation may be due to the genetic drift of susceptible- or resistant-type alleles with the movement of animals to new places. As there is a large amount of animal movement in the study region, gene flow may also play an essential role in spreading the infection and its associated mutation resistance. Finally, a fourth explanation is that the differences may be due to bottlenecking effects, which result in the loss of less common mutations [14].

5. Conclusions

To conclude, the current study is timely, as it reports a high level of genetic diversity among seven T. evansi field isolates that had mutations at codons 178E/S, 239Y/A/E, and 286S/H/I/D/T, which may play a significant role in developing a diminazene-resistant phenotype. The reported findings warrant further investigations to establish a mechanistic relationship between diminazene resistance and the mutations in P2 adenosine transporter-1 (AT-1).

Supplementary Materials

The following supporting information can be downloaded at: https://www.mdpi.com/article/10.3390/ani15050756/s1, Table S1: Primer set for T. evansi AT-1 locus amplification. TbAT _For/TbAT _Rev primer sequences are underlined, N’s are bolded.; Table S2: Deep amplicon sequencing data of haemoprotozan parasites from field samples. A total of 26 Trypanosoma-positive samples [cattle (n = 14), buffalo (n = 2), camel (n = 7), sheep (n = 2), goat (n = 1)] were collected from veterinary clinics throughout the Punjab province of Pakistan; Table S3: Deep amplicon sequencing data of adenosine transporter-1 (AT-1) locus in 26 T. evansi isolates.

Author Contributions

The authors’ contributions are as follows: U.C. conceived the present study and explained the data. U.C., S.A., Q.A. and G.Y. conducted the study, analyzed the data, and wrote the manuscript. S.A., K.A., M.B. and N.S. gave critical suggestions during the experiment and wrote the manuscript. All the authors revised the manuscript. All authors have read and agreed to the published version of the manuscript.

Funding

Work at the University of Veterinary and Animal Science Pakistan uses facilities funded by the Higher Education Commission of Pakistan (1-8/HEC/HRD/2019/7895).

Institutional Review Board Statement

The study was approved by the Institutional Review Board of the University of Veterinary and Animal Sciences Punjab, Pakistan (UVAS-793-1). Key administrative and community leaders were interviewed to raise awareness of the study and encourage livestock farms to participate.

Informed Consent Statement

Not applicable.

Data Availability Statement

The following supporting information can be downloaded at: DOI: 10.17632/4cvwmvdgnj.1.

Conflicts of Interest

The authors declare no conflicts of interest.

References

  1. Cayla, M.; Rojas, F.; Silvester, E.; Venter, F.; Matthews, K.R. African Trypanosomes. Parasit. Vectors 2019, 12, 190. [Google Scholar] [CrossRef] [PubMed]
  2. Desquesnes, M.; Holzmuller, P.; Lai, D.-H.; Dargantes, A.; Lun, Z.-R.; Jittaplapong, S. Trypanosoma Evansi and Surra: A Review and Perspectives on Origin, History, Distribution, Taxonomy, Morphology, Hosts, and Pathogenic Effects. Biomed. Res. Int. 2013, 2013, 194176. [Google Scholar] [CrossRef] [PubMed]
  3. Ventura, R.M.; Takeda, G.F.; Silva, R.A.M.S.; Nunes, V.L.B.; Buck, G.A.; Teixeira, M.M.G. Genetic Relatedness among Trypanosoma Evansi Stocks by Random Amplification of Polymorphic DNA and Evaluation of a Synapomorphic DNA Fragment for Species-Specific Diagnosis. Int. J. Parasitol. 2002, 32, 53–63. [Google Scholar] [CrossRef] [PubMed]
  4. Fairlamb, A.H.; Horn, D. Melarsoprol Resistance in African Trypanosomiasis. Trends Parasitol. 2018, 34, 481–492. [Google Scholar] [CrossRef]
  5. Barrett, M.P.; Zhang, Z.Q.; Denise, H.; Giroud, C.; Baltz, T. A Diamidine-Resistant Trypanosoma Equiperdum Clone Contains a P2 Purine Transporter with Reduced Substrate Affinity. Mol. Biochem. Parasitol. 1995, 73, 223–229. [Google Scholar] [CrossRef]
  6. Gehrig, S.; Efferth, T. Development of Drug Resistance in Trypanosoma Brucei Rhodesiense and Trypanosoma Brucei Gambiense. Treatment of Human African Trypanosomiasis with Natural Products (Review). Int. J. Mol. Med. 2008, 22, 411–419. [Google Scholar]
  7. Delespaux, V.; Geysen, D.; Van den Bossche, P.; Geerts, S. Molecular Tools for the Rapid Detection of Drug Resistance in Animal Trypanosomes. Trends Parasitol. 2008, 24, 236–242. [Google Scholar] [CrossRef]
  8. Kazibwe, A.J.; Nerima, B.; de Koning, H.P.; Mäser, P.; Barrett, M.P.; Matovu, E. Genotypic Status of the TbAT1/P2 Adenosine Transporter of Trypanosoma Brucei Gambiense Isolates from Northwestern Uganda Following Melarsoprol Withdrawal. PLoS Negl. Trop. Dis. 2009, 3, e523. [Google Scholar] [CrossRef]
  9. Mäser, P.; Sütterlin, C.; Kralli, A.; Kaminsky, R. A Nucleoside Transporter from Trypanosoma Brucei Involved in Drug Resistance. Science 1999, 285, 242–244. [Google Scholar] [CrossRef]
  10. Carter, N.S.; Barrett, M.P.; de Koning, H.P. A Drug Resistance Determinant in Trypanosoma Brucei. Trends Microbiol. 1999, 7, 469–471. [Google Scholar] [CrossRef]
  11. Matovu, E.; Geiser, F.; Schneider, V.; Mäser, P.; Enyaru, J.C.; Kaminsky, R.; Gallati, S.; Seebeck, T. Genetic Variants of the TbAT1 Adenosine Transporter from African Trypanosomes in Relapse Infections Following Melarsoprol Therapy. Mol. Biochem. Parasitol. 2001, 117, 73–81. [Google Scholar] [CrossRef] [PubMed]
  12. Witola, W.H.; Inoue, N.; Ohashi, K.; Onuma, M. RNA-Interference Silencing of the Adenosine Transporter-1 Gene in Trypanosoma Evansi Confers Resistance to Diminazene Aceturate. Exp. Parasitol. 2004, 107, 47–57. [Google Scholar] [CrossRef] [PubMed]
  13. Witola, W.H.; Tsuda, A.; Inoue, N.; Ohashi, K.; Onuma, M. Acquired Resistance to Berenil in a Cloned Isolate of Trypanosoma Evansi Is Associated with Upregulation of a Novel Gene, TeDR40. Parasitology 2005, 131 Pt 5, 635–646. [Google Scholar] [CrossRef]
  14. Chaudhry, U.; Ali, Q.; Zheng, L.; Rashid, I.; Shabbir, M.Z.; Numan, M.; Ashraf, K.; Evans, M.; Rafiq, S.; Oneeb, M.; et al. Contrasting Population Genetics of Co-Endemic Cattle- and Buffalo- Derived Theileria Annulata. Ticks Tick. Borne Dis. 2021, 12, 101595. [Google Scholar] [CrossRef] [PubMed]
  15. Ai, L.; Chen, M.-X.; Alasaad, S.; Elsheikha, H.M.; Li, J.; Li, H.-L.; Lin, R.-Q.; Zou, F.-C.; Zhu, X.-Q.; Chen, J.-X. Genetic Characterization, Species Differentiation and Detection of Fasciola spp. by Molecular Approaches. Parasites Vectors 2011, 4, 101. [Google Scholar] [CrossRef]
  16. Rehman, Z.; Tashibu, A.; Tashiro, M.; Rashid, I.; Ali, Q.; Zahid, O.; Ashraf, K.; Shehzad, W.; Chaudhry, U.; Ichikawa-Seki, M. Molecular Characterization of Fasciola Gigantica in Punjab, Pakistan to Infer the Dispersal Route among the Neighbouring Countries of the Indian Subcontinent. bioRxiv 2020. [Google Scholar] [CrossRef]
  17. Shaukat, A.; Ali, Q.; Connelley, T.; Khan, M.A.U.; Saleem, M.A.; Evans, M.; Rashid, I.; Sargison, N.D.; Chaudhry, U. Selective Sweep and Phylogenetic Models for the Emergence and Spread of Pyrimethamine Resistance Mutations in Plasmodium Vivax. Infect. Genet. Evol. 2019, 68, 221–230. [Google Scholar] [CrossRef]
  18. Ali, Q.; Zahid, O.; Mhadhbi, M.; Jones, B.; Darghouth, M.A.; Raynes, G.; Afshan, K.; Birtles, R.; Sargison, N.D.; Betson, M.; et al. Genetic Characterisation of the Theileria Annulata Cytochrome b Locus and Its Impact on Buparvaquone Resistance in Bovine. Int. J. Parasitol. Drugs Drug Resist. 2022, 20, 65–75. [Google Scholar] [CrossRef]
  19. Yasein, G.; Zahid, O.; Minter, E.; Ashraf, K.; Rashid, I.; Shabbir, M.Z.; Betson, M.; Sargison, N.D.; Chaudhry, U. A Novel Metabarcoded Deep Amplicon Sequencing Tool for Disease Surveillance and Determining the Species Composition of Trypanosoma in Cattle and Other Farm Animals. Acta Trop. 2022, 230, 106416. [Google Scholar] [CrossRef]
  20. Chaudhry, U.; Ali, Q.; Rashid, I.; Shabbir, M.Z.; Ijaz, M.; Abbas, M.; Evans, M.; Ashraf, K.; Morrison, I.; Morrison, L.; et al. Development of a Deep Amplicon Sequencing Method to Determine the Species Composition of Piroplasm Haemoprotozoa. Ticks Tick. Borne Dis. 2019, 10, 101276. [Google Scholar] [CrossRef]
  21. Kozich, J.J.; Westcott, S.L.; Baxter, N.T.; Highlander, S.K.; Schloss, P.D. Development of a Dual-Index Sequencing Strategy and Curation Pipeline for Analyzing Amplicon Sequence Data on the MiSeq Illumina Sequencing Platform. Appl. Environ. Microbiol. 2013, 79, 5112–5120. [Google Scholar] [CrossRef] [PubMed]
  22. Schloss, P.D.; Westcott, S.L.; Ryabin, T.; Hall, J.R.; Hartmann, M.; Hollister, E.B.; Lesniewski, R.A.; Oakley, B.B.; Parks, D.H.; Robinson, C.J. Introducing Mothur: Open-Source, Platform-Independent, Community-Supported Software for Describing and Comparing Microbial Communities. Appl. Environ. Microbiol. 2009, 75, 7537–7541. [Google Scholar] [CrossRef] [PubMed]
  23. Librado, P.; Rozas, J. DnaSP v5: A Software for Comprehensive Analysis of DNA Polymorphism Data. Bioinformatics 2009, 25, 1451–1452. [Google Scholar] [CrossRef] [PubMed]
Figure 1. A flow diagram of sample preparation and bioinformatics data handling of the metabarcoded sequencing library.
Animals 15 00756 g001
Table 1. Summary of genetic diversity indices for the P2 adenosine transporter-1 (AT-1) locus in 26 T. evansi isolates.
Field IsolatesTotal No of Illumina Mi-Seq ReadsSusceptible-Type ReadsResistance-Type ReadsHeterozygosity (He)Nucleotide Diversity (π)Segregating Sites (S)Pairwise Differences (k)HostEndemic Region
Pop203267519547210.00110.01326947.362CamelRahim Yar Khan
Pop207226116765850.00140.014151067.853CamelRahim Yar Khan
Pop266271618518650.00310.01784979.902CamelMultan
Pop277256017715080.00210.015871118.806BuffaloLayyah
Pop278142611033230.00140.014081017.812BuffaloLayyah
Pop279140912301790.01200.01464538.123CattleLayyah
Pop287195414405140.01500.04122788.156GoatRahim Yar Khan
Pop11112621262 0.27200.0060153.333CattleBahawalpur
Pop20213971397 0.17700.0088594.500CattleBahawalpur
Pop20813461346 0.31400.0060153.242CattleLodhraan
Pop21023612361 0.07700.00955153.000CamelRahim Yar Khan
Pop26827332733 0.04500.00529215.600CamelRahim Yar Khan
Pop28319601960 0.02700.00367428.538CamelRahim Yar Khan
Pop28415091509 0.03900.00461378.109CattleLayyah
Pop25317081708 N/ASheepRahim Yar Khan
Pop19914441444 N/ASheepRahim Yar Khan
Pop23416141614 N/ACattleMuzafargar
Pop21722612261 N/ACamelLodhraan
Pop22022212221 N/ACattleBahawalpur
Pop23712891289 N/ACattleDera Ghazi Khan
Pop23022822282 N/ACattleDera Ghazi Khan
Pop23812471247 N/ACattleBahawalpur
Pop2522672267 N/ACattleDera Ghazi Khan
Pop11428432843 N/ACattleDera Ghazi Khan
Pop10030873087 N/ACattleMuzafargar
Pop11232763276 N/ACattleRahim Yar Khan
Table 2. P2 adenosine transporter-1 (AT-1)-type mutations were detected in 26 T. evansi field isolates. Nonsynonymous mutations associated with resistance in T. brucei were identified at positions GAA(178E), TCA(178S), GGT(239Y), GCT(239A), GAG(239E), AGC(286S), CAC(286H), ATC(286I), GAC(286D), and ACC(286T). Other nonsynonymous mutations were identified at positions GCA(A178), GGA(G181), GAT(D239), and AAC(N286).
Nucleotide532–534
(GCA/GAA/TCA)
541–543
(GGA/GAA)
715–717
(GAT/GGT/GCT/GAG)
856–858
(AAC/AGC/CAC/ATC/GAC/ACC)
HostEndemic Region
Codon178
A/E/S
181
G/E
239
D/Y/A/E
286
N/S/H/I/D/T
Pop203 AGD/YN/S/HCamelRahim Yar Khan
Pop207 AGDN/H/ICamelRahim Yar Khan
Pop266 AGD/AN/I/D/TCamelMultan
Pop277 A/E/SGD/E/ANBuffaloLayyah
Pop278 AGD/YN/SBuffaloLayyah
Pop279 AGDN/DCattleLayyah
Pop287 AGD/YN/T/DGoatRahim Yar Khan
Pop100 AGDNCattleBahawalpur
Pop111 AGDNCattleBahawalpur
Pop112 AGDNCattleLodhraan
Pop202 AGDNCamelRahim Yar Khan
Pop208 AGDNCamelRahim Yar Khan
Pop210 AGDNCamelRahim Yar Khan
Pop268 AGDNCattleLayyah
Pop283 AGDNSheepRahim Yar Khan
Pop284 AGDNSheepRahim Yar Khan
Pop253 AGDNCattleMuzafargar
Pop199 AGDNCamelLodhraan
Pop234 AGDNCattleBahawalpur
Pop217 AGDNCattleDera Ghazi Khan
Pop220 AGDNCattleDera Ghazi Khan
Pop237 AGDNCattleBahawalpur
Pop230 AGDNCattleDera Ghazi Khan
Pop238 AGDNCattleDera Ghazi Khan
Pop25 AGDNCattleMuzafargar
Pop114 AGDNCattleRahim Yar Khan
Table 3. Relative allele frequencies of the P2 adenosine transporter-1 (AT-1) resistance-type mutations in 7 T. evansi isolates. The relative allele frequency was based on the SNPs identified using deep amplicon sequencing technology.
Field IsolatesSusceptible Type Mutations %Resistant Type Mutations %
GCA(A178) GGA(G181) GAT(D239) AAC(N286)GAA(178E)TCA(178S)GGT(239Y)GCT(239A)GAG(239E)AGC(286S)CAC(286H)ATC(286I)GAC(286D)ACC(286T)
Pop20373.05 7.07 9.1610.73
Pop20774.13 14.5511.32
Pop26668.15 9.02 10.166.086.59
Pop27769.186.174.80 5.5914.26
Pop27877.35 10.17 12.48
Pop27987.30 12.70
Pop28773.69 10.18 8.507.63
Disclaimer/Publisher’s Note: The statements, opinions and data contained in all publications are solely those of the individual author(s) and contributor(s) and not of MDPI and/or the editor(s). MDPI and/or the editor(s) disclaim responsibility for any injury to people or property resulting from any ideas, methods, instructions or products referred to in the content.

