Simple Summary
This study employed DNA metabarcoding combined with a self-constructed plant DNA barcode database to analyze sex-specific dietary composition and trophic niche characteristics in two small mammals, plateau pikas (Ochotona curzoniae) and plateau zokors (Eospalax baileyi), with contrasting lifestyles and social structures in alpine meadows. For plateau pikas, dietary richness was broadly comparable between sexes, with Taraxacum mongolicum the most frequent item (20.23% in females; 28.39% in males). Females nonetheless exhibited significantly greater dietary diversity and niche breadth than males. For plateau zokors, richness was likewise comparable, and T. mongolicum again constituted the largest dietary proportion (32.81% in females; 25.27% in males). No significant difference in niche breadth was observed between sexes, and their dietary structures showed a high degree of overlap. These findings suggest that small mammals with different lifestyles and social structures may exhibit divergent patterns of dietary variation between sexes.
Abstract
Quantifying sex-specific dietary differences in small mammals reveals the internal resource allocation mechanisms within a species and provides new insights for ecosystem management and conservation practices. The plateau pika (Ochotona curzoniae) and plateau zokor (Eospalax baileyi) are dominant small mammals that exhibit distinct lifestyles and social structures on the Qinghai-Tibetan Plateau. Despite the fact that the diets of both species have been extensively studied, sex-specific dietary differences have rarely been investigated. This study employed DNA metabarcoding combined with a self-constructed plant DNA barcode database to analyze the diet composition and trophic niche of male and female plateau pika and plateau zokor during the growing season. The results showed that male and female plateau pika consumed 39 and 37 plant species, respectively, and male and female plateau zokor consumed 38 and 39 plant species, respectively. With respect to the plateau pika, males showed a significantly higher intake of Phlomoides umbrosa than females (p < 0.05), whereas females consumed a significantly greater proportion of tuberous plants (p < 0.05). Females also exhibited a significantly greater dietary diversity and trophic niche breadth than males. But there was no significant difference in dietary diversity and trophic niche breadth between the sexes in the plateau zokor. In conclusion, our results show that dietary differences between males and females depend on each species’ lifestyle. Social, surface-living pikas show apparent sex-based differences, while solitary, underground-living zokors do not.
1. Introduction
Small mammals play a crucial role in terrestrial ecosystems worldwide. They are not only an important food source for many predators but also significantly influence plant community structure, seed dispersal, nutrient cycling, and soil physicochemical properties through their foraging behavior [1]. In this group, dietary studies have always been central to understanding niche differentiation, community dynamics, and ecosystem functions. An increasing number of studies indicate that animals often show sex-specific trophic niches, as males and females maximize fitness under different constraints imposed by sexual selection, parental investment, and life-history trade-offs [2,3,4]. Classic theory predicts that the sex under stronger intrasexual competition for mates should accept higher foraging variance or risk to secure the energetic and condition-dependent traits that enhance mating success. In contrast, the sex with greater obligatory parental investment prioritizes consistent intake and safety [5]. These sex-specific optima are further modulated by mating system and social structure (e.g., colonial vs. solitary living) that shape competition, vigilance, and time budgets, thereby altering diet breadth and resource overlap [6]. Consequently, we expect stronger dietary segregation when sociality and surface activity amplify sex differences in risk–reward trade-offs, but weaker segregation when both sexes exploit similar, shielded resources in constrained environments.
In the typical alpine rangeland ecosystem of the Qinghai–Tibetan Plateau (QTP), small mammals are the primary herbivores and play a significant role in rangeland ecological processes [7,8]. Specifically, the plateau pika (Ochotona curzoniae) and plateau zokor (Eospalax baileyi) are dominant small mammals in this ecosystem and represent two distinct lifestyles and social patterns [8]. The plateau pika is sexually monomorphic in external morphology and body mass, lives diurnally above ground in family groups that occupy exclusive burrow systems [9]. Although direct evidence on its mating system is limited, the absence of sexual dimorphism together with observed male–male aggression and a female-biased adult sex ratio suggests a polygynous social structure. In contrast, the plateau zokor (Eospalax baileyi) is a subterranean, predominantly solitary rodent that shows little external sexual dimorphism; it lacks a colonial social organization, and mating occurs underground without persistent multi-female groups [10]. Both sexes experience similar below-ground constraints and mainly exploit roots, rhizomes, and storage organs, including selective harvesting for winter caches, which may limit the scope for sex-biased diets compared with surface-active, colonial species [10]. Reports of explicit dominance hierarchies are scarce, consistent with solitary space use outside the breeding season. When the population size of these two mammals increases significantly, they compete with livestock for forage resources, and behaviors such as soil excavation and mound building further exacerbate alpine meadows degradation; thus, they are regarded as “pests” [11]. Hence, studying their diets is essential to elucidate their roles in alpine rangeland ecosystems. Most existing research has focused on the overall diet of a species or population in the context of seasonal variation. Kang [12] found that the diet of plateau pika varied significantly across different periods, Zhang [13] reported that plateau pika and plateau zokor consumed largely the same plant species but in different proportions, and Zhou [14] observed that the two species exhibited trophic niche differentiation at short temporal scales. However, few studies have addressed sexual segregation in food resource use between plateau pikas and plateau zokors. As primary consumers within the Qinghai–Tibet Plateau food chain, both species exhibit high behavioral plasticity, and external environmental factors can readily induce changes in their foraging strategies [15], indirectly affecting the structure of alpine grassland plant communities. In addition, earlier studies on the diet of small mammals rely on traditional methods such as field observations, the microtissue method of stomach contents, laboratory cage feeding, fecal microtissue analysis, and stable isotope analysis [16]. However, traditional dietary methods have distinct limitations in terms of bias, labor intensity, and taxonomic resolution. DNA metabarcoding offers a more sensitive, efficient, and comprehensive approach to studying mammalian diets. At present, DNA metabarcoding was employed to investigate the trophic niche characteristics of dominant rodents in desert steppe ecosystems [17]. Few studies have yet employed DNA metabarcoding to examine the diet composition of plateau pika and plateau zokor.
Consider the distinct lifestyles and social structure of plateau pika and plateau zokor in the alpine meadow ecosystems of the Qinghai–Tibetan Plateau, a key unresolved question is: do males and females of these two dominant small mammals exhibit differences in diet composition and trophic niche utilization, and if so, are these differences consistent across species with contrasting lifestyles. We hypothesize that sex-specific dietary differences occur in plateau pikas but not in plateau zokors. In surface-dwelling and social plateau pikas, the combination of heterogeneous aboveground resources, sex-related behavioral strategies, and complex social structures enhances dietary divergence between males and females. In contrast, in solitary subterranean plateau zokors, tunnel geometry, high energetic costs of burrowing, and the relative homogeneity of belowground storage organs constrain resource selection, resulting in convergent diets between sexes.
2. Materials and Methods
2.1. Study Area
The study area is located in Maqu County, Gannan Tibetan Autonomous Prefecture, Gansu Province (Figure 1; 34°0′26″ N, 102°2′47″ E), with an average elevation of 3410 m. The region experiences two distinct seasons: a cold season averaging 314 days and a warm season averaging 51 days. The mean annual temperature is 1.8 °C, with an average annual sunshine duration of 2594.8 h, mean annual precipitation of 615.5 mm, and mean annual evaporation of 1347.3 mm [18]. The rangeland type is alpine meadow. According to our on-site vegetation surveys, the dominant species are herbaceous taxa, namely Kobresia spp., Elymus spp., Potentilla spp., and Taraxacum spp. The small mammal community is dominated by plateau pika and plateau zokor. We sampled natural, free-ranging populations within a continuously distributed alpine-meadow landscape. To isolate within-species sex effects and avoid interspecific confounding, we established separate, species-specific 1-ha plots for the two species. To avoid distribution overlap between plateau pika and plateau zokor, adjacent plots were spaced 50 m apart according to the home-range sizes of the two species [19,20]. Field sampling was conducted in August 2024, deliberately scheduled outside the breeding season of both study species—plateau pika and plateau zokor—which generally spans April–June [9,21].
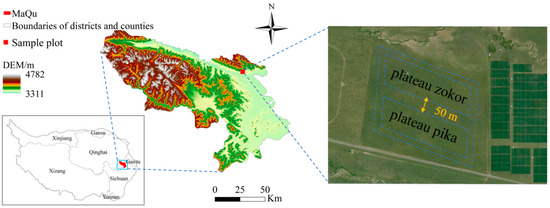
Figure 1.
Study area. With the WGS84 datum (coordinate system). Polygons indicate the exact sampling areas. The administrative division base map data used was downloaded from the Standard Map Service System, available at http://bzdt.ch.mnr.gov.cn/, with the approval number: GS (2020) 4619 for the standard map of China. The boundaries of the base map have not been modified. To facilitate comparison with previous work, we note that our site is located ~1 km from the centroid reported by Dong (2025, Animals 15:902) [7] and represents a different sampling plot.
2.2. Plant Sampling and Construction of DNA Barcode Database
At each plot, 150 circular quadrats with 0.1 m2 were placed at equal 5 m intervals; in total, 300 quadrats were surveyed to record plant species. The results showed that 49 plant species from 40 genera and 19 families were recorded within the plots (Table A1). Guided by the resulting data, plants were collected from the plots, selecting fresh, young leaves with intact petioles. For each species, approximately 1 g of tissue was placed into 5 mL centrifuge tubes, snap-frozen in liquid nitrogen, stored at −80 °C, and transported on dry ice. To ensure high-quality DNA, senescent or severely discolored leaves were avoided. Plant DNA was amplified by PCR using the trnL (UAA) intron primers trnL-c (CGAAATCGGTAGACGCTACG) and trnL-d (GGGGATAGAGGGACTTGAAC), yielding an expected amplicon of approximately 700 bp. DNA extraction and sequencing were outsourced to Personalbio Co., Ltd., Shanghai, China (http://www.personalbio.cn). The resulting plant DNA barcodes were generated and compiled into a reference database.
2.3. Classification of Plant Root System Types
Given the contrasting foraging modes of plateau pika (consuming aboveground plant parts) and plateau zokor (consuming belowground parts), the 49 collected plant species were classified into six root system types following Root Systems of Grassland Plants in Northern China [22]: rhizomatous root system type, caespitose root system type, taproot root system type, fibrous root system type, sucker root system type and tuberous root system type.
2.4. Animal Sampling and DNA-Based Annotation of Stomach Contents
Within each species-specific 1-ha plot, animals were captured using field randomization guided by current activity signs. Observers walked zig-zag patrols that covered the entire plot and, starting from a coin toss to set the initial bearing, placed one trap at every k-th active sign encountered (pika: active burrow entrance; zokor: fresh mound/runway junction), subject to a ≥10 m minimum spacing between traps and a ≥5 m edge buffer. If a chosen point was unsuitable (bare ground/rock), the station was relocated ≤2 m to the nearest suitable microsite. Traps were checked at dusk and reset at the same station. Using foot-hold restraining traps—padded devices that secure the animal’s foot to limit movement and do not employ break-back/cervical mechanisms—we captured 20 plateau pikas and 20 plateau zokors (40 individuals in total). Subsequently, both plateau pikas and plateau zokors were euthanized under isoflurane inhalation anesthesia [23]. Of these, there were 10 female and 10 male plateau zokors, and 11 female and 9 male plateau pikas. All individuals were dissected, and stomach contents were collected, placed into cryogenic tubes, snap-frozen in liquid nitrogen, and transported on dry ice. The experimental protocol was approved by the Animal Ethics Committee of Gansu Agricultural University (GSAU-Eth-PRA-2023-023) and was carried out in accordance with the relevant ethical guidelines. Stomach-content DNA was amplified by PCR using the trnL (UAA) intron primers trnL-c CGAAATCGGTAGACGCTACG) and trnL-d (GGGGATAGAGGGACTTGAAC) [24]. Primer sequences were trimmed with cutadapt (-O: 10, minimum 10 bp overlap) and reads lacking primer matches were discarded [25]. Paired-end reads were merged with VSEARCH (fastq_mergepairs), quality-filtered (fastq_filter), dereplicated (derep_fulllength), and clustered at 98% sequence identity using cluster_size [26]. Chimeras were detected de novo with UCHIME (uchime_denovo) [27], and any residual putative chimeras were further removed with a custom Perl script to obtain a high-quality read set. The resulting sequences were then clustered at 97% identity with cluster_size to generate representative sequences and an OTU (Operational taxonomic unit) table [26]. Singleton OTUs (i.e., OTUs with a total abundance of 1 across all samples) and their representative sequences were removed. Representative sequences were queried against a curated plant DNA barcode reference database, and taxonomic assignments were made using BitScore as the decision criterion; for each representative sequence, the top-BitScore hit was retained [28]. Based on the OTU abundance table, rarefaction was performed by randomly subsampling each sample to a uniform sequencing depth to estimate the number of observed OTUs and their relative abundances at that depth (pipeline largely following the VSEARCH workflow; analyses supported by Shanghai Personalbio) [29]. DNA sequencing of the stomach contents was also outsourced to Personalbio Co., Ltd., Shanghai, China (http://www.personalbio.cn), and sequence reads were matched against the previously constructed plant DNA barcode database to identify the ingested plant species. Sequencing depth was sufficient to capture the dietary diversity across individuals (Figure 2).
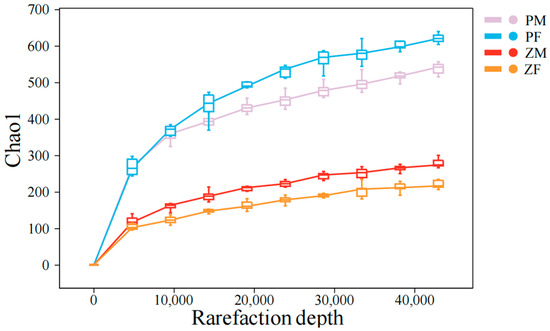
Figure 2.
Rarefaction depth. The degree of curve flattening reflects the effect of sequencing depth on the observed sample diversity; the flatter the curve, the more it indicates that the sequencing results sufficiently capture the diversity present in the current samples. ‘PM’ denotes male plateau pika; ‘PF’ denotes female plateau pika; ‘ZM’ denotes male plateau zokor; and ‘ZF’ denotes female plateau zokor.
2.5. Data Analysis
2.5.1. Food Diversity
We computed dietary indices from the relative abundances of plant food taxa in stomach contents. Species richness was estimated by the Chao1 index (Chao1) [30], which infers the total number of dietary plant taxa, including rare foods detectable at low read counts. Dietary diversity was quantified by the Shannon index (H) [31] and the Simpson index (D) [32], both reflecting how many food taxa are eaten and how consumption is distributed among them (higher values indicate a more varied diet rather than reliance on a few foods). Dietary evenness was measured by Pielou’s index (J) [33], indicating whether intake is evenly spread across foods versus being dominated by a few preferred items (e.g., a diet overwhelmingly composed of one plant shows low evenness).
Sobs = the total number of non-zero OTUs actually observed in the sample
In the formula: F1 represents the number of OTUs with an abundance of 1; F2 represents the number of OTUs with an abundance of 2; S represents the number of OTUs in the sample; Pᵢ represents the relative abundance of the i-th OTU in the sample.
Bray–Curtis distance is a commonly used metric for assessing differences in species composition between two samples, especially in ecology for community comparisons. It primarily calculates the differences by considering species abundance in each sample, making it particularly suitable for analyzing relative abundance and community composition differences [34].
2.5.2. Trophic Niche Breadth and Overlap
To characterize feeding niches, we used the Levins index (B) [35] to describe trophic niche breadth—higher values indicate consumption of many food taxa at more similar shares (a broad, generalist diet), whereas lower values indicate focus on few preferred foods (a specialist diet). Pairwise trophic niche overlap between groups was quantified by Pianka’s overlap index (Ojk) [36], which measures the similarity of food-use profiles; values close to 1 denote highly similar diets, and values near 0 denote distinct diets.
In the formula, B represents niche breadth, and Pj represents the relative abundance of food item j.
In the formula, Pij and Pik represent the relative abundance of food item i in the diets of species j and k, respectively. The value of Ojk ranges from 0 to 1. According to Krebs’ criterion, Ojk > 0.3 is considered a meaningful overlap, and Ojk > 0.6 is considered a significant overlap.
2.6. Statistical Analysis
First, the raw data were preprocessed in Excel 2021, including data cleaning and formatting, to ensure accuracy and consistency. The relative abundance of OTUs within each sample was used to calculate the relative abundances of plant species in the stomach contents. Using QIIME2 2022.11, rarefaction curves were generated by randomly subsampling the total sequence counts in each sample at different depths, plotting the number of sequences obtained and the corresponding OTU counts at each depth [37]. Data were analyzed in SPSS 25.0. We now specify the tests and software used to check assumptions. Normality was evaluated with the Shapiro–Wilk test and visualized using Q–Q plots against the theoretical normal distribution N (μ, σ2), with μ and σ estimated from the sample within each group [38], and homoscedasticity with Levene’s test (median-centered). Independent-sample t-tests (under normality) or Mann–Whitney U tests (otherwise) were used to assess differences in plant community characteristics among sites and diet composition between plateau pikas and plateau zokors. Bray–Curtis distances were calculated using the vegan package in R 4.5.1 [34], and non-metric multidimensional scaling (NMDS) was performed based on the Bray–Curtis distance matrix to evaluate differences in stomach content food assemblies of plateau pika and plateau zokor. Data visualization of the analysis results was performed using Origin 2021.
3. Results
3.1. Diet Composition and Trophic Niche Characteristics of Plateau Pika
3.1.1. Sex-Specific Diet Composition and Foraging Proportions
The results showed that male and female plateau pika consumed a total of 39 and 37 plant species, respectively (Figure 3). Two taxa were detected exclusively in males Arenaria serpyllifolia (0.16 ± 0.10%; all variables are reported as mean ± SE.) and Lysimachia maritima (0.06 ± 0.05%). The top five plant species by relative abundance in males were Taraxacum mongolicum (28.39 ± 9.33%), Geranium pylzowianum (11.66 ± 4.78%), Poa pratensis (8.87 ± 3.57%), Astragalus polycladus (7.04 ± 2.07%), and Sphallerocarpus gracilis (6.14 ± 3.56%). In females, the top five were Taraxacum mongolicum (20.23 ± 3.38%), Potentilla anserina (11.46 ± 4.33%), Potentilla discolor (9.18 ± 4.40%), Poa pratensis (8.55 ± 1.92%), and Astragalus polycladus (6.53 ± 1.99%). Males showed a significantly higher intake of Phlomoides umbrosa than females (Nonparametric Mann–Whitney U test, p < 0.05) (Table 1), whereas females consumed a significantly greater proportion of tuberous plants (Nonparametric Mann–Whitney U test, p < 0.05) (Table 2).
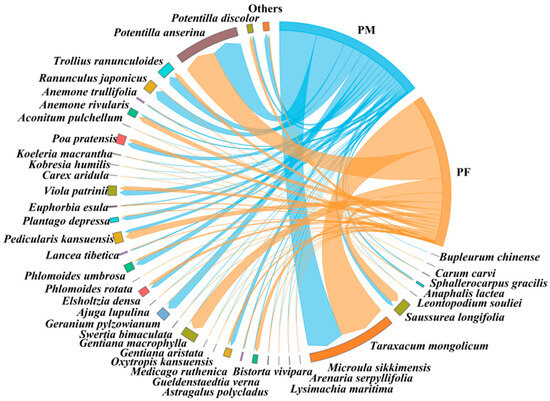
Figure 3.
Diet composition of male and female plateau pika. ‘PM’ denotes male plateau pika, ‘PF’ denotes female plateau pika.

Table 1.
Major food items and proportions with significant differences between male and female plateau pika.

Table 2.
Proportion of consumption of plants with different root types by male and female plateau pika.
Analysis of plateau pika dietary diversity (Figure 4) revealed that the Chao1 index exhibited a wider range of variation in males, whereas females showed relatively concentrated values, indicating greater fluctuations in community species richness among males compared with females. Overall, females exhibited higher Pielou’s evenness indices than males, with lower dispersion, suggesting a more balanced consumption of plant species. The Simpson index was significantly higher in females than in males (independent-samples t-test, p < 0.05), indicating a higher number and greater evenness of consumed species.
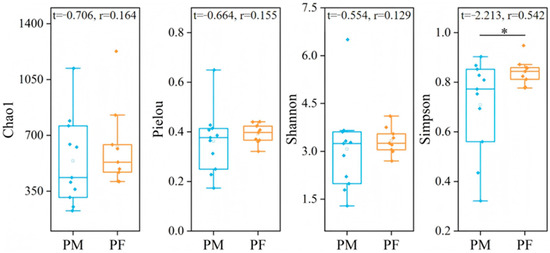
Figure 4.
Differences in dietary diversity between male and female plateau pika. ‘PM’ denotes male plateau pika, ‘PF’ denotes female plateau pika. The central line indicates the median; boxes represent the interquartile range (IQR, 25th–75th percentiles); whiskers extend to the most extreme values within 1.5 × IQR; and points denote individual observations. “*” indicates a significant difference at the 0.05 level. The same boxplot definitions apply to all subsequent figures.
3.1.2. Sex-Specific Trophic Niche
Analysis of the trophic niche characteristics of plateau pika (Table 3, Figure 5) revealed that females exhibited a significantly greater niche breadth than males (Nonparametric Mann–Whitney U test, p < 0.05), indicating broader food utilization. Despite this difference, niche overlap between sexes was high, suggesting that the principal plant taxa consumed were largely shared. here were significant differences in niche breadth between sexes, the degree of overlap was high, suggesting that while males and females differ in diet breadth, the main plant species they consume remain largely similar. Non-metric multidimensional scaling (NMDS) of dietary structure showed a certain degree of separation between male and female plateau pika, with partial overlap. Male sample points were more widely dispersed, reflecting high individual variability in food use, whereas female sample points were relatively clustered, indicating a more stable foraging strategy.

Table 3.
Trophic niche breadth and overlap of male and female plateau pika.
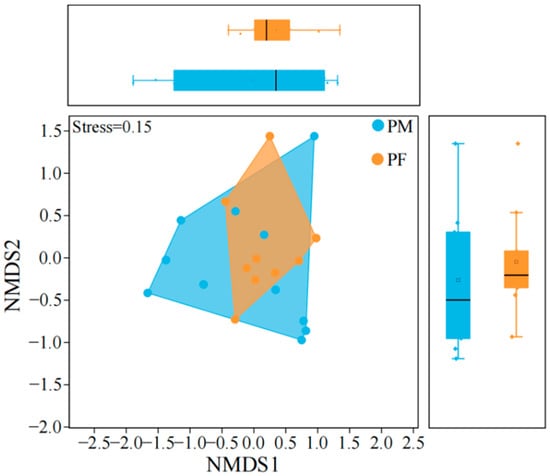
Figure 5.
Trophic niche structure model of male and female plateau pika. ‘PM’ denotes male plateau pika, ‘PF’ denotes female plateau pika. Boxplots summarize the distributions of animal sample scores on NMDS1 and NMDS2, and their axis ticks are aligned with those of the main NMDS plot. The same applies hereinafter.
3.2. Diet Composition and Trophic Niche Characteristics of Plateau Zokor
3.2.1. Sex-Specific Diet Composition and Foraging Proportions
The study found that male and female plateau zokors consumed 38 and 39 plant species, respectively (Figure 6). Compared to females, males additionally consumed Bupleurum chinense (0.02 ± 0.01%), whereas females additionally consumed Carum carvi (0.002 ± 0.001%) and Phlomoides rotata (0.0004 ± 0.0001%) relative to males. The top five plant species consumed by males were Taraxacum mongolicum (25.27 ± 9.55%), Potentilla anserina (19.75±5.46%), Ranunculus japonicus (6.99 ± 3.90%), Trollius ranunculoides (6.48 ± 6.08%), and Geranium pylzowianum (6.45 ± 5.92%). For females, the top five were Taraxacum mongolicum (32.81 ± 10.91%), Potentilla anserina (22.43 ± 7.73%), Gentiana macrophylla (9.65 ± 6.35%), Saussurea longifolia (6.91 ± 4.79%), and Pedicularis kansuensis (4.95 ± 4.95%). Females consumed significantly more Gentiana macrophylla than males (Nonparametric Mann–Whitney U test, p < 0.05) (Table 4). No significant differences were observed between sexes in the consumption proportions of plants with different root types (Nonparametric Mann–Whitney U test) (Table 5).
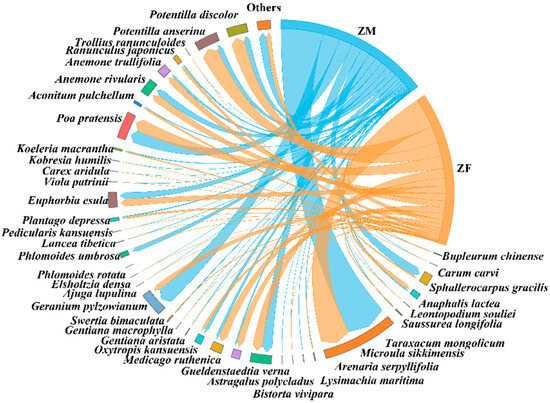
Figure 6.
Diet composition of male and female plateau zokor. ‘ZM’ denotes male plateau zokor, and ‘ZF’ denotes female plateau zokor.

Table 4.
Major food items and proportions with significant differences between male and female plateau zokor.

Table 5.
Proportion of consumption of plants with different root types by male and female plateau zokor.
The Chao1 index, Pielou’s evenness index, Shannon–Wiener index, and Simpson index for male plateau zokors were all higher than those for females, but only the Chao1 index showed a statistically significant difference (Independent-sample t-tests, p < 0.05). The Pielou evenness index and the Shannon and Simpson diversity indices showed no significant differences between male and female plateau zokors (Independent-sample t-tests, p > 0.05) (Figure 7).
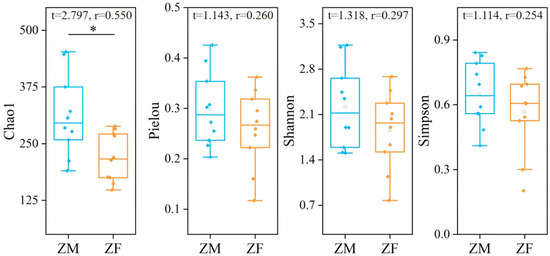
Figure 7.
Differences in dietary diversity between male and female plateau zokor. ‘ZM’ denotes male plateau zokor, and ‘ZF’ denotes female plateau zokor. “*” indicates a significant difference at the 0.05 level.
3.2.2. Sex-Specific Trophic Niche
Analysis of the trophic niche characteristics of plateau zokor (Nonparametric Mann–Whitney U test, p > 0.05) (Table 6, Figure 8) revealed no significant sex differences in niche breadth, and niche overlap was high, indicating that males and females consumed largely the same plant taxa. NMDS ordination of diet composition likewise revealed substantial intersex overlap. Male samples were more widely dispersed in ordination space, consistent with greater interindividual variability in resource use, and the male niche polygon nearly encompassed that of females.

Table 6.
Trophic niche breadth and overlap of male and female plateau zokor.
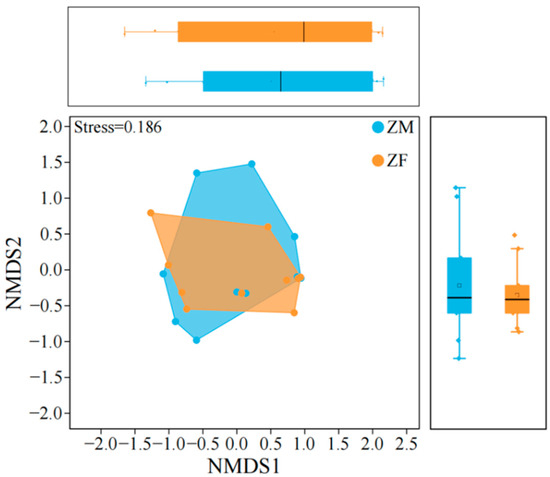
Figure 8.
Trophic niche structure model of male and female plateau zokor. ‘ZM’ denotes male plateau zokor, and ‘ZF’ denotes female plateau zokor.
4. Discussion
4.1. Sex-Specific Dietary Differences in Plateau Pikas and Plateau Zokors
We found clear sex-specific dietary differences in plateau pikas but not in plateau zokors. Male plateau pikas consumed more Phlomoides umbrosa. As a fibrous-rooted plant, it contains a higher proportion of structural carbohydrates, resulting in lower digestibility and energy density [39]. Meanwhile, species of the genus Phlomoides are characterized by high levels of trace elements and pharmacologically active constituents, which may play key roles in the growth and development of plateau pikas [40]. By contrast, female plateau pikas consumed more tuberous-rooted plants, which typically have higher starch contents and energy density, more readily meeting their energetic demands. Given the pika’s sexually monomorphic morphology, colonial sociality, and polygynous mating system, this pattern accords with the general principle that males more often target high-energy yet scarce resources, while females prioritize stable, secure, and nutritionally balanced foods because of higher physiological costs. By contrast, female plateau pikas consumed more tuberous-rooted plants, which typically have higher starch contents and energy density, thereby better meeting their energetic demands [41]. Although direct behavioral evidence is lacking, the species is presumed to exhibit a polygynous mating tendency based on observed male–male aggression and a female-biased adult sex ratio [9]. Given the pika’s sexually monomorphic morphology and colonial social organization, this dietary pattern likely reflects sex-specific energetic requirements rather than a fixed preference for resource type. The present study was conducted during the peak plant-growing season (August), corresponding to the late reproductive period when male energetic expenditure on mating declines, whereas females remain under higher energetic demand due to lactation and post-reproductive recovery. This context may explain their greater consumption of starchy, energy-rich foods [42,43]. In zokors, however, sex-related differences were weak. Their subterranean lifestyle imposes strict energetic and geometric constraints on foraging, and the roots and rhizomes they consume are relatively homogeneous and substitutable [44]. Moreover, their solitary social structure reduces competition within the species. These factors together explain the convergence in diet between male and female zokors [45].
4.2. Sex-Specific Food Diversity and Trophic Niche in Plateau Pikas and Plateau Zokors
Food diversity and niche breadth are classic proxies for adaptive foraging under optimal/central-place foraging and sex-based segregation frameworks, which predict that reproductive roles, movement ecology, and resource spatiotemporal variance jointly shape diet composition [46,47,48,49]. In this study, female plateau pikas exhibited significantly higher Simpson diversity and a broader trophic niche breadth than males. This indicates a more even use of multiple food items and a reduced dependence on top-preferred foods. Such a pattern aligns with the view that, during the post-reproductive period—encompassing body-composition recovery—females face elevated demands for energy and micronutrients and therefore diversify their diets to hedge against resource shortfalls (a risk-spreading/even-foraging strategy) [50,51]. By contrast, males showed larger fluctuations in food richness, consistent with broader spatial sampling and episodic targeting of patchy, high-payoff items under higher activity and competition, as predicted by sex segregation/competitive-ability hypotheses [46,52]. For plateau zokors, the pattern was reversed: males displayed higher dietary diversity and richness than females, which we attribute to larger activity areas, larder-hoarding tendencies, and complex burrow architecture in male subterranean mammals, all of which expand the underground encounter set [44,53,54]. Nevertheless, NMDS ordination revealed greater niche overlap and dietary convergence between the sexes in zokors. This phenomenon is parsimoniously explained by their subterranean lifestyle: high excavation costs [55,56,57], negligible aboveground predation risk [58], and the comparatively stable composition and availability of underground foods (storage roots/tubers) together constrain profitable dietary divergence between the sexes [44,59]. Despite these sex-specific differences in dietary diversity and composition, both species exhibited high Pianka overlap indices (0.87 in plateau pikas and 0.91 in plateau zokors), indicating substantial sharing of plant resources between males and females. This apparent coexistence of sex-based dietary divergence and high overall overlap is not contradictory: it reflects differences in foraging strategy rather than complete segregation of food resources [60]. In plateau pikas, the sexes utilize similar food types but in different proportions and combinations, resulting in moderate niche differentiation within a largely common resource pool. In plateau zokors, by contrast, their subterranean lifestyle and the homogeneity of underground foods constrain the opportunity for such divergence [61,62], producing both weak sex-specific variation and very high overlap. These findings highlight that trophic niche segregation and overlap can coexist across scales—divergence at the level of resource use strategy may still occur within a shared ecological base [49].
4.3. Revisiting Diet Composition of Plateau Pikas and Zokors with DNA Metabarcoding
Food resources are essential for sustaining animal populations, and any shift in dietary composition at a given trophic level can cascade through the entire food web [63]. Our results revealed a broader dietary spectrum for plateau pikas and plateau zokors compared with previous reports based on traditional methods [12,13,64,65]. Earlier studies generally identified 15–26 food species, with pikas showing strong reliance on Poaceae and zokors on forbs such as Polygonum viviparum and Potentilla anserina. In contrast, we detected 37–39 plant species per sex in both species, with greater use of Asteraceae and Rosaceae and weaker preference for Poaceae. These discrepancies may be attributed to variations in plant community structure across different sites. The higher dietary diversity observed in this study is largely attributable to DNA metabarcoding, which provides superior taxonomic resolution and efficiency relative to direct observation and microhistological analysis. Traditional approaches are prone to bias and systematic error due to subjective identification and low resolution. By contrast, DNA metabarcoding captures rare or cryptic taxa, allowing for a more comprehensive view of mammal diets. To connect taxonomic breadth to functional nutrient intake, future work (or parallel measurements) can integrate bulk stable isotope analyses (e.g., δ13C, δ15N) of consumer tissues and candidate plants [66,67]. Isotopes trace assimilated carbon and nitrogen over integrative time windows, enabling tests of whether the increased use of Asteraceae/Rosaceae inferred by DNA translates into a more C3-plant–like δ13C signature and whether sex-specific diets produce detectable differences in δ15N (nutritional routing/trophic position) [66,68]. Combining DNA-based relative read abundance with isotope mixing models (e.g., MixSIAR) thus links “what is eaten” to “what is assimilated,” providing a functional complement to our compositional results [69,70].
5. Conclusions
Across two sympatric alpine herbivores, we found a consistent contrast: plateau pikas exhibit clear sex-based dietary divergence, whereas plateau zokors show strong intersex dietary convergence and niche overlap. This contrast aligns with their differing lifestyles and resource regimes—heterogeneous, surface-available foods and social structure in pikas versus comparatively stable underground resources and solitary living in zokors—indicating that lifestyle and resource stability govern the scope of intersexual niche differentiation within the same ecosystem.
Author Contributions
F.X., investigation, data curation, software, validation, formal analysis, visualization, writing—original draft; X.Z., validation, formal analysis, investigation; L.Q., investigation, data curation; Y.G., data curation, validation; J.S., investigation, software; Z.D., investigation, data curation; L.H.; conceptualization, methodology, writing—review and editing; B.C., conceptualization, methodology, investigation, project administration, funding acquisition, writing—review and editing; R.H., methodology, writing—review and editing. All authors have read and agreed to the published version of the manuscript.
Funding
This study was supported by the Bin Chu: Young Supervisor Support Fund of Gansu Agricultural University (GAU-QDFC-2024-02) and Bin Chu: National Natural Science Foundation of China (32201478).
Institutional Review Board Statement
The experiments reported herein complied with the laws of China in effect at the time. All experimental protocols and procedures were approved by the Institutional Animal Care and Usage Committees of the Grassland Science College of Gansu Agricultural University (GSAU-Eth-PRA-2023-023).
Informed Consent Statement
Not applicable.
Data Availability Statement
The datasets used and/or analyzed during the current study are available from the corresponding author on reasonable request.
Acknowledgments
Many thanks to the team members for their strong support of this study.
Conflicts of Interest
The authors have no conflicts of interest to declare. The funders had no role in the design of the study; in the collection, analyses, or interpretation of data; in the writing of the manuscript; or in the decision to publish the results.
Appendix A
All plant taxa included in the plant DNA barcoding database established in this study are listed in the table below.

Table A1.
The set of plants collected in this study.
Table A1.
The set of plants collected in this study.
| Family | Genus | Species |
|---|---|---|
| Cyperaceae | Kobresia | Kobresia humilis |
| Kobresia capillifolia | ||
| Carex | Carex aridula | |
| Poaceae | Elymus | Elymus nutans |
| Poa | Poa pratensis | |
| Koeleria | Koeleria macrantha | |
| Asteraceae | Ligularia | Ligularia virgaurea |
| Saussurea | Saussurea pulchra | |
| Saussurea sungpanensis | ||
| Saussurea longifolia | ||
| Leontopodium | Leontopodium souliei | |
| Taraxacum | Taraxacum mongolicum | |
| Artemisia | Artemisia frigida | |
| Anaphalis | Anaphalis lactea | |
| Ranunculaceae | Anemone | Anemone rivularis |
| Anemone imbricata | ||
| Anemone trullifolia | ||
| Ranunculus | Ranunculus japonicus | |
| Gymnaconitum | Gymnaconitum gymnandrum | |
| Trollius | Trollius ranunculoides | |
| Aconitum | Aconitum pulchellum | |
| Fabaceae | Oxytropis | Oxytropis kansuensis |
| Medicago | Medicago ruthenica | |
| Gueldenstaedtia | Gueldenstaedtia verna | |
| Astragalus | Astragalus polycladus | |
| Orobanchaceae | Pedicularis | Pedicularis kansuensis f. albiflora |
| Pedicularis kansuensis | ||
| Gentianaceae | Gentiana | Gentiana macrophylla |
| Gentiana aristata | ||
| Gentianopsis | Gentianopsis paludosa | |
| Swertia | Swertia bimaculata | |
| Rosaceae | Potentilla | Potentilla anserina |
| Potentilla discolor | ||
| Euphorbiaceae | Euphorbia | Euphorbia esula |
| Lamiaceae | Elsholtzia | Elsholtzia densa |
| Ajuga | Ajuga lupulina | |
| Phlomoides | Phlomoides umbrosa | |
| Phlomoides rotata | ||
| Plantaginaceae | Plantago | Plantago depressa |
| Apiaceae | Sphallerocarpus | Sphallerocarpus gracilis |
| Carum | Carum carvi | |
| Bupleurum | Bupleurum chinense | |
| Mazaceae | Lancea | Lancea tibetica |
| Geraniaceae | Geranium | Geranium pylzowianum |
| Primulaceae | Lysimachia | Lysimachia maritima |
| Violaceae | Viola | Viola patrinii |
| Boraginaceae | Microula | Microula sikkimensis |
| Caryophyllaceae | Arenaria | Arenaria serpyllifolia |
| Polygonaceae | Bistorta | Bistorta vivipara |
References
- Ayodele, A. Small mammal communities as indicators of habitat health: A review. World 2025, 28, 29. [Google Scholar] [CrossRef]
- Emlen, S.T.; Oring, L.W. Ecology, sexual selection, and the evolution of mating systems. Science 1977, 197, 215–223. [Google Scholar] [CrossRef]
- McNamara, J.M.; Houston, A.I. State-dependent life histories. Nature 1996, 380, 215–221. [Google Scholar] [CrossRef]
- Bauld, J.T.; Abernethy, K.A.; Newton, J.; Lehmann, D.; Jones, I.L.; Bussière, L.F. Can diet niche partitioning enhance sexual dimorphism? Ecol. Evol. 2022, 12, e9599. [Google Scholar] [CrossRef]
- Rocha, P.N.; Gawryszewski, F.M. Foraging strategy as a route for sexual size dimorphism evolution. Ecol. Evol. 2024, 14, e70100. [Google Scholar] [CrossRef]
- Michelena, P.; Deneubourg, J.L. How group size affects vigilance dynamics and time allocation patterns: The key role of imitation and tempo. PLoS ONE 2011, 6, e18631. [Google Scholar] [CrossRef]
- Dong, L.M.; Cai, X.C.; Gan, R.X.; Zhang, J.; Dong, R.; Dong, K.C.; Hua, L.M.; Zhou, R. Seasonal variations in the foraging strategies of plateau pikas (Ochotona curzoniae). Animals 2025, 15, 902. [Google Scholar] [CrossRef]
- Cai, X.C.; Bao, D.; Ye, G.H.; Chu, B.; Tang, Z.S.; Hua, R.; Hua, L.M. The complex and well-developed morphological and histological structures of the gastrointestinal tract of the plateau zokor improve its digestive adaptability to high-fiber foods. Animals 2022, 12, 2447. [Google Scholar] [CrossRef] [PubMed]
- Nie, H.; Liu, J.; Chen, B. Life-history traits and fitness of plateau pika (Ochotona curzoniae) in alpine meadow ecosystem. Ecol. Evol. 2022, 12, e8548. [Google Scholar] [CrossRef]
- Yao, B.; Hegab, I.M.; Kang, Y.; Tan, Y.; Zhang, D.; Su, J. Underground environment increases the differentiation of personality traits between male and female plateau zokors (Eospalax baileyi). Acta Ethologica 2023, 26, 21–30. [Google Scholar] [CrossRef]
- Song, Z.H.; Li, X.L.; Su, X.X.; Ka, Z.C.R.; Ma, G.L. Spatial distribution pattern and succession of disturbance patches formed by plateau pika and plateau zokor in their population outbreak areas in alpine meadow. Acta Ecol. Sin. 2023, 43, 2949–2958. [Google Scholar] [CrossRef]
- Kang, Y.K.; Zhang, D.G.; Gou, J.Y.; Wang, H.F.; Yang, Y.B.; Su, J.H. Food habits and its seasonal changes of plateau pika (Ochotona curzniae) in Gannan meadow. J. Gansu Agric. Univ. 2019, 54, 132–138. [Google Scholar] [CrossRef]
- Zhang, C.J. Study on the Feeding Habits of Three Rodents in Gannan Grassland Under Different Disturbance Habitats. Master’s Thesis, Gansu Agricultural University, Lanzhou, China, 2022. [Google Scholar] [CrossRef]
- Zhou, R.; Song, M.L.; Wang, Y.Q.; Wang, H.S.; Ma, Y. Trophic niches and interspecific elationships of sympatric plateau pika Ochotona curzoniae and plateau zokor Eospalax baileyi in alpine meadows. Chin. J. Zool. 2024, 59, 908–918. [Google Scholar] [CrossRef]
- Wetzel, W.C.; Inouye, B.D.; Hahn, P.G.; Whitehead, S.R.; Underwood, N. Variability in plant–herbivore interactions. Annu. Rev. Ecol. Evol. Syst. 2023, 54, 451–474. [Google Scholar] [CrossRef]
- Zhang, C.J.; Yao, B.H.; Wang, X.Y.; Sun, X.M. Effects of grassland sowing on the feeding habits of Eospalax baileyi in the Gannan alpine meadow. Pratacultural Sci. 2021, 38, 967–975. [Google Scholar] [CrossRef]
- Chen, G.K. Study on Food Traceability and Trophic Niches of Major Rodents in Alax Desert Area. Master’s Thesis, Inner Mongolia Agricultural University, Hohhot, China, 2023. [Google Scholar] [CrossRef]
- Hua, R. Research on Key Technologies of Plateau Pika Damage Monitoring and Risk Assessment in Qinghai-Tibet Plateau. Ph.D. Thesis, Gansu Agricultural University, Lanzhou, China, 2023. [Google Scholar] [CrossRef]
- Yan, J.W. Responses of Population Density and Territory Behavior of Plateau Pika to Yak Grazing. Master’s Thesis, Lanzhou University, Lanzhou, China, 2022. [Google Scholar] [CrossRef]
- Zhang, F.Y.; Zhou, J.W.; Hou, F.F.; Zhou, R.; Hua, X.Z.; Hua, L.M. The change of home range of plateau zokor during courtship period and its relationship with body mass. Grassl. Turf 2020, 40, 67–72. [Google Scholar] [CrossRef]
- Cai, Z.; Yao, B.; Tan, Y.; Liu, Y.; Su, J. Seasonal piRNA expression profile changes in the testes of plateau zokor (Eospalax baileyi). Animals 2024, 14, 2620. [Google Scholar] [CrossRef]
- Chen, S.H. Root Systems of Grassland Plants in Northern China; Jilin University Press: Jilin, China, 2001. [Google Scholar]
- Sikes, R.S.; Animal Care and Use Committee of the American Society of Mammalogists. 2016 Guidelines of the American Society of Mammalogists for the use of wild mammals in research and education. J. Mammal. 2016, 97, 663–688. [Google Scholar] [CrossRef] [PubMed]
- Taberlet, P.; Coissac, E.; Pompanon, F.; Gielly, L.; Miquel, C.; Valentini, A.; Vermat, T.; Corthier, G.; Brochmann, C.; Willerslev, E. Power and limitations of the chloroplast trn L (UAA) intron for plant DNA barcoding. Nucleic Acids Res. 2007, 35, e14. [Google Scholar] [CrossRef]
- Martin, M. Cutadapt removes adapter sequences from high-throughput sequencing reads. EMBnet J. 2011, 17, 10–12. [Google Scholar] [CrossRef]
- Rognes, T.; Flouri, T.; Nichols, B.; Quince, C.; Mahé, F. VSEARCH: A versatile open source tool for metagenomics. PeerJ 2016, 4, e2584. [Google Scholar] [CrossRef]
- Edgar, R.C.; Haas, B.J.; Clemente, J.C.; Quince, C.; Knight, R. UCHIME improves sensitivity and speed of chimera detection. Bioinformatics 2011, 27, 2194–2200. [Google Scholar] [CrossRef]
- Altschul, S.F.; Madden, T.L.; Schäffer, A.A.; Zhang, J.; Zhang, Z.; Miller, W.; Lipman, D.J. Gapped BLAST and PSI-BLAST: A new generation of protein database search programs. Nucleic Acids Res. 1997, 25, 3389–3402. [Google Scholar] [CrossRef]
- Gotelli, N.J.; Colwell, R.K. Quantifying biodiversity: Procedures and pitfalls in the measurement and comparison of species richness. Ecol. Lett. 2001, 4, 379–391. [Google Scholar] [CrossRef]
- Chao, A.; Chiu, C.H. Nonparametric estimation and comparison of species richness. In Els; John Wiley & Sons: Hoboken, NJ, USA, 2016; pp. 1–11. [Google Scholar] [CrossRef]
- Shannon, C.E. A mathematical theory of communication. Bell Syst. Tech. J. 1948, 27, 379–423. [Google Scholar] [CrossRef]
- Simpson, E.H. Measurement of diversity. Nature 1949, 163, 688. [Google Scholar] [CrossRef]
- Pielou, E.C. The measurement of diversity in different types of biological collections. J. Theor. Biol. 1966, 13, 131–144. [Google Scholar] [CrossRef]
- Bray, J.R.; Curtis, J.T. An ordination of the upland forest communities of southern Wisconsin. Ecol. Monogr. 1957, 27, 326–349. [Google Scholar] [CrossRef]
- Levins, R. Evolution in Changing Environments: Some Theoretical Explorations (No. 2); Princeton University Press: Princeton, NJ, USA, 1968. [Google Scholar] [CrossRef]
- Pianka, E.R. The structure of lizard communities. Annu. Rev. Ecol. Syst. 1973, 4, 53–74. [Google Scholar] [CrossRef]
- Estaki, M.; Jiang, L.; Bokulich, N.A.; McDonald, D.; González, A.; Kosciolek, T.; Martino, C.; Zhu, Q.Y.; Birmingham, A.; Vázquez-Baeza, Y.; et al. QIIME 2 enables comprehensive end-to-end analysis of diverse microbiome data and comparative studies with publicly available data. Curr. Protoc. Bioinform. 2020, 70, e100. [Google Scholar] [CrossRef] [PubMed]
- Shapiro, S.S.; Wilk, M.B. An analysis of variance test for normality (complete samples). Biometrika 1965, 52, 591–611. [Google Scholar] [CrossRef]
- Van Soest, P.V.; Robertson, J.B.; Lewis, B.A. Methods for dietary fiber, neutral detergent fiber, and nonstarch polysaccharides in relation to animal nutrition. J. Dairy Sci. 1991, 74, 3583–3597. [Google Scholar] [CrossRef] [PubMed]
- Mohammadi, S.; Jafari, B.; Anvarian, S.P.; Nazemiyeh, H.; Asnaashari, S.; Delazar, A.; Asgharian, P. Taxonomic revision and clinical importance of Phlomoides genus: A comprehensive review. Pharm. Sci. 2023, 30, 21–35. [Google Scholar] [CrossRef]
- Vanderschuren, H.; Agusti, J. Storage roots. Curr. Biol. 2022, 32, R607–R609. [Google Scholar] [CrossRef]
- Brambilla, A.; Bal, X.; Lusetti, M.L.; Colombo, M.; Mainetti, A.; Keller, L.; Bassano, B. Dietary differences in males and females of a strongly sexually dimorphic ungulate. Eur. J. Wildl. Res. 2024, 70, 98. [Google Scholar] [CrossRef]
- Garcia, F.; Silva, A.A.; Ruckstuhl, K.; Neuhaus, P.; Coelho, C.; Wang, M.; Sousa, J.P.; Alves, J. Differences in the diets of female and male red deer: The meaning for sexual segregation. Biology 2023, 12, 540. [Google Scholar] [CrossRef]
- Zhang, X.; Zou, Y.; Zou, X.; Xu, Z.; Nan, X.; Han, C. DNA metabarcoding uncovers the diet of subterranean rodents in China. PLoS ONE 2022, 17, e0258078. [Google Scholar] [CrossRef]
- Zhang, F.Y.; Zhou, F.F.; Zhou, J.W.; Zhou, R.; Bao, D.; Ye, G.H.; Hua, L.M. Diurnal activity pattern of plateau zokor in breeding season and its influencing factors. Chin. J. Zool. 2020, 55, 297–305. [Google Scholar] [CrossRef]
- Garcia, M.; Gupta, S.; Wikenheiser, A.M. Sex differences in patch-leaving foraging decisions in rats. Oxf. Open Neurosci. 2023, 2, kvad011. [Google Scholar] [CrossRef] [PubMed]
- Houston, A.I.; McNamara, J.M. A general theory of central place foraging for single-prey loaders. Theor. Popul. Biol. 1985, 28, 233–262. [Google Scholar] [CrossRef]
- Schoener, T.W. Resource partitioning in ecological communities. Science 1974, 185, 27–39. [Google Scholar] [CrossRef] [PubMed]
- Bolnick, D.; Svanb, R.; Fordyce, J.; Yang, L.H.; Davis, J.M. The ecology of individuals: Incidence and implications of individual specialization. Am. Nat. 2003, 161, 1–28. [Google Scholar] [CrossRef] [PubMed]
- Speakman, J.R. The physiological costs of reproduction in small mammals. Philos. Trans. R. Soc. B Biol. Sci. 2008, 363, 375–398. [Google Scholar] [CrossRef]
- Moore, B.J.; Brasel, J.A. One cycle of reproduction consisting of pregnancy, lactation or no lactation, and recovery: Effects on carcass composition in ad libitum-fed and food-restricted rats. J. Nutr. 1984, 114, 1548–1559. [Google Scholar] [CrossRef] [PubMed]
- Lee, E.J.; Rhim, S.J. Seasonal home ranges and activity of three rodent species in a post-fire planted stand. Folia Zool. 2016, 65, 101–106. [Google Scholar] [CrossRef]
- Zhou, J.; Ji, C.; Dong, K.; Chu, B.; Wang, L.; Hua, L. Dynamic changes in the home range of the subterranean rodent Eospalax baileyi. Front. Ecol. Evol. 2022, 10, 1041322. [Google Scholar] [CrossRef]
- Xie, J.X.; Lin, G.H.; Liu, C.X.; Yang, C.H.; Deng, X.G.; Cui, X.F.; Li, B.; Zhang, T.Z.; Su, J.P. Diet selection in overwinter caches of plateau zokor (Eospalax baileyi). Acta Theriol. 2014, 59, 337–345. [Google Scholar] [CrossRef]
- Vleck, D. The energy cost of burrowing by the pocket gopher Thomomys bottae. Physiol. Zool. 1979, 52, 122–136. [Google Scholar] [CrossRef]
- Vleck, D. Burrow structure and foraging costs in the fossorial rodent, Thomomys bottae. Oecologia 1981, 49, 391–396. [Google Scholar] [CrossRef]
- Hildner, K.K.; Soulé, M.E. Relationship between the energetic cost of burrowing and genetic variability among populations of the pocket gopher, T. bottae: Does physiological fitness correlate with genetic variability? J. Exp. Biol. 2004, 207, 2221–2227. [Google Scholar] [CrossRef]
- Finn, K.T. The subterranean niche provides protection against predators: A review of predation on members of the family Bathyergidae. Mamm. Biol. 2025, 1–14. [Google Scholar] [CrossRef]
- Liu, D.; Li, B.; Song, P.; Jiang, F.; Zhang, T. Captivity shifts gut microbiota communities in plateau zokor (Eospalax baileyi). Microorganisms 2024, 12, 789. [Google Scholar] [CrossRef]
- Ruckstuhl, K.E.; Neuhaus, P. Sexual segregation in ungulates: A comparative test of three hypotheses. Biol. Rev. 2002, 77, 77–96. [Google Scholar] [CrossRef]
- Zhang, Y.; Zhang, Z.; Liu, J. Burrowing rodents as ecosystem engineers: The ecology and management of plateau zokors Myospalax fontanierii in alpine meadow ecosystems on the Tibetan Plateau. Mammal Rev. 2003, 33, 284–294. [Google Scholar] [CrossRef]
- Reichman, O.J.; Smith, S.C. Burrows and burrowing behavior by mammals. Curr. Mammal. 1990, 2, 197–244. [Google Scholar]
- McPeek, M.A. The consequences of changing the top predator in a food web: A comparative experimental approach. Ecol. Monogr. 1998, 68, 1–23. [Google Scholar] [CrossRef]
- Renagül, E. Microscopy Histological Analysis of Diet and Trophic Niche of Four Sympatric Small Mammals in Altun Mountain National Nature Reserve. Master’s Thesis, Xinjiang Agricultural University, Urumchi, China, 2015. [Google Scholar]
- Jiang, Z.G.; Xia, W.P. Utilization of the food resources by plateau pika. Acta Theriol. Sin. 1985, 5, 251–262. [Google Scholar] [CrossRef]
- Post, D.M. Using stable isotopes to estimate trophic position: Models, methods, and assumptions. Ecology 2002, 83, 703–718. [Google Scholar] [CrossRef]
- Peterson, B.J.; Fry, B. Stable isotopes in ecosystem studies. Annu. Rev. Ecol. Syst. 1987, 18, 293–320. [Google Scholar] [CrossRef]
- Dawson, T.E.; Mambelli, S.; Plamboeck, A.H.; Templer, P.H.; Tu, K.P. Stable isotopes in plant ecology. Annu. Rev. Ecol. Syst. 2002, 33, 507–559. [Google Scholar] [CrossRef]
- Phillips, D.L.; Inger, R.; Bearhop, S.; Jackson, A.L.; Moore, J.W.; Parnell, A.C.; Semmens, B.X.; Ward, E.J. Best practices for use of stable isotope mixing models in food-web studies. Can. J. Zool. 2014, 92, 823–835. [Google Scholar] [CrossRef]
- Stock, B.C.; Semmens, B.X. Unifying error structures in commonly used biotracer mixing models. Ecology 2016, 97, 2562–2569. [Google Scholar] [CrossRef] [PubMed]
Disclaimer/Publisher’s Note: The statements, opinions and data contained in all publications are solely those of the individual author(s) and contributor(s) and not of MDPI and/or the editor(s). MDPI and/or the editor(s) disclaim responsibility for any injury to people or property resulting from any ideas, methods, instructions or products referred to in the content. |
© 2025 by the authors. Licensee MDPI, Basel, Switzerland. This article is an open access article distributed under the terms and conditions of the Creative Commons Attribution (CC BY) license (https://creativecommons.org/licenses/by/4.0/).