
Unraveling Fish Community Assembly Rules in Coastal China Seas Based on Hierarchical Modeling of Species Communities

Simple Summary
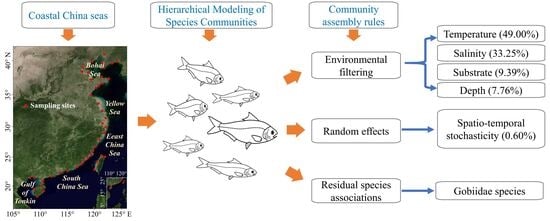
Abstract
1. Introduction
2. Materials and Methods
2.1. Study Area
2.2. Data Collection
2.2.1. Species Occurrence Data Compilation
2.2.2. Environmental Data Compilation
2.2.3. Functional Trait Data Compilation
2.2.4. Phylogenetic Data Compilation
2.3. Hierarchical Modelling of Species Communities
3. Results
3.1. HMSC Model Validation
3.2. Fixed and Random Effects
3.3. Species Environmental Niche
3.4. Residual Species Associations
4. Discussion
4.1. Performance of HMSC Modeling
4.2. Species Niche and Environmental Filtering
4.3. Species Associations and Biotic Filtering
5. Conclusions
Author Contributions
Funding
Institutional Review Board Statement
Informed Consent Statement
Data Availability Statement
Acknowledgments
Conflicts of Interest
Abbreviations
| HMSC | Hierarchical Modelling of Species Communities |
| SST | Sea surface temperature |
| SSS | Sea surface salinity |
| NPP | Sea surface water net primary production |
| COI | Cytochrome oxidase I |
| AIC | Akaike Information Criterion |
| ML | Maximum Likelihood |
| MCMC | Markov Chain Monte Carlo chains |
| AUC | Area Under Curve |
| TjurR2 | Tjur’s R2 |
| SR | Species richness |
| FS | fine sand |
| ST | sandy silt |
| T | silty |
| TS | silty sand |
Appendix A. Tables

| Site Code | Name | Longtitue | Latitude | Type |
|---|---|---|---|---|
| YLH | Yalu_River_Estuary | 124.2700 | 39.9099 | estuary |
| QDZB | Qingduizi_Bay | 123.3137 | 39.7403 | bay |
| DLB | Dalian_Bay | 121.7656 | 38.9624 | bay |
| LHE | Liaohe_Estuary | 121.8120 | 40.8753 | estuary |
| FZB | Fuzhou_Bay | 121.4484 | 39.6933 | bay |
| HHE | Haihe_Estuary | 117.8812 | 39.0222 | estuary |
| QHD | Qinhuangdao | 119.5885 | 39.8748 | bay |
| TS | Tangshan | 118.7555 | 39.0972 | bay |
| CZ | Cangzhou | 117.7445 | 38.4324 | bay |
| YR | Yellow_River_Estuary | 119.2836 | 37.8584 | estuary |
| TZB | Taozi_Bay | 121.3100 | 37.6280 | bay |
| LZB | Laizhou_Bay | 119.3451 | 37.6836 | bay |
| RCH | Rongcheng_Bay | 122.6361 | 37.3640 | bay |
| RSB | Rushan_Bay | 121.4822 | 36.6802 | bay |
| LSB | Laoshan_Bay | 120.7858 | 36.4008 | bay |
| JiZB | Jiaozhou_Bay | 120.2879 | 36.0395 | bay |
| HZB | Haizhou_Bay | 119.3881 | 34.8817 | bay |
| YC | Yancheng | 120.8215 | 33.4082 | bay |
| LS | Lvsi_Fishang_Ground | 121.4388 | 32.4997 | bay |
| YTR | Yangtze_River_Estuary | 121.9999 | 31.4612 | estuary |
| HaZB | Hangzhou_Bay | 121.4922 | 30.4973 | bay |
| ZSB | Zhoushan_Bay | 122.2268 | 29.8811 | bay |
| SMW | Sanmen_Bay | 121.4675 | 29.0681 | bay |
| WZB | Wenzhou_Bay | 121.0176 | 27.9848 | bay |
| SSB | Sansha_Bay | 119.8136 | 26.5192 | bay |
| MJE | Min_River_Estuary | 119.6757 | 26.0894 | estuary |
| XHB | Xinghua_Bay | 119.3879 | 25.3941 | bay |
| QZB | Quanzhou_Bay | 118.7726 | 24.8341 | bay |
| JLE | Jiulongjiang_Esturay | 117.9927 | 24.4342 | estuary |
| DSB | Dongshan_Bay | 117.5439 | 23.8171 | bay |
| STB | Shantou_Bay | 116.8310 | 23.3084 | Bay |
| DYB | Daya_Bay | 114.6685 | 23.7069 | bay |
| PRE | Pearl_River_Estuary | 113.7554 | 22.5379 | estuary |
| MYE | Moyang_Estuary | 112.0765 | 21.7131 | estuary |
| LZW | Leizhou_Bay | 110.5258 | 20.9146 | bay |
| FCB | Fangchenggang_Bay | 108.3700 | 21.5411 | bay |
| BLE | Beilunhe_Estuary | 108.0638 | 21.4557 | estuary |
| HKB | Haikou_Bay | 110.2825 | 20.0773 | bay |
| WQE | Wanquan_Estuary | 110.6023 | 19.1566 | estuary |
| SYB | Sanya_Bay | 109.4807 | 18.2711 | bay |
| CJE | Changjiang_Estuary | 108.9337 | 19.5213 | bay |
| DSE | Danshuihe_Estuary | 121.4108 | 25.1792 | estuary |
| WXE | Wuxi_Estuary | 120.4760 | 24.2046 | estuary |
| ZWE | Zengwenxi_Estuary | 121.4108 | 25.1792 | estuary |
| SXE | Shuangxi_Estuary | 121.9652 | 25.0380 | estuary |
| Variable | Description | Unit/Levels |
|---|---|---|
| Depth | Mean water depth. | m |
| Substrate | Types of seafloor surface substrate. | Fine sand (FS), sand (S), sandy silt (ST), silt (S), silty sand (TS), and clay silt (YT) |
| Current | The north component of sea surface current. | m/h |
| SST | Sea surface temperature. | °C |
| SSS | Sea surface water salinity. | PSS |
| pH | Sea surface water pH reported on total scale. | 1 |
| NPP | Sea surface net primary production of biomass expressed as carbon per unit volume in sea water. | mg/m3/day |
| Trait | Code | Source | Group | Type |
|---|---|---|---|---|
| Body elongation | BEl | Bl/Bd | Morphological | Continuous |
| Vertical eye position | VEp | Eh/Bd | Morphological | Continuous |
| Relative eye size | REs | Ed/Hd | Morphological | Continuous |
| Oral gape position | OGp | Mo/Bd | Morphological | Continuous |
| Relative maxillary length | RMl | Jl/Hd | Morphological | Continuous |
| Body lateral shape | BLs | Hd/Bd | Morphological | Continuous |
| Pectoral fin vertical position | PFv | PFi/Bd | Morphological | Continuous |
| Pectoral fin size | PFs | PFl/Bl | Morphological | Continuous |
| Caudal peduncle throttling | CPt | CFd/CPd | Morphological | Continuous |
| Body shape | BodyShape | FishBase | Morphological | Categorical |
| Maximum life span | Life_span | FishBase | Life History | Continuous |
| Generation time | Generation_time | FishBase | Life History | Continuous |
| Food consumption to biomass ratio | Q.B | FishBase | Life History | Continuous |
| Maximum body length | MaxLengthTL | FishBase | Life History | Continuous |
| Position in water column | DemersPelagI | FishBase | Ecological | Categorical |
| Diet | Diet | FishBase | Ecological | Categorical |
| Trophic level | Troph | FishBase | Ecological | Continuous |
Appendix B. Figures


Appendix C. Procedures for HMSC
Appendix C.1. Preselection of Random Effects
| Combination | df | AIC |
|---|---|---|
| No random effect | 12 | 2315.83 |
| Site | 13 | 1892.60 |
| Method | 13 | 2081.80 |
| Year | 13 | 1490.26 |
| Site + method | 14 | 1764.38 |
| Site + year | 14 | 1382.03 |
| Method + year | 14 | 1424.43 |
| Site + method + year | 15 | 1365.84 |


Appendix C.2. Preselection of Explaining Variables and Fish Traits
| Predictors | Incidence Rate Ratios | CI | p | |
|---|---|---|---|---|
| (Intercept) | 23.12 | 10.60–50.42 | <0.001 | *** |
| Substrate [S] | 2.35 | 1.03–5.37 | 0.043 | * |
| Substrate [ST] | 2.23 | 1.02–4.87 | 0.045 | * |
| Substrate [T] | 2.34 | 0.99–5.56 | 0.053 | |
| Substrate [TS] | 1.69 | 0.73–3.88 | 0.219 | |
| Substrate [YT] | 1.98 | 0.89–4.39 | 0.094 | |
| SST | 1.23 | 1.10–1.37 | <0.001 | *** |
| SSS | 1.16 | 1.02–1.31 | 0.019 | ** |
| Depth | 1.16 | 1.02–1.33 | 0.023 | * |
| NPP | 0.82 | 0.72–0.94 | 0.065 | |
| pH | 0.92 | 0.85–1.00 | 0.064 | |
| Current | 1.04 | 0.98–1.11 | 0.155 |

Appendix C.3. HMSC Model Fitting and Validation

References
- Barbier, E.B.; Hacker, S.D.; Kennedy, C.; Koch, E.W.; Stier, A.C.; Silliman, B.R. The value of estuarine and coastal ecosystem services. Ecol. Ecol. Monogr. 2011, 81, 169–193. [Google Scholar] [CrossRef]
- Schwartz, M. Encyclopedia of Coastal Science; Springer Science & Business Media: Dordrecht, The Netherlands, 2006. [Google Scholar]
- Wang, Y.; Liu, R.; Su, J. Marine Geography of China; China Science Publishing & Media Ltd.: Bejing, China, 2012. [Google Scholar]
- Kang, B.; Pecl, G.T.; Lin, L.; Sun, P.; Zhang, P.; Li, Y.; Zhao, L.; Peng, X.; Yan, Y.; Shen, C. Climate change impacts on China’s marine ecosystems. Rev. Fish Biol. Fish. 2021, 31, 599–629. [Google Scholar] [CrossRef]
- Liu, J.Y. Status of marine biodiversity of the China Seas. PLoS ONE 2013, 8, e50719. [Google Scholar] [CrossRef]
- Beukhof, E.D. Trait-Environment Relationships in Marine Fish: An Exploration of Patterns, Drivers and Assembly Processes Shaping Marine Fish Communities; Technical University of Denmark: Kongens Lyngby, Denmark, 2019; p. 163. [Google Scholar]
- Drake, J.A. The mechanics of community assembly and succession. J. Theor. Biol. 1990, 147, 213–233. [Google Scholar] [CrossRef]
- Hutchinson, G.E. Homage to Santa Rosalia or why are there so many kinds of animals? Am. Nat. 1959, 93, 145–159. [Google Scholar] [CrossRef]
- Hubbel, S.P. The Unified Neutral Theory of Biodiversity and Biogeography; Princeton University Press: Princeton, NJ, USA, 2001. [Google Scholar]
- Bruno, J.F.; Stachowicz, J.J.; Bertness, M.D. Inclusion of facilitation into ecological theory. Trends Ecol. Evol. 2003, 18, 119–125. [Google Scholar] [CrossRef]
- Keddy, P.A. Assembly and response rules: Two goals for predictive community ecology. J. Veg. Sci. 1992, 3, 157–164. [Google Scholar] [CrossRef]
- Zha, Y.; Lindstrom, E.S.; Eiler, A.; Svanback, R. Different roles of environmental selection, dispersal, and drift in the assembly of intestinal microbial communities of freshwater fish with and without a stomach. Front. Ecol. Evol. 2020, 8, 152. [Google Scholar] [CrossRef]
- Craven, D.; Hall, J.S.; Berlyn, G.P.; Ashton, M.S.; van Breugel, M. Environmental filtering limits functional diversity during succession in a seasonally wet tropical secondary forest. J. Veg. Sci. 2018, 29, 511–520. [Google Scholar] [CrossRef]
- Che, X.L.; Chen, D.J.; Zhang, M.; Quan, Q.; Moller, A.P.; Zou, F.S. Seasonal dynamics of waterbird assembly mechanisms revealed by patterns in phylogenetic and functional diversity in a subtropical wetland. Biotropica 2019, 51, 421–431. [Google Scholar] [CrossRef]
- Baptista, J.; Martinho, F.; Martins, R.; Carneiro, M.; Azevedo, M.; Vieira, A.; Gomes, P.; Pardal, M. Water temperature gradient shapes the structure and composition of nearshore marine fish communities in southern Europe. J. Sea Res. 2019, 154, 101807. [Google Scholar] [CrossRef]
- Bozzato, D.; Jakob, T.; Wilhelm, C. Effects of temperature and salinity on respiratory losses and the ratio of photosynthesis to respiration in representative Antarctic phytoplankton species. PLoS ONE 2019, 14, e0224101. [Google Scholar] [CrossRef] [PubMed]
- Giraldo, C.; Ernande, B.; Cresson, P.; Kopp, D.; Cachera, M.; Travers-Trolet, M.; Lefebvre, S. Depth gradient in the resource use of a fish community from a semi-enclosed sea. Limnol. Oceanogr. 2017, 62, 2213–2226. [Google Scholar] [CrossRef]
- Booth, D.J.; Figueira, W.F.; Gregson, M.A.; Brown, L.; Beretta, G. Occurrence of tropical fishes in temperate southeastern Australia: Role of the East Australian Current. Estuar. Coast. Shelf Sci. 2007, 72, 102–114. [Google Scholar] [CrossRef]
- Pecuchet, L.; Törnroos, A.; Lindegren, M. Patterns and drivers of fish community assembly in a large marine ecosystem. Mar. Ecol. Prog. Ser. 2016, 546, 239–248. [Google Scholar] [CrossRef]
- Limbourn, A.J.; Jones, G.P.; Munday, P.L.; Srinivasan, M. Niche shifts and local competition between two coral reef fishes at their geographic boundary. Mar. Freshw. Res. 2007, 58, 1120–1129. [Google Scholar] [CrossRef]
- Weiher, E.; Keddy, P.A. Assembly rules, null models, and trait dispersion: New questions from old patterns. Oikos 1995, 74, 159–164. [Google Scholar] [CrossRef]
- Mouillot, D.; Dumay, O.; Tomasini, J.A. Limiting similarity, niche filtering and functional diversity in coastal lagoon fish communities. Estuar. Coast. Shelf Sci. 2007, 71, 443–456. [Google Scholar] [CrossRef]
- Tikhonov, G.; Opedal, Ø.H.; Oksanen, J.; de Jonge, M.M.J.; Dallas, T. R Package; Version 3.0-11; Hmsc: Hierarchical Model of Species Communities; rOpensci: Berkeley, CA, USA, 2021. [Google Scholar]
- Huang, Y. Species composition and seasonal variations of fishes in Dongshan Bay. J. Fujian Fish. 1999, 2, 55–61. [Google Scholar]
- Lian, Z. Research on the fish fauna of the Minjiang River. Chin. J. Zool. 1988, 23, 40–45. [Google Scholar]
- Editorial Board of Bays of China. Bays of China; Ocean Press: Beijing, China, 1991; Volume 1. [Google Scholar]
- Ovaskainen, O.; Tikhonov, G.; Norberg, A.; Guillaume Blanchet, F.; Duan, L.; Dunson, D.; Roslin, T.; Abrego, N. How to make more out of community data? A conceptual framework and its implementation as models and software. Ecol. Lett. 2017, 20, 561–576. [Google Scholar] [CrossRef]
- Tikhonov, G.; Opedal, Ø.H.; Abrego, N.; Lehikoinen, A.; de Jonge, M.M.J.; Oksanen, J.; Ovaskainen, O. Joint species distribution modelling with the R-package Hmsc. Methods Ecol. Evol. 2020, 11, 442–447. [Google Scholar] [CrossRef]
- Lin, L.; Liu, Y.; Lin, H.; Kang, B. Considering species functional and phylogenetic rarity in the conservation of fish biodiversity. Divers. Distrib. 2024, 30, e13804. [Google Scholar] [CrossRef]
- Nédélec, C.; Prado, J. Definition and Classification of Fishing Gear Categories, 1st ed.; FAO: Fisheries Technical Paper: Rome, Italy, 1990; Volume 222. [Google Scholar]
- Froese, R.; Pauly, D. FishBase; World Wide Web electronic publication: Geneva, Switzerland, 2022. [Google Scholar]
- Canessa, M.; Bavestrello, G.; Cattaneo-Vietti, R.; Furfaro, G.; Doneddu, M.; Navone, A.; Trainito, E. Rocky substrate affects benthic heterobranch assemblages and prey/predator relationships. Estuar. Coast. Shelf Sci. 2021, 261, 107568. [Google Scholar] [CrossRef]
- Hendriks, I.E.; Duarte, C.M.; Alvarez, M. Vulnerability of marine biodiversity to ocean acidification: A meta-analysis. Estuar. Coast. Shelf Sci. 2010, 86, 157–164. [Google Scholar] [CrossRef]
- Bailey, S.A.; Horner-Devine, M.C.; Luck, G.; Moore, L.A.; Carney, K.M.; Anderson, S.; Betrus, C.; Fleishman, E. Primary productivity and species richness: Relationships among functional guilds, residency groups and vagility classes at multiple spatial scales. Ecography 2004, 27, 207–217. [Google Scholar] [CrossRef]
- Amante, C.; Eakins, B.W. ETOPO1 1 Arc-Minute Global Relief Model: Procedures, Data Sources and Analysis; NOAA technical memorandum NESDIS NGDC-24: Boulder, CO, USA, 2009. [Google Scholar] [CrossRef]
- Shepard, F.P. Nomenclature based on sand-silt-clay ratios. J. Sediment. Res. 1954, 24, 151–158. [Google Scholar]
- State Oceanic Administration of China. Ocean Atlas of Offshore China: Substrate; Ocean Press: Beijing, China, 2017. [Google Scholar]
- National Science & Technology Infrastructure—National Marine Data Center. Regional Reanalysis Data: Temperature, Salinity, and Ocean Current; National Science & Technology Infrastructure—National Marine Data Center: Tianjin, China, 2022. [Google Scholar]
- Copernicus Marine Environment Monitoring Service. Global Ocean Biogeochemistry Hindcast; Copernicus Marine Environment Monitoring Service: Toulouse, France, 2019. [Google Scholar] [CrossRef]
- Assis, J.; Tyberghein, L.; Bosch, S.; Verbruggen, H.; Serrão, E.A.; De Clerck, O. Bio-ORACLE v2.0: Extending marine data layers for bioclimatic modelling. Glob. Ecol. Biogeogr. 2018, 27, 277–284. [Google Scholar] [CrossRef]
- Shrestha, N. Detecting multicollinearity in regression analysis. Am. J. Appl. Math. Stat. 2020, 8, 39–42. [Google Scholar] [CrossRef]
- Violle, C.; Navas, M.L.; Vile, D.; Kazakou, E.; Fortunel, C.; Hummel, I.; Garnier, E. Let the concept of trait be functional! Oikos 2007, 116, 882–892. [Google Scholar] [CrossRef]
- Brosse, S.; Charpin, N.; Su, G.; Toussaint, A.; Herrera-R., G.A.; Tedesco, P.A.; Villéger, S. FISHMORPH: A global database on morphological traits of freshwater fishes. Glob. Ecol. Biogeogr. 2021, 30, 2330–2336. [Google Scholar] [CrossRef]
- Schneider, C.A.; Rasband, W.S.; Eliceiri, K.W. NIH Image to ImageJ: 25 years of image analysis. Nat. Methods 2012, 9, 671–675. [Google Scholar] [CrossRef] [PubMed]
- Villéger, S.; Miranda, J.R.; Hernández, D.F.; Mouillot, D. Contrasting changes in taxonomic vs. functional diversity of tropical fish communities after habitat degradation. Ecol. Appl. 2010, 20, 1512–1522. [Google Scholar] [CrossRef]
- Trindade-Santos, I.; Moyes, F.; Magurran, A.E. Global patterns in functional rarity of marine fish. Nat. Commun. 2022, 13, 1–9. [Google Scholar] [CrossRef]
- Stekhoven, D.J.; Buehlmann, P. MissForest-non-parametric missing value imputation for mixed-type data. Bioinformatics 2012, 28, 112–118. [Google Scholar] [CrossRef] [PubMed]
- Benson, D.A.; Cavanaugh, M.; Clark, K.; Karsch-Mizrachi, I.; Lipman, D.J.; Ostell, J.; Sayers, E.W. GenBank. Nucleic Acids Res. 2012, 41, D36–D42. [Google Scholar] [CrossRef] [PubMed]
- Larkin, M.A.; Blackshields, G.; Brown, N.P.; Chenna, R.; McGettigan, P.A.; McWilliam, H.; Valentin, F.; Wallace, I.M.; Wilm, A.; Lopez, R.; et al. Clustal W and Clustal X version 2.0. Bioinformatics 2007, 23, 2947–2948. [Google Scholar] [CrossRef]
- Posada, D.; Crandall, K.A. Selecting the best-fit model of nucleotide substitution. Syst. Biol. 2001, 50, 580–601. [Google Scholar] [CrossRef]
- Guindon, S.; Dufayard, J.F.; Lefort, V.; Anisimova, M.; Hordijk, W.; Gascuel, O. New algorithms and methods to estimate Maximum-Likelihood phylogenies: Assessing the performance of PhyML 3.0. Syst. Biol. 2010, 59, 307–321. [Google Scholar] [CrossRef] [PubMed]
- Ovaskainen, O.; Abrego, N. Joint Species Distribution Modelling: With Applications in R; Cambridge University Press: Cambridge, UK, 2020. [Google Scholar]
- Rodriguez, J.D.; Perez, A.; Lozano, J.A. Sensitivity analysis of k-fold cross validation in prediction error estimation. IEEE Trans. Pattern Anal. Mach. Intell. 2009, 32, 569–575. [Google Scholar] [CrossRef]
- Pearce, J.; Ferrier, S. Evaluating the predictive performance of habitat models developed using logistic regression. Ecol. Model. 2000, 133, 225–245. [Google Scholar] [CrossRef]
- Tjur, T. Coefficients of determination in logistic regression models—A new proposal: The coefficient of discrimination. Am. Stat. 2009, 63, 366–372. [Google Scholar] [CrossRef]
- Maxwell, S.E.; Delaney, H.D.; Kelley, K. Designing Experiments and Analyzing Data: A Model Comparison Perspective; Routledge: New York, NY, USA, 2017. [Google Scholar]
- Blanchet, F.G.; Legendre, P.; Borcard, D. Forward selection of explanatory variables. Ecology 2008, 89, 2623–2632. [Google Scholar] [CrossRef]
- Araujo, M.B.; Pearson, R.G.; Thuiller, W.; Erhard, M. Validation of species-climate impact models under climate change. Glob. Change Biol. 2005, 11, 1504–1513. [Google Scholar] [CrossRef]
- Tittensor, D.P.; Mora, C.; Jetz, W.; Lotze, H.K.; Ricard, D.; Berghe, E.V.; Worm, B. Global patterns and predictors of marine biodiversity across taxa. Nature 2010, 466, 1098–1101. [Google Scholar] [CrossRef]
- Editorial Board of Bays of China. Bays of China; Ocean Press: Beijing, China, 1998; Volume 14. [Google Scholar]
- Telesh, I.V.; Khlebovich, V.V. Principal processes within the estuarine salinity gradient: A review. Mar. Pollut. Bull. 2010, 61, 149–155. [Google Scholar] [CrossRef]
- Bottom, D.L.; Jones, K.K. Species composition, distribution, and invertebrate prey of fish assemblages in the Columbia River estuary. Prog. Oceanogr. 1990, 25, 243–270. [Google Scholar] [CrossRef]
- Freitas, C.; Villegas-Ríos, D.; Moland, E.; Olsen, E.M. Sea temperature effects on depth use and habitat selection in a marine fish community. J. Anim. Ecol. 2021, 90, 1787–1800. [Google Scholar] [CrossRef]
- Kuffner, I.B.; Brock, J.C.; Grober-Dunsmore, R.; Bonito, V.E.; Hickey, T.D.; Wright, C.W. Relationships between reef fish communities and remotely sensed rugosity measurements in Biscayne National Park, Florida, USA. Environ. Biol. Fishes 2007, 78, 71–82. [Google Scholar] [CrossRef]
- Santoso, P.; Setiawan, F.; Subhan, B.; Arafat, D.; Bengen, D.G.; Iqbal Sani, L.M.; Humphries, A.T.; Madduppa, H. Influence of coral reef rugosity on fish communities in marine reserves around Lombok Island, Indonesia. Environ. Biol. Fishes 2022, 105, 105–117. [Google Scholar] [CrossRef]
- Levin, P.; Petrik, R.; Malone, J. Interactive effects of habitat selection, food supply and predation on recruitment of an estuarine fish. Oecologia 1997, 112, 55–63. [Google Scholar] [CrossRef]
- Cordero, R.D.; Jackson, D.A. Abiotic factors influence species co-occurrence patterns of lake fishes. J. Anim. Ecol. 2021, 90, 2859–2874. [Google Scholar] [CrossRef]
- Masi, M.D.; Ainsworth, C.H.; Kaplan, I.; Schirripa, M. Interspecific interactions may influence reef fish management strategies in the Gulf of Mexico. Mar. Coast. Fish. 2018, 10, 24–39. [Google Scholar] [CrossRef]
- Tianjun, G.; Hui, H. Tectonic characteristics and evolution of the Taiwan Strait. Acta Geol. Sin. Engl. Ed. 1995, 8, 1–13. [Google Scholar] [CrossRef]
- Tikhonov, G.; Abrego, N.; Dunson, D.; Ovaskainen, O. Using joint species distribution models for evaluating how species-to-species associations depend on the environmental context. Methods Ecol. Evol. 2017, 8, 443–452. [Google Scholar] [CrossRef]
- Liu, J.; Ning, P. Species composition and faunal characteristics of fishes in the Yellow Sea. Biodivers. Sci. 2011, 19, 764–769. [Google Scholar] [CrossRef]
- Albers, W.; Anderson, P. Diet of Pacific cod, Gadus macrocephalus, and predation on the northern pink shrimp, Pandalus borealis, in Pavlof Bay, Alaska. Fish. Bull. 1985, 83, 601–610. [Google Scholar]
- Hamidoghli, A.; Won, S.; Lee, S.; Lee, S.; Farris, N.W.; Bai, S.C. Nutrition and feeding of olive flounder Paralichthys olivaceus: A Review. Rev. Fish. Sci. Aquac. 2020, 28, 340–357. [Google Scholar] [CrossRef]
- Thacker, C.E. Systematics of Gobiidae. In The Biology of Gobies; CRC Press: Boca Raton, FL, USA, 2012; pp. 129–136. [Google Scholar]
- Thacker, C.E.; Roje, D.M. Phylogeny of Gobiidae and identification of gobiid lineages. Syst. Biodivers. 2011, 9, 329–347. [Google Scholar] [CrossRef]
- Wiederholm, A.-M. Habitat selection and interactions between three marine fish species (Gobiidae). Oikos 1987, 48, 28–32. [Google Scholar] [CrossRef]
- Zurell, D.; Pollock, L.J.; Thuiller, W. Do joint species distribution models reliably detect interspecific interactions from co-occurrence data in homogenous environments? Ecography 2018, 41, 1812–1819. [Google Scholar] [CrossRef]
- Li, L.; Yang, L.; Bin, K. Unraveling fish community assembly rules in coastal China seas based on Hierarchical Modeling of Species Communities. 2023. [Google Scholar] [CrossRef]
- Bates, D.; Maechler, M.; Bolker, B.M.; Walker, S.C. Fitting linear mixed-effects models Using lme4. J. Stat. Softw. 2015, 67, 1–48. [Google Scholar] [CrossRef]
- Bolker, B.M.; Brooks, M.E.; Clark, C.J.; Geange, S.W.; Poulsen, J.R.; Stevens, M.H.H.; White, J.S.S. Generalized linear mixed models: A practical guide for ecology and evolution. Trends Ecol. Evol. 2009, 24, 127–135. [Google Scholar] [CrossRef] [PubMed]
- Faraway, J.J. Extending the Linear Model with R: Generalized Linear, Mixed Effects and Nonparametric Regression Models; Chapman and Hall/CRC: Boca Raton, FL, USA, 2016. [Google Scholar]
- Sakamoto, Y.; Ishiguro, M.; Kitagawa, G. Akaike information criterion statistics. In Mathematics and its Applications, 1st ed.; Springer: Dordrecht, The Netherlands, 1986; Volume 81, p. 26853. [Google Scholar]
- Dray, S.; Choler, P.; Doledec, S.; Peres-Neto, P.R.; Thuiller, W.; Pavoine, S.; ter Braak, C.J.F. Combining the fourth-corner and the RLQ methods for assessing trait responses to environmental variation. Ecology 2014, 95, 14–21. [Google Scholar] [CrossRef]
- Christensen, E.A.; Norin, T.; Tabak, I.; van Deurs, M.; Behrens, J.W. Effects of temperature on physiological performance and behavioral thermoregulation in an invasive fish, the round goby. J. Exp. Biol. 2021, 224, jeb237669. [Google Scholar] [CrossRef]
- Gelman, A.; Rubin, D.B. Inference from iterative simulation using multiple sequences. Stat. Sci. 1992, 7, 457–472. [Google Scholar] [CrossRef]
- Fushiki, T. Estimation of prediction error by using K-fold cross-validation. Stat. Comput. 2011, 21, 137–146. [Google Scholar] [CrossRef]


| AUC * | AUC_CV | TjurR2 | TjurR2_CV | |
|---|---|---|---|---|
| model_cov | 0.87 ± 0.08 | 0.72 ± 0.14 | 0.26 ± 0.14 | 0.15 ± 0.14 |
| model_null | 0.93 ± 0.6 | 0.71 ± 0.13 | 0.13 ± 0.04 | 0.07 ± 0.08 |
| model_full | 0.97 ± 0.04 | 0.82 ± 0.12 | 0.49 ± 0.13 | 0.36 ± 0.13 |
Disclaimer/Publisher’s Note: The statements, opinions and data contained in all publications are solely those of the individual author(s) and contributor(s) and not of MDPI and/or the editor(s). MDPI and/or the editor(s) disclaim responsibility for any injury to people or property resulting from any ideas, methods, instructions or products referred to in the content. |
© 2025 by the authors. Licensee MDPI, Basel, Switzerland. This article is an open access article distributed under the terms and conditions of the Creative Commons Attribution (CC BY) license (https://creativecommons.org/licenses/by/4.0/).
Share and Cite
Lin, L.; Liu, Y.; Kang, B. Unraveling Fish Community Assembly Rules in Coastal China Seas Based on Hierarchical Modeling of Species Communities. Animals 2025, 15, 3108. https://doi.org/10.3390/ani15213108
Lin L, Liu Y, Kang B. Unraveling Fish Community Assembly Rules in Coastal China Seas Based on Hierarchical Modeling of Species Communities. Animals. 2025; 15(21):3108. https://doi.org/10.3390/ani15213108
Chicago/Turabian StyleLin, Li, Yang Liu, and Bin Kang. 2025. "Unraveling Fish Community Assembly Rules in Coastal China Seas Based on Hierarchical Modeling of Species Communities" Animals 15, no. 21: 3108. https://doi.org/10.3390/ani15213108
APA StyleLin, L., Liu, Y., & Kang, B. (2025). Unraveling Fish Community Assembly Rules in Coastal China Seas Based on Hierarchical Modeling of Species Communities. Animals, 15(21), 3108. https://doi.org/10.3390/ani15213108