Simple Summary
Bone mineral density (BMD) is a key indicator of skeletal health in boars and affects reproductive performance. In this study, 492 adult and 208 replacement boars were assessed using quantitative ultrasound (QUS) to examine BMD and its relationship with semen quality. Additionally, 150 adult Duroc boars were randomly assigned to five groups for 90 days to evaluate supplementation effects on semen quality, reproductive hormones, and bone metabolism. Results showed that BMD was influenced by breed and age and correlated with sperm abnormality rates. Supplementation with 250 μg 25-OH-D3 improved sperm motility, reduced abnormalities, and increased reproductive hormone and osteocalcin levels. These findings suggest that 25-OH-D3 supplementation can effectively enhance boar reproductive performance and bone health.
Abstract
Bone mineral density (BMD) is a key indicator of skeletal health in boars that influences their reproductive performance. Systematic research on the relationship between BMD and semen quality in adult boars of different breeds and ages is scarce. This study used quantitative ultrasound (QUS) technology to measure BMD in 492 adult and 208 replacement boars. The boars were divided into four equal groups based on descending BMD rankings to analyze correlations with semen quality. Simultaneously, a 25-hydroxyvitamin D3 (25-OH-D3) intervention trial was conducted on 150 adult Duroc boars. A control group and four dose groups (50 μg, 125 μg, 200 μg, and 250 μg) were established. After 90 days, the boars’ semen quality, reproductive hormone levels, and bone metabolism indicators were evaluated. The results showed no significant differences in BMD between adult and replacement boars. However, adult Landrace exhibited significantly higher BMD than Duroc and Yorkshire (p < 0.01). Within the BMD groups, Group D boars had significantly higher rates of sperm abnormality than Groups A and B (p < 0.01), and this trend was consistent across breeds. The 25-OH-D3 intervention results indicated that the 250 μg dosage produced the optimal effect. In this group, boar semen motility significantly improved while sperm abnormality rates significantly decreased. Concurrently, levels of follicle-stimulating hormone (FSH), luteinizing hormone (LH), testosterone (T), serum osteocalcin (OC), and BMD all increased to some degree. In summary, boar BMD is significantly influenced by breed and age and is closely correlated with the rate of sperm abnormality rate. Supplementing with 250 μg of 25-OH-D3 effectively enhances reproductive hormone secretion, improves semen quality, and promotes bone formation. This demonstrates its potential value in breeding and nutritional regulation applications.
1. Introduction
Bone mineral density (BMD), as a key indicator for measuring bone mass and determining the severity of osteoporosis, is defined as the mineral content per unit volume of bone [1]. It not only accurately predicts fracture risk [2] but also holds significant importance for boar breeding production. Research indicates that low BMD is a primary cause of leg weakness in pigs [3]. Fractured pigs are typically culled due to the difficulty of healing fractures. Even if fractured pigs are not culled, their reproductive performance significantly declines [4]. Statistics show that the annual culling rate for boars is approximately 30%, with one-third of these culls attributed to foot and limb disorders [5]. Boars, characterized by heavy weight, limited mobility, and intensive housing, are particularly susceptible to limb and hoof disorders. Poor bone quality is the primary cause of hoof diseases and leg weakness, severely shortening their productive lifespan. Therefore, early detection and prevention of hoof and limb diseases are crucial for extending the service life of breeding stock and enhancing production efficiency.
Currently, various methods are used to assess leg and hoof health in pigs, including leg scoring, gait scoring, bone mineral content, osteomalacia scoring, and biceps femoris length [6,7,8,9,10]. However, leg and gait scoring rely heavily on operator experience and are highly subjective. Dual-energy X-ray absorptiometry (DXA), while commonly used for BMD measurement, is costly, difficult to apply in vivo, and may compromise animal welfare [11]. Therefore, developing novel, non-invasive, and objective methods for measuring animal BMD is essential. Quantitative ultrasound (QUS) has been validated as a low-cost alternative to DXA for measuring BMD and assessing fracture risk [12,13]. It offers advantages such as rapid sample data collection and no adverse health effects on animals, making it more suitable for practical production settings.
The association between BMD and reproductive hormones provides clues for investigating its relationship with boar semen quality. Studies indicate that testosterone (T) secretion is positively correlated with BMD, and infertile males exhibit significantly lower T levels than fertile males [14]. Bone tissue promotes T synthesis by secreting osteocalcin (OC), thereby regulating male fertility. Conversely, T facilitates germ cell maturation and inhibits apoptosis [15]. Furthermore, OC participates in regulating glucose metabolism, muscle mass, brain development and function, and parasympathetic tone, suggesting multi-organ connections involving bone [16,17]. Szulc et al. further demonstrated that individuals with higher levels of uncarboxylated osteocalcin (ucOC) released by osteoclasts exhibited significantly lower BMD compared to those with lower levels [18]. These studies suggest that BMD is partially correlated with reproductive capacity. In boar production, individuals with low BMD are more prone to limb and hoof disorders, leading to restricted mobility and feed intake, which in turn affects semen quality and yield. Therefore, one focus of this study is to measure boar BMD using an ultrasound BMD device and investigate the association between BMD and semen quality.
Vitamin D3 (VD3) is synthesized in the skin from 7-dehydrocholesterol upon exposure to ultraviolet (UV) light and subsequently undergoes hydroxylation in the liver to form 25-OH-D3, the primary circulating form of VD. 25-OH-D3, a fat-soluble nutrient, plays a pivotal role in male reproductive function, as its metabolizing enzymes and vitamin D receptors (VDR) are expressed throughout the male reproductive tract and in germ cells [19]. These findings suggest that 25-OH-D3 may directly influence spermatogenesis and overall reproductive performance in males. Research indicates that 25-OH-D3 modulates sperm function by influencing sperm motility and acrosome reaction through Ca2+-dependent mechanisms [20]. Appropriate supplementation of 25-OH-D3 in boar diets increases fructose and Ca2+ concentrations in semen, elevates serum estradiol and testosterone levels, and promotes reproductive tissue development [21]. Furthermore, studies indicate it enhances seminal plasma antioxidant capacity and reduces cortisol’s suppression of testosterone secretion, thereby improving boar reproductive performance [22,23].
2. Materials and Methods
2.1. Ethical Statement
All animals used in this study were raised in accordance with Chinese swine regulations and approved by the Ethics Committee of South China Agricultural University (Approval No.: 2022G021).
2.2. Experimental Animals
All 700 boars originated from a boar breeding farm in Guangdong. These boars comprised three breeds: Duroc, Landrace, and Yorkshire. Additionally, 492 boars with an average age of 24.28 months (range: 22.03–28.60 months) were defined as adult boars, while 208 boars with an average age of 10.60 months (range: 8.6–11.53 months) were defined as replacement boars. All experimental boars were confirmed to be in healthy condition before and after to the study, with no diseases, normal mobility, regular feeding, and participation in routine production activities. Environmental variables within the boar house were controlled via air conditioning. Temperature and humidity were maintained at 20–22 °C and 65–75%, respectively. Boars were housed in individual stalls. All boars received identical feed and water; mature boars were fed 2.5 kg of feed daily, while replacement boars received 2 kg daily. Feed ingredients and nutritional composition are detailed in Table 1.

Table 1.
Nutritional composition and raw material composition of boar diet.
2.3. BMD Measurement Method
BMD of the hind limbs of boars was measured using an ultrasonic BMD analyzer (Nanjing Kojin Industrial Co., Ltd., Nanjing, China, model OS TEOKJ7000+), with all measurements performed by the same operator. BMD was quantified as sound velocity (SOS), which reflects the speed at which ultrasound waves propagate through bone and is positively correlated with bone density and structural integrity (m/s). To measure BMD, the bone mineral density probe was placed on the medial metatarsal bone of the boar’s hind limb. Each measurement lasted over 30 s and was repeated three times. The recorded value for each boar was the average of the three measurements.
2.4. Grouping of Boars
2.4.1. Grouping of Adult Boars
Since no established classification standard for BMD in boars currently exists and the sample size in this study was insufficient to develop a new reference, adult boars were ranked according to their measured BMD values, from highest to lowest, and divided into four groups: Group A (SOS > 4335.21 m/s), Group B (3951.81 m/s ≤ SOS ≤ 4335.21 m/s), Group C (3664.26 m/s ≤ SOS < 3951.81 m/s), and Group D (SOS < 3664.26 m/s).
2.4.2. Grouping of 25-OH-D3 Test Boars
A total of 150 Duroc boars aged 1.5 years with BMD values below 4000 m/s were selected from Groups B, C, and D. The boars were randomly allocated to five groups (n = 30 per group), including one control and four treatment groups receiving dietary 25-OH-D3 supplementation at doses of 0 μg, 50 μg, 125 μg, 200 μg, and 250 μg, respectively. The supplement was incorporated into the feed and administered for a period of 90 days. This experimental design allowed assessment of the effects of graded 25-OH-D3 supplementation on semen quality, reproductive hormone profiles, and bone metabolism in boars.
2.5. Semen Quality Analysis
Each adult boar underwent semen collection once every four days, for a total of three sessions during the experimental period. Each sample was analyzed within five minutes of collection. Semen data from replacement boars were excluded from analysis, as these animals were still undergoing training, and their semen quality was highly variable and did not meet production standards. Due to manpower and time constraints, no semen preliminary collections were performed; however, all included boars were suitable for practical production both before and after the study, indicating normal semen quality. All collections and assessments were conducted by fixed, experienced personnel to ensure accuracy, reliability, and minimal bias. Semen collection was performed in accordance with the Technical Specification for Production and Preservation of Room-Temperature Semen from Boar (GB/T 25172-2020) [24]. Semen volume was determined by weighing each ejaculate using an electronic balance (Magapor S.A., Zaragoza, Spain, model S3R-6KD), and the weight was converted to volume assuming a density of 1 g/mL; sperm motility, sperm abnormal rate, and semen concentration were assessed using the Magapor Gesipor 3.0 CASA system (Magapor S.A., Zaragoza, Spain, model Magavision). For each semen sample, at least 500 spermatozoa were examined microscopically. Sperm motility was determined based on movement characteristics, while sperm morphology was assessed according to standard evaluation criteria. Semen concentration was calculated and expressed as ×108 sperm/mL. All semen collections and analyses were conducted by the same trained personnel to ensure methodological consistency, accuracy, and reproducibility.
2.6. Blood and Semen Collection and Reproductive Parameter Assessment in the 25-OH-D3 Experiment
On days 1 and 90 of the trial, blood samples were collected from the boars after an 8 h fasting period. In parallel, semen samples were also collected before and after the supplementation period to evaluate reproductive parameters. To minimize stress and ensure animal welfare, trained personnel performed all procedures in strict accordance with institutional and national guidelines for the care and use of experimental animals. During collection, each boar was calmly restrained in a standard handling crate, and 5 mL of blood was drawn from the hind leg vein without the use of anticoagulants or other interventions. The blood samples were allowed to stand at room temperature for 1–2 h, followed by centrifugation at 1000 rpm for 10 min. The supernatant was collected and stored at −20 °C. Serum samples were subsequently sent to Shanghai Shenggong Biotech Co., Ltd. (Shanghai Shenggong Biotech Co., Ltd., Shanghai, China, model ml002384, ml002326, ml705604 and ml002339) for analysis using a microplate reader (ELISA).
2.7. Statistical Analysis
2.7.1. Calculation of Adult Boar Semen Data
All statistical analyses for this section were performed in R 4.5.1. Data normality was assessed using the Shapiro–Wilk test, and homogeneity of variance was evaluated using the Levene (Brown–Forsythe) test. Continuous variables are expressed as mean ± standard deviation (mean ± SD). All tests were two-tailed, with a significance threshold set at p < 0.05.
For all boar samples, a linear model (ANCOVA) was fitted with BMD as the dependent variable and age, breed, and their interaction as independent variables. p-values for the main effects of age, breed, and interaction terms were analyzed based on Type-III variance analysis. For adult boar semen data, linear mixed-effects models were fitted for volume, density, motility, and abnormal sperm rate. Type-III ANOVA with Satterthwaite approximation yielded p-values. Semen samples were grouped into four groups (A–D) based on descending BMD. One-way ANOVA compared intergroup differences, while intra-breed comparisons within groups A–D also employed ANOVA. For BMD comparisons (adult boars vs. replacement boars), Welch’s t-test was used between age groups. Within adult boars and replacement boars, ANOVA was used to compare different breeds. For each breed, Welch’s t-test was used to compare adult boars and replacement boars.
The formula is:
represents the BMD of the ith boar; is the constant term (intercept); is the effect coefficient for age in months; is the effect coefficient for breed; is the coefficient for the interaction effect between age and breed; and is the error term, which follows a normal distribution.
represents the jth observed semen quality index value (e.g., semen volume, semen density, etc.) for the ith adult boar; is the constant term (intercept); is the effect coefficient for breed; denotes the BMD of the ith boar; is the effect coefficient for BMD; is the coefficient for the interaction effect between breed and BMD; is the random effect for each boar, following a normal distribution ; and is the error term, following a normal distribution .
2.7.2. Calculation of 25-OH-D3 Test Data
Statistical analysis of this section’s data was performed using GraphPad Prism 9.0 software. Data are expressed as mean ± SEM. All comparisons employed independent samples t-tests.
3. Results
3.1. Relationship Between Boar Semen Quality and BMD
3.1.1. Factors Affecting Boar BMD and Semen Quality
The calculation results indicate that the main effect of age in months is significant (p = 0.0054), suggesting a stable linear relationship between age in months and BMD. The main impact of breed is not significant (p = 0.234), indicating that the average BMD differences among breeds are not pronounced when interaction is not considered. The interaction between age in months and breed shows marginal significance (p = 0.0888, at the 10% significance level), suggesting that the slope of the “age–BMD” relationship may vary slightly among breeds (Table 2). In the analysis of adult boar semen samples, the overall p-values for breed effects, BMD effects, and their interaction were mainly above 0.10 for the four parameters—semen volume, semen density, sperm motility, and sperm abnormality rate—indicating no statistically significant differences. The only significant effect observed was that of BMD on sperm abnormality rate (p = 0.00001), indicating a significant correlation between BMD changes and Sperm abnormality rate after controlling for repeated measurements within individuals (Table 3).
Table 2.
Effects of different factors on BMD.
Table 3.
Effects of different factors on semen quality.
3.1.2. Comparison and Grouping of BMD in Adult Boars and Replacement Boars
We compared the BMD of adult boars and replacement boars, with results shown in Table 4. The average BMD for adult boars was 4141.189 m/s, while that for replacement boars was 4108.226 m/s. The BMD values were relatively close, showing no significant difference at the commonly used 5% significance level but considered marginally significant at the 10% level. This discrepancy may stem from the fact that replacement boars are in a phase of rapid skeletal growth and mineralization, resulting in more pronounced BMD variations among individuals. In contrast, adult boars have completed skeletal development, exhibiting stable peak BMD values and consequently smaller inter-group BMD differences.
Table 4.
Comparison of BMD between adult boar and replacement boars.
3.1.3. Comparison of BMD Among Different Breeds of Boars
To investigate the influence of breed on BMD, we grouped and compared the BMD of adult boars and replacement boars by breed. We found that among adult boars, the BMD of Duroc and Landrace boars was significantly lower than that of Yorkshire (p < 0.05) (Table 5), but this phenomenon did not occur in replacement boars. Subsequently, we compared BMD between adult and replacement boars within the same breed. Results indicated that in Landrace, adult boars exhibited significantly higher BMD than replacement boars (p < 0.05). In Duroc, BMD between adult and replacement boars was similar, with differences marginally significant at the 10% significance level but not at the commonly used 5% level (Table 6).
Table 5.
Comparison of BMD of Boars Between Different Breeds.
Table 6.
Comparison of BMD between breeds.
3.1.4. Comparison of Semen Quality Among Adult Boars in Different BMD Groups
First, we compared semen quality among boars in different BMD groups. Results showed that the sperm abnormality rate in Group D was significantly higher than in Groups A and B (p < 0.05) (Table 7). Subsequently, we compared semen quality among boars of the same breed but different BMD groups. Significant differences in sperm abnormality rates were also observed between BMD groups (Table 8). Specifically, among adult Landrace boars, significant differences existed among Groups A, B, and D, with Group C significantly higher than Group A (p < 0.05); among adult Yorkshire, no significant difference was observed between Groups A and B, while Groups A and B were significantly lower than Groups C and D (p < 0.05). Notably, across all three breeds, sperm abnormality rates showed a trend of increasing with decreasing BMD.
Table 7.
Comparison of semen quality of adult boars with different BMD groups.
Table 8.
Comparison of semen quality among three breeds of adult boars with different BMD groups.
3.2. Effects of 25-OH-D3 Supplementation in Feed on Boar Reproductive Performance
3.2.1. Effects of Different Doses of 25-OH-D3 on Boar Semen Quality
We administered different doses of 25-OH-D3 (0 μg, 50 μg, 125 μg, 200 μg, 250 μg) to 150 1.5-year-old Duroc boars with BMD below 4000. Data indicated no significant differences in semen quality among groups before the experiment (p > 0.05). Post-experiment, changes in semen volume and concentration showed no marked differences between groups. The 250 μg dose group exhibited a slight upward trend in semen volume, yet this did not differ significantly from other groups (Figure 1a,b). Intragroup longitudinal analysis revealed significantly increased sperm motility in the 125 μg, 200 μg, and 250 μg groups compared to pre-experimental levels (p < 0.01) (Figure 1c). The 250 μg group also exhibited a significant reduction in sperm abnormality rate compared to pre-experimental levels (p < 0.01) (Figure 1d).
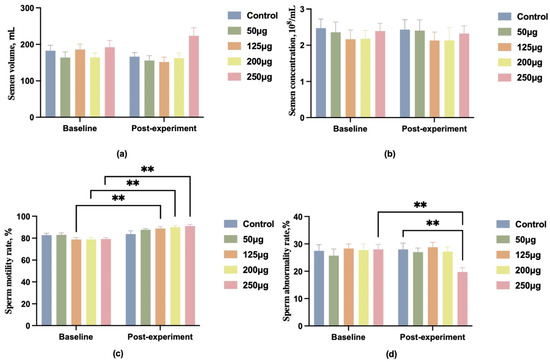
Figure 1.
A comparison of boar semen quality before and after feeding different doses of 25-OH-D3. (a) Comparison of boar semen volume; (b) comparison of boar semen concentration; (c) comparison of boar sperm motility; (d) comparison of boar sperm abnormal morphology rate. ** indicates a highly significant difference (p < 0.01), and no symbol indicates no significant difference.
3.2.2. Effects of Different Doses of 25-OH-D3 on Reproductive Hormones in Boars
To better observe the effects of different doses of 25-OH-D3 on boar reproductive performance, blood samples were collected from the hind leg veins of the boars on day 90 of the trial. Serum was separated by centrifugation, and the levels of follicle-stimulating hormone (FSH), luteinizing hormone (LH), and testosterone (T) in the serum were measured. Compared with the control group, all four treatment groups exhibited varying degrees of elevation in FSH, LH, and T levels, with the most pronounced changes observed in the 250 μg dose group (Figure 2).
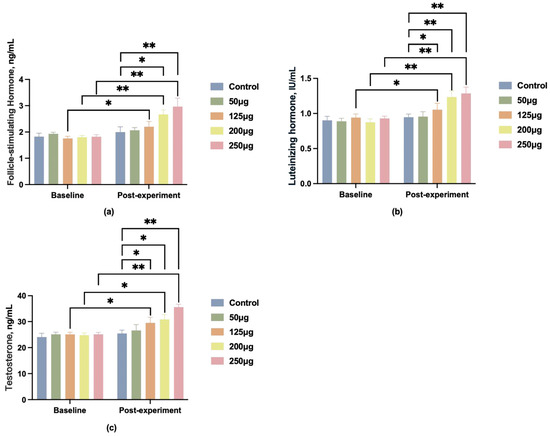
Figure 2.
Changes in reproductive hormone levels in boar blood after feeding different doses of 25-OH-D3. (a) Changes in follicle-stimulating hormone (FSH) levels; (b) changes in luteinizing hormone (LH) levels; (c) changes in testosterone (T) levels. * indicates significant difference (p < 0.05), ** indicates highly significant difference (p < 0.01), and no label indicates no significant difference.
3.2.3. Effects of Different Doses of 25-OH-D3 on Bone Mass in Boars
In addition to semen quality, we collected data on boar BMD before and after the experiment, as well as OC levels in boar blood post-experiment. Before feeding, the BMD differences between groups were not statistically significant. After feeding, only the 200 μg and 250 μg dose groups showed a significant increase in bone density (p < 0.01) (Figure 3a), with the 250 μg dose group exhibiting a more pronounced upward trend (p < 0.01).
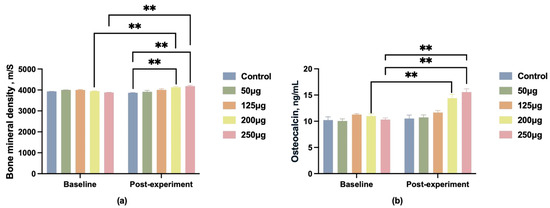
Figure 3.
Changes in BMD and OC levels in male pigs after feeding different doses of 25-OH-D3. (a) Changes in bone mineral density (BMD); (b) changes in osteocalcin (OC) levels. ** indicates significant difference (p < 0.01), and no label indicates no significant difference.
OC serves as a crucial biomarker for skeletal quality. Blood samples were collected post-experiment for OC content analysis. Following dietary intervention, serum OC levels in the 125 μg, 200 μg, and 250 μg groups were significantly higher than those of the control group (p < 0.01), with the 250 μg group demonstrating the most pronounced effect (Figure 3b).
4. Discussion
4.1. Differences in Bone Mineral Density (BMD) Measurement Methods
Different BMD measurement methods vary in their principles and dimensional resolution, which may influence the results. DXA is a commonly used technique for assessing BMD. As a two-dimensional projection method, it is susceptible to bone size and soft tissue effects and cannot comprehensively reflect bone microarchitecture [12]. Quantitative computed tomography (QCT) provides three-dimensional volumetric BMD information and can differentiate cortical from trabecular bone; however, it is costly, involves high radiation exposure, and is not suitable for in vivo or repeated measurements [13]. In contrast, QUS evaluates bone density, elasticity, and microstructural properties through SOS and broadband ultrasound attenuation. QUS is radiation-free, portable, and repeatable, making it particularly suitable for on-site and longitudinal studies in experimental animals such as pigs [24]. Overall, QUS offers significant advantages in safety, flexibility, and comprehensive assessment of bone quality, making it a valuable tool for animal bone research.
4.2. Relationship Between BMD and Boar Breeds
In this experiment, the BMD of 492 adult boars and 208 replacement boars. Results showed that BMD exhibited breed differences in adult boars, whereas no such phenomenon was observed in replacement boars. This aligns with previous research conclusions indicating significant BMD variations among different animal breeds [25,26,27].
Among adult boars, Yorkshire individuals exhibited significantly higher BMD compared with Duroc and Landrace. This phenomenon may be related to the premature culling of Durocs and Landraces with low BMD due to leg disorders. Furthermore, since only three breeds were included in this study and only Yorkshires showed significant differences in BMD between adult and replacement boars, it is speculated that this situation may be specific to certain breeds and related to differences in BMD growth rates across different periods among breeds. Damaziak et al. observed period-specific variations in BMD growth rates among three chicken breeds, with some breeds exhibiting gradual increases while others showed significant increases only at 21, 35, or 56 days of age [26]. Zotti et al. found that among beef cattle, only Charolais exhibited significant BMD differences compared to three other breeds [27]; Kumar et al. also demonstrated differences in bone mass, growth rate, mineralization rate, and BMD across three dog breeds at different developmental stages [28].
4.3. Relationship Between BMD and Boar Semen Quality
In our study, we found significant differences in sperm abnormality rates among boars with different BMD levels, which may be directly related to reduced bone mass. Bone tissue can promote testosterone synthesis in testicular interstitial cells through OC, which in turn supports germ cell maturation [15]. As an osteogenic hormone, OC plays a key role in the bone–testicular axis [15,16,17]. Szulc et al. [18] reported that individuals with high levels of unOC (released by osteoclasts) exhibit significantly lower BMD than those with low ucOC levels [18]. Low BMD may also predispose boars to limb and hoof disorders, increasing the risk of fractures and other musculoskeletal issues [29]. In this study, all experimental boars were housed in individual stalls with concrete slatted floors. As the boars grew larger, available space decreased, leading to markedly reduced activity. Confinement in stalls with concrete flooring further exacerbated foot and leg disorders, resulting in lower semen collection frequencies and consequently higher sperm abnormality rates [30,31].
The present study suggests that VD deficiency may be an additional factor contributing to variations in sperm abnormality rates among boars with different BMD levels. VD is essential for skeletal development and function; its insufficiency impairs bone mineralization, reduces BMD, and increases fracture risk. VD also influences semen quality via OC [32], and deficiency has been associated with elevated sperm abnormality rates [33]. VD acquisition depends on both sunlight synthesis and dietary intake. Although boars can synthesize VD through sunlight exposure [34], intensive livestock management limits their access to sunlight, making them reliant on limited dietary VD sources [35]. Consequently, boars are prone to VD deficiency, and dietary VD supplementation has been shown to reduce sperm abnormality rates [36]. In this study, boars were housed in enclosed barns, preventing natural VD synthesis. Combined with limited dietary VD, this likely resulted in suboptimal VD status, which may have contributed to reduced BMD and increased sperm abnormality rates.
Several studies have suggested a link between BMD and male reproductive health. Yang et al. [37] reported that Chinese men with low BMD typically exhibited decreased sperm motility, increased sperm abnormality rates, and a tendency toward slightly lower semen concentration. Ferlin et al. [38] observed in a cohort of 5177 men that individuals with low sperm count and low testosterone frequently had reduced BMD, accompanied by metabolic abnormalities, with overall trends of decreased sperm motility and concentration. Bobjer et al. [39] also reported that subfertile men with hypogonadism had significantly lower BMD compared with men with normal testosterone levels, along with reductions across semen parameters, including sperm motility, concentration, and morphology.
In comparison, our study showed that boars with lower BMD exhibited significantly higher sperm abnormality rates, while other semen parameters, including sperm motility, concentration, and semen volume, remained unchanged. This indicates that in boars, decreased BMD primarily affects sperm morphology, with minimal impact on other semen parameters. Although interspecies differences exist, this trend aligns with human studies reporting increased sperm morphological abnormalities in individuals with low BMD, highlighting a potential link between bone health and reproductive function and suggesting that the bone–reproductive axis may operate similarly across species.
4.4. Effects of 25-OH-D3 on Boar Reproductive Performance
25-hydroxyvitamin D3 (25-OH-D3), generated by hepatic hydroxylation of vitamin D (VD), exerts its physiological actions through binding to vitamin D receptors (VDRs) expressed in germ cells, spermatozoa, interstitial cells, and epithelial cells of the male reproductive tract [40]. These receptors enable 25-OH-D3 to directly regulate spermatogenesis, reproductive hormone secretion, and sperm maturation [41]. In the present study, dietary supplementation with 25-OH-D3 at doses of 200 μg and 250 μg significantly enhanced sperm motility. This improvement may be associated with the role of 25-OH-D3 in promoting intestinal calcium absorption, as calcium signaling—regulated by VDR in the boar reproductive tract—facilitates sperm tail movement, activation, and capacitation [20,42].
Within the testis and kidney, 25-OH-D3 is further converted to its active form, 1α,25(OH)2D3, by 25-OH-D3 1α-hydroxylase (CYP27B1) [43]. The active metabolite binds to VDR and forms a heterodimer with the retinoid X receptor (RXR), which translocates into the nucleus and interacts with vitamin D response elements (VDREs) in DNA [44]. Through this mechanism, it regulates the transcription of genes critical for spermatogenesis and testicular development, including steroidogenic enzymes (CYP11A1, CYP19A1), the testicular regulator INSL3, and receptors for follicle-stimulating hormone (FSHR) and luteinizing hormone (LHR), thereby promoting testosterone synthesis, maintaining Leydig and Sertoli cell function, and supporting sperm maturation [45,46].
In addition to the classical nuclear pathway, 1α,25(OH)2D3 can rapidly activate non-genomic signaling via membrane-associated VDR, engaging MAPK/ERK and PI3K/AKT cascades that regulate cell proliferation, survival, and hormone synthesis [47,48]. It also enhances sperm mitochondrial function by upregulating antioxidant enzymes such as catalase (CAT) and superoxide dismutases (SOD1/2), maintaining ATP production and improving sperm motility and flagellar activity [49].
Furthermore, 25-OH-D3 markedly increases serum testosterone concentrations in boars. This may occur through 1α,25(OH)2D3-induced stimulation of CYP11A1 and CYP17A1 expression in adrenal cortical cells, thereby enhancing testosterone biosynthesis [50]. Testosterone facilitates the development of germ cells, testes, and accessory sex glands [51], elevates seminal vesicle weight and secretory activity [52], and provides fructose—accounting for approximately 60% of seminal plasma—as an energy source for sperm, further promoting motility [53]. Concurrently, 25-OH-D3 elevates luteinizing hormone (LH) and follicle-stimulating hormone (FSH) levels, which act through the hypothalamic–pituitary–gonadal axis to stimulate spermatogenesis and androgen secretion [54].
4.5. Relationship Between 25-OH-D3 and Boar Bone Structure
25-OH-D3 is produced through hepatic hydroxylation of VD, exhibiting high activity and stability. It regulates calcium-phosphorus metabolism and bone growth. Calcium ions absorbed through the bloodstream enter bone tissue, achieving a dynamic calcium equilibrium via bone resorption and formation. This study demonstrated that boars supplemented with 200 μg and 250 μg of 25-OH-D3 exhibited significantly higher BMD than the control group. This aligns with findings by Jefferies et al. (2002) and Sugiyama et al. (2013): The former study found that 0.1 mg/kg 25-OH-D3 reduced the incidence and severity of porcine osteochondrosis [53], while the latter confirmed its ability to elevate serum active VD levels in castrated boars, decrease osteochondrosis incidence, and promote normal endochondral ossification [54].
25-OH-D3 also significantly increases serum OC levels in boars. OC is a specific indicator reflecting bone formation rate and is positively correlated with BMD; its concurrent elevation suggests increased bone formation and bone mass growth. Notably, OC not only influences bone formation but also modulates the male reproductive system. Oury et al. found that OC stimulates testosterone production in testicular interstitial cells [15], while 25-OH-D3 may indirectly influence testosterone levels by regulating calcium homeostasis or OC. This explains the synchronous increase in T and OC levels observed in this study following 25-OH-D3 supplementation. Research on the effects of 25-OH-D3 on OC secretion in livestock and poultry remains limited. This study demonstrates through BMD and OC data that 25-OH-D3 indeed enhances skeletal strength in male pigs. However, the specific mechanism by which 25-OH-D3 influences OC secretion requires further investigation.
5. Conclusions
Analysis of BMD revealed no significant age-related differences in BMD among boars aged 10–24 months. Breed differences in BMD were observed only in adult boars, and BMD levels correlated with sperm abnormality rates. The results indicate that supplementing diets with 250 μg of 25-OH-D3 significantly enhances boar sperm motility, reduces sperm abnormality rates, improves overall semen utilization, increases reproductive hormone secretion, and boosts reproductive performance. Concurrently, it markedly elevates boar OC secretion and tibial BMD [1].
Author Contributions
Writing—review and editing, M.L., X.L. and S.Z.; Software, Validation, and Data curation, M.L. and X.L.; Investigation, M.L. and X.L.; Supervision and Methodology, S.Z., H.W. and L.L.; Conceptualization, Supervision, and Project administration, S.Z. All authors have read and agreed to the published version of the manuscript.
Funding
This research was funded by the Project of Swine Innovation Team in Guangdong Modern Agricultural Research System, grant number 2021KJ126 and Guangzhou Science and Technology Plan Project, grant number: 202103000068.
Institutional Review Board Statement
All animals used in this study were kept according to the Chinese legislation for pig production, and the study was approved by the Ethics Committee of South China Agricultural University (Approval Number: 2022G021).
Informed Consent Statement
Written informed consent was obtained from the owner of the animals involved in this study.
Data Availability Statement
The raw data supporting the conclusions of this article will be made available by the authors on request.
Conflicts of Interest
The authors declare no conflicts of interest.
References
- Marshall, D.; Johnell, O.; Wedel, H. Meta-Analysis of How Well Measures of Bone Mineral Density Predict Occurrence of Osteoporotic Fractures. BMJ 1996, 312, 1254–1259. [Google Scholar] [CrossRef]
- Chevalley, T.; Rizzoli, R.; Nydegger, V.; Slosman, D.; Tkatch, L.; Rapin, C.-H.; Vasey, H.; Bonjour, J.-P. Preferential Low Bone Mineral Density of the Femoral Neck in Patients with a Recent Fracture of the Proximal Femur. Osteoporos. Int. 1991, 1, 147–154. [Google Scholar] [CrossRef]
- Storskrubb, A.; Sevón-Aimonen, M.-L.; Uimari, P. Genetic Parameters for Bone Strength, Osteochondrosis and Meat Percentage in Finnish Landrace and Yorkshire Pigs. Animal 2010, 4, 1319–1324. [Google Scholar] [CrossRef]
- Jensen, T.B.; Kristensen, H.H.; Toft, N. Quantifying the Impact of Lameness on Welfare and Profitability of Finisher Pigs Using Expert Opinions. Livest. Sci. 2012, 149, 209–214. [Google Scholar] [CrossRef]
- Wang, C.; Wang, M.; Liu, X.; Jiang, B.; Liu, X. Correlation Analysis of Breed and Parity with the Health Status of the Female Pig’s Hoof Nail. Heilongjiang Anim. Sci. Vet. 2019, 55–58+168–169. [Google Scholar] [CrossRef]
- Fukawa, K.; Sugiyama, T.; Kusuhara, S.; Kudoh, O.; Kameyama, K. Estimation of Genetic Parameters on Leg Score and Joint Cartilage Lesion Scores in a Closed Population of Duroc Pig. Nihon Chikusan Gakkaiho 2000, 71, 353–362. [Google Scholar] [CrossRef]
- Guo, Y.M.; Zhang, X.F.; Ren, J.; Ai, H.S.; Ma, J.W.; Huang, L.S. A Joint Genomewide Association Analysis of Pig Leg Weakness and Its Related Traits in an F2 Population and a Sutai Population1. J. Anim. Sci. 2013, 91, 4060–4068. [Google Scholar] [CrossRef]
- Mitchell, A.D.; Scholz, A.M.; Pursel, V.G. Total Body and Regional Measurements of Bone Mineral Content and Bone Mineral Density in Pigs by Dual Energy X-Ray Absorptiometry. J. Anim. Sci. 2001, 79, 2594–2604. [Google Scholar] [CrossRef] [PubMed]
- Lundeheim, N. Genetic Analysis of Osteochondrosis and Leg Weakness in the Swedish Pig Progeny Testing Scheme. Acta Agric. Scand. 1987, 37, 159–173. [Google Scholar] [CrossRef]
- Rothammer, S.; Kremer, P.V.; Bernau, M.; Fernandez-Figares, I.; Pfister-Schär, J.; Medugorac, I.; Scholz, A.M. Genome-Wide QTL Mapping of Nine Body Composition and Bone Mineral Density Traits in Pigs. Genet. Sel. Evol. 2014, 46, 68. [Google Scholar] [CrossRef] [PubMed]
- Kaufman, J.J.; Luo, G.; Siffert, R.S. A Portable Real-Time Ultrasonic Bone Densitometer. Ultrasound Med. Biol. 2007, 33, 1445–1452. [Google Scholar] [CrossRef][Green Version]
- Wu, C.; Hans, D.; He, Y.; Fan, B.; Njeh, C.F.; Augat, P.; Richards, J.; Genant, H.K. Prediction of Bone Strength of Distal Forearm Using Radius Bone Mineral Density and Phalangeal Speed of Sound. Bone 2000, 26, 529–533. [Google Scholar] [CrossRef]
- Hans, D.; Baim, S. Quantitative Ultrasound (QUS) in the Management of Osteoporosis and Assessment of Fracture Risk. J. Clin. Densitom. 2017, 20, 322–333. [Google Scholar] [CrossRef]
- Bertani, G.R.; Scheid, I.R.; Irgang, R.; Barioni, W.; Wentz, I.; Afonso, S.B. Gonadal Sperm Reserve in Purebred Landrace and Large White Boars of High Average Daily Gain. Theriogenology 2002, 57, 859–867. [Google Scholar] [CrossRef] [PubMed]
- Oury, F.; Sumara, G.; Sumara, O.; Ferron, M.; Chang, H.; Smith, C.E.; Hermo, L.; Suarez, S.; Roth, B.L.; Ducy, P.; et al. Endocrine Regulation of Male Fertility by the Skeleton. Cell 2011, 144, 796–809. [Google Scholar] [CrossRef] [PubMed]
- Lee, N.K.; Sowa, H.; Hinoi, E.; Ferron, M.; Ahn, J.D.; Confavreux, C.; Dacquin, R.; Mee, P.J.; McKee, M.D.; Jung, D.Y.; et al. Endocrine Regulation of Energy Metabolism by the Skeleton. Cell 2007, 130, 456–469. [Google Scholar] [CrossRef]
- Mera, P.; Laue, K.; Ferron, M.; Confavreux, C.; Wei, J.; Galán-Díez, M.; Lacampagne, A.; Mitchell, S.J.; Mattison, J.A.; Chen, Y.; et al. Osteocalcin Signaling in Myofibers Is Necessary and Sufficient for Optimum Adaptation to Exercise. Cell Metab. 2016, 23, 1078–1092. [Google Scholar] [CrossRef]
- Szulc, P.; Arlot, M.; Chapuy, M.; Duboeuf, F.; Meunier, P.J.; Delmas, P.D.D. Serum Undercarboxylated Osteocalcin Correlates with Hip Bone Mineral Density in Elderly Women. J. Bone Miner. Res. 1994, 9, 1591–1595. [Google Scholar] [CrossRef] [PubMed]
- Rezayat, A.A.; Asadpour, A.A.; Yarahmadi, A.; Ahmadnia, H.; Hakkak, A.M.; Soltani, S. Association Between Serum Vitamin D Concentration with Spermiogram Parameters and Reproductive Hormones Among Infertile Iranian Males: A Cross-Sectional Study. Reprod. Sci. 2022, 29, 270–276. [Google Scholar] [CrossRef]
- Arab, A.; Hadi, A.; Moosavian, S.P.; Askari, G.; Nasirian, M. The Association between Serum Vitamin D, Fertility and Semen Quality: A Systematic Review and Meta-Analysis. Int. J. Surg. 2019, 71, 101–109. [Google Scholar] [CrossRef]
- Blomberg Jensen, M.; Bjerrum, P.J.; Jessen, T.E.; Nielsen, J.E.; Joensen, U.N.; Olesen, I.A.; Petersen, J.H.; Juul, A.; Dissing, S.; Jørgensen, N. Vitamin D Is Positively Associated with Sperm Motility and Increases Intracellular Calcium in Human Spermatozoa. Hum. Reprod. 2011, 26, 1307–1317. [Google Scholar] [CrossRef]
- Johnson, B.H.; Welsh, T.H., Jr.; Juniewicz, P.E. Suppression of Luteinizing Hormone and Testosterone Secretion in Bulls Following Adrenocorticotropin Hormone Treatment1. Biol. Reprod. 1982, 26, 305–310. [Google Scholar] [CrossRef]
- GB 23238-2021; Technical Specification for Production and Preservation of Fresh Boar Semen. Standards Press of China: Beijing, China, 2021.
- Baroncelli, G.I. Quantitative Ultrasound Methods to Assess Bone Mineral Status in Children: Technical Characteristics, Performance, and Clinical Application. Pediatr. Res. 2008, 63, 220–228. [Google Scholar] [CrossRef] [PubMed]
- Shim, M.Y.; Karnuah, A.B.; Mitchell, A.D.; Anthony, N.B.; Pesti, G.M.; Aggrey, S.E. The Effects of Growth Rate on Leg Morphology and Tibia Breaking Strength, Mineral Density, Mineral Content, and Bone Ash in Broilers. Poult. Sci. 2012, 91, 1790–1795. [Google Scholar] [CrossRef]
- Damaziak, K.; Charuta, A.; Niemiec, J.; Tatara, M.R.; Krupski, W.; Gozdowski, D.; Kruzińska, B. Femur and Tibia Development in Meat-Type Chickens with Different Growth Potential for 56 Days of Rearing Period. Poult. Sci. 2019, 98, 7063–7075. [Google Scholar] [CrossRef] [PubMed]
- Zotti, A.; Gianesella, M.; Ceccato, C.; Morgante, M. Physiological Values and Factors Affecting the Metacarpal Bone Density of Healthy Feedlot Beef Cattle as Measured by Dual-Energy X-Ray Absorptiometry. J. Anim. Physiol. Anim. Nutr. 2010, 94, 615–622. [Google Scholar] [CrossRef]
- Kumar, K.; Mogha, I.V.; Aithal, H.P.; Amarpal; Kinjavdekar, P.; Singh, G.R.; Pawde, A.M.; Setia, H.C. Determinants of Bone Mass, Density and Growth in Growing Dogs with Normal and Osteopenic Bones. Vet. Res. Commun. 2009, 33, 57–66. [Google Scholar] [CrossRef] [PubMed]
- Anil, S.S.; Anil, L.; Deen, J. Challenges of Pain Assessment in Domestic Animals. J. Am. Vet. Med. Assoc. 2002, 220, 313–319. [Google Scholar] [CrossRef]
- Flowers, W. Factors Affecting the Efficient Production of Boar Sperm. Reprod. Domest. Anim. 2015, 50, 25–30. [Google Scholar] [CrossRef]
- Oku, Y.; Noda, S.; Yamada, A.; Nakaoka, K.; Goseki-Sone, M. Twenty-Eight Days of Vitamin D Restriction and/or a High-Fat Diet Influenced Bone Mineral Density and Body Composition in Young Adult Female Rats. Ann. Anat. Anat. Anz. 2022, 243, 151945. [Google Scholar] [CrossRef]
- Shahreza, F.D.; Hajian, M.; Gharagozloo, P.; Drevet, J.R.; Nasr-Esfahani, M.H. Impact of Vitamin D Deficiency on Mouse Sperm Structure and Function. Andrology 2020, 8, 1442–1455. [Google Scholar] [CrossRef]
- Kolp, E.; Wilkens, M.R.; Pendl, W.; Eichenberger, B.; Liesegang, A. Vitamin D Metabolism in Growing Pigs: Influence of UVB Irradiation and Dietary Vitamin D Supply on Calcium Homeostasis, Its Regulation and Bone Metabolism. J. Anim. Physiol. Anim. Nutr. 2017, 101, 79–94. [Google Scholar] [CrossRef]
- Dittmer, K.E.; Thompson, K.G. Vitamin D Metabolism and Rickets in Domestic Animals: A Review. Vet. Pathol. 2011, 48, 389–407. [Google Scholar] [CrossRef] [PubMed]
- Lin, Y.; Lv, G.; Dong, H.-J.; Wu, D.; Tao, Z.-Y.; Xu, S.-Y.; Che, L.-Q.; Fang, Z.-F.; Bai, S.-P.; Feng, B.; et al. Effects of the Different Levels of Dietary Vitamin D on Boar Performance and Semen Quality. Livest. Sci. 2017, 203, 63–68. [Google Scholar] [CrossRef]
- Jensen, M.B. Vitamin D Metabolism, Sex Hormones, and Male Reproductive Function. Reproduction 2012, 144, 135–152. [Google Scholar] [CrossRef] [PubMed]
- Yang, B.; Sun, H.; Wan, Y.; Wang, H.; Qin, W.; Yang, L.; Zhao, H.; Yuan, J.; Yao, B. Associations between Testosterone, Bone Mineral Density, Vitamin D and Semen Quality in Fertile and Infertile Chinese Men. Int. J. Androl. 2012, 35, 783–792. [Google Scholar] [CrossRef]
- Ferlin, A.; Garolla, A.; Ghezzi, M.; Selice, R.; Palego, P.; Caretta, N.; Mambro, A.D.; Valente, U.; Ponce, M.D.R.; Dipresa, S.; et al. Sperm Count and Hypogonadism as Markers of General Male Health. Eur. Urol. Focus 2021, 7, 205–213. [Google Scholar] [CrossRef] [PubMed]
- Bobjer, J.; Bogefors, K.; Isaksson, S.; Leijonhufvud, I.; Åkesson, K.; Giwercman, Y.L.; Giwercman, A. High Prevalence of Hypogonadism and Associated Impaired Metabolic and Bone Mineral Status in Subfertile Men. Clin. Endocrinol. 2016, 85, 189–195. [Google Scholar] [CrossRef]
- Blomberg Jensen, M.; Gerner Lawaetz, J.; Andersson, A.-M.; Petersen, J.H.; Nordkap, L.; Bang, A.K.; Ekbom, P.; Joensen, U.N.; Prætorius, L.; Lundstrøm, P.; et al. Vitamin D Deficiency and Low Ionized Calcium Are Linked with Semen Quality and Sex Steroid Levels in Infertile Men. Hum. Reprod. 2016, 31, 1875–1885. [Google Scholar] [CrossRef]
- Jensen, M.B. Vitamin D and Male Reproduction. Nat. Rev. Endocrinol. 2014, 10, 175–186. [Google Scholar] [CrossRef]
- Hofer, D.; Münzker, J.; Schwetz, V.; Ulbing, M.; Hutz, K.; Stiegler, P.; Zigeuner, R.; Pieber, T.R.; Müller, H.; Obermayer-Pietsch, B. Testicular Synthesis and Vitamin D Action. J. Clin. Endocrinol. Metab. 2014, 99, 3766–3773. [Google Scholar] [CrossRef] [PubMed]
- Johnson, J.A.; Grande, J.P.; Roche, P.C.; Kumar, R. Immunohistochemical Detection and Distribution of the 1,25-Dihydroxyvitamin D3 Receptor in Rat Reproductive Tissues. Histochem. Cell Biol. 1996, 105, 7–15. [Google Scholar] [CrossRef]
- Yang, P.; Ma, Y. Recent advances of vitamin D in immune, reproduction, performance for pig: A review. Anim. Health Res. Rev. 2021, 22, 85–95. [Google Scholar] [CrossRef]
- Clark, A.M.; Chuzel, F.; Sanchez, P.; Saez, J.M. Regulation by Gonadotropins of the Messenger Ribonucleic Acid for P450 Side-Chain Cleavage, P45017α-Hydroxylase/C17,20-Lyase, and 3β-Hydroxysteroid Dehydrogenase in Cultured Pig Leydig Cells1. Biol. Reprod. 1996, 55, 347–354. [Google Scholar] [CrossRef]
- Minoru, K.; Susumu, G. KEGG: Kyoto Encyclopedia of Genes and Genomes. Nucleic Acids Res. 2000, 28, 27–30. [Google Scholar] [CrossRef] [PubMed]
- Chen, H.; Bühler, K.; Zhu, Y.; Nie, X.; Liu, W. Proteomics Analysis Reveals the Effect of 1α,25(OH)2VD3-Glycosides on Development of Early Testes in Piglets. Sci. Rep. 2021, 11, 11341. [Google Scholar] [CrossRef]
- Keane, K.N.; Cruzat, V.F.; Calton, E.K.; Hart, P.H.; Soares, M.J.; Newsholme, P.; Yovich, J.L. Molecular Actions of Vitamin D in Reproductive Cell Biology. Reproduction 2017, 153, R29–R42. [Google Scholar] [CrossRef]
- Kinuta, K.; Tanaka, H.; Moriwake, T.; Aya, K.; Kato, S.; Seino, Y. Vitamin D Is an Important Factor in Estrogen Biosynthesis of Both Female and Male Gonads. Endocrinology 2000, 141, 1317–1324. [Google Scholar] [CrossRef]
- Almeida, S.; Rato, L.; Sousa, M.; Alves, M.G.; Oliveira, P.F. Fertility and Sperm Quality in the Aging Male. Curr. Pharm. Des. 2017, 23, 4429–4437. [Google Scholar] [CrossRef]
- Dixson, A.F.; Anderson, M.J. Sexual Selection, Seminal Coagulation and Copulatory Plug Formation in Primates. Folia Primatol. 2002, 73, 63–69. [Google Scholar] [CrossRef] [PubMed]
- Kaprara, A.; Huhtaniemi, I.T. The Hypothalamus-Pituitary-Gonad Axis: Tales of Mice and Men. Metab. Clin. Exp. 2018, 86, 3–17. [Google Scholar] [CrossRef] [PubMed]
- Jefferies, D.; Farquharson, C.; Thomson, J.; Smith, W.; Seawright, E.; McCormack, H.; Whitehead, C. Differences in Metabolic Parameters and Gene Expression Related to Osteochondrosis/Osteoarthrosis in Pigs Fed 25-Hydroxyvitamin D3. Vet. Res. 2002, 33, 383–396. [Google Scholar] [CrossRef] [PubMed]
- Sugiyama, T.; Kusuhara, S.; Chung, T.K.; Yonekura, H.; Azem, E.; Hayakawa, T. Effects of 25-Hydroxy-Cholecalciferol on the Development of Osteochondrosis in Swine. Anim. Sci. J. 2013, 84, 341–349. [Google Scholar] [CrossRef] [PubMed]


Disclaimer/Publisher’s Note: The statements, opinions and data contained in all publications are solely those of the individual author(s) and contributor(s) and not of MDPI and/or the editor(s). MDPI and/or the editor(s) disclaim responsibility for any injury to people or property resulting from any ideas, methods, instructions or products referred to in the content. |
© 2025 by the authors. Licensee MDPI, Basel, Switzerland. This article is an open access article distributed under the terms and conditions of the Creative Commons Attribution (CC BY) license (https://creativecommons.org/licenses/by/4.0/).