Article

Identification and Pathway Analysis of SNP Loci Affecting Abdominal Fat Deposition in Broilers

College of Animal Science and Technology, Northeast Agricultural University, Harbin 150030, China
*
Author to whom correspondence should be addressed.
These authors contributed equally to this work.
Animals 2025, 15(19), 2811; https://doi.org/10.3390/ani15192811
Submission received: 2 September 2025 / Revised: 23 September 2025 / Accepted: 25 September 2025 / Published: 26 September 2025
(This article belongs to the Section Animal Genetics and Genomics)

Abstract

Simple Summary

With the accelerated growth rate of modern broilers, excessive abdominal fat deposition has emerged as a major issue negatively affecting meat quality and feed utilization efficiency. In this study, we identified over 200 genetic markers (SNPs) closely associated with abdominal fat deposition by integrating transcriptome data, whole-genome resequencing, and three-dimensional genomic information from broiler lines divergently selected for high and low abdominal fat content. These SNPs may influence fat accumulation in broilers by modulating gene expression, such as altering protein translation efficiency, mRNA structural stability, transcription factor binding capacity, or long-range genomic interactions. Our findings provide new insights into the molecular mechanisms underlying fat deposition in broilers and offer a valuable reference for molecular breeding aimed at developing leaner chicken lines.

Abstract

Excessive abdominal fat deposition accompanying rapid growth in broiler chickens seriously affects production efficiency. Using divergently selected broiler lines from Northeast Agricultural University, we integrated transcriptome sequencing, whole-genome resequencing, and three-dimensional genomic data to identify key SNPs affecting abdominal fat deposition. From 3,850,758 initial SNPs, 22,721 high-quality SNPs were selected (|ΔAF| ≥ 0.9) and validated to obtain 7341 reliable SNPs. GWAS identified 16 SNPs significantly associated with abdominal fat weight, while LD analysis revealed 22 highly linked SNPs, finally determining 2302 candidate SNPs. Transcriptome analysis identified 825 differentially expressed genes (p ≤ 0.05, |FC| ≥ 1.5). Functional annotation revealed 201 SNPs located in differentially expressed gene regions, including 8 coding SNPs and 193 non-coding SNPs, with an additional 15 SNPs potentially regulating through long-range chromatin interactions. Mechanistic analysis showed that coding SNPs regulate gene expression by altering codon translation rates or mRNA stability, while non-coding SNPs regulate transcription by affecting transcription factor binding. Phenotypic association analysis demonstrated that all 213 SNPs can cause ≥2-fold differences in abdominal fat weight, with 182 SNPs causing ≥3-fold differences. This study successfully identified 213 functional SNPs affecting abdominal fat deposition in broilers and revealed their molecular basis for regulating fat metabolism through multiple mechanisms, providing important genetic markers for low-fat breeding in broilers.

1. Introduction

In recent decades, broiler breeding has primarily focused on enhancing growth performance; however, this has been accompanied by issues such as excessive abdominal fat deposition and a decline in meat quality [1]. Excessive abdominal fat not only reduces feed conversion efficiency and reproductive performance in breeder flocks but also increases the risk of obesity-related diseases and even threatens survival. Therefore, reducing abdominal fat deposition in broilers is crucial for improving both health and overall production performance.
Traditional phenotypic selection methods for broiler fat deposition have primarily relied on abdominal fat weight to distinguish between high- and low-fat lines. Early studies by Leclercq et al. [2] and Lilburn et al. [3] successfully developed lean and obese broiler lines through multi-generational selection. Later, researchers identified a correlation between plasma very low-density lipoprotein (VLDL) concentration and body fat content [4], and Whitehead et al. [5] successfully established low-fat broiler lines using plasma VLDL concentration as the selection criterion. However, these traditional approaches are limited by inherent drawbacks, including long breeding cycles, susceptibility to errors, and high labor costs.
With the advancement of molecular genetics and genomics, broiler breeding has gradually shifted from traditional approaches to molecular breeding. Molecular marker-assisted selection (MAS) enables precision breeding by integrating molecular markers with phenotypic and genotypic information. For instance, Sun et al. [6] reported that multiple SNPs within the PPARG gene were significantly associated with breast muscle intramuscular fat content and abdominal fat weight, providing a genetic basis for MAS. Broiler body fat traits are complex quantitative traits regulated by numerous polygenes with small effects [7]. Recent studies have demonstrated that single nucleotide polymorphisms (SNPs) can alter gene expression and thereby influence fat deposition. For example, Zhang et al. [8] identified a SNP (rs314613110) in the AMY1A gene that affects the binding of miRNA gga-miR-1764-3p to the 3′UTR, leading to altered gene expression and changes in leg muscle and abdominal fat deposition. Similarly, Cheng et al. [9] found 11 SNPs within intron 17 of the RB1 gene significantly associated with abdominal fat weight and fat percentage. Further analysis revealed that the A allele of one SNP (g.32828A>G) inhibited RB1 expression by binding to NF-B-K and SOX2, thereby promoting abdominal fat deposition. In addition, Trevisoli et al. [10] applied additive modeling to predict deleterious SNPs and identified a mutation (c.482C>T) in exon 2 of the MYBPH gene that was significantly associated with abdominal fat weight and percentage, suggesting that this variant may contribute to fat accumulation in broilers through altered gene expression.
Single nucleotide polymorphisms (SNPs) are the most common type of genetic variation and are widely distributed across the broiler genome, including the 5′ and 3′ untranslated regions (UTRs), introns, exons, and intergenic regions. Previous studies have suggested that nonsynonymous mutations in exonic regions are more likely to exert functional effects than other variants, as they can alter amino acid sequences and thereby influence protein structure and folding [11]. In contrast, synonymous mutations have traditionally been overlooked because they do not change the amino acid sequence. However, increasing evidence indicates that both synonymous and nonsynonymous mutations can affect gene expression [12,13,14]. For instance, synonymous mutations may influence translation efficiency and the folding of mRNA secondary structures [15]. Moreover, SNPs in non-coding regions are more abundant than those in coding regions [16]. Such variants can regulate gene expression by disrupting splice sites, modifying transcription factor binding, or altering the activity of distant regulatory elements. Collectively, SNPs located in different genomic regions can regulate gene expression through diverse mechanisms, ultimately influencing phenotypic traits [17].
SNPs, as important genetic markers, play a crucial role in broiler molecular breeding. Advances in detection technologies and functional studies have provided a solid theoretical foundation for understanding the regulatory roles of SNPs in economically important traits, thereby promoting the development of molecular breeding strategies. However, abdominal fat deposition is a complex quantitative trait, and current identified SNPs are insufficient to fully explain the genetic basis underlying this trait variation. Therefore, the present study aimed to identify differentially expressed genes and SNPs between high- and low-fat broiler lines using transcriptomic data, and to further investigate the regulatory pathways of SNPs involved in abdominal fat deposition by integrating genome resequencing and three-dimensional genomic data.

2. Materials and Methods

2.1. Materials

The experimental birds used in this study were the high-fat line (FL) and low-fat line (LL) broilers developed at Northeast Agricultural University. These lines are the only fast-growing broiler bi-directional selection lines in China. They were established by our research group in 1996 using Arbor Acres (AA) broilers as the founder population and subjected to strict bi-directional selection for abdominal fat content. After continuous generations of selection, the FL and LL lines have become highly divergent in fat-related traits such as abdominal fat weight and abdominal fat percentage, exhibiting significant differences [18]. All birds were raised under identical environmental conditions with ad libitum access to feed and water. The room temperature was maintained at 18–25 °C with a relative humidity of 60–65%. The diets were formulated according to NRC (1994) standards [19]. From hatching to 3 weeks of age, birds were fed a starter diet [metabolizable energy (ME), 3000 kcal/kg; crude protein (CP), 210 g/kg]. From 4 weeks of age until 7 weeks, a grower diet was provided (ME, 3100 kcal/kg; CP, 190 g/kg). At 7 weeks of age, all experimental birds were handled in accordance with the Animal Welfare and Ethics Requirements of Northeast Agricultural University. After slaughter, abdominal adipose tissue was separated, weighed, rinsed with 0.75% NaCl solution, rapidly frozen in liquid nitrogen, and stored at −80 °C until further use.
Genomic resequencing data were generated from abdominal adipose tissues of 7-week-old broilers, including 160 birds from the FL and 170 birds from the LL, for a total of 330 individuals. Transcriptome data were obtained from RNA-seq of abdominal adipose tissues from 7-week-old FL and LL broilers (five birds per line). Three-dimensional genomic data were obtained from Hi-C sequencing of abdominal adipose tissues from 7-week-old FL and LL broilers (three birds per line).

2.2. Methods

2.2.1. RNA-Seq-Based SNP Detection and Quality Control

Raw transcriptome data were subjected to quality control using Fastp(v1.0.1) [20] to remove adapters and low-quality reads, thereby generating high-quality clean reads. The clean reads were then aligned to the Gallus gallus reference genome (GRCg6a, Ensembl) using HISAT2(v2.2.1) [21,22,23]. SNP detection was performed with the GATK(v4.6.1.0) software package following the standard pipeline. Briefly, duplicate reads were removed using the MarkDuplicates(v4.0.1.1) tool, and HaplotypeCaller(v4.1.7.0) was applied to reconstruct haplotypes for each sample and generate individual gVCF files. These gVCF files were subsequently merged with CombineGVCFs to produce a single dataset containing all SNP information, followed by joint genotyping with GenotypeGVCFs to obtain a multi-sample VCF file. Low-quality variants were filtered using VariantFiltration(v4.1.6.0) with the thresholds FS > 30.0 and QD < 2.0, resulting in a high-confidence SNP set.
Allele frequency differences between high- and low-fat broiler lines were calculated using the –freq parameter in VCFtools(v0.1.16). Differential SNPs were preliminarily screened based on the absolute allele frequency difference (|ΔAF|) between the two lines, with a threshold of |ΔAF| ≥ 0.9.

2.2.2. Screening SNPs with Combined Genome Resequencing Data

Following the preliminary screening of differential SNPs based on allele frequency differences between high- and low-fat lines, genome resequencing data from 330 samples were used to further eliminate false positives and low-quality variants, thereby retaining only high-confidence SNPs for subsequent analyses. Differences in allele frequencies and chi-square values between the two lines were calculated using PLINK(v1.9) and Popgene (v1.32) to identify SNPs potentially associated with abdominal fat deposition.
Genome-wide association analysis (GWAS) was then conducted on the high-quality SNPs using the BLINK model implemented in GAPIT [24], with a stringent Bonferroni correction applied to identify SNPs significantly associated with abdominal fat traits. Briefly, the BLINK model detects quantitative trait nucleotides (QTNs) through an iterative process: (i) candidate QTNs are first identified with the model y = PC + SNP + e; (ii) these QTNs are then included as covariates in the model y = PC + QTNs + SNP + e to test additional SNPs; (iii) linkage disequilibrium (LD) information is used to refine QTN detection; and (iv) the Bayesian Information Criterion (BIC) is applied with the model y = PC + QTNs + e to exclude false positives while retaining true QTNs. This cycle is repeated until all QTNs are identified (Figure 1). Finally, SNPs significantly associated with abdominal fat weight were subjected to LD analysis using LDBlockShow(v1.41) to characterize their genomic distribution.

2.2.3. Screening for SNPs Potentially Affecting the Expression of Genes Related to Abdominal Fat Deposition

To identify SNPs that may influence the expression of genes associated with abdominal fat deposition, transcriptome RNA-seq data were analyzed. Transcript assembly and quantification of expressed genes were performed using StringTie(2.2.3), and differential expression analysis was conducted with Ballgown in R(4.2.0) [25]. Differentially expressed genes (DEGs) between high-fat and low-fat broilers were identified using a significance threshold of p ≤ 0.05 and a fold-change (FC) >1.5 or <0.67.
Based on these DEGs and integrated three-dimensional genomic (Hi-C) data, candidate SNPs were categorized into three groups: (i) SNPs located in coding regions of DEGs, (ii) SNPs located in non-coding regions of DEGs, and (iii) SNPs located outside DEGs but potentially exerting distal regulatory effects on DEGs through chromatin interactions. These SNPs were considered as candidate variants for subsequent analyses.

2.2.4. Prediction of SNP-Regulated Gene Expression Pathways

Based on the candidate SNPs, their potential effects on the expression of genes related to abdominal fat deposition in broilers were further investigated using multiple bioinformatics approaches. For SNPs located in coding regions of differentially expressed genes, six tools—including NetPhos(v3.1) [26,27], NetNGlyc(v1.0) [28], NovoPro (www.novoprolabs.com, accessed on 21 September 2025), SOPMA (npsa.lyon.inserm.fr/cgi-bin, accessed on 21 September 2025), ExpOptimizer (https://www.novoprolabs.com/tools/codon-optimization, accessed on 21 September 2025), and RNAfold (http://rna.tbi.univie.ac.at/cgi-bin/RNAWebSuite/RNAfold.cgi, accessed on 21 September 2025)—were employed to assess potential impacts on phosphorylation and glycosylation modifications, protein hydrophobicity, secondary structure, codon translation efficiency, and mRNA secondary structure.
For SNPs located in non-coding regions of differentially expressed genes, AnimalTFDB(v4.0) and TFBIND(v3.4) [29] were used to evaluate whether the mutations altered transcription factor binding sites or their affinities. For SNPs potentially regulating distal gene expression, AnimalTFDB, TFBIND, and IGV were applied to examine changes in transcription factor binding and inter-genomic interactions. The results of these analyses were integrated to identify SNPs most likely to regulate abdominal fat deposition in broiler chickens.

2.3. Statistical and Bioinformatics Analysis

2.3.1. Principal Component Analysis

Principal component analysis (PCA) was performed using the 7341 validated SNPs identified through the integration of transcriptome and genome resequencing data to assess population structure and genetic relationships between high-fat (FL) and low-fat (LL) broiler lines. PCA was implemented using PLINK v1.9 software, and the first two principal components were visualized to demonstrate the clear separation between the two divergent lines.

2.3.2. Additional Statistical Methods

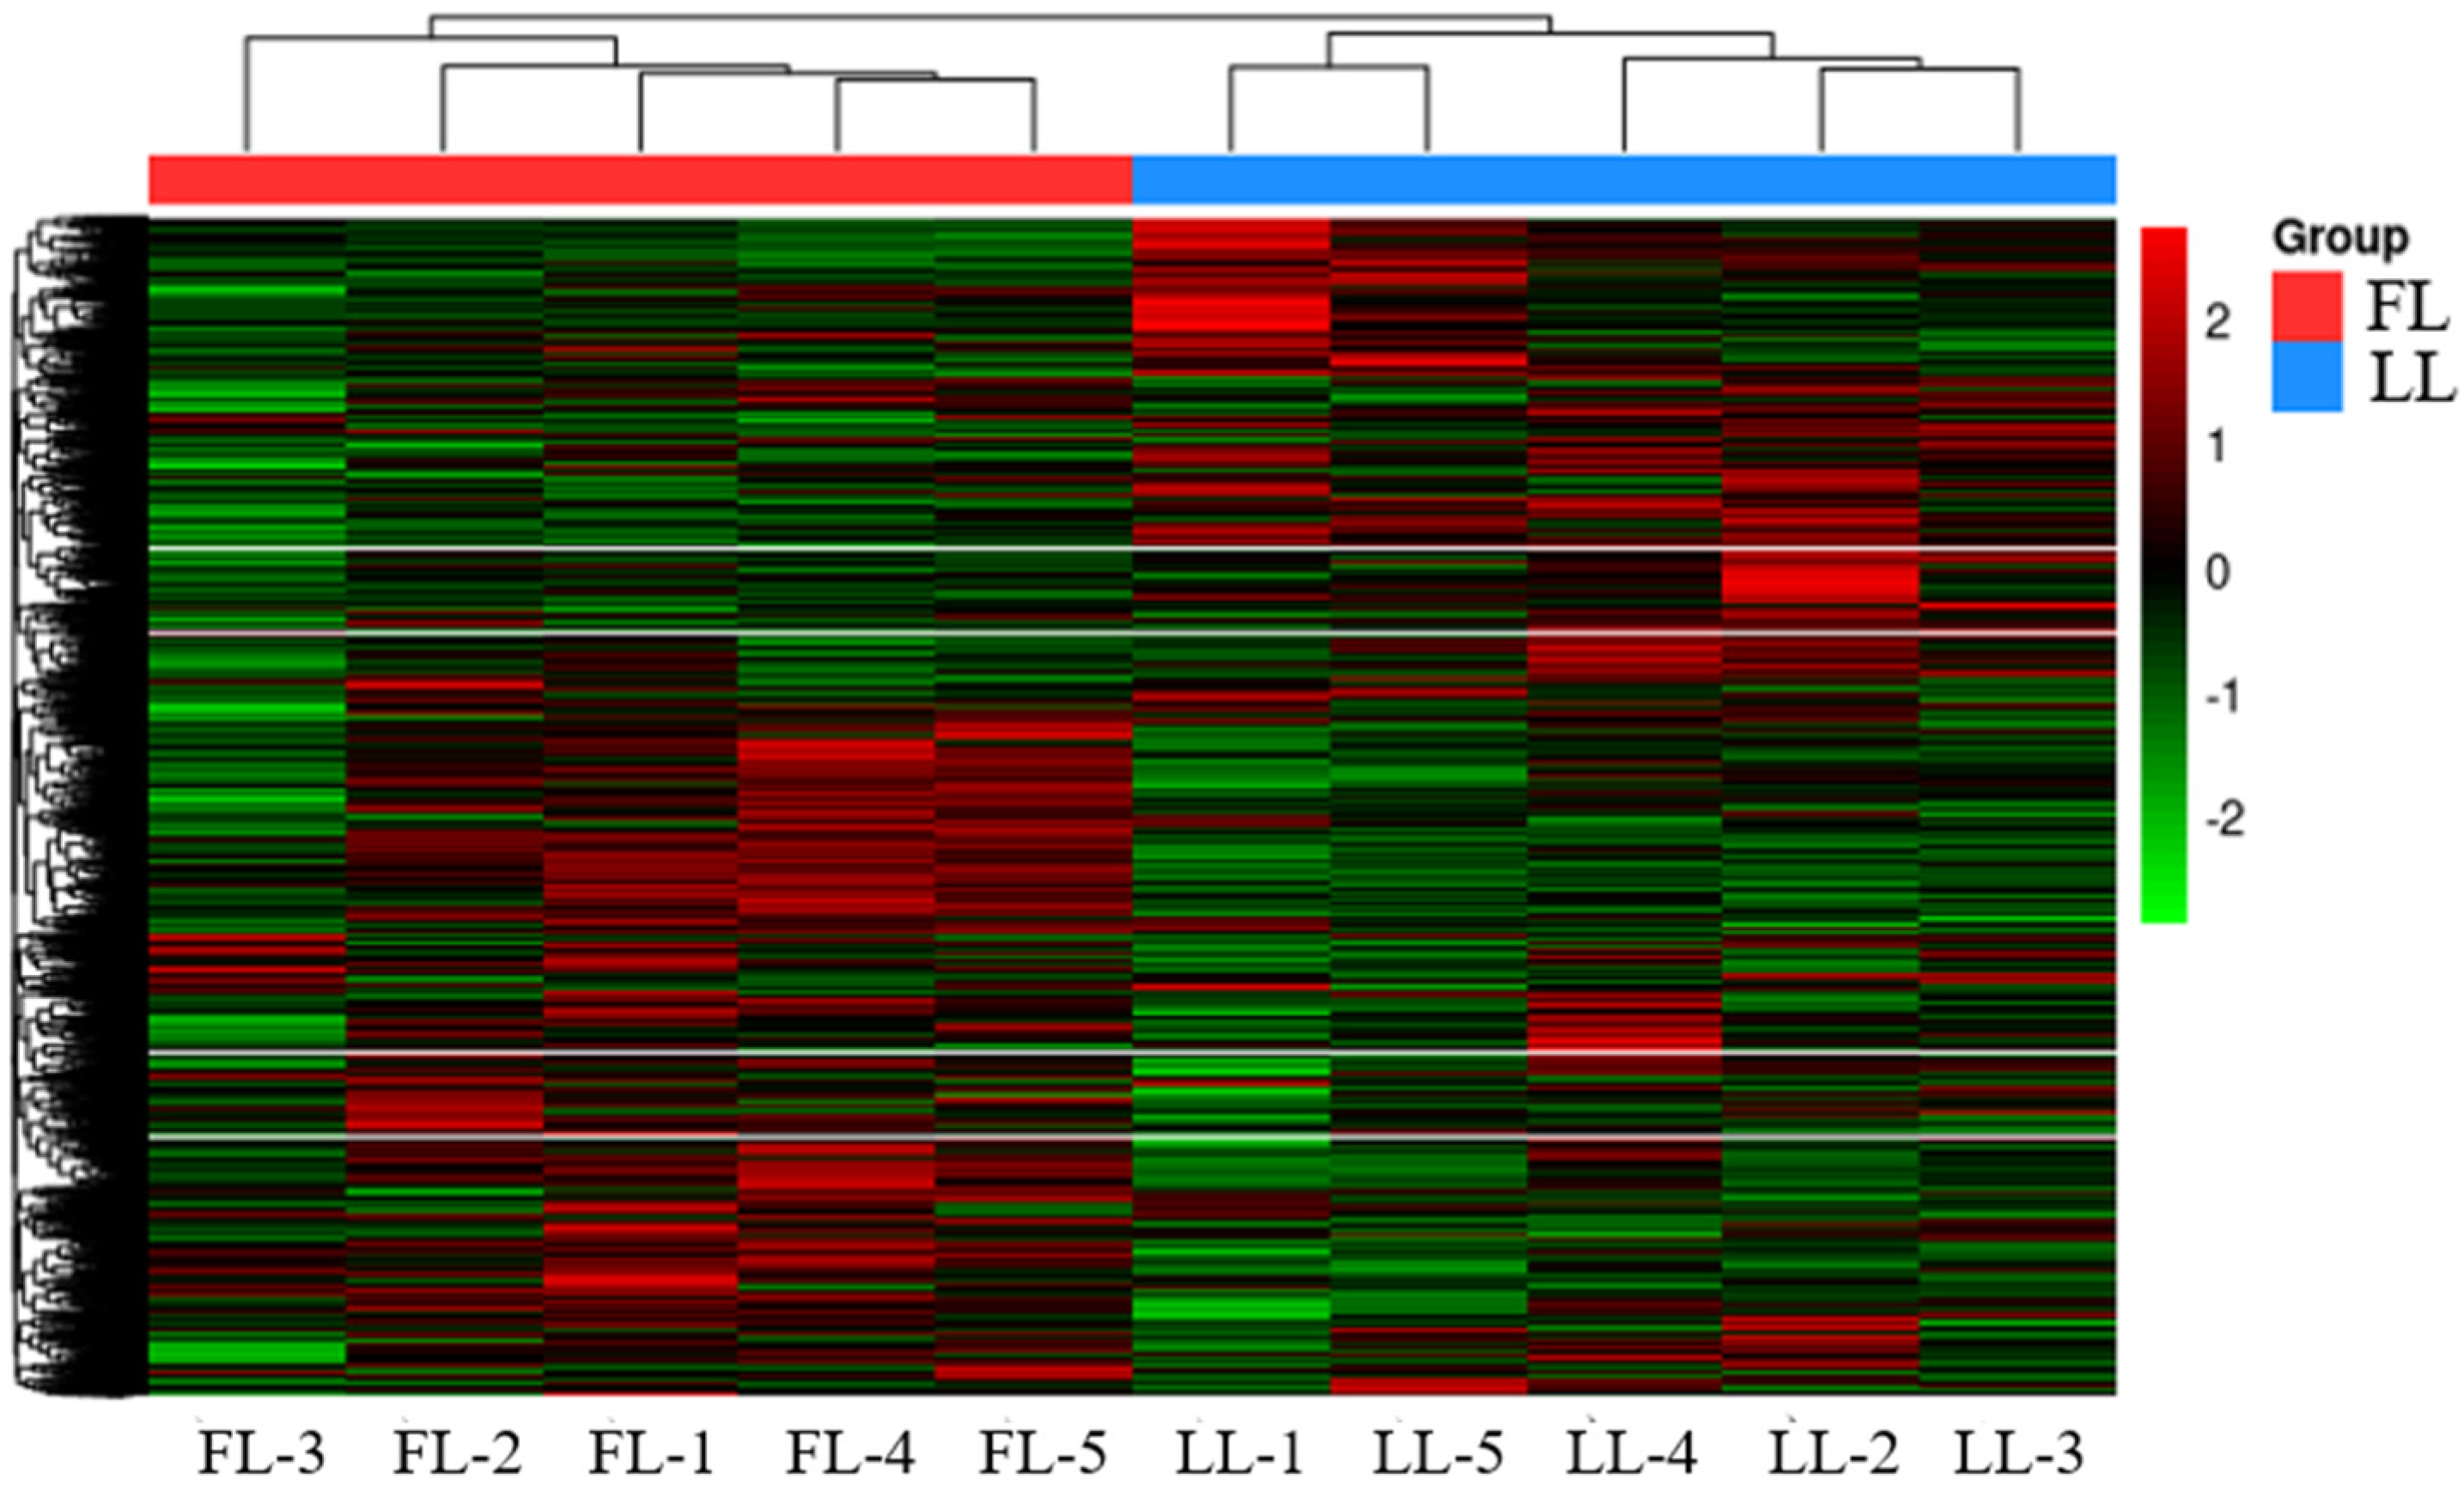
Multiple statistical approaches were employed to ensure the accuracy and reliability of the analytical results. For GWAS, the Bonferroni method was applied for multiple testing correction to control the false discovery rate. Chi-square tests were used to analyze allele frequency differences between high-fat and low-fat broiler lines, assessing the degree of population differentiation at SNP loci. For comparison of continuous variables between groups, appropriate statistical tests were selected based on data distribution characteristics: Student’s t-tests were applied for normally distributed data, while Mann–Whitney U tests were used for non-normally distributed data. Additionally, hierarchical clustering analysis of gene expression patterns was performed using the R(v4.2.0) package pheatmap to identify gene clusters with similar expression profiles and validate differential expression patterns between high-fat and low-fat broiler lines.

3. Results

3.1. Screening Differential SNPs Between High- and Low-Fat Lines in Abdominal Adipose Tissue Based on Transcriptomic Data

In this study, raw sequencing data were first subjected to quality control using Fastp. After removing low-quality reads, reads containing ambiguous bases (N), and overly short reads, high-quality data were obtained from 10 libraries. On average, the high- and low-fat line libraries yielded 87,673,925 and 83,745,064 clean reads, respectively, with Q20 values exceeding 95% for all samples. The clean reads were then aligned to the chicken reference genome (GRCg6a) using Hisat2(v2.2.1), achieving mapping rates of 89.97–91.18%, which confirmed the reliability of the sequencing data for subsequent analyses. Furthermore, hierarchical clustering of gene expression using the R package pheatmap (Figure 2) revealed distinct gene expression patterns between high- and low-fat lines, validating the usability of the sequencing dataset.
SNP calling was performed using GATK(v4.6.1.0) on the aligned data. To reduce potential false positives, stringent filtering thresholds were applied (FS > 30.0, QD < 2.0). After filtering, a total of 3,850,758 SNPs were identified. Subsequently, allele frequencies of each SNP were calculated separately for the high- and low-fat lines, and SNPs with an absolute allele frequency difference (|ΔAF|) ≥ 0.9 were retained for further analysis. This process yielded a final set of 22,721 SNPs (Table 1).

3.2. Identification of SNPs Associated with Abdominal Fat Deposition in Broilers Based on Genome Resequencing Data

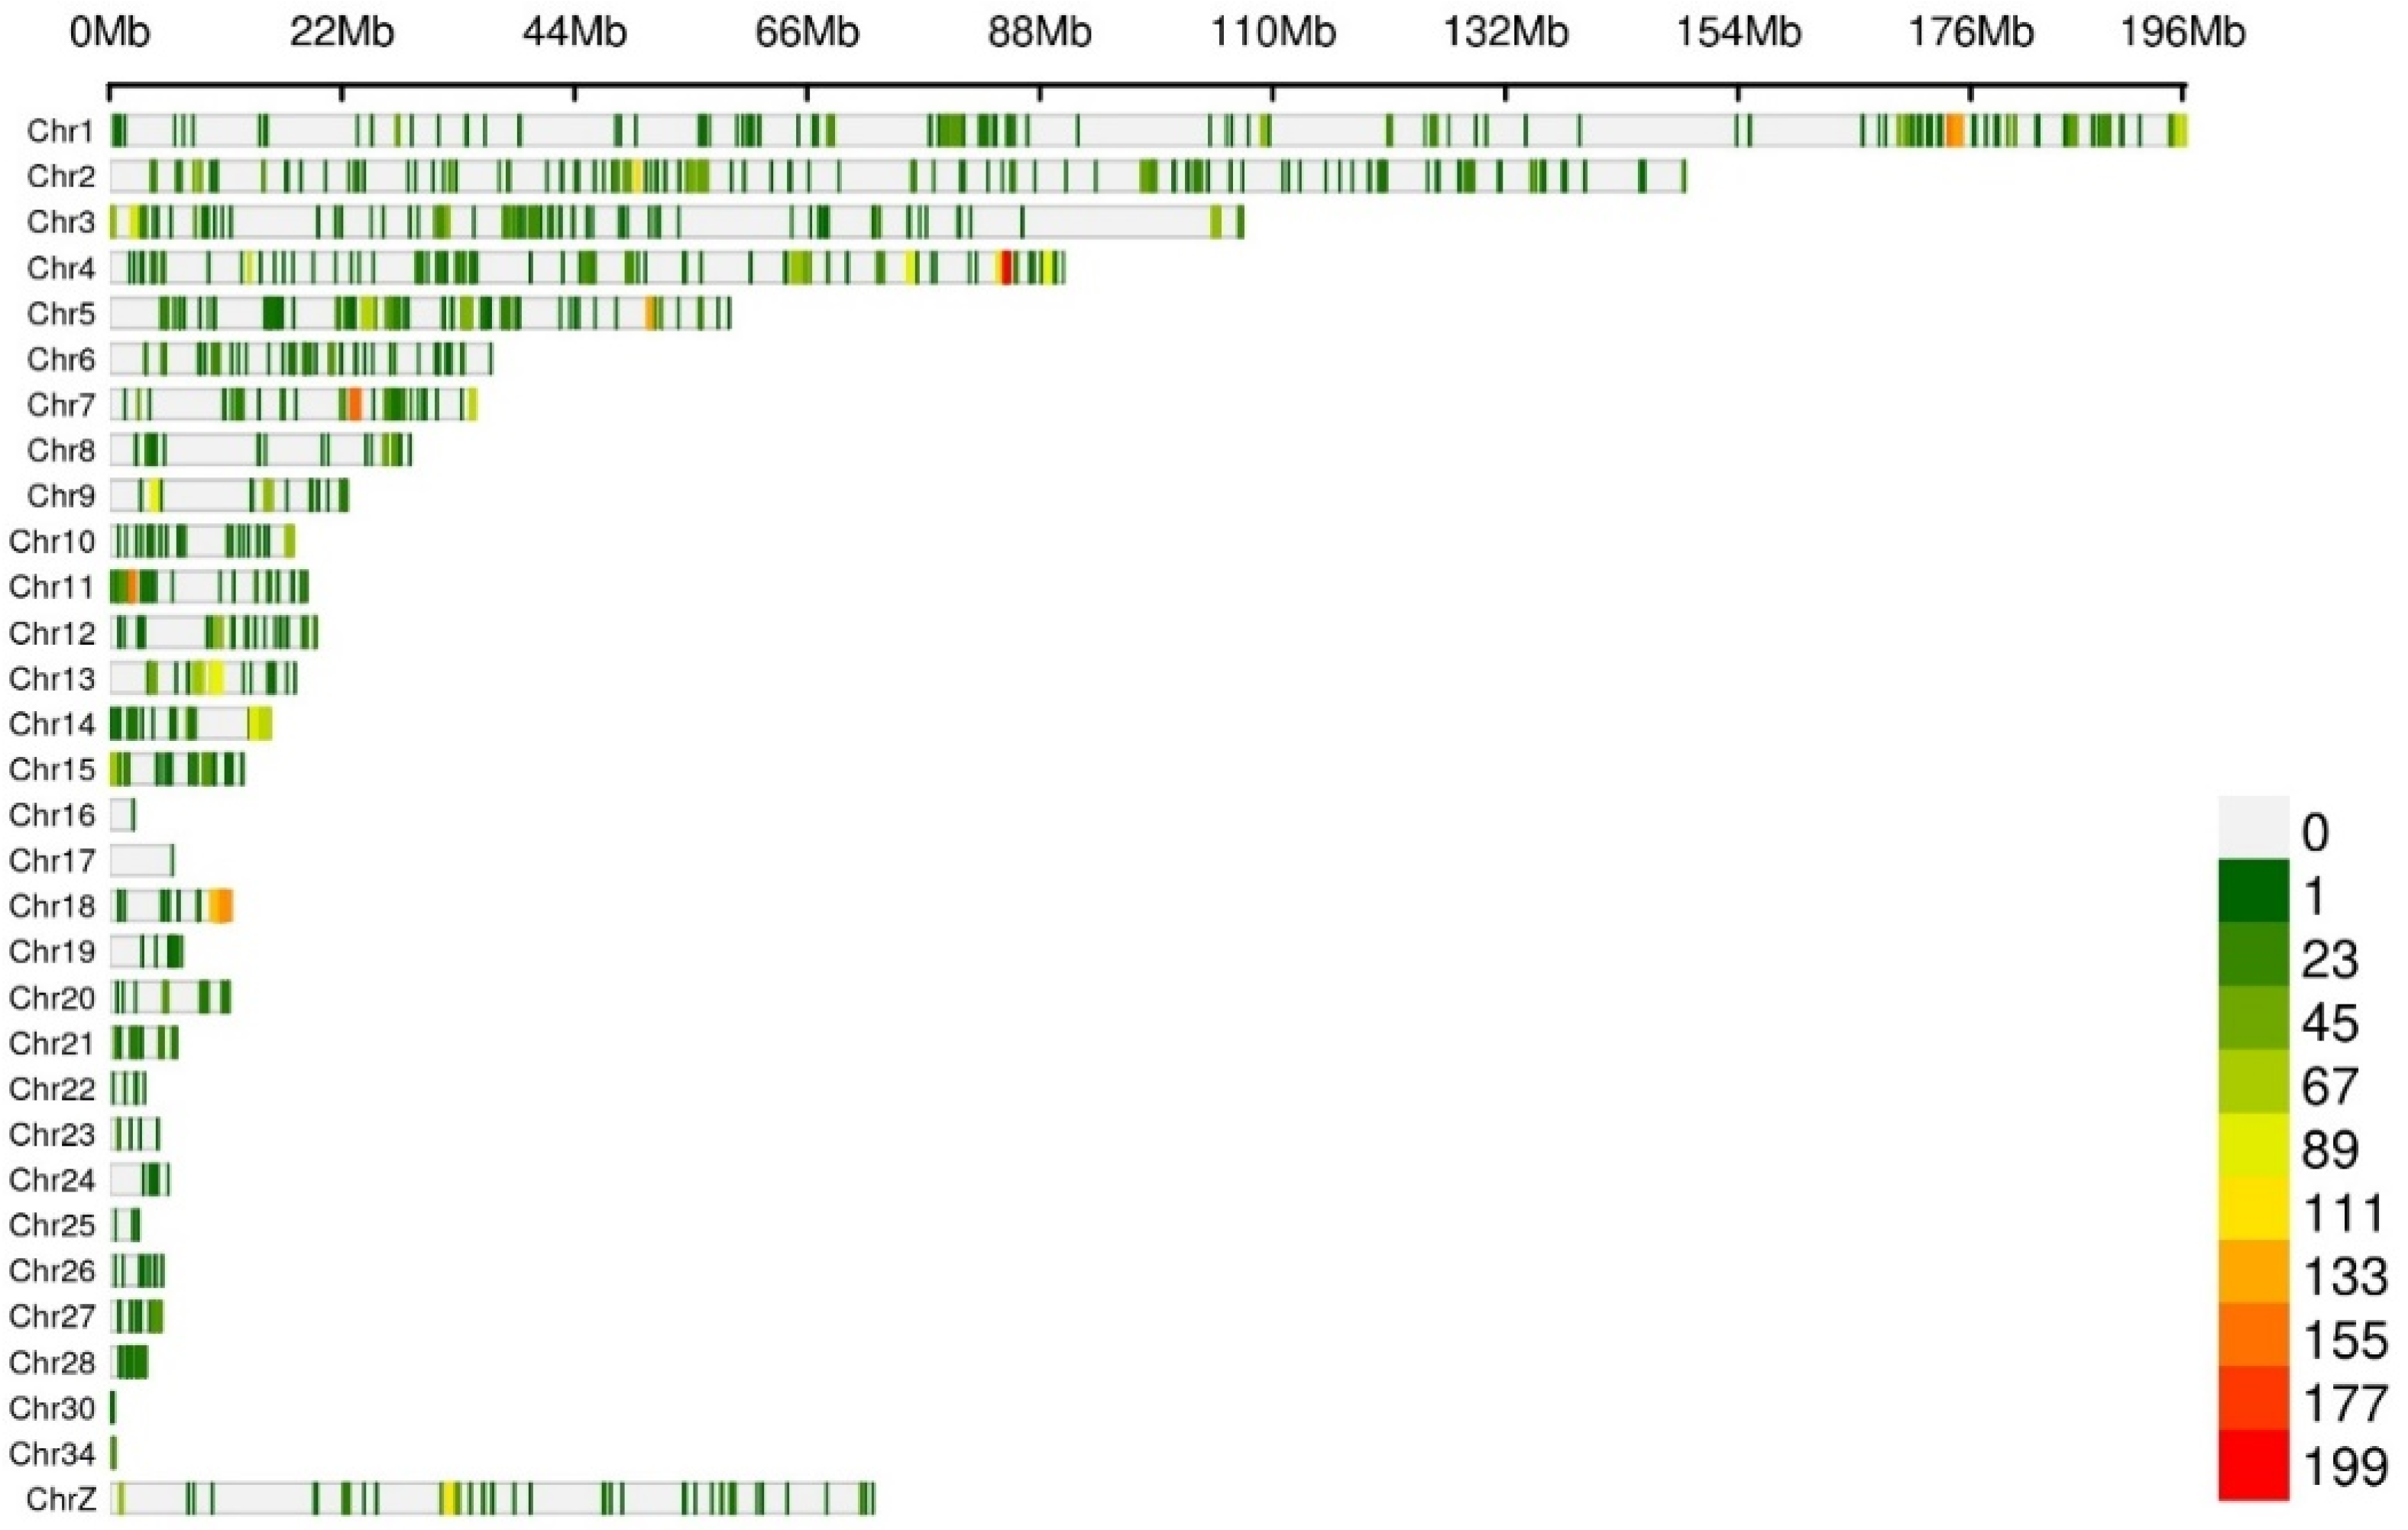
To improve the accuracy of SNP locus identification, validation was performed using resequencing data. Specifically, the 22,721 differential SNPs previously identified from transcriptome data were cross-validated against existing resequencing data comprising 330 samples from the study population. Among these, 7341 SNP loci were consistently detected in both datasets. These validated loci were therefore selected as the focus of subsequent analyses (Figure 3).

3.2.1. Allele Frequency Analysis

In this experiment, the 7341 SNPs jointly identified by transcriptome and resequencing data were subjected to principal component analysis (PCA). The results indicated that the 330 samples were clearly separated into two relatively independent clusters (Figure 4A). Subsequently, we calculated the allele frequencies of these SNPs in the high- and low-lipid lines. A total of 2281 SNPs with significant frequency differences (|Δ allele frequency| ≥ 0.7) were identified (Figure 4B).

3.2.2. Genome-Wide Association Analysis (GWAS) of Abdominal Fat Weight

In addition to allele frequency analysis, this study employed the Blink model to examine the association between the 7341 SNPs identified through resequencing and transcriptome integration and abdominal fat weight. The GWAS results revealed that 16 SNPs were significantly associated with abdominal fat weight at the genome-wide significance threshold determined by Bonferroni correction (−log10(P) > 5.16), indicating their strong correlation with this trait (Figure 5).

3.2.3. Linkage Disequilibrium (LD) Analysis

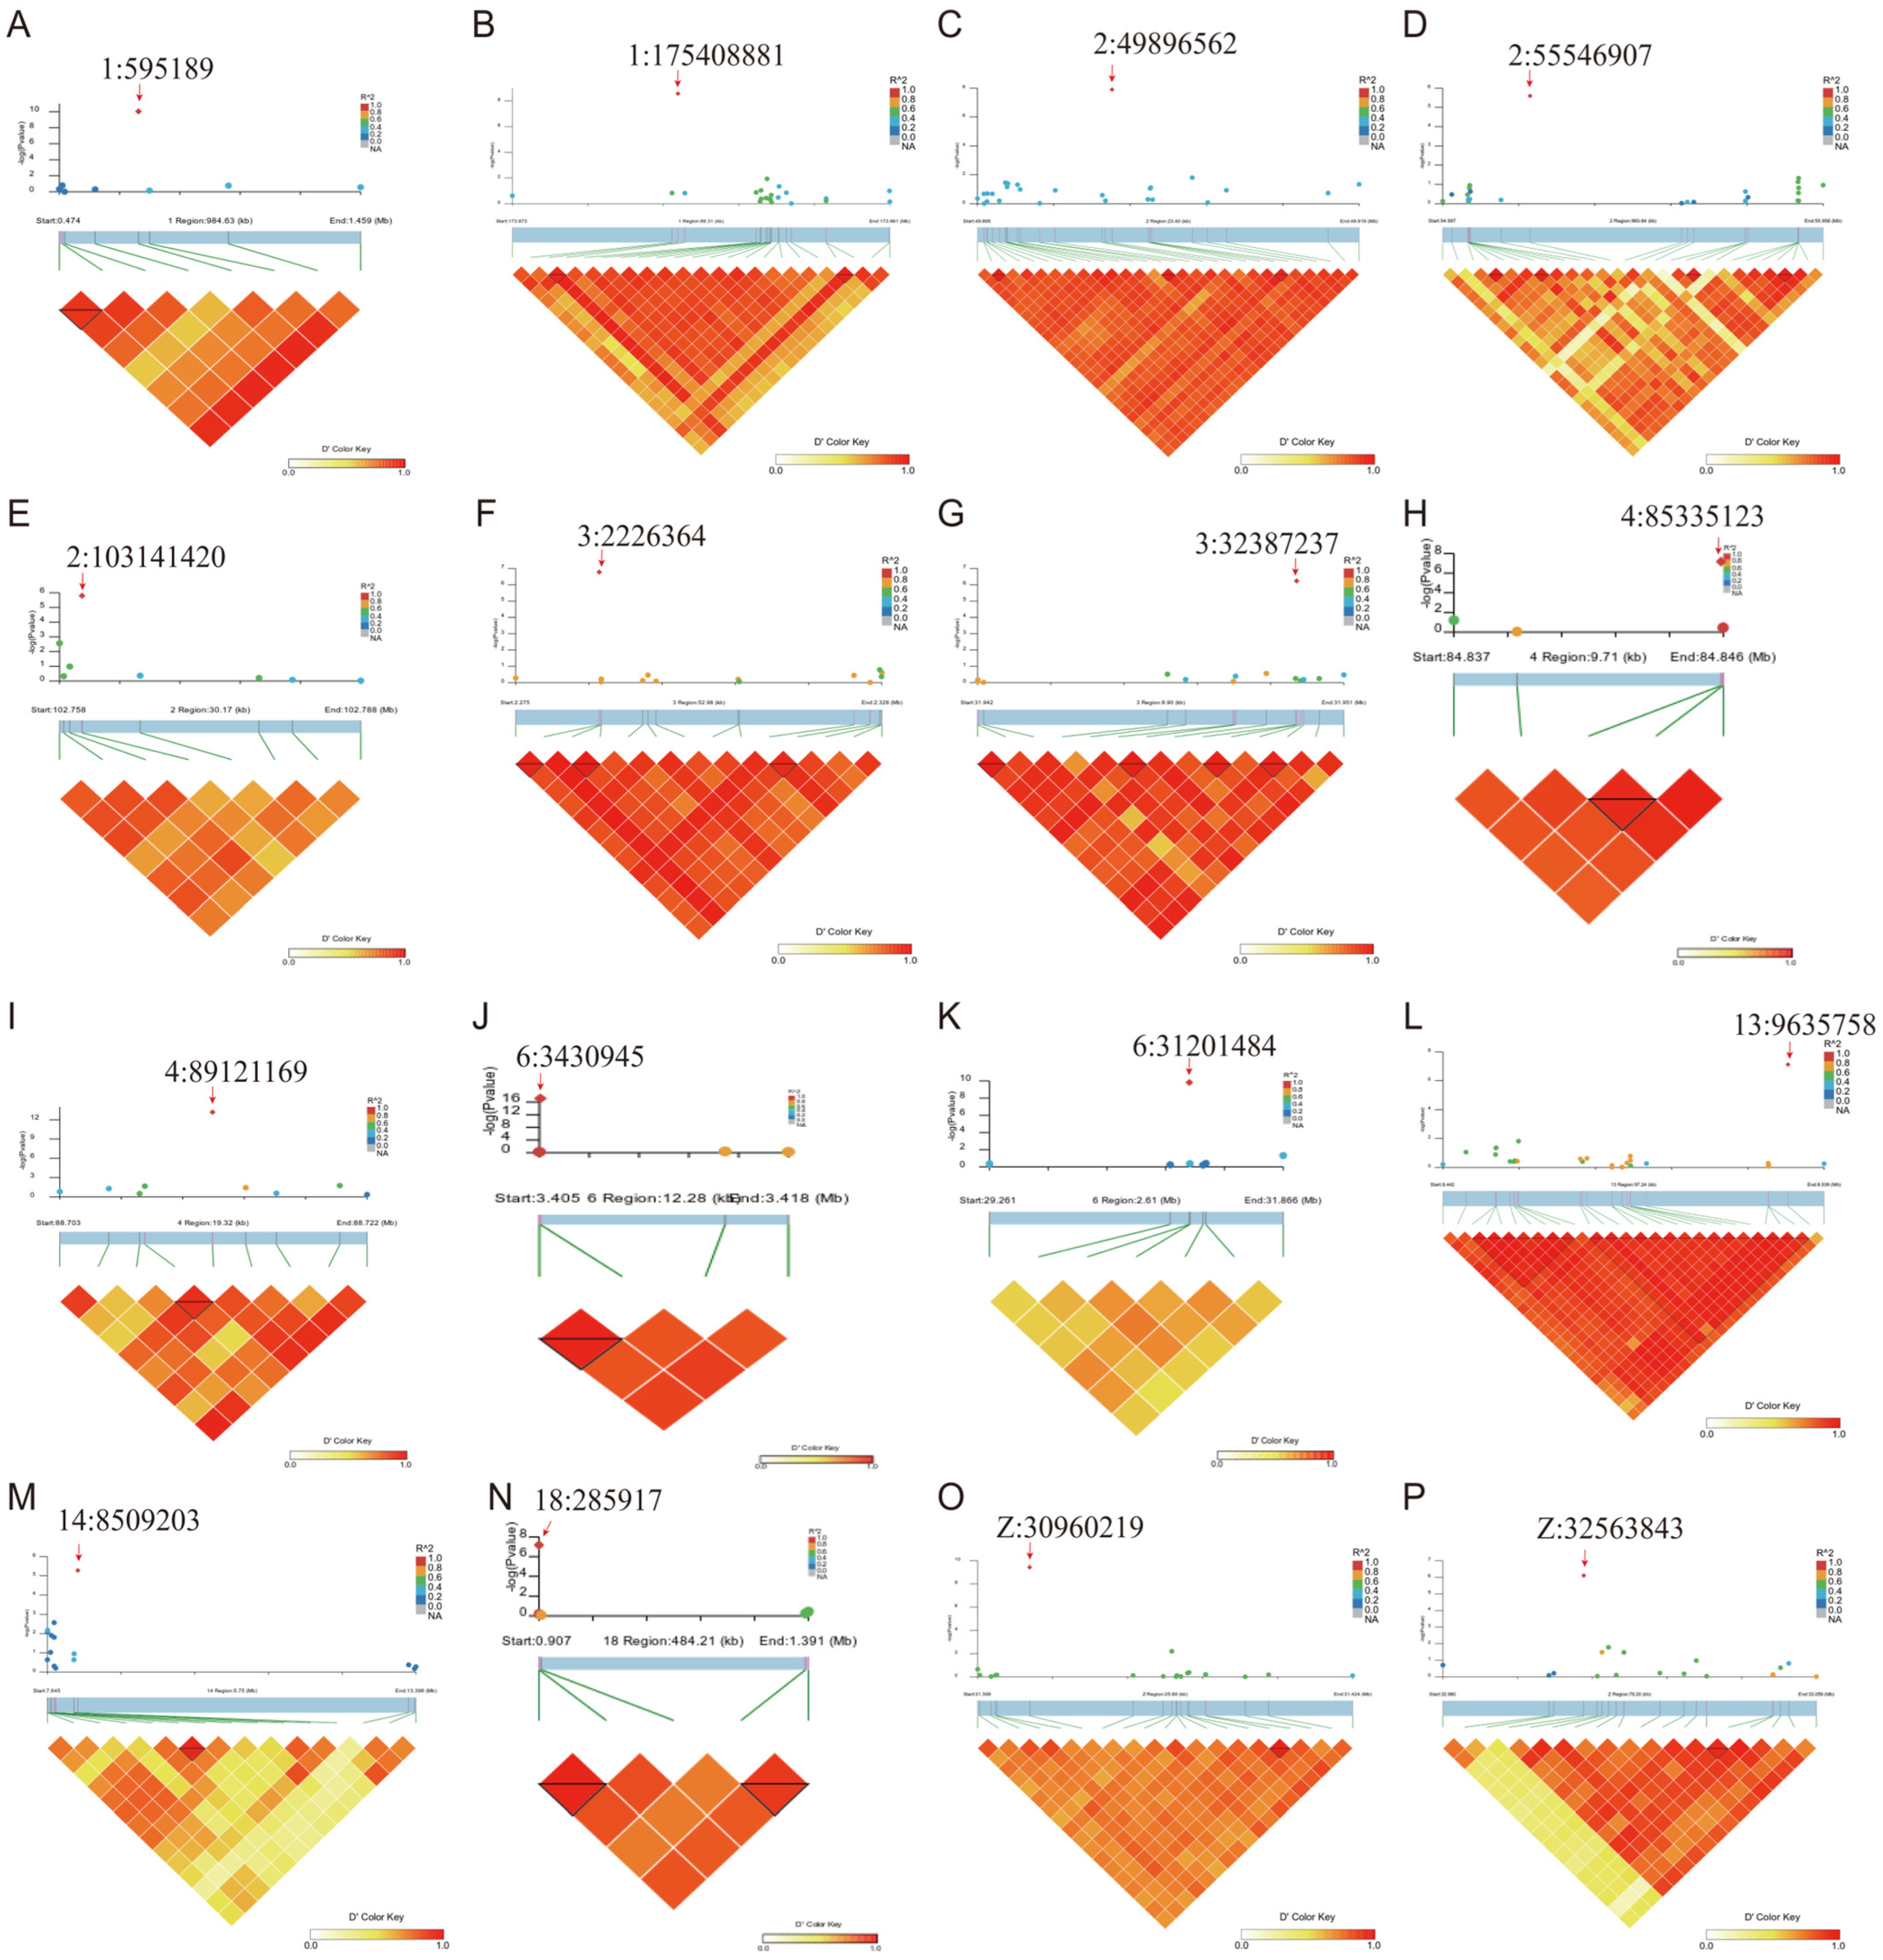
To further investigate the SNPs associated with abdominal fat weight, we conducted linkage disequilibrium (LD) analysis on the 16 SNPs identified by GWAS using LDBlockShow (v1.41). The results revealed that 8 of these SNPs were in strong LD with neighboring variants (Figure 6B,F–J,L,N). However, despite their strong linkage, these SNPs did not reach genome-wide significance in the association analysis.

3.3. Identification of Target Genes Regulated by SNPs Associated with Abdominal Fat Deposition in Broilers

3.3.1. Identification of Differentially Expressed Genes Between Abdominal Adipose Tissues of Broilers from High- and Low-Fat Lines

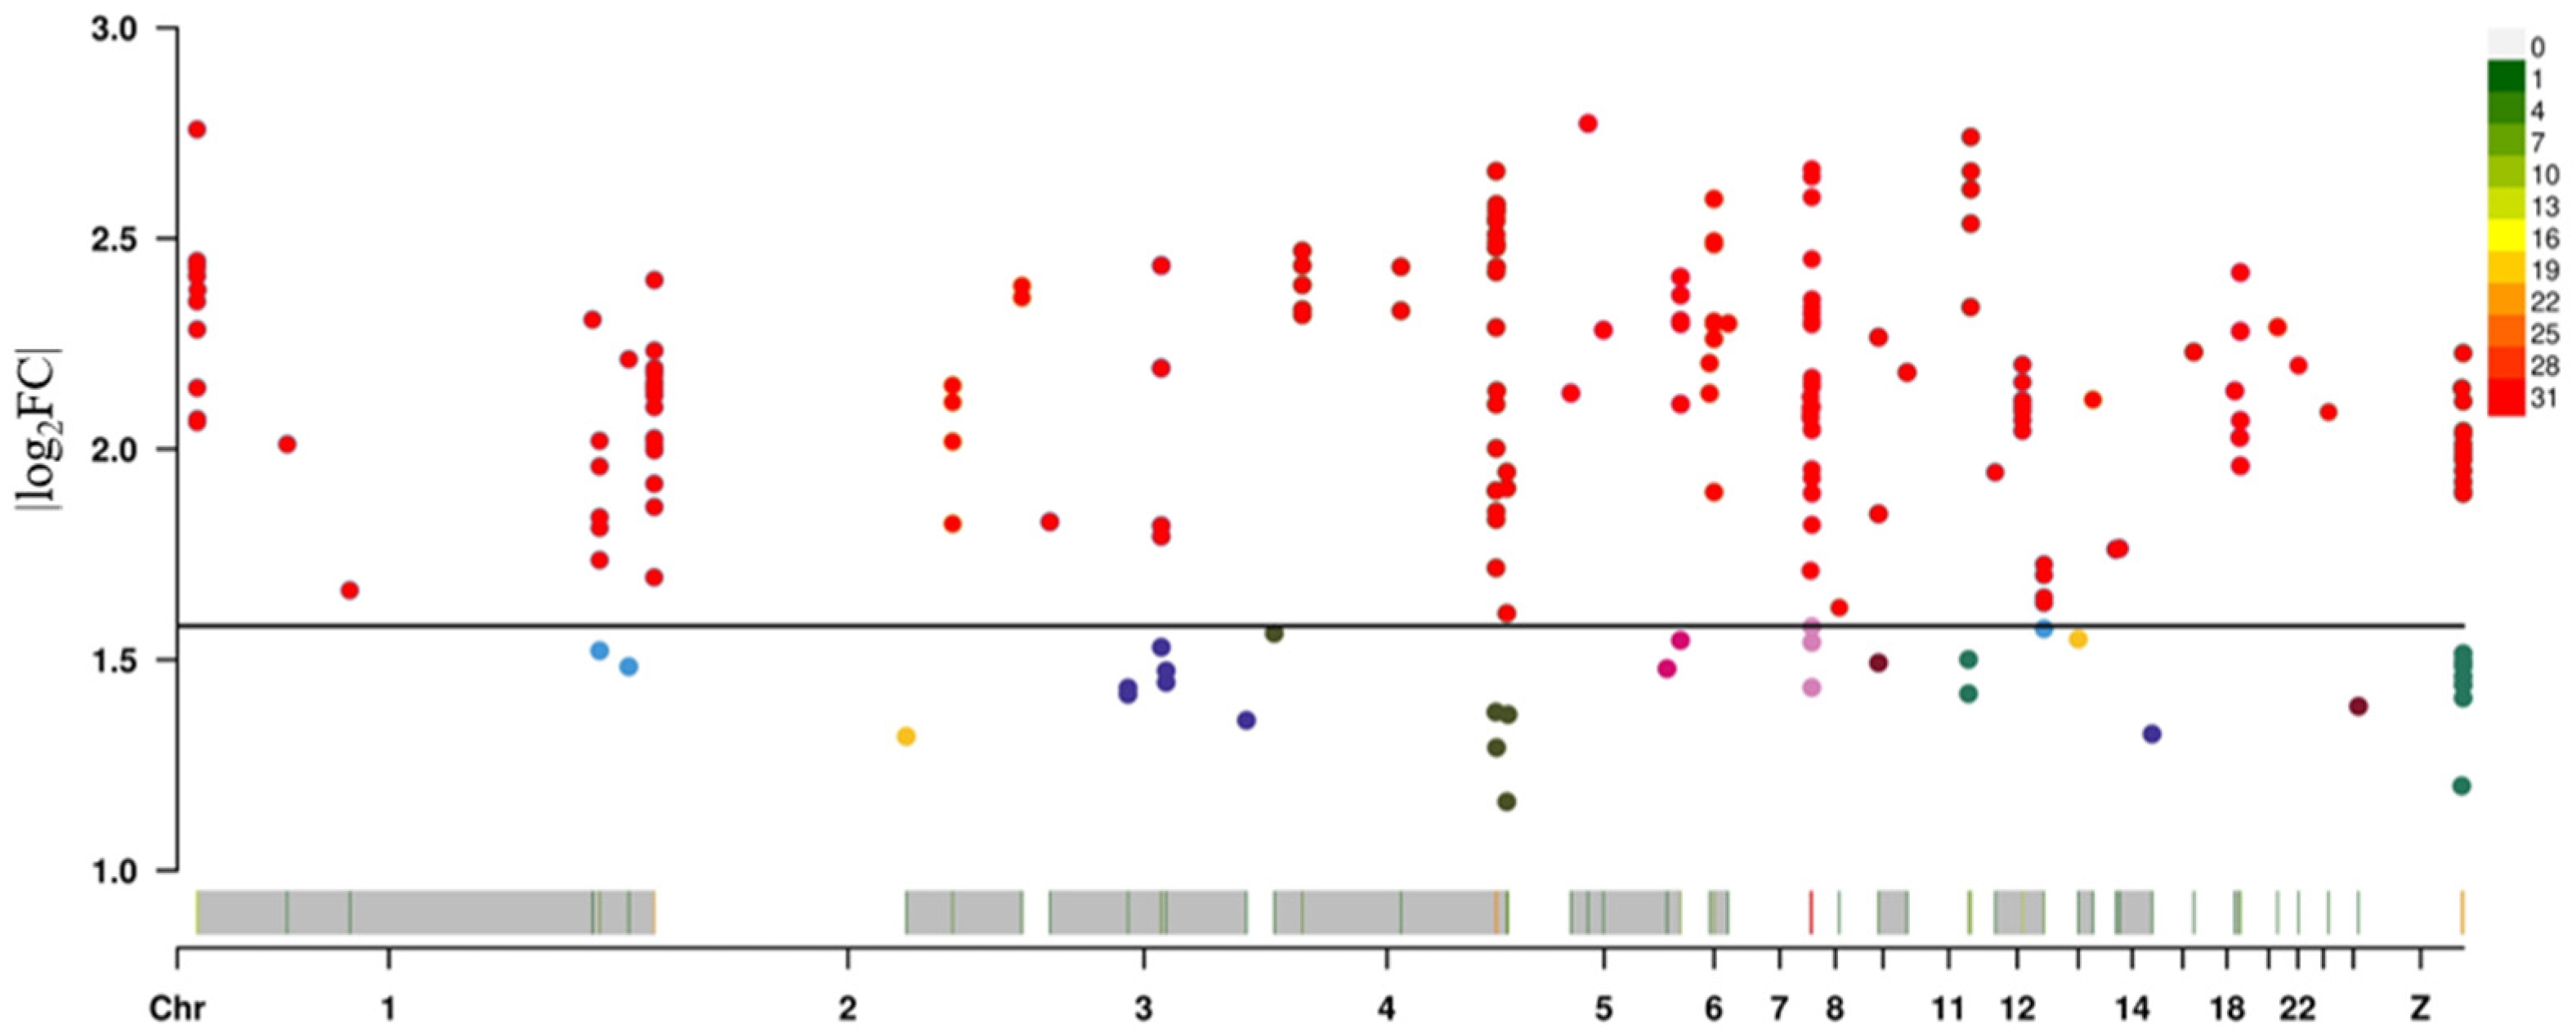
To investigate the target genes potentially regulated by SNPs associated with abdominal fat deposition in broilers, transcriptome data from abdominal adipose tissues of high- and low-fat line broilers were analyzed in this study. Gene expression abundance was first estimated using Stringtie (2.2.3), and the R package Ballgown was employed to identify differentially expressed s genes between the two lines. A total of 6475 differentially expressed genes were initially identified. Applying more stringent criteria (p ≤ 0.05 and fold change >1.5 or <0.67), 825 genes were found to be significantly differentially expressed between high- and low-fat lines (Figure 7). Further analysis showed that, relative to the high-fat line, 286 genes were up-regulated and 539 genes were down-regulated in the low-fat line.

3.3.2. SNPs Affect Broiler Abdominal Fat Deposition by Regulating Their Own Gene Expression

To investigate the relationship between SNPs associated with broiler abdominal fat deposition and gene expression, Bedtools software (v2.31.1) was used to integrate and analyze the 2302 SNPs and 825 differentially expressed genes obtained from the above analyses. The results revealed that 201 SNPs were located within 51 differentially expressed genes (Figure 8). Among these, 2 SNPs were located in upstream regions, 1 in the 5′ UTR, 186 in intronic regions, 8 in exonic regions, 3 in the 3′ UTR, and 1 in a downstream region (Supplementary Materials Table S1). It is worth noting that during the identification of differentially expressed genes, a small number of SNPs were annotated to intergenic regions because the software automatically assigned names to unannotated genes; these SNPs were discarded during the annotation process.

3.3.3. SNPs Affect Broiler Abdominal Fat Deposition Through Long-Distance Regulation of Target Gene Expression

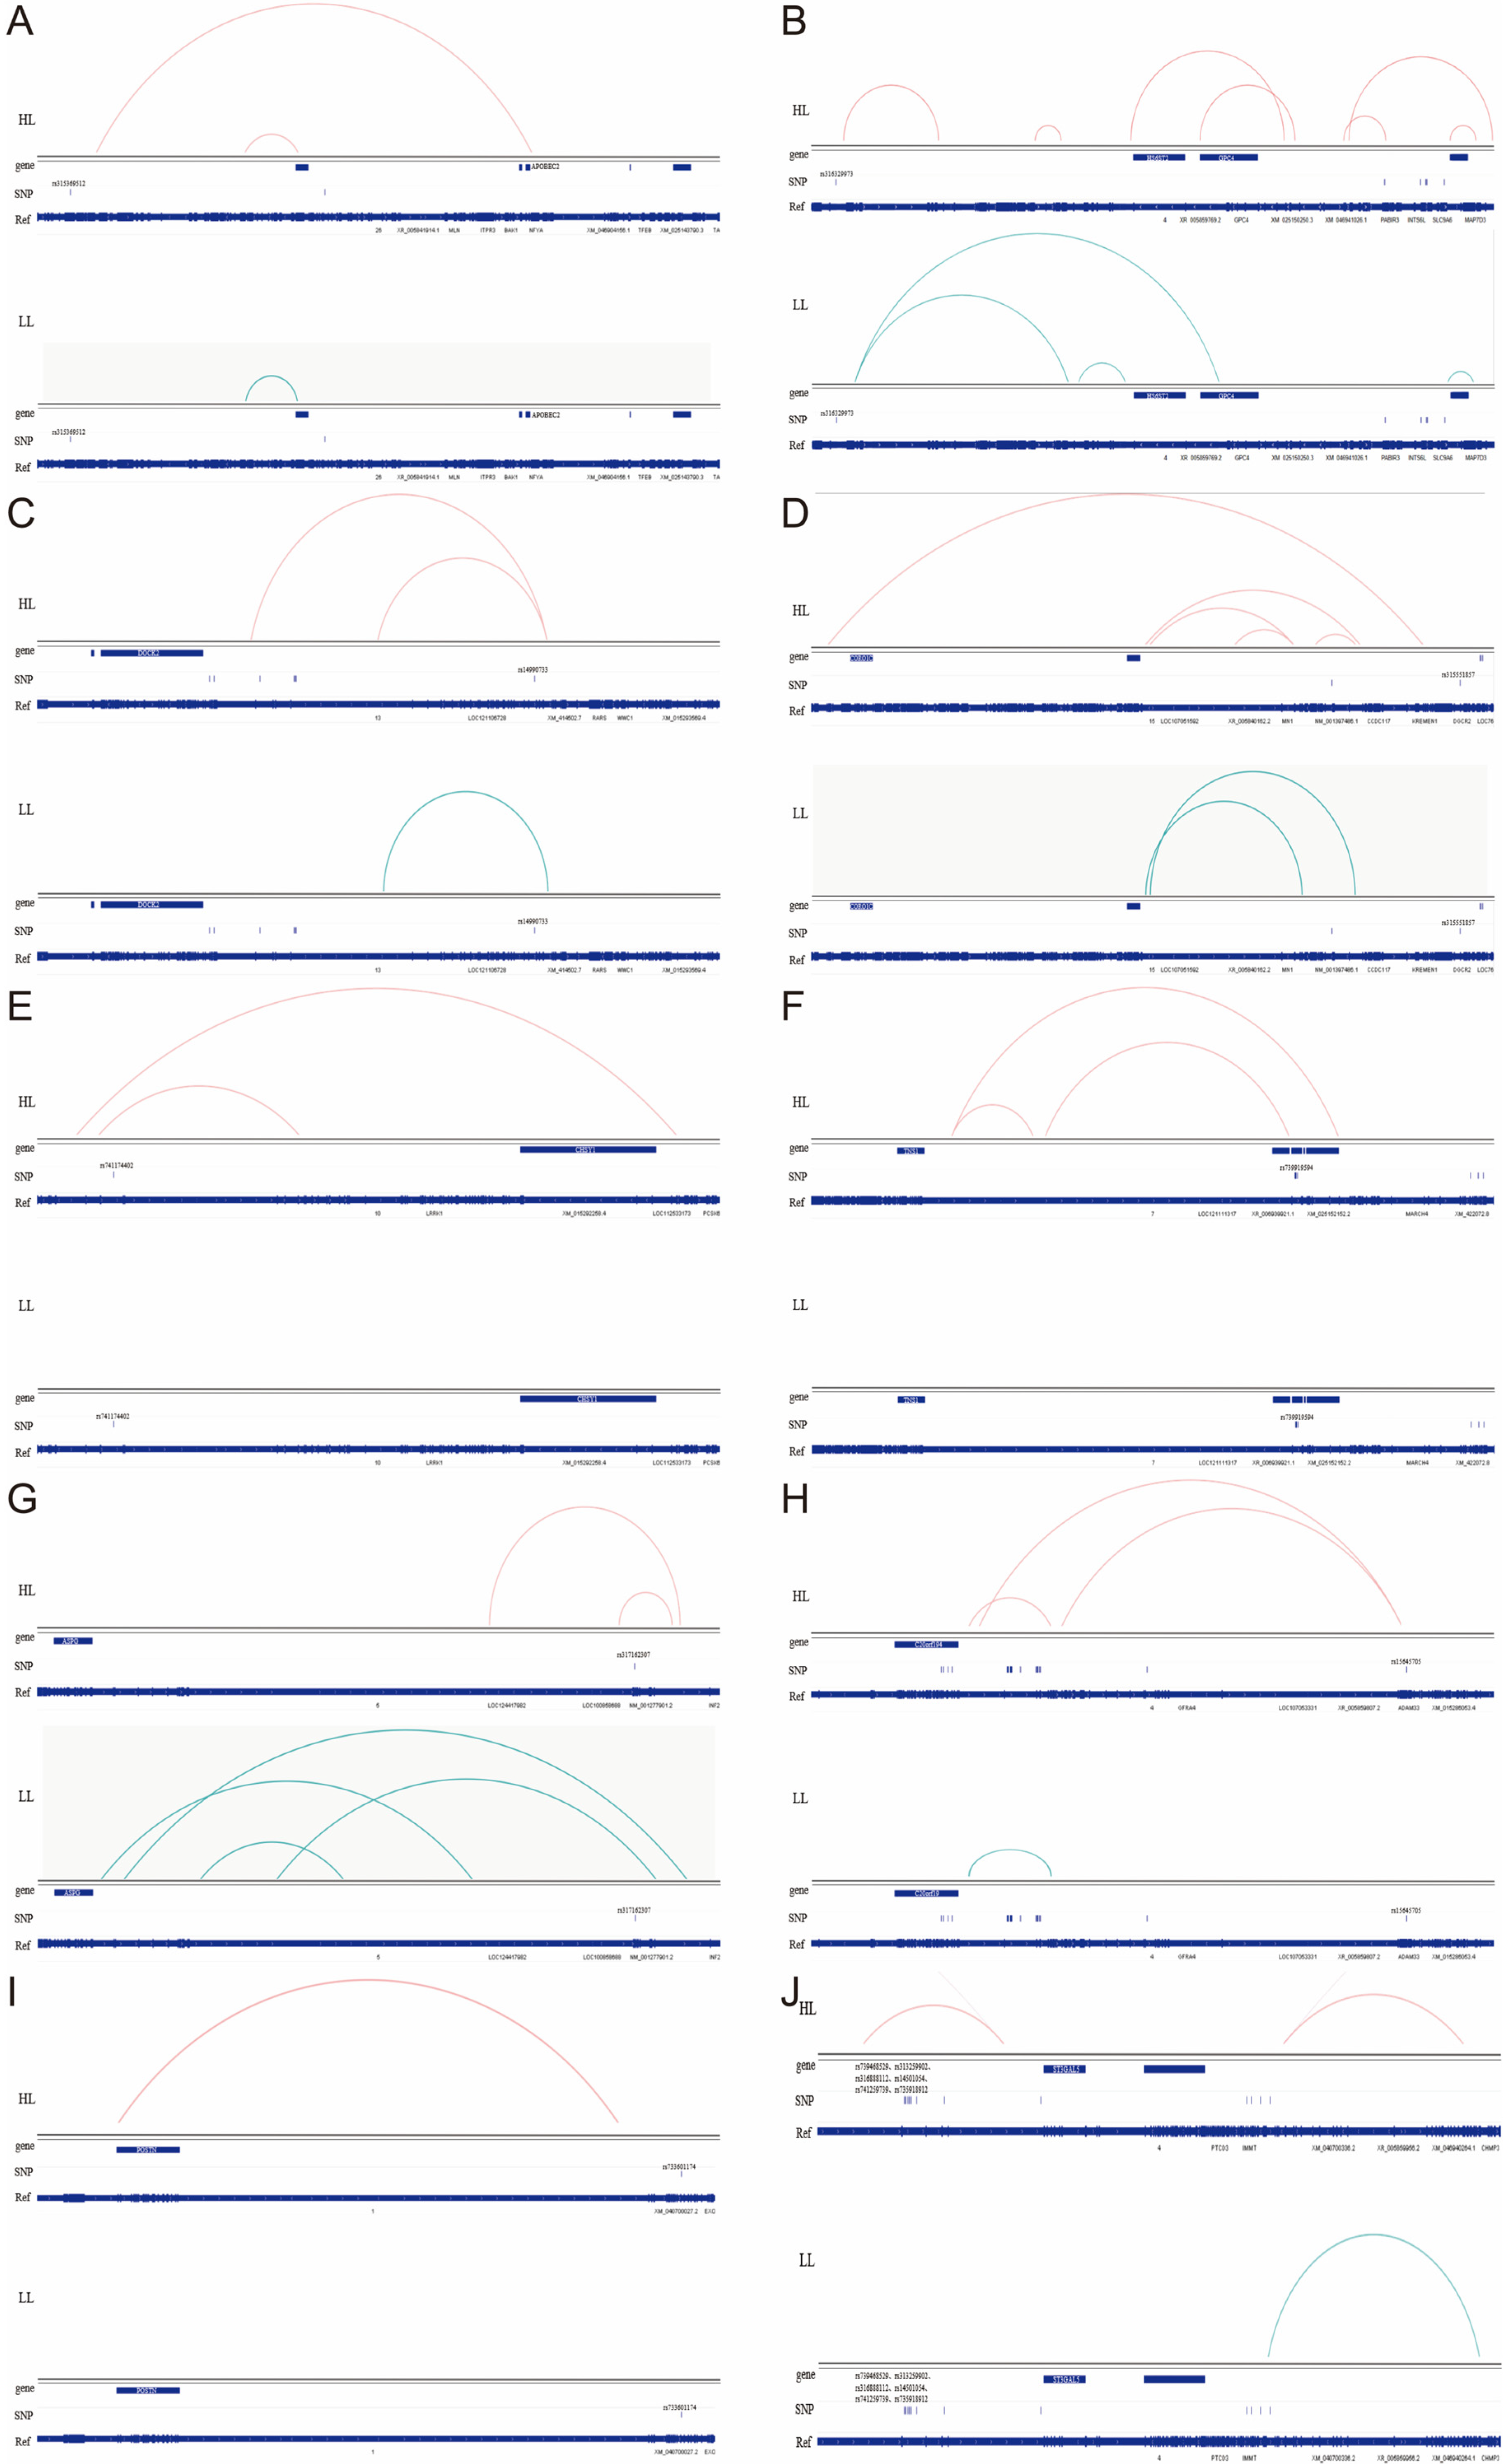
Three-dimensional genome analysis can reveal the physical interactions and spatial organization between different genomic regions, providing insights into gene regulatory mechanisms. To investigate whether the 2302 SNPs identified above could influence abdominal fat deposition in broilers by regulating target genes at a distance, these SNPs were further analyzed in combination with the three-dimensional genome (Hi-C) data previously generated by our research group. The analysis revealed that 15 SNPs could regulate the expression of distal target genes by altering the 3D genomic structure (Table 2).

3.4. Bioinformatics Analysis of the Pathways by Which SNPs Regulate Target Gene Expression

3.4.1. SNPs Regulate Their Own Gene Expression by Altering Protein Expression

SNPs can influence the epigenetic modification of proteins and thereby regulate the expression of target genes. Further analysis revealed that, among the 201 SNPs located in differentially expressed genes, eight SNPs (rs313638395, rs315605586, rs15674853, rs316805216, rs314812968, rs15679530, rs734759241, and rs316935384) are located in the exonic regions of seven genes, including LAMA3, PAK3, STBD1, SYT15, MYO1E, NHP2, and ENGASE, with both rs316805216 and rs314812968 located in SYT15. We hypothesize that these SNPs may affect target gene expression by altering codon translation rates, mRNA secondary structure, and other related mechanisms.
Codon Translation Rate Analysis
The online tool ExpOptimizer (https://www.novoprolabs.com/tools/codon-optimization, accessed on 21 September 2025) was employed to evaluate the impact of mutations on codon translation rates. The analysis showed that the rs315605586 mutation accelerates the codon translation rate, whereas the rs15674853 and rs314812968 mutations reduce it (Table 3).
Analysis of mRNA Secondary Structure
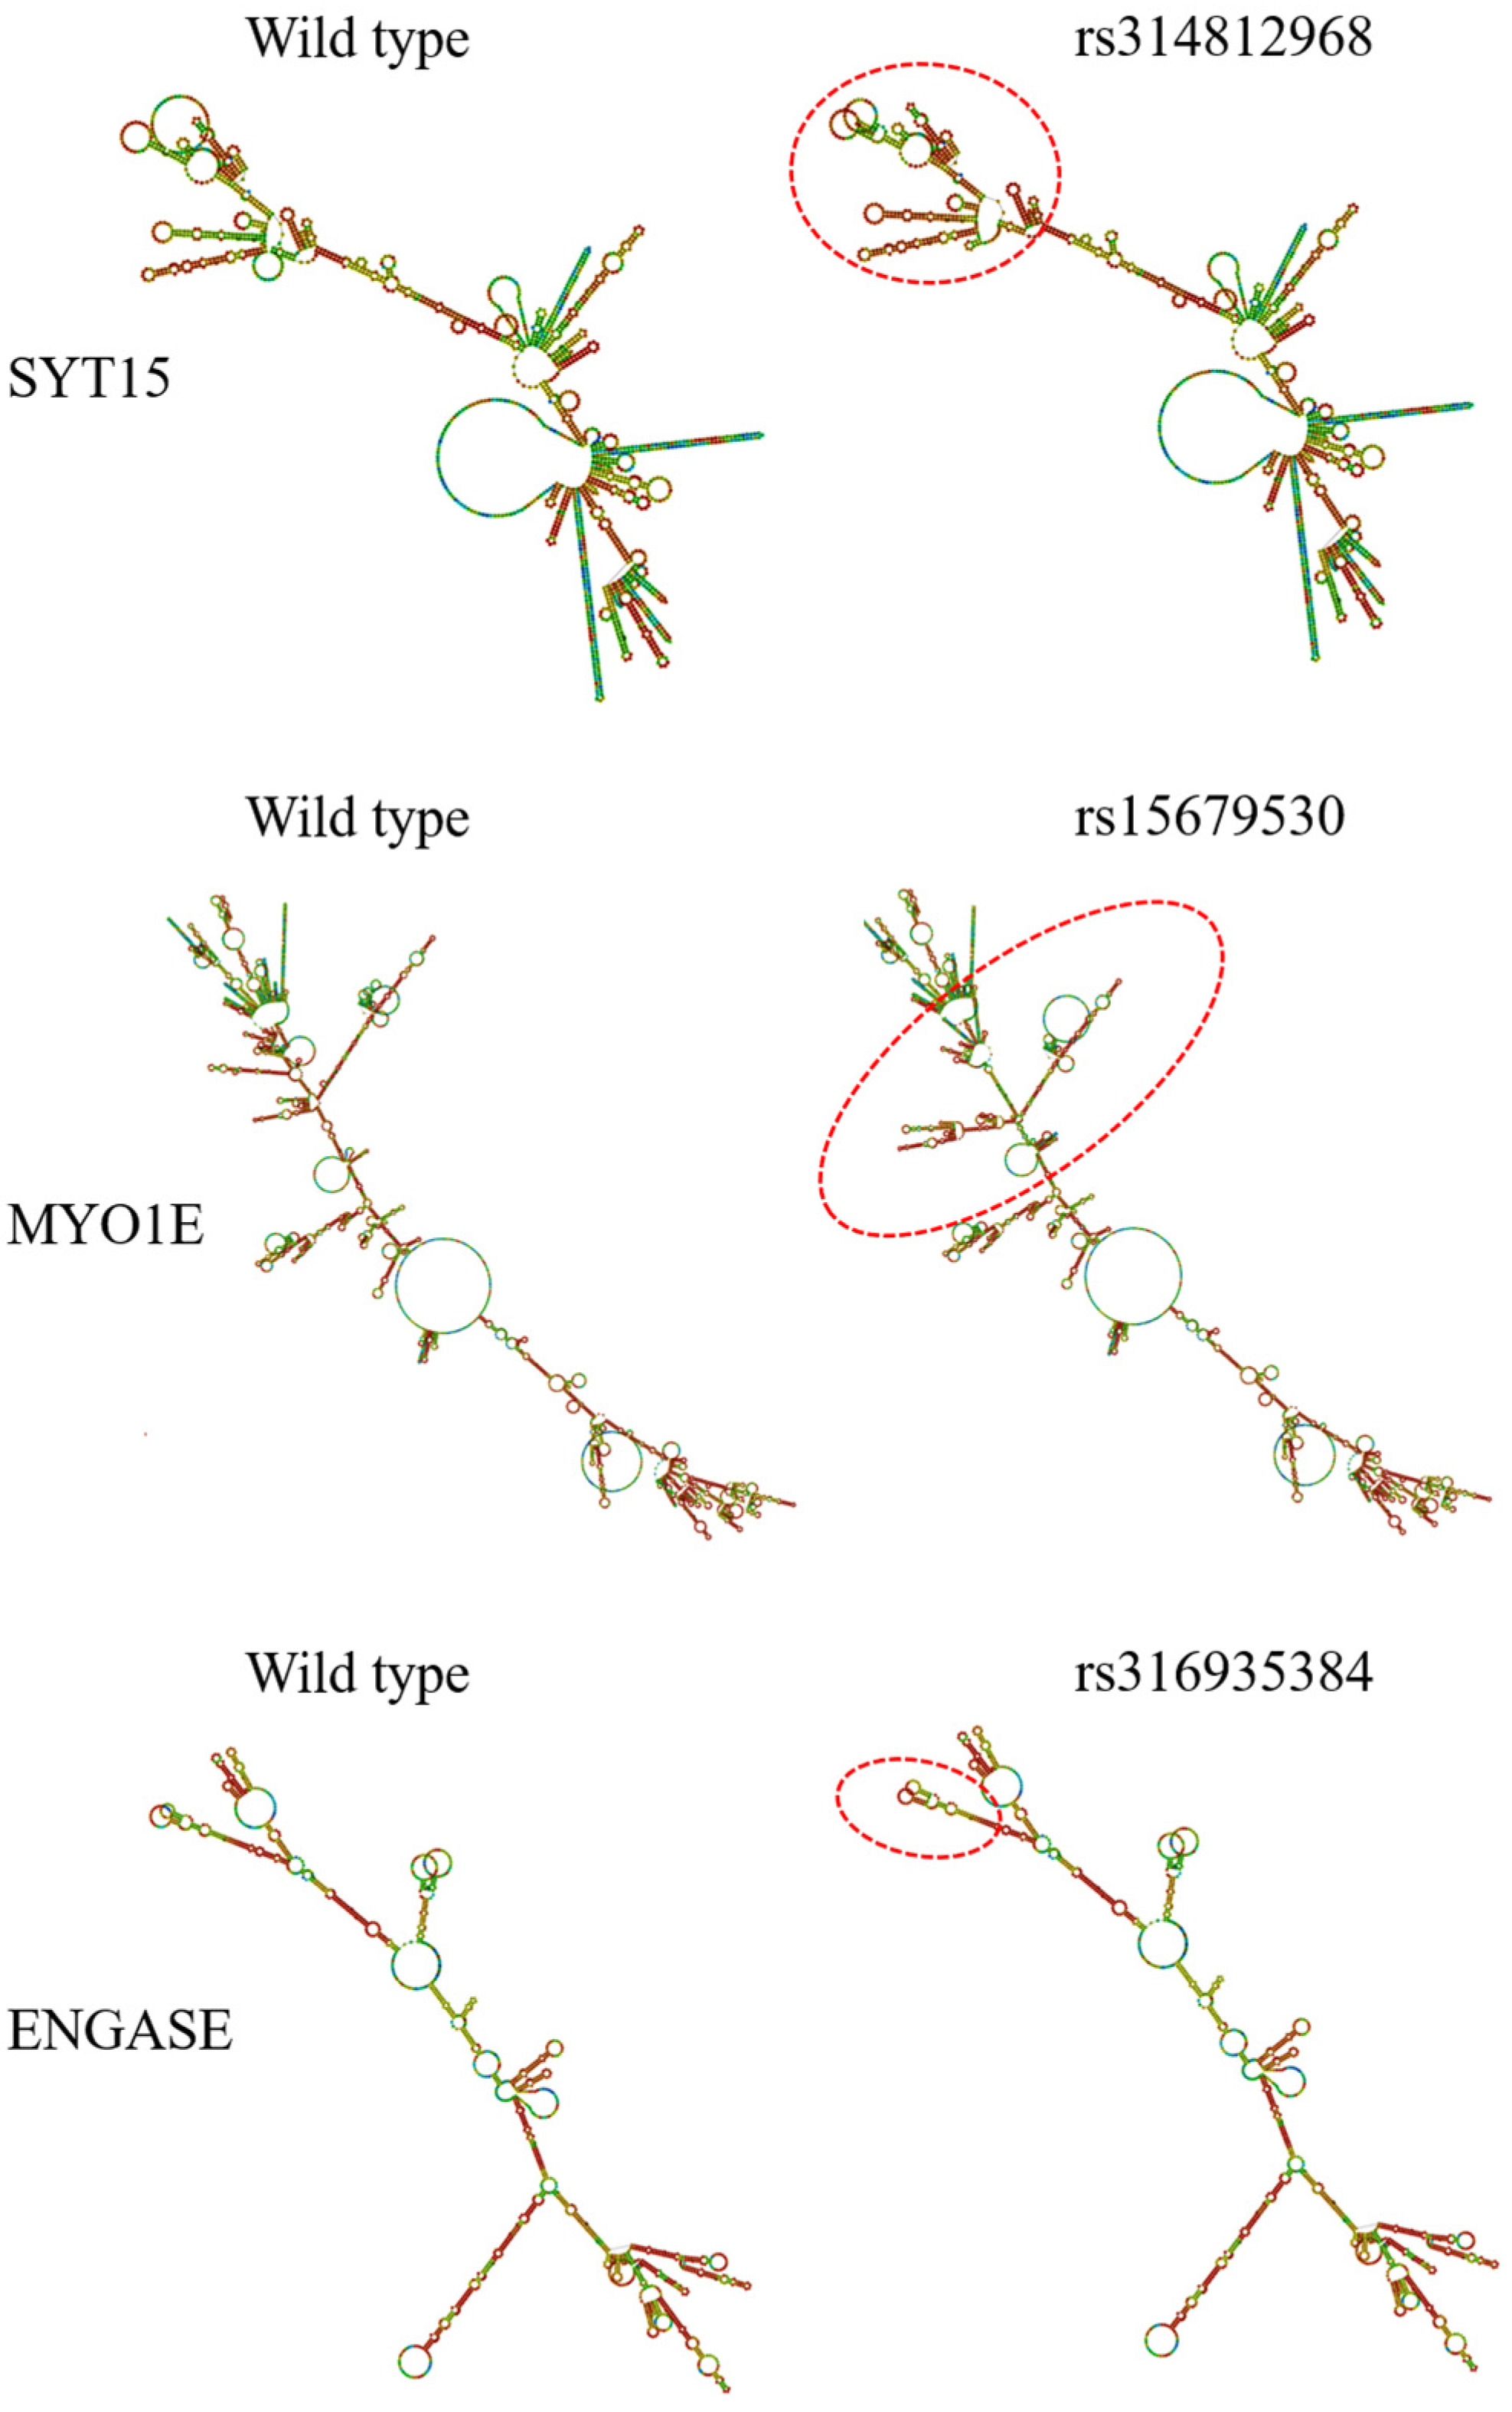
Analysis of mRNA secondary structure using the RNAfold (rna.tbi.univie.ac.at/cgi-bin/RNAWebSuite/RNAfold.cgi, accessed on 21 September 2025) tool revealed that three SNPs—rs314812968, rs15679530, and rs316935384—alter mRNA secondary structure. Specifically, the rs314812968 and rs316935384 mutations reduce the free energy of the mRNA secondary structure, with rs314812968 decreasing it from −368.47 kcal/mol to −371.30 kcal/mol and rs316935384 from −589.77 kcal/mol to −597.97 kcal/mol. In contrast, the rs15679530 mutation increases the free energy from −939.70 kcal/mol to −918.68 kcal/mol. These results indicate that the rs314812968 and rs316935384 mutations enhance the stability of mRNA secondary structure, whereas the rs15679530 mutation decreases its stability (Figure 9).

3.4.2. SNPs Regulate Their Own Gene Expression by Modulating Transcription Factor Binding Site Activity

A total of 193 SNPs located in non-coding regions of differentially expressed genes were analyzed. The results showed that 192 of these SNPs exhibited changes in transcription factor binding sites before and after mutation, as predicted by Animal TFDB (Supplementary Materials Table S2). Furthermore, TFBIND analysis indicated that all 193 SNPs caused alterations in transcription factor binding affinities (Supplementary Materials Table S3).

3.4.3. SNPs Regulate Distal Gene Expression by Modulating Transcription Factor Binding Site Activity

Fifteen SNPs located outside differentially expressed genes, which may remotely regulate the expression of these genes, were analyzed using AnimalTFDB(v4.0)and TFBIND (v3.4). The results revealed that these 15 SNPs induced changes in both transcription factor binding sites and binding affinities before and after mutation (Table 4 and Table 5). These changes may facilitate the regulation of distal gene expression by altering genomic interaction regions, thereby affecting distant enhancers or promoters (Figure 10).

3.5. Validation of the Effects of SNPs on Phenotype

The 213 SNPs associated with abdominal fat deposition in broiler chickens, identified from the analyses above, were further examined in combination with phenotypic data to validate their actual impact on the trait. The results showed that all 213 SNPs could induce more than a 2-fold change in abdominal fat weight, among which 182 SNPs could cause more than a 3-fold change (Figure 11). These findings confirm that the effects of these SNPs on abdominal fat deposition are genuine.

4. Discussion

4.1. Identification of SNP Loci Associated with Abdominal Fat Deposition in Broiler Chickens by Integrating Transcriptomic and Genomic Data

In this study, abdominal adipose tissues from broilers of high-fat and low-fat selection lines were used as experimental materials. Transcriptomic data obtained by RNA-seq were employed to identify SNP loci across the whole genome. A total of 3,850,758 SNPs were detected. Given that the two selection lines had undergone long-term divergent selection for abdominal fat and exhibited nearly a 10-fold difference in abdominal fat percentage, we hypothesized that SNP markers with allele frequency shifts between the lines may contribute to abdominal fat deposition. Therefore, allele frequency differences between the high- and low-fat lines were analyzed, resulting in the identification of 22,721 SNPs potentially associated with abdominal fat deposition. The rationale for first using transcriptome data rather than genome resequencing to screen SNPs was that transcriptome-derived SNPs can be directly linked to gene expression, thereby providing insights into their potential effects on phenotype. Jehl et al. [30] also demonstrated that SNP detection using GATK(v4.6.1.0) on chicken transcriptome data is feasible and can be applied to studies of gene expression and regulation across different tissues in humans. However, due to the relatively small sample size of transcriptome sequencing in this study, we anticipated a substantial number of false positives. To address this limitation, we further validated the identified SNPs using resequencing data from a large population of 330 broilers (160 from the low-fat line and 170 from the high-fat line). Among the 22,721 SNPs, only 7341 SNPs were confirmed in the resequencing dataset, supporting our suspicion of false positives in the transcriptome-only analysis. Thus, the 7341 SNPs identified through the combined transcriptomic and genomic resequencing approach are considered to be more reliable and were retained for subsequent analyses. The integration of transcriptomic and genomic approaches has been effectively applied in various livestock species to identify genetic variants associated with economically important traits. For example, Yang et al. [31] combined RNA-seq and whole-genome sequencing data to pinpoint SNPs influencing intramuscular fat content in pigs, while Jiang et al. [32] employed a similar strategy to investigate biological processes related to rumen function and lipid metabolism. These studies consistently show that joint analyses substantially reduce false-positive rates compared with single-platform approaches, providing strong support for our methodological framework.
Next, using genome resequencing data from 330 individuals of broilers from high- and low-fat lines, we further analyzed allele frequency differences in the 7341 candidate SNPs. The results showed that 2281 SNPs exhibited significant allele frequency differences between the two lines, suggesting that these SNPs may serve as important genetic markers influencing abdominal fat deposition. In parallel, we performed a GWAS to assess the association between the 7341 SNP polymorphisms and abdominal fat weight. This analysis identified 16 SNPs that were significantly correlated with abdominal fat weight. Subsequent linkage disequilibrium (LD) analysis revealed that an additional 22 SNPs in the surrounding genomic regions were in strong LD with these 16 SNPs. Altogether, 38 SNPs identified through GWAS and LD analysis were mapped to 16 genes, supporting the notion that abdominal fat deposition is a complex trait regulated by multiple genetic factors. Functional annotation of the 16 genes revealed that LAMA3, SH3PXD2B, and GAS7 are closely associated with adipogenesis. Specifically, LAMA3 has been shown to participate in adaptogenic differentiation, with its expression significantly downregulated during this process [33]. SH3PXD2B is implicated in lipid biosynthesis [34] and plays a role in early growth in Large White pigs [35]. Moreover, mutations in GAS7 have been reported to increase body fat levels and reduce bone mineral density in mice [36]. Taken together, these findings not only validate the reliability of our integrative approach but also suggest that the identified SNPs and their associated genes may play important roles in regulating abdominal fat deposition in broilers.

4.2. Identification of Target Genes for SNP Regulation Related to Abdominal Fat Deposition in Broiler Chickens

Combining the results of allele frequency analysis, GWAS, and LD analysis, a total of 2302 SNP markers potentially associated with abdominal fat deposition in broilers were identified. These markers may play a role in fat deposition; however, it remains unclear whether their effects on the trait are mediated through changes in gene expression. To address this question, we further utilized transcriptomic data from abdominal adipose tissues of broilers from the high- and low-fat lines to perform differential gene expression analysis, aiming to identify genes with significant expression changes related to abdominal fat deposition and to elucidate their potential regulatory roles. As a result, 825 differentially expressed genes (DEGs) were identified between the two lines. Compared with the high-fat line, 286 genes were significantly upregulated and 539 genes were significantly downregulated in the low-fat line. The criteria used for DEG screening in this study were consistent with those applied in previous studies, namely p ≤ 0.05 and fold change (FC) >1.5 or <0.67. For instance, Wang et al. [37] adopted the same criteria to identify DEGs in chicken adipose tissue, while Wu et al. [38] applied them to detect 191 differentially expressed miRNAs between liver tissues of neonatal and adult chickens. These examples demonstrate the reliability and appropriateness of the screening criteria employed in this study.
Combining the above screened 2302 SNPs that may be associated with abdominal fat deposition in broilers with 825 differentially expressed genes (DEGs) in abdominal adipose tissue of high- and low-fat line broilers, 201 SNPs were found to be located on 51 DEGs. Among these 201 SNPs, only 8 were located in the exonic regions, while the remaining SNPs were in non-coding regions, which may be explained by the fact that non-coding regions account for a large proportion of the genome and therefore harbor more mutation sites [39,40,41]. Among the 51 DEGs identified, the literature reports indicated several obesity-related genes, including NDUFS6, LAMA3, NCALD, QKI, UTRN, RNGTT, FGFRL1, PNPLA2, IGFBP5, BIN1, CDH13, PRKCD, PRKAR1B, PCYT2, SIRT7, CDS2, and NFIB. Changes in the expression of these genes may be associated with abdominal fat deposition in broilers. For example, NDUFS6 is involved in maintaining mitochondrial function and cell viability, indirectly regulating adipocyte development and functional maintenance [42]. LAMA3 is associated with adipocyte differentiation [33]. NCALD is a potential hippocampal memory correlate linked to obesity in rats [43], and Lu et al. [44] demonstrated that QKI, using mice as the experimental model, plays an important role in controlling the dynamic balance of adipose tissue metabolism. The UTRN gene is a candidate gene associated with intramuscular fat [45]. RNGTT is associated with fat deposition [46]. FGFRL1 expression may contribute to the development of obesity and its complications in humans [47]. Upregulation of PNPLA2 may represent a major compensatory event for visceral fat deposition associated with leptin [48]. Overexpression of IGFBP5 reduces the production of adipose-associated proteins and decreases intracellular lipid droplets [49]. BIN1 expression decreases in response to obesity and aging in mice [50]. CDH13 has been associated with visceral fat accumulation [51]. PRKCD may serve as a key target for obesity treatment [52]. Ji et al. [53] reported that PRKAR1B expression is regulated by endoplasmic reticulum stress and participates in lipolysis in grass carp; PCYT2 may be related to insulin resistance in humans, affecting obesity development [54]. SIRT7 regulates adipogenesis in adipocytes via PPAR-γ2 deacetylation [55]. Xu et al. [56] found that CDS2 isoforms carry 3′-UTR mutations and are highly expressed in chicken adipose tissue, and the NFIB complex with MLL1 can cooperate with KDM4D to promote the expression of key lipogenic regulators [57]. All 17 of these genes are associated with adipose tissue growth and development, supporting the reliability of the results and suggesting that SNPs located in these genes may influence abdominal fat deposition in broilers, warranting further investigation. Importantly, although other genes identified in this study have not been previously reported to be associated with adipose tissue growth and development, the SNPs within these genes should not be overlooked, as their potential roles in fat metabolism may not yet have been explored. However, species-specific differences also exist. The regulatory regions and SNP effects we observed in chickens may differ from those in mammals due to differences in genomic architecture and regulatory mechanisms. For example, while PPARG is a key adipogenic transcription factor across species, the specific SNPs affecting its expression or function can vary substantially between chickens and mammals [58,59]. This highlights the importance of species-specific studies for marker-assisted selection programs.
In addition, SNP loci may not only influence traits by regulating the expression of the genes in which they reside, but may also act at a distance to modulate the expression of target genes, thereby affecting phenotypic variation. In this study, the 2302 SNPs associated with broiler fat deposition were further analyzed in combination with 3D genomic (Hi-C) data from broiler adipose tissue, resulting in the identification of 15 SNPs that may remotely regulate the expression of target genes. These SNPs potentially affect 11 genes, including POSTN, GPC4, ST3GAL5, DOCK2, CORO1C, and APOBEC2. For example, loss of POSTN attenuates adipose tissue fibrosis and improves insulin resistance [60]. GPC4 expression is significantly higher in visceral fat than in subcutaneous fat, suggesting a role in adipose distribution [61]. ST3GAL5 is predominantly expressed in adipose stromal cells [62]. DOCK2 may serve as a therapeutic target for obesity-related diseases [63]. CORO1C is significantly enriched in various obesity-related pathways and GO functions [64], and APOBEC2 may promote lipid uptake and transport [65]. These findings collectively support the notion that SNPs can exert substantial effects on adipogenesis not only through local gene regulation but also via long-range regulation of distant target genes.

4.3. Pathways of SNPs Regulating Target Gene Expression

SNPs are abundant and scattered across different regions of the genome, which results in diverse pathways through which they can regulate gene expression [66,67,68]. In this study, SNPs were categorized according to their genomic locations into coding-region SNPs and non-coding-region SNPs to explore the mechanisms by which they influence gene expression.
For SNPs located in coding regions, they may affect gene expression by altering phosphorylation, glycosylation, protein hydrophobicity, protein secondary structure, codon translation rate, and mRNA secondary structure. Phosphorylation modifications participate in signaling and gene expression regulation during cell differentiation, influencing the cell cycle and regulating multiple metabolic pathways, including energy metabolism, glycolysis, and lipid metabolism [69]. Glycosylation modifications affect protein folding and stability, thereby influencing gene expression [70]. Protein hydrophobicity can impact protein structure, stability, and interactions with other molecules [71], while protein secondary structure, including α-helices, β-sheets, and β-turns, is crucial for protein stability, and alterations can significantly affect protein folding and function [72]. Codon translation rate can influence the speed of amino acid incorporation and protein folding, thereby modulating gene expression [73]. mRNA secondary structure affects gene expression by regulating mRNA stability, longevity, and the efficiency of transcription and translation [74].
Bioinformatics analysis of the eight coding-region SNPs revealed that they did not alter phosphorylation, glycosylation, protein hydrophobicity, or secondary structure. However, analysis of codon translation rates and mRNA secondary structure showed that the rs315605586 mutation accelerated codon translation, whereas rs15674853 and rs314812968 slowed it. Additionally, rs314812968 and rs316935384 increased mRNA secondary structure stability, while rs15679530 decreased it. Notably, rs314812968 both decreased codon translation rate and increased mRNA secondary structure stability; a highly stable mRNA structure can hinder ribosome binding, reducing translation efficiency. Although SYT15, where rs314812968 is located, has not been directly linked to adipogenesis, it has been associated with body weight, glucose tolerance, and lipid levels in rats [75]. Therefore, rs314812968 may influence abdominal fat deposition in broilers by slowing translation and reducing gene expression. SNPs in both coding and non-coding regions can also affect gene expression by altering splice site activity, including exonic, 5′, and 3′ splice sites. Changes in exonic splice sites can generate alternative protein isoforms, while alterations in 5′ or 3′ splice sites may affect mRNA stability, transport, or translation [76]. Analysis of the 201 SNPs located on differentially expressed genes revealed that none caused splice site changes, likely due to the stringent screening criteria applied.
Compared with coding-region SNPs, non-coding-region SNPs can regulate gene expression by altering transcription factor (TF) binding sites. Such alterations may change TF-DNA binding affinity [77] or modify selective TF binding across genes or promoter/enhancer regions [78], thereby influencing transcriptional activity. In this study, non-coding-region SNPs were classified into those regulating their own genes and those acting on distal genes.
Further analysis showed that among the 193 non-coding SNPs on differentially expressed genes, 192 altered TF binding sites, and all 193 led to differences in specific TF binding. Classical adipose-associated TFs, including PPARG [79], SREBP [80], CEBP [81], NFKB [82], RXR [83], AP2 [84], CREB [85], and FOXO [86], were used to validate these results. Of the 193 SNPs, 116 segregated or bound to adipose-related TFs before and after mutation, with 55 located in genes previously associated with adiposity. These findings indicate that most identified SNPs are likely relevant to abdominal fat deposition. It should be noted that only a subset of adipose-related TFs was examined, and untested TFs may also interact with these SNPs. Thus, SNPs not shown to bind adipose-related TFs may still affect abdominal fat by altering TF binding activity and modulating gene expression, leading to differential expression in adipose tissues of high- and low-fat broilers.
Moreover, the 15 SNPs identified through 3D genomic (Hi-C) analysis, which may remotely regulate target genes, also altered TF binding sites and affinities. This suggests that these SNPs may change genomic interaction regions, modifying regulatory relationships with distal enhancers or promoters and resulting in differential gene expression. This hypothesis is supported by prior studies; for instance, Santiago et al. [78] found that promoters can preferentially recruit STAT1/2 and IRF to regulate distal gene expression, Zhu et al. [87] reported that rs1440702 affects distal SOX6 expression by modifying TCF4 binding to enhancers, and Yu et al. [88] showed that rs7198799 regulates ZFP90 expression via NFATC2 binding.
In summary, SNPs that regulate target gene expression were analyzed in conjunction with phenotypic data, confirming that these SNPs have tangible effects on abdominal fat deposition in broilers and supporting the reliability of our findings. The SNP regulatory mechanisms identified in this study involve not only the effects of coding regions on translation efficiency and mRNA structural stability, but also the contributions of non-coding regions through transcription factor binding and long-range regulatory interactions. The complexity of these mechanisms suggests that abdominal fat deposition in broilers is governed by multi-layered genetic regulatory networks. Future functional validation experiments—such as CRISPR/Cas9-mediated gene editing or transcription factor binding assays—will be crucial to confirm the regulatory roles of these SNPs and facilitate their application in molecular breeding of broilers.

5. Conclusions

In this study, we screened and identified a set of key SNPs associated with abdominal fat deposition in broilers, integrating transcriptome, genome resequencing, and three-dimensional genomic data. A total of 213 SNP loci were found to be significantly related to abdominal fat deposition. These polymorphisms may influence the expression of target genes by altering codon translation efficiency, modifying the stability of mRNA secondary structures, and affecting the activity of transcription factor binding sites, thereby regulating abdominal fat accumulation in broilers.

Supplementary Materials

The following supporting information can be downloaded at: https://www.mdpi.com/article/10.3390/ani15192811/s1, Table S1: SNP located in differentially expressed genes; Table S2: Comparison of the difference in transcription factor binding sites before and after mutation; Table S3: Comparison of the difference in affinity of transcription factors before and after mutation.

Author Contributions

Conceptualization: D.D., H.C., Y.G. and H.Z.; methodology: D.D., H.C., Y.G. and H.Z.; software: H.C., Y.G., J.Z. and F.Z.; validation: D.D., H.C., F.Z. and C.C.; formal analysis: D.D.; investigation: D.D., H.C.; resources: H.Z.; data curation: D.D., H.C., Y.G., S.Y., Z.C., P.L., Y.L.; writing—original draft preparation: D.D., H.C., Y.G., P.L., Y.L.; writing—review and editing: D.D., H.C., Y.G., J.Z., C.C., S.Y., Z.C. and H.Z.; visualization: H.C.; supervision: H.Z.; project administration: H.Z.; funding acquisition: H.Z. All authors have read and agreed to the published version of the manuscript.

Funding

Please add: This research was funded by the National Key R&D Program of China (Grant No. 2021YFD1300100), the National Natural Science Foundation of China (Grant No. 32372868), the earmarked fund for CARS–41 (Grant No. CARS–41), the STI2030–Major Projects (Grant No. 2023ZD0406404), and the Natural Science Foundation of Heilongjiang Province of China (Grant No. ZL2024C015).

Institutional Review Board Statement

All experimental procedures involving animals were approved by the Northeast Agricultural University Laboratory Animal Ethics Committee (Ap-proval Code: NEAUEC20220228, Approval Date: 10 March 2022).

Informed Consent Statement

Not applicable. Broilers are from the Northeast Agricultural University.

Data Availability Statement

All data is included in this paper.

Conflicts of Interest

The authors declare no conflicts of interest.

References

  1. Yang, S.; Wang, Y.; Wang, L.; Shi, Z.; Ou, X.; Wu, D.; Zhang, X.; Hu, H.; Yuan, J.; Wang, W.; et al. RNA-Seq Reveals Differentially Expressed Genes Affecting Polyunsaturated Fatty Acids Percentage in the Huangshan Black Chicken Population. PLoS ONE 2018, 13, e0195132. [Google Scholar] [CrossRef]
  2. Leclercq, B.; Saadoun, A.J. Selecting Broilers for Low or High Abdominal Fat: Comparison of Energy Metabolism of the Lean and Fat Lines. Poult. Sci. 1982, 61, 1799–1803. [Google Scholar] [CrossRef]
  3. Lilburn, M.S.; Leach, R.M.; Buss, E.G.; Martin, R.J. The Developmental Characteristics of Two Strains of Chickens Selected for Differences in Mature Abdominal Fat Pad Size. Growth 1982, 46, 171–181. [Google Scholar]
  4. Griffin, H.D.; Whitehead, C.C. Plasma Lipoprotein Concentration as an Indicator of Fatness in Broilers: Development and Use of a Simple Assay for Plasma Very Low Density Lipoproteins. Br. Poult. Sci. 1982, 23, 307–313. [Google Scholar] [CrossRef]
  5. Whitehead, C.C.; Griffin, H.D. Development of Divergent Lines of Lean and Fat Broilers Using Plasma Very Low Density Lipoprotein Concentration as Selection Criterion: The First Three Generations. Br. Poult. Sci. 1984, 25, 573–582. [Google Scholar] [CrossRef]
  6. Sun, Y.; Liu, R.; Lu, X.; Hu, Y.; Zhao, G.; Zheng, M.; Chen, J.; Wang, H.; Wen, J. Associations of Polymorphisms in Four Candidate Genes with Carcass and/or Meat-Quality Traits in Two Meat-Type Chicken Lines. Anim. Biotechnol. 2013, 24, 53–65. [Google Scholar] [CrossRef] [PubMed]
  7. Luo, N.; Shu, J.; Yuan, X.; Jin, Y.; Cui, H.; Zhao, G.; Wen, J. Differential Regulation of Intramuscular Fat and Abdominal Fat Deposition in Chickens. BMC Genomics 2022, 23, 308. [Google Scholar] [CrossRef]
  8. Zhang, Z.; Zhong, H.; Lin, S.; Liang, L.; Ye, S.; Xu, Z.; Ji, C.; Zhang, Z.; Zhang, D.; Zhang, X. Polymorphisms of AMY1A Gene and Their Association with Growth, Carcass Traits and Feed Intake Efficiency in Chickens. Genomics 2021, 113, 583–594. [Google Scholar] [CrossRef]
  9. Cheng, B.; Zhang, H.; Liu, C.; Chen, X.; Chen, Y.; Sun, Y.; Leng, L.; Li, Y.; Luan, P.; Li, H. Functional Intronic Variant in the Retinoblastoma 1 Gene Underlies Broiler Chicken Adiposity by Altering Nuclear Factor-kB and SRY-Related HMG Box Protein 2 Binding Sites. J. Agric. Food Chem. 2019, 67, 9727–9737. [Google Scholar] [CrossRef] [PubMed]
  10. Trevisoli, P.A.; Moreira, G.C.M.; Boschiero, C.; Cesar, A.S.M.; Petrini, J.; Margarido, G.R.A.; Ledur, M.C.; Mourão, G.B.; Garrick, D.; Coutinho, L.L. A Missense Mutation in the MYBPH Gene Is Associated with Abdominal Fat Traits in Meat-Type Chickens. Front. Genet. 2021, 12, 698163. [Google Scholar] [CrossRef] [PubMed]
  11. Goswami, A.M. Structural Modeling and in Silico Analysis of Non-Synonymous Single Nucleotide Polymorphisms of Human 3β-Hydroxysteroid Dehydrogenase Type 2. Meta Gene 2015, 5, 162–172. [Google Scholar] [CrossRef] [PubMed]
  12. Dávila, S.G.; Gil, M.G.; Resino-Talaván, P.; Campo, J.L. Association between Polymorphism in the Melanocortin 1 Receptor Gene and E Locus Plumage Color Phenotype. Poult. Sci. 2014, 93, 1089–1096. [Google Scholar] [CrossRef] [PubMed]
  13. Faheem, M.; Zhang, C.J.; Morris, M.N.; Pleiss, J.; Oelschlaeger, P. Role of Synonymous Mutations in the Evolution of TEM β-Lactamase Genes. Antimicrob. Agents Chemother. 2021, 65, e00018–e00021. [Google Scholar] [CrossRef]
  14. Zhang, D.; Xia, J. Somatic Synonymous Mutations in Regulatory Elements Contribute to the Genetic Aetiology of Melanoma. BMC Med. Genomics 2020, 13, 43. [Google Scholar] [CrossRef]
  15. Li, Q.; Li, J.; Yu, C.-P.; Chang, S.; Xie, L.-L.; Wang, S. Synonymous Mutations That Regulate Translation Speed Might Play a Non-Negligible Role in Liver Cancer Development. BMC Cancer 2021, 21, 388. [Google Scholar] [CrossRef]
  16. Goddard, K.A.; Hopkins, P.J.; Hall, J.M.; Witte, J.S. Linkage Disequilibrium and Allele-Frequency Distributions for 114 Single-Nucleotide Polymorphisms in Five Populations. Am. J. Hum. Genet. 2000, 66, 216–234. [Google Scholar] [CrossRef]
  17. Orozco, G.; Schoenfelder, S.; Walker, N.; Eyre, S.; Fraser, P. 3D Genome Organization Links Non-Coding Disease-Associated Variants to Genes. Front. Cell Dev. Biol. 2022, 10, 995388. [Google Scholar] [CrossRef]
  18. Guo, L.; Sun, B.; Shang, Z.; Leng, L.; Wang, Y.; Wang, N.; Li, H. Comparison of Adipose Tissue Cellularity in Chicken Lines Divergently Selected for Fatness. Poult. Sci. 2011, 90, 2024–2034. [Google Scholar] [CrossRef]
  19. National Research Council. Nutrient Requirements of Poultry; 9th Revised Ed. The National Academies Press: Washington, DC, USA, 1994. [CrossRef]
  20. Chen, S.; Zhou, Y.; Chen, Y.; Gu, J. Fastp: An Ultra-Fast All-in-One FASTQ Preprocessor. Bioinformatics 2018, 34, i884–i890. [Google Scholar] [CrossRef]
  21. Sirén, J.; Välimäki, N.; Mäkinen, V. Indexing Graphs for Path Queries with Applications in Genome Research. IEEE/ACM Trans. Comput. Biol. Bioinformatics 2014, 11, 375–388. [Google Scholar] [CrossRef] [PubMed]
  22. Langmead, B.; Salzberg, S.L. Fast Gapped-Read Alignment with Bowtie 2. Nat. Methods 2012, 9, 357–359. [Google Scholar] [CrossRef]
  23. Kim, D.; Langmead, B.; Salzberg, S.L. HISAT: A Fast Spliced Aligner with Low Memory Requirements. Nat. Methods 2015, 12, 357–360. [Google Scholar] [CrossRef] [PubMed]
  24. Huang, M.; Liu, X.; Zhou, Y.; Summers, R.M.; Zhang, Z. BLINK: A Package for the next Level of Genome-Wide Association Studies with Both Individuals and Markers in the Millions. GigaScience 2019, 8, giy154. [Google Scholar] [CrossRef]
  25. Pertea, M.; Kim, D.; Pertea, G.M.; Leek, J.T.; Salzberg, S.L. Transcript-Level Expression Analysis of RNA-Seq Experiments with HISAT, StringTie and Ballgown. Nat. Protoc. 2016, 11, 1650–1667. [Google Scholar] [CrossRef]
  26. Blom, N.; Gammeltoft, S.; Brunak, S. Sequence and Structure-Based Prediction of Eukaryotic Protein Phosphorylation Sites. J. Mol. Biol. 1999, 294, 1351–1362. [Google Scholar] [CrossRef] [PubMed]
  27. Blom, N.; Sicheritz-Pontén, T.; Gupta, R.; Gammeltoft, S.; Brunak, S. Prediction of Post-Translational Glycosylation and Phosphorylation of Proteins from the Amino Acid Sequence. Proteomics 2004, 4, 1633–1649. [Google Scholar] [CrossRef]
  28. Gupta, R.; Brunak, S. Prediction of Glycosylation across the Human Proteome and the Correlation to Protein Function. Pac. Symp. Biocomput. 2002, 7, 310–322. [Google Scholar] [CrossRef]
  29. Tsunoda, T.; Takagi, T. Estimating Transcription Factor Bindability on DNA. Bioinformatics 1999, 15, 622–630. [Google Scholar] [CrossRef]
  30. Jehl, F.; Degalez, F.; Bernard, M.; Lecerf, F.; Lagoutte, L.; Désert, C.; Coulée, M.; Bouchez, O.; Leroux, S.; Abasht, B.; et al. RNA-Seq Data for Reliable SNP Detection and Genotype Calling: Interest for Coding Variant Characterization and Cis-Regulation Analysis by Allele-Specific Expression in Livestock Species. Front. Genet. 2021, 12, 655707. [Google Scholar] [CrossRef]
  31. Yang, M.; Zhang, R.; Liu, X.; Shi, G.; Liu, H.; Wang, L.; Hou, X.; Shi, L.; Wang, L.; Zhang, L. Integrating Genome-Wide Association Study with RNA-Seq Revealed DBI as a Good Candidate Gene for Intramuscular Fat Content in Beijing Black Pigs. Anim. Genet. 2023, 54, 24–34. [Google Scholar] [CrossRef]
  32. Jiang, Y.; Xie, M.; Chen, W.; Talbot, R.; Maddox, J.F.; Faraut, T.; Wu, C.; Muzny, D.M.; Li, Y.; Zhang, W.; et al. The Sheep Genome Illuminates Biology of the Rumen and Lipid Metabolism. Science 2014, 344, 1168–1173. [Google Scholar] [CrossRef]
  33. Ullah, M.; Sittinger, M.; Ringe, J. Extracellular Matrix of Adipogenically Differentiated Mesenchymal Stem Cells Reveals a Network of Collagen Filaments, Mostly Interwoven by Hexagonal Structural Units. Matrix Biol. J. Int. Soc. Matrix Biol. 2013, 32, 452–465. [Google Scholar] [CrossRef]
  34. Wang, Y.; Ma, C.; Sun, Y.; Li, Y.; Kang, L.; Jiang, Y. Dynamic Transcriptome and DNA Methylome Analyses on Longissimus Dorsi to Identify Genes Underlying Intramuscular Fat Content in Pigs. BMC Genomics 2017, 18, 780. [Google Scholar] [CrossRef]
  35. Cai, C.; Li, M.; Zhang, Y.; Meng, S.; Yang, Y.; Gao, P.; Guo, X.; Cao, G.; Li, B. Comparative Transcriptome Analyses of Longissimus Thoracis between Pig Breeds Differing in Muscle Characteristics. Front. Genet. 2020, 11, 526309. [Google Scholar] [CrossRef]
  36. Chao, C.C.-K.; Hung, F.-C.; Chao, J.J. Gas7 Is Required for Mesenchymal Stem Cell-Derived Bone Development. Stem Cells Int. 2013, 2013, 137010. [Google Scholar] [CrossRef] [PubMed]
  37. Wang, N.; Wang, R.; Wang, R.; Tian, Y.; Shao, C.; Jia, X.; Chen, S. The Integrated Analysis of RNA-Seq and microRNA-Seq Depicts miRNA-mRNA Networks Involved in Japanese Flounder (Paralichthys olivaceus) Albinism. PLoS ONE 2017, 12, e0181761. [Google Scholar] [CrossRef] [PubMed]
  38. Wu, S.; Guo, W.; Liang, S.; Lu, H.; Sun, W.; Ren, X.; Sun, Q.; Yang, X. Systematic Analysis of the Regulatory Roles of microRNAs in Postnatal Maturation and Metergasis of Liver of Breeder Cocks. Sci. Rep. 2018, 8, 61. [Google Scholar] [CrossRef]
  39. Xu, C.; Liu, Q.; Zhou, J.; Xie, M.; Feng, J.; Jiang, T. Quantifying Functional Impact of Non-Coding Variants with Multi-Task Bayesian Neural Network. Bioinformatics 2020, 36, 1397–1404. [Google Scholar] [CrossRef]
  40. Dominguez-Alonso, S.; Carracedo, A.; Rodriguez-Fontenla, C. The Non-Coding Genome in Autism Spectrum Disorders. Eur. J. Med. Genet. 2023, 66, 104752. [Google Scholar] [CrossRef] [PubMed]
  41. Kikutake, C.; Yoshihara, M.; Suyama, M. Pan-Cancer Analysis of Non-Coding Recurrent Mutations and Their Possible Involvement in Cancer Pathogenesis. NAR Cancer 2021, 3, zcab008. [Google Scholar] [CrossRef]
  42. Li, B.; Yang, J.; Gong, Y.; Xiao, Y.; Chen, W.; Zeng, Q.; Xu, K.; Duan, Y.; Ma, H. Effects of Age on Subcutaneous Adipose Tissue Proteins in Chinese Indigenous Ningxiang Pig by TMT-Labeled Quantitative Proteomics. J. Proteomics 2022, 265, 104650. [Google Scholar] [CrossRef]
  43. Ma, W.-W.; Ding, B.-J.; Yuan, L.-H.; Zhao, L.; Yu, H.-L.; Xi, Y.; Xiao, R. Neurocalcin-Delta: A Potential Memory-Related Factor in Hippocampus of Obese Rats Induced by High-Fat Diet. Afr. Health Sci. 2017, 17, 1211–1221. [Google Scholar] [CrossRef]
  44. Lu, H.; Ye, Z.; Zhai, Y.; Wang, L.; Liu, Y.; Wang, J.; Zhang, W.; Luo, W.; Lu, Z.; Chen, J. QKI Regulates Adipose Tissue Metabolism by Acting as a Brake on Thermogenesis and Promoting Obesity. EMBO Rep. 2020, 21, e47929. [Google Scholar] [CrossRef] [PubMed]
  45. Ding, R.; Yang, M.; Quan, J.; Li, S.; Zhuang, Z.; Zhou, S.; Zheng, E.; Hong, L.; Li, Z.; Cai, G.; et al. Single-Locus and Multi-Locus Genome-Wide Association Studies for Intramuscular Fat in Duroc Pigs. Front. Genet. 2019, 10, 619. [Google Scholar] [CrossRef]
  46. Heidaritabar, M.; Bink, M.C.A.M.; Dervishi, E.; Charagu, P.; Huisman, A.; Plastow, G.S. Genome-Wide Association Studies for Additive and Dominance Effects for Body Composition Traits in Commercial Crossbred Piétrain Pigs. J. Anim. Breed. Genet. 2023, 140, 413–430. [Google Scholar] [CrossRef] [PubMed]
  47. Minchenko, O.H.; Bashta, Y.M.; Minchenko, D.O.; Ratushna, O.O. Glucose Tolerance in Obese Men Is Associated with Dysregulation of Some Angiogenesis-Related Gene Expressions in Subcutaneous Adipose Tissue. Fiziol. Zh. 2016, 62, 12–23. [Google Scholar] [CrossRef]
  48. De la Cruz-Color, L.; Hernández-Nazará, Z.H.; Maldonado-González, M.; Navarro-Muñíz, E.; Domínguez-Rosales, J.A.; Torres-Baranda, J.R.; Ruelas-Cinco, E.D.C.; Ramírez-Meza, S.M.; Ruíz-Madrigal, B. Association of the PNPLA2, SCD1 and Leptin Expression with Fat Distribution in Liver and Adipose Tissue from Obese Subjects. Exp. Clin. Endocrinol. Diabetes. 2020, 128, 715–722. [Google Scholar] [CrossRef]
  49. Xiao, Z.; Chu, Y.; Qin, W. IGFBP5 Modulates Lipid Metabolism and Insulin Sensitivity through Activating AMPK Pathway in Non-Alcoholic Fatty Liver Disease. Life Sci. 2020, 256, 117997. [Google Scholar] [CrossRef]
  50. Vander Velden, J.W.; Osborne, D.M. Prolonged Diet-Induced Obesity Modifies DNA Methylation and Gene Expression in the Hippocampus. Neurosci. Lett. 2022, 780, 136656. [Google Scholar] [CrossRef] [PubMed]
  51. Kitamoto, A.; Kitamoto, T.; Nakamura, T.; Matsuo, T.; Nakata, Y.; Hyogo, H.; Ochi, H.; Kamohara, S.; Miyatake, N.; Kotani, K.; et al. CDH13 Polymorphisms Are Associated with Adiponectin Levels and Metabolic Syndrome Traits Independently of Visceral Fat Mass. J. Atheroscler. Thromb. 2016, 23, 309–319. [Google Scholar] [CrossRef]
  52. Zhang, Q.-H.; Cui, X.-Y.; Wang, D.; Jin, Y.; Guan, Y.-X. Anti-Obesity Effect of Escin: A Study on High-Fat Diet-Induced Obese Mice. Eur. Rev. Med. Pharmacol. Sci. 2022, 26, 7797–7812. [Google Scholar] [CrossRef]
  53. Ji, S.; Sun, J.; Bian, C.; Huang, X.; Chang, Z.; Yang, M.; Lu, R.-H.; Ji, H. cAMP-Dependent Protein Kinase a in Grass Carp Ctenopharyngodon Idella: Molecular Characterization, Gene Structure, Tissue Distribution and mRNA Expression in Endoplasmic Reticulum Stress-Induced Adipocyte Lipolysis. Comp. Biochem. Physiol. B Biochem. Mol. Biol. 2020, 250, 110479. [Google Scholar] [CrossRef]
  54. Ten Klooster, J.P.; Sotiriou, A.; Boeren, S.; Vaessen, S.; Vervoort, J.; Pieters, R. Type 2 Diabetes-Related Proteins Derived from an in Vitro Model of Inflamed Fat Tissue. Arch. Biochem. Biophys. 2018, 644, 81–92. [Google Scholar] [CrossRef]
  55. Akter, F.; Tsuyama, T.; Yoshizawa, T.; Sobuz, S.U.; Yamagata, K. SIRT7 Regulates Lipogenesis in Adipocytes through Deacetylation of PPARγ2. J. Diabetes Investig. 2021, 12, 1765–1774. [Google Scholar] [CrossRef]
  56. Xu, Y.; Zhang, S.; Guo, Y.; Gao, L.; Zhang, H.; Chen, W.; Huang, Y. Chicken CDS2 Isoforms Presented Distinct Spatio-Temporal Expression Pattern and Regulated by Insulin in a Breed-Specific Manner. Poult. Sci. 2022, 101, 101893. [Google Scholar] [CrossRef]
  57. Choi, J.H.; Lee, H. Histone Demethylase KDM4D Cooperates with NFIB and MLL1 Complex to Regulate Adipogenic Differentiation of C3H10T1/2 Mesenchymal Stem Cells. Sci. Rep. 2020, 10, 3050. [Google Scholar] [CrossRef] [PubMed]
  58. Rosen, E.D.; Spiegelman, B.M. What We Talk about When We Talk about Fat. Cell 2014, 156, 20–44. [Google Scholar] [CrossRef] [PubMed]
  59. Tontonoz, P.; Spiegelman, B.M. Fat and beyond: The Diverse Biology of PPARgamma. Annu. Rev. Biochem. 2008, 77, 289–312. [Google Scholar] [CrossRef] [PubMed]
  60. Yang, Y.; Zhang, Y.; Zhou, X.; Chen, D.; Ouyang, G.; Liu, Y.; Cui, D. Periostin Deficiency Attenuates Lipopolysaccharide- and Obesity-Induced Adipose Tissue Fibrosis. FEBS Lett. 2021, 595, 2099–2112. [Google Scholar] [CrossRef]
  61. Liu, L.; Gu, H.; Zhao, Y.; An, L.; Yang, J. Glypican 4 May Be Involved in the Adipose Tissue Redistribution in High-Fat Feeding C57BL/6J Mice with Peroxisome Proliferators-Activated Receptor γ Agonist Rosiglitazone Treatment. Exp. Ther. Med. 2014, 8, 1813–1818. [Google Scholar] [CrossRef]
  62. Wentworth, J.M.; Naselli, G.; Ngui, K.; Smyth, G.K.; Liu, R.; O’Brien, P.E.; Bruce, C.; Weir, J.; Cinel, M.; Meikle, P.J.; et al. GM3 Ganglioside and Phosphatidylethanolamine-Containing Lipids Are Adipose Tissue Markers of Insulin Resistance in Obese Women. Int. J. Obes. 2016, 40, 706–713. [Google Scholar] [CrossRef] [PubMed]
  63. Guo, X.; Li, F.; Xu, Z.; Yin, A.; Yin, H.; Li, C.; Chen, S.-Y. DOCK2 Deficiency Mitigates HFD-Induced Obesity by Reducing Adipose Tissue Inflammation and Increasing Energy Expenditure. J. Lipid Res. 2017, 58, 1777–1784. [Google Scholar] [CrossRef] [PubMed]
  64. Joshi, H.; Vastrad, B.; Joshi, N.; Vastrad, C.; Tengli, A.; Kotturshetti, I. Identification of Key Pathways and Genes in Obesity Using Bioinformatics Analysis and Molecular Docking Studies. Front. Endocrinol. 2021, 12, 628907. [Google Scholar] [CrossRef]
  65. Hachero-Cruzado, I.; Rodríguez-Rua, A.; Román-Padilla, J.; Ponce, M.; Fernández-Díaz, C.; Manchado, M. Characterization of the Genomic Responses in Early Senegalese Sole Larvae Fed Diets with Different Dietary Triacylglycerol and Total Lipids Levels. Comp. Biochem. Physiol. D Genom. Proteom. 2014, 12, 61–73. [Google Scholar] [CrossRef]
  66. Chakraborty, M.; Jandhyam, H.; Basak, S.K.; Das, S.; Alone, D.P. Intergenic Variants, Rs1200114 and Rs1200108 Are Genetically Associated along with a Decreased ATP1B1 Expression in Fuchs Endothelial Corneal Dystrophy. Exp. Eye Res. 2023, 228, 109403. [Google Scholar] [CrossRef]
  67. Chen, H.; Yang, P.; Yang, D.; Wang, D.; Lu, M.; Li, Y.; Zhong, Z.; Zhang, J.; Zeng, Z.; Liu, Z.; et al. The PER3rs772027021 SNP Induces Pigmentation Phenotypes of Dyschromatosis Universalis Hereditaria. J. Mol. Med. 2023, 101, 279–294. [Google Scholar] [CrossRef]
  68. Wang, N.-N.; Zhang, Y.; Jiang, F.; Zhu, D.-L.; Di, C.-X.; Hu, S.-Y.; Chen, X.-F.; Zhi, L.-Q.; Rong, Y.; Ke, X.; et al. Enhancer Variants on Chromosome 2p14 Regulating SPRED2 and ACTR2 Act as a Signal Amplifier to Protect against Rheumatoid Arthritis. Am. J. Hum. Genet. 2023, 110, 625–637. [Google Scholar] [CrossRef] [PubMed]
  69. Stülke, J. More than Just Activity Control: Phosphorylation May Control All Aspects of a Protein’s Properties. Mol. Microbiol. 2010, 77, 273–275. [Google Scholar] [CrossRef]
  70. Crowley, S.T.; Brownlee, M.; Edelstein, D.; Satriano, J.A.; Mori, T.; Singhal, P.C.; Schlondorff, D.O. Effects of Nonenzymatic Glycosylation of Mesangial Matrix on Proliferation of Mesangial Cells. Diabetes 1991, 40, 540–547. [Google Scholar] [CrossRef]
  71. Tang, S.; Li, J.; Huang, G.; Yan, L. Predicting Protein Surface Property with Its Surface Hydrophobicity. Protein Pept. Lett. 2021, 28, 938–944. [Google Scholar] [CrossRef]
  72. Ji, Y.-Y.; Li, Y.-Q. The Role of Secondary Structure in Protein Structure Selection. Eur. Phys. J.E. Soft Matter 2010, 32, 103–107. [Google Scholar] [CrossRef]
  73. O’Brien, E.P.; Ciryam, P.; Vendruscolo, M.; Dobson, C.M. Understanding the Influence of Codon Translation Rates on Cotranslational Protein Folding. Acc. Chem. Res. 2014, 47, 1536–1544. [Google Scholar] [CrossRef]
  74. Faure, G.; Ogurtsov, A.Y.; Shabalina, S.A.; Koonin, E.V. Adaptation of mRNA Structure to Control Protein Folding. RNA Biol. 2017, 14, 1649–1654. [Google Scholar] [CrossRef]
  75. Šedová, L.; Pravenec, M.; Křenová, D.; Kazdová, L.; Zídek, V.; Krupková, M.; Liška, F.; Křen, V.; Šeda, O. Isolation of a Genomic Region Affecting Most Components of Metabolic Syndrome in a Chromosome-16 Congenic Rat Model. PLoS ONE 2016, 11, e0152708. [Google Scholar] [CrossRef]
  76. Sheth, N.; Roca, X.; Hastings, M.L.; Roeder, T.; Krainer, A.R.; Sachidanandam, R. Comprehensive Splice-Site Analysis Using Comparative Genomics. Nucleic Acids Res. 2006, 34, 3955–3967. [Google Scholar] [CrossRef]
  77. Wong, E.S.; Thybert, D.; Schmitt, B.M.; Stefflova, K.; Odom, D.T.; Flicek, P. Decoupling of Evolutionary Changes in Transcription Factor Binding and Gene Expression in Mammals. Genome Res. 2015, 25, 167–178. [Google Scholar] [CrossRef] [PubMed]
  78. Santiago-Algarra, D.; Souaid, C.; Singh, H.; Dao, L.T.M.; Hussain, S.; Medina-Rivera, A.; Ramirez-Navarro, L.; Castro-Mondragon, J.A.; Sadouni, N.; Charbonnier, G.; et al. Epromoters Function as a Hub to Recruit Key Transcription Factors Required for the Inflammatory Response. Nat. Commun. 2021, 12, 6660. [Google Scholar] [CrossRef] [PubMed]
  79. Wei, W.; Sun, W.; Han, H.; Chu, W.; Zhang, L.; Chen, J. miR-130a Regulates Differential Lipid Accumulation between Intramuscular and Subcutaneous Adipose Tissues of Pigs via Suppressing PPARG Expression. Gene 2017, 636, 23–29. [Google Scholar] [CrossRef] [PubMed]
  80. Nguyen, T.T.P.; Kim, D.-Y.; Lee, Y.-G.; Lee, Y.-S.; Truong, X.T.; Lee, J.-H.; Song, D.-K.; Kwon, T.K.; Park, S.-H.; Jung, C.H.; et al. SREBP-1c Impairs ULK1 Sulfhydration-Mediated Autophagic Flux to Promote Hepatic Steatosis in High-Fat-Diet-Fed Mice. Mol. Cell 2021, 81, 3820–3832.e7. [Google Scholar] [CrossRef]
  81. Gui, L.; Raza, S.H.A.; Ma, B.; Easa, A.A.; Althobaiti, F.; Shukry, M.; Alotaibi, M.A.; Al Hazani, T.M.I.; Dawood, M.A.O.; Khan, R.; et al. CEBPβ Binding Directly to the Promoter Region Drives CEBPɑ Transcription and Improves FABP4 Transcriptional Activity in Adipose Tissue of Yak (Bos grunniens). Res. Vet. Sci. 2021, 141, 174–179. [Google Scholar] [CrossRef]
  82. Lavrador, M.S.F.; Afonso, M.S.; Cintra, D.E.; Koike, M.; Nunes, V.S.; Demasi, M.; Lin, C.J.; Beda, L.M.M.; Gioielli, L.A.; Bombo, R. de P.A.; et al. Interesterified Fats Induce Deleterious Effects on Adipose Tissue and Liver in LDLr-KO Mice. Nutrients 2019, 11, 466. [Google Scholar] [CrossRef] [PubMed]
  83. Xu, Q.; Wang, Y.; Zhang, Y.; Zhu, J.; Lin, Y. RXRα Cooperates with KLF8 to Promote the Differentiation of Intramuscular Preadipocytes in Goat. Anim. Biotechnol. 2021, 32, 580–590. [Google Scholar] [CrossRef]
  84. Hwang, J.S.; Lee, S.B.; Choi, M.-J.; Kim, J.T.; Seo, H.G. Anti-Adipogenic Effect of a Turmeric Extract-Loaded Nanoemulsion in 3T3-L1 Preadipocytes and High Fat Diet-Fed Mice. Food Sci. Technol. 2019, 39, 439–447. [Google Scholar] [CrossRef]
  85. Yoon, Y.-S.; Liu, W.; Van de Velde, S.; Matsumura, S.; Wiater, E.; Huang, L.; Montminy, M. Activation of the Adipocyte CREB/CRTC Pathway in Obesity. Commun. Biol. 2021, 4, 1214. [Google Scholar] [CrossRef]
  86. Jin, J.-H.; Wen, D.-T.; Chen, Y.-L.; Hou, W.-Q. Muscle FOXO-Specific Overexpression and Endurance Exercise Protect Skeletal Muscle and Heart from Defects Caused by a High-Fat Diet in Young Drosophila. Front. Biosci. Landmark 2023, 28, 16. [Google Scholar] [CrossRef]
  87. Zhu, D.-L.; Chen, X.-F.; Zhou, X.-R.; Hu, S.-Y.; Tuo, X.-M.; Hao, R.-H.; Dong, S.-S.; Jiang, F.; Rong, Y.; Yang, T.-L.; et al. An Osteoporosis Susceptibility Allele at 11p15 Regulates SOX6 Expression by Modulating TCF4 Chromatin Binding. J. Bone Miner. Res. 2022, 37, 1147–1155. [Google Scholar] [CrossRef] [PubMed]
  88. Yu, C.-Y.; Han, J.-X.; Zhang, J.; Jiang, P.; Shen, C.; Guo, F.; Tang, J.; Yan, T.; Tian, X.; Zhu, X.; et al. A 16q22.1 Variant Confers Susceptibility to Colorectal Cancer as a Distal Regulator of ZFP90. Oncogene 2020, 39, 1347–1360. [Google Scholar] [CrossRef] [PubMed]
Figure 1. Blink model schematic.
Animals 15 02811 g001
Figure 2. Gene expression clusterin. Note: FL represents high−fat individuals, and LL represents low-fat individuals.
Animals 15 02811 g002
Figure 3. SNP density distribution map.
Animals 15 02811 g003
Figure 4. Principal component analysis map and allele frequency difference map. (A) Principal Component Analysis (PCA) plot showing the genetic structure differentiation between two species (H and L). Cyan points represent species H, and red points represent species L. The two species show clear separation along the first principal component axis (PCA1), indicating significant genetic differentiation. (B) Genome-wide allele frequency difference plot (Δ Allele frequency) displaying the allele frequency differences in SNP loci across chromosomes between the two species. The Y−axis represents allele frequency difference values (0–1), and the X−axis represents chromosomal positions (Chr 1-Z), with different colors indicating different chromosomes.
Animals 15 02811 g004
Figure 5. Genome-wide association analysis of abdominal fat weight. (A) shows the Manhattan chart, the black line indicates the threshold for screening SNP, and the bottom of the Manhattan chart shows the SNP density distribution. (B) is a QMQ diagram.
Animals 15 02811 g005
Figure 6. Linkage disequilibrium analysis diagram. Panels (AP) correspond to the top SNPs identified by GWAS on different chromosomes. In each subfigure, the upper part shows the regional Manhattan plot, where the lead SNP is indicated by a red arrow. The lower part depicts the pairwise LD structure (r2) among SNPs in the region, with color intensity from yellow to red representing low to high LD. Specifically, subfigures A–P illustrate representative loci on chromosomes 1, 2, 3, 4, 6, 13, 14, and Z. Together, these plots highlight the genomic regions most strongly associated with abdominal fat deposition.
Animals 15 02811 g006
Figure 7. Volcanic map of differentially expressed genes. Volcano plot showing the results of differential gene expression analysis. The X-axis represents the log2 fold change in gene expression, and the Y-axis represents the negative log10 P value indicating statistical significance. Blue dots represent significantly downregulated genes (log2 fold change < −1, p < 0.05), red dots represent significantly upregulated genes (log2 fold change > 1, p < 0.05), and gray dots represent genes with no significant difference. The horizontal dashed line indicates the significance threshold (p = 0.05), and the vertical dashed lines indicate the fold change threshold (|log2 fold change| = 1).
Animals 15 02811 g007
Figure 8. Schematic diagram of the number of SNP located in differentially expressed genes. The red region represents the number of differentially expressed genes in the 2302 SNPs; yellow regions analyzed by GWAS and LD, and the overlapping region represents the number of 201 differentially expressed genes.
Animals 15 02811 g008
Figure 9. mRNA secondary structure analysis diagram. Predicted secondary structures of mRNA for wild type and variant forms of SYT15 (rs314812968), MYO1E (rs15679530), and ENGASE (rs316935384) genes. Red circles indicate regions where structural changes occur due to the genetic variants.
Animals 15 02811 g009
Figure 10. Interaction map between SNP and differentially expressed genes. (AJ) Individual interaction profiles for each of the 15 analyzed SNPs, displaying three-dimensional chromatin looping patterns between variant loci and target genes. Each panel shows the genomic region containing the SNP (blue bars represent genes/regulatory elements) and curved arcs indicating long-range chromatin interactions.
Animals 15 02811 g010
Figure 11. SNP affects differences in abdominal fat weight. The SNPs above the black line represent those that lead to a threefold or greater difference in abdominal fat weight.
Animals 15 02811 g011
Table 1. Difference in SNP between high fat and low fat broilers (Part).
ChrrsWTMTFL_1FL_2FL_3FL_4FL_5LL_1LL_2LL_3LL_4LL_5
1337683AGG/GG/AG/GG/GG/GA/AA/AA/AA/AA/A
23908887TCT/TT/TT/TT/TT/TC/CC/CC/CC/CC/C
32127089CAA/AA/AA/AA/AA/AC/CC/CC/CC/CC/C
431488349CTT/TT/TT/TT/TT/TC/CC/CC/TC/CC/C
59960422GAG/GG/GG/GG/GG/GA/AA/AA/AA/AA/A
612977377GTT/TT/TT/TT/TT/TG/GG/GG/GG/GG/T
72716815AGG/GG/GG/GA/GG/GA/AA/AA/AA/AA/A
827654376GTG/GG/GG/GG/GG/GT/TT/TT/TT/TG/T
93548057GAG/AG/GG/GG/GG/GA/AA/AA/AA/AA/A
Z70803755ACA/AA/AA/AA/AA/AC/CC/CC/CC/CC/C
Table 2. Distal target genes regulated by SNP.
ChrrsrsIDWTMTGene
1173675555rs733601174CTPOSTN
43022801rs316329973GAGPC4, HS6ST2
485315858rs739468529TCST3GAL5
485317113rs313259902ATST3GAL5
485317787rs316888112GAST3GAL5
485318002rs14501054CTST3GAL5
485318751rs741259739CTST3GAL5
485321374rs735918912GAST3GAL5
489576514rs15645705GAC20orf194
551579773rs317162307AGASPG
723241529rs739919594TCTNS1
1017802386rs741174402ATCHSY1
135392030rs14990733TCDOCK2
158176792rs315551857AGCORO1C
263856885rs315369512GCAPOBEC2
Table 3. Codon translation rate analysis.
rsIDWTMTCAI Value Before MutationCAI Value After MutationGene
rs315605586CT0.750.76PAK3
rs15674853TC0.780.77STBD1
rs314812968CT0.760.75SYT15
The CAI value is the codon adaptation index, which refers to the adaptation coefficient when all codons encoding the protein use the optimal codon relative to the gene. The CAI value is between 0 and 1, and the higher the CAI value, the stronger the adaptability, thus improving the expression efficiency of the gene.
Table 4. Comparison of the difference in transcription factor binding sites before and after mutation.
rsrsIDWTMTSpecific Transcription Factor Binding Sites Before MutationSpecific Transcription Factor Binding Sites After Mutation
1:173675555rs733601174CTPLAGL2, Plagl1, PLAG1, ZNF692, Zbtb41, Zfp711, ZNF134, ZNF707, Hnf4g, ZKSCAN3, ZBTB6, ZNF454Prdm5, Zfp37, Hes7, ZNF135, Zfp691, TFAP2E
4:3022801rs316329973GAZfp3, Zbtb20, Zfp184, Znf431AR, Dmrtb1, ZNF189, Mafb
4:85315858rs739468529TC Zfp689, Rfx7, Hic1, Rfx4, ZNF527, ZNF582, RFX5, RFX2, Rfx3
4:85317113rs313259902ATFOXC1, Pax5REST, Sall2
4:85317787rs316888112GAZNF677POU2F2, POU5F1, POU1F1, POU3F4, ZNF84, MAFF, POU6F1, PATZ1, Pou2f1, POU2F3, POU3F2, ZNF394, FEZF1, Foxm1, POU3F1, ZNF260
4:85318002rs14501054CTSREBF2, Rara, Nkx2-2, NKX2-1, RARG YY1, MXI1, Prdm5, RFX5, BCL11A, Rfx2, Rfx1
4:85318751rs741259739CTPAX5, Nr1h4, ZNF791, ZNF383, FERD3L, ZNF681, ATF1 ZNF136, ZNF324, Npas4
4:85321374rs735918912GAJUND, NFE2, Npas4, JUNBSox4, ZNF768, ZNF212, Sox11, SOX3, ZNF652, SOX10, AR, ZNF223
4:89576514rs15645705GAHIC2, Mtf1, HIC1, Nr1h4, ATF6, ZNF141, ZNF93, ATF6B, Zbtb41RFX3, ZNF429, THAP1, Rfx4, ZNF320, Npas4
5:51579773rs317162307AGZNF35, ZNF280A, Zfp583ZNF212, SOX18, ZNF180, Rela
7:23241529rs739919594TCZNF3, ZNF768MYBL1, ESR2, Myb, Mybl2, ZNF324
10:17802386rs741174402ATNR1D2 IRF4, Zfp41, Zfp287, Zfp768
13:5392030rs14990733TCZIM3, Stat6, ZNF274 RELA, NFKB1, REL
15:8176792rs315551857AGPITX2, Myb GSX2, GSX1, PBX4, Lhx2, POU6F2, Uncx, NKX6-2, LBX1, PRRX2, SHOX, ISX, HESX1, LHX9, ARX, VENTX, Pax6, PROP1, MEIS2, RORA, PRRX1, PAX4, MIXL1, NKX6-1, Nobox, HOXC4, NOTO, HOXD13, Nkx6-3, ZNF396, Lhx8, ESX1, LHX6, VSX1, Hlx, ZFHX2, En2, Phox2b, Phox2a, DLX3, Lhx1, RORC, Shox2, RAX2, Rhox6, HOXC13, MEOX1, EMX1, RAX, Otp, Gbx1
26:3856885rs315369512GCPAX6, ZNF621, ZNF768 THAP1, FOXO3, ZNF75A, Zfp770
Table 5. Comparison of the difference in affinity of transcription factors before and after mutation.
rsrsIDWTMTSpecific Transcription Factor Binding Sites Before MutationSpecific Transcription Factor Binding Sites After Mutation
1:173675555rs733601174CTHNF4, COUP, USF_CZID
4:3022801rs316329973GAZIDPAX2, CEBP_C, CEBPB, IRF1, CHOP, R
4:85315858rs739468529TCBRACH, GATA3, EVI1, SRYSTAF, PAX5, RFX1, CMYB
4:85317113rs313259902ATGATA1, CREL, CDP, S8, ISRE, IRF1, IRF2, HFH1, CEBP, PBX1OCT1_06, HNF1_C, E4BP4, VBP, HLF, EVI1, NRSF, CMYB
4:85317787rs316888112GAGR, AHRARNT, IRF2, PAX5EVI1
4:85318002rs14501054CTCMYB, MYB, VMYBCOMP1, RFX1, AP1FJ
4:85318751rs741259739CTER, T3R, P300USF, CDPCR3, MZF1, GATA1, GATA2, GATA3
4:85321374rs735918912GAPAX5, STAF, NRF2, ISREMZF1, HNF4, GR, CDXA
4:89576514rs15645705GACMYB, E2, E2F, IK1CDPCR3, CREB, USF_C, ER, GRE_C
5:51579773rs317162307AGNFKB_C, NFKAPPAB, GR, R, MYCMAX, LMO2COM, AML1TAXCREB, VMYB
7:23241529rs739919594TCTAL1ALPHAE47, TAL1BETAITF2, GATA1, SRYGR, GRE_C, COMP1
10:17802386rs741174402ATGRE_C, EVI1, CREL, USF, SP1COMP1, IK3, NFE2, ELK1
13:5392030rs14990733TCPOLY_C, EVI1STAT1, CREL, DELTAEF1, STAT, CAP
15:8176792rs315551857AGPBX1, CREBP1RORA1, ER
26:3856885rs315369512GCOLF1, CAATCEBPA, CEBP, GFI1, MZF1
Disclaimer/Publisher’s Note: The statements, opinions and data contained in all publications are solely those of the individual author(s) and contributor(s) and not of MDPI and/or the editor(s). MDPI and/or the editor(s) disclaim responsibility for any injury to people or property resulting from any ideas, methods, instructions or products referred to in the content.