Figure 1.
Map of UV light lure sites located in Prince William Forest Park and Marine Corps Base Quantico in eastern Virginia, USA, that were sampled from approximately mid-May to early August, 2020–2021 (
https://www.openstreetmap.org/#map=18/38.584564/-77.387250, accessed on 10 October 2021).
Figure 1.
Map of UV light lure sites located in Prince William Forest Park and Marine Corps Base Quantico in eastern Virginia, USA, that were sampled from approximately mid-May to early August, 2020–2021 (
https://www.openstreetmap.org/#map=18/38.584564/-77.387250, accessed on 10 October 2021).
Figure 2.
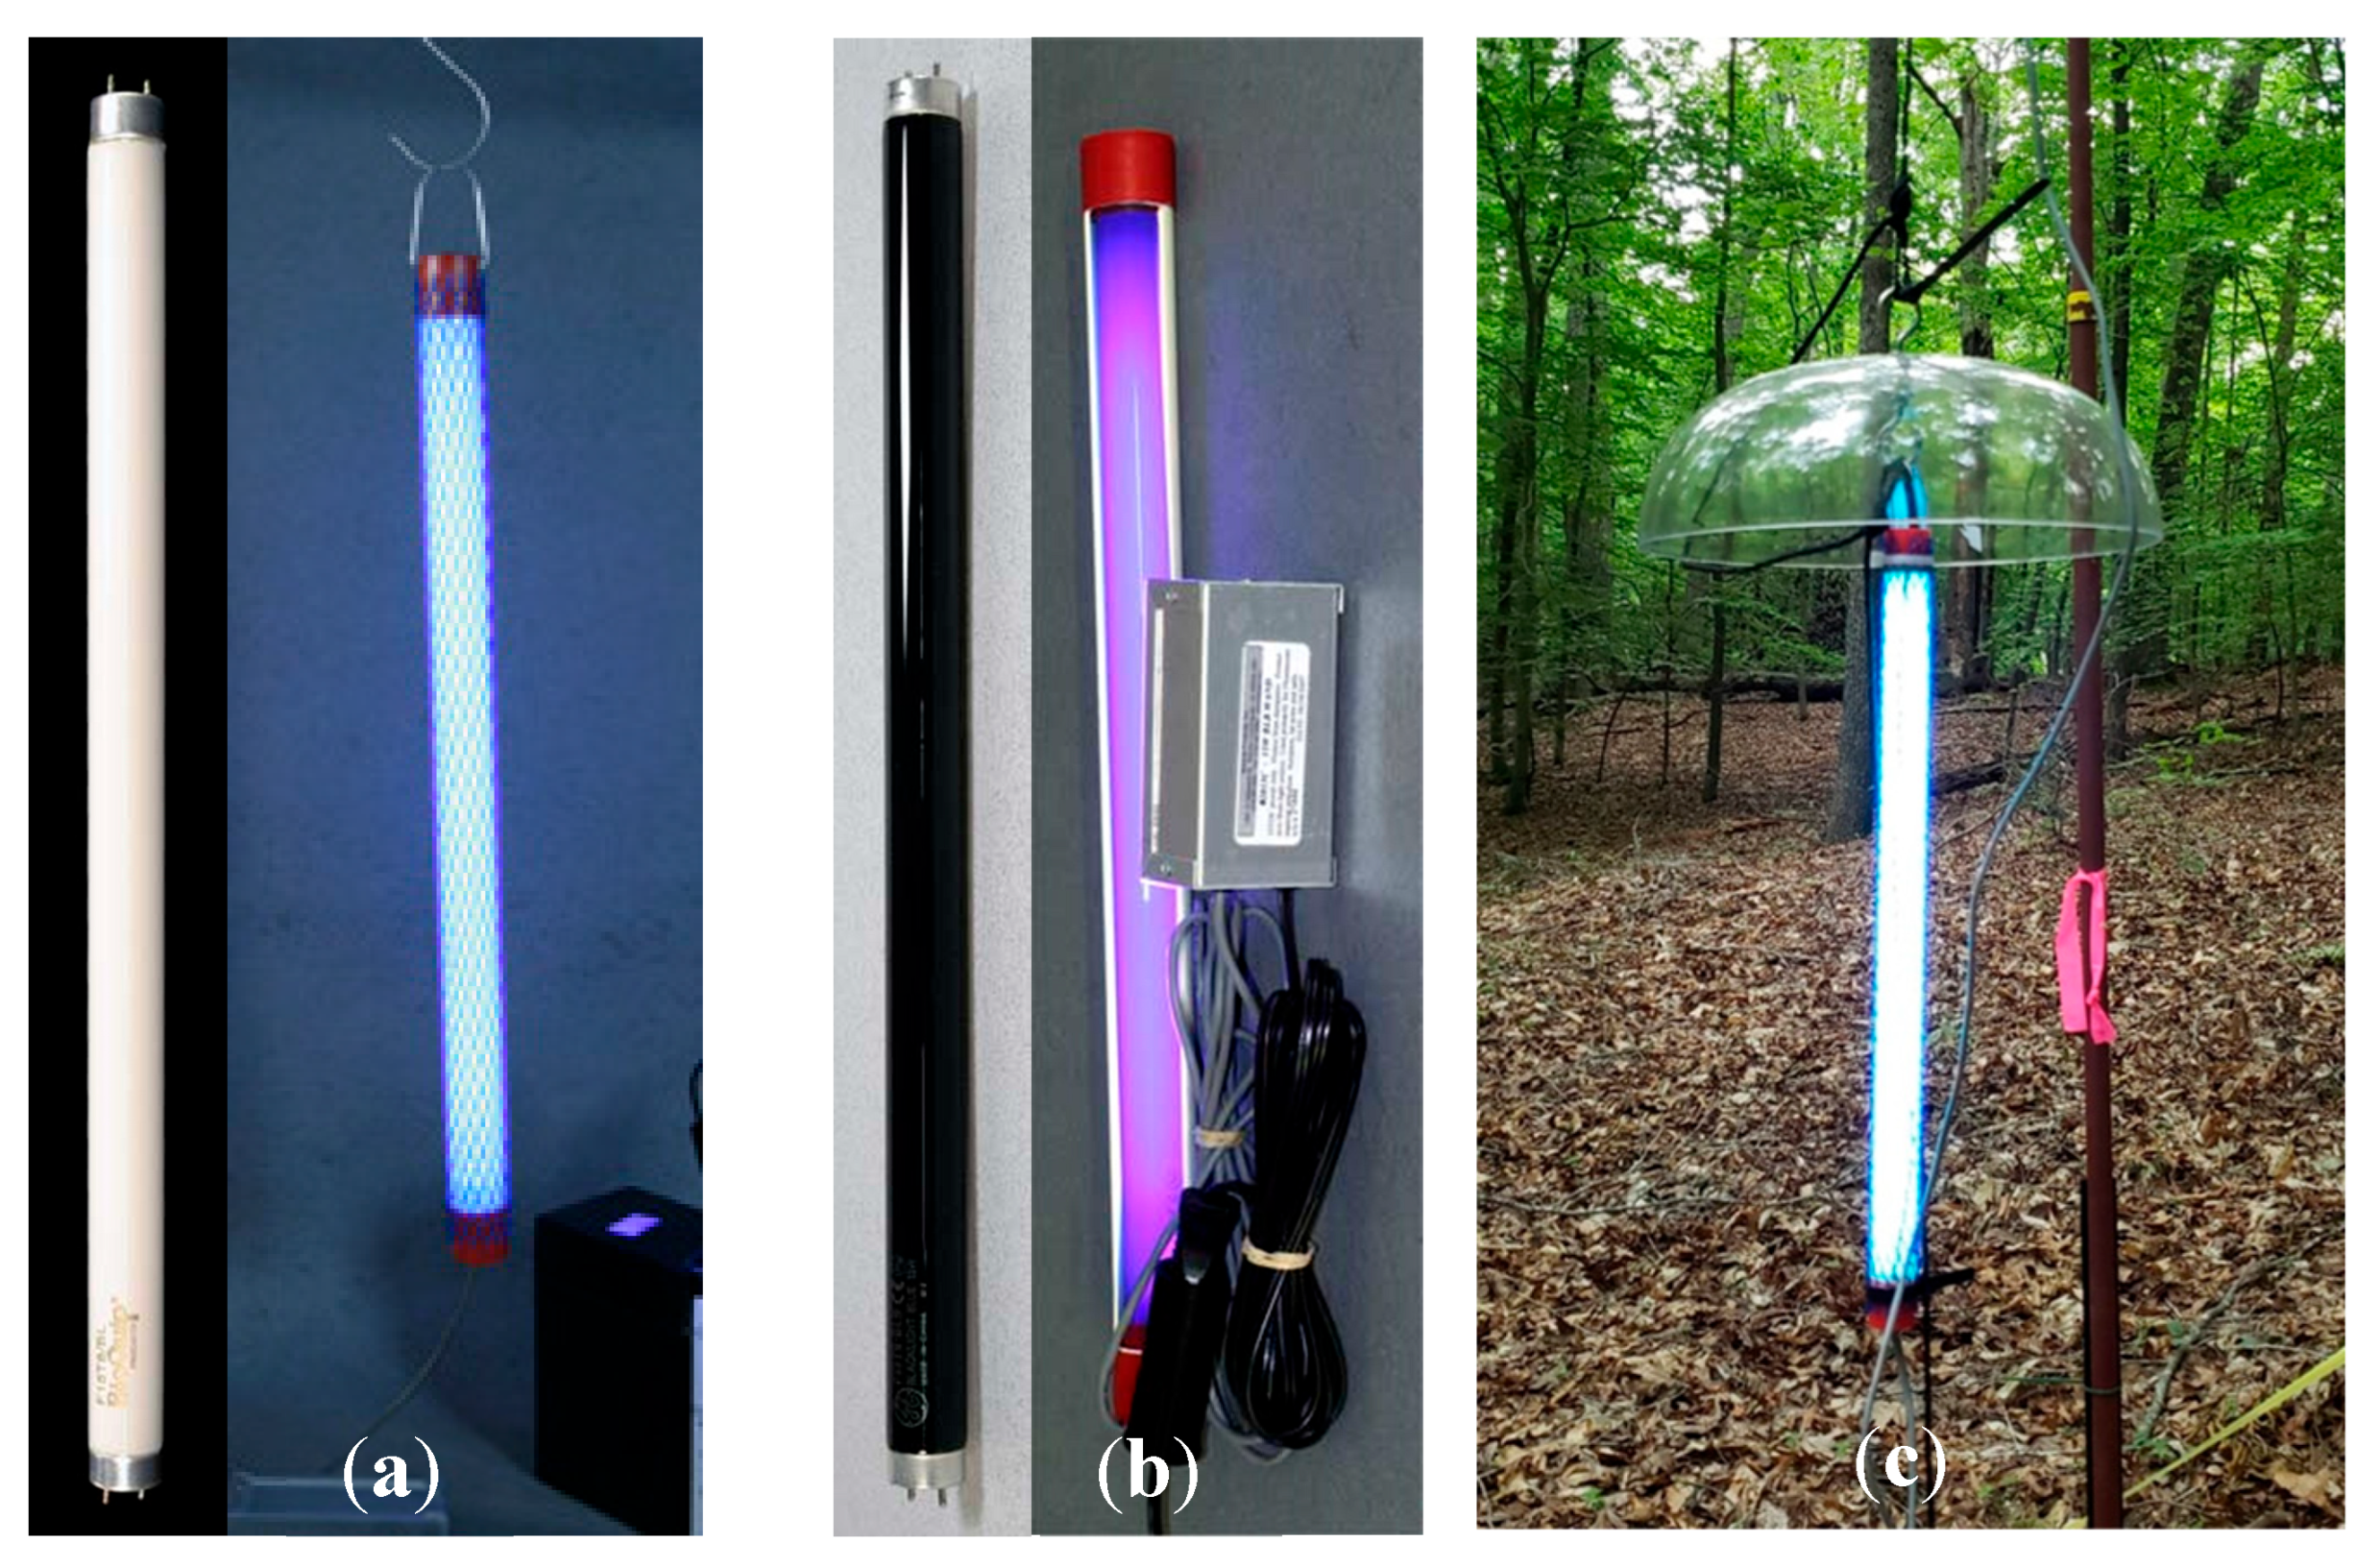
UV lights used in the study at Prince William Forest Park and Marine Corps Base Quantico, VA, USA, 2020, showing: (a) an uncoated UV blacklight (BL) fluorescent tube (left) and the tube on demonstrating the brighter output of visible light (right), and (b) a coated UV blacklight-blue (BLB) fluorescent tube (left), and the tube on demonstrating less visible light output (right). (a,b) pictures source: Bioquip, Rancho Dominguez, CA, USA. Accessed: December 2023. (c) Close-up picture showing one of the two ultraviolet (UV) fluorescent tubes suspended from a rope that was part of the UV lure used in the study. Note the clear dome is a birdfeeder rain cover used to protect the tube from rain (Samuel Freeze, 2020).
Figure 3.
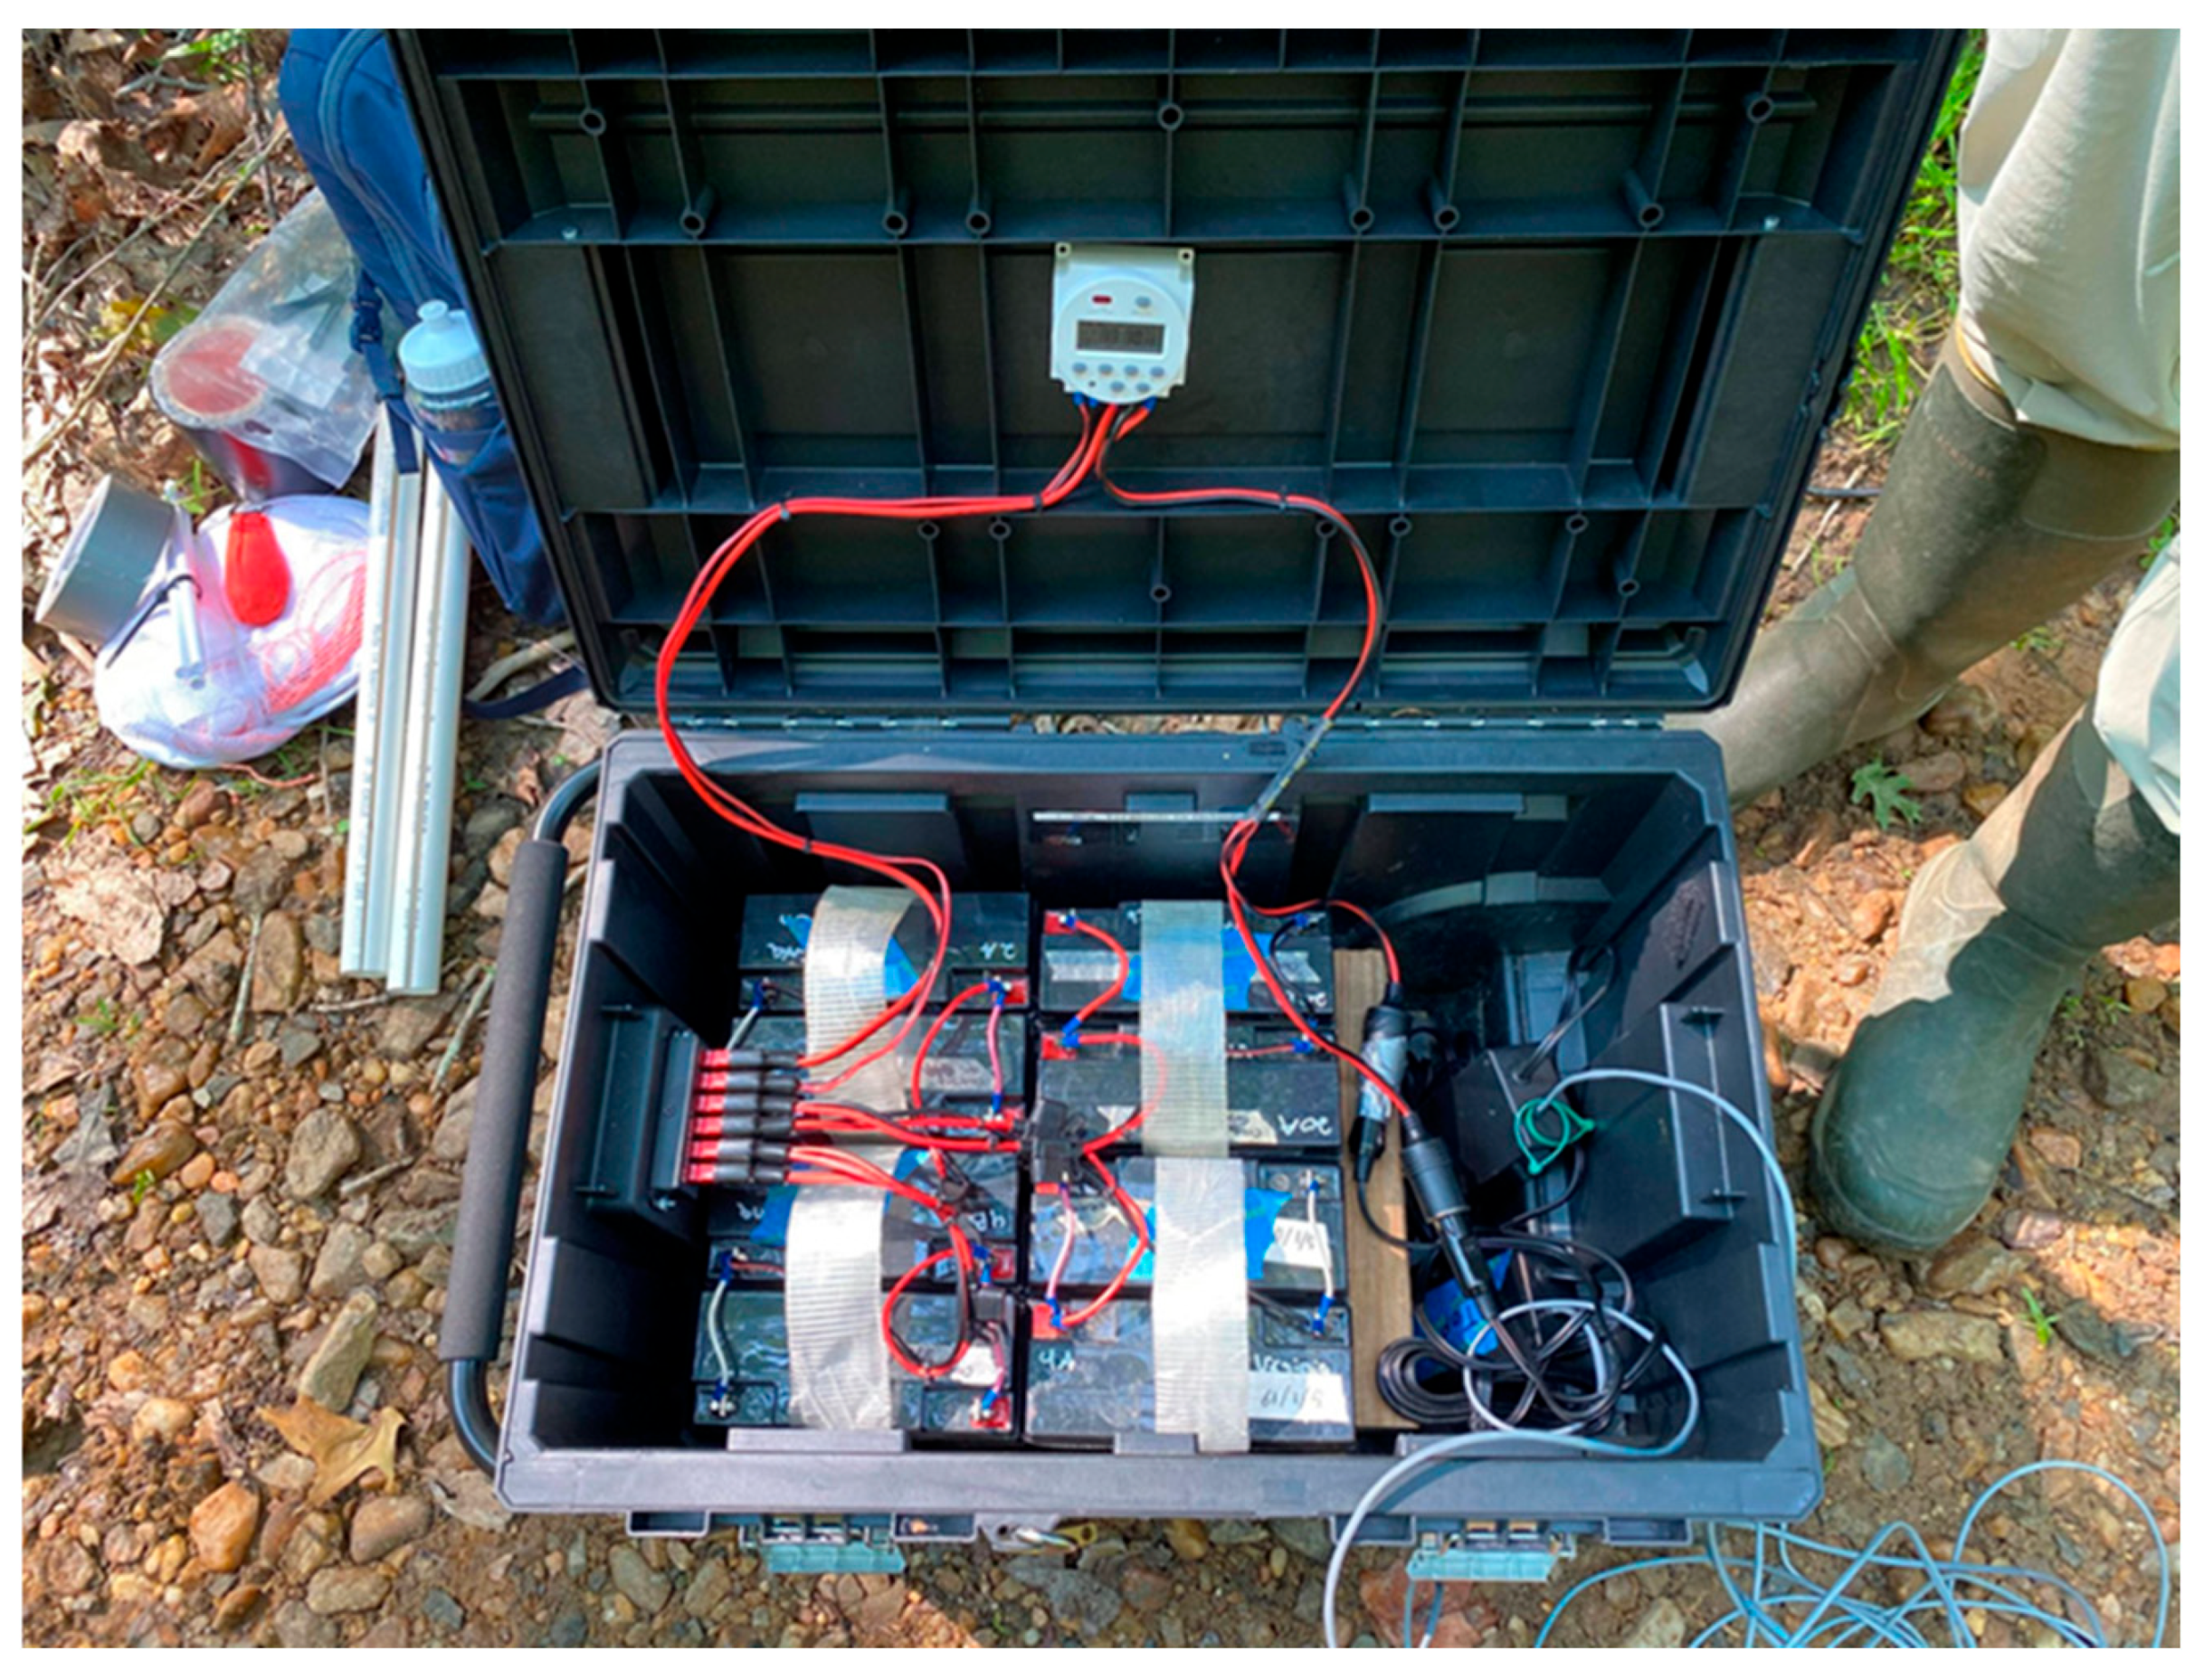
Picture showing the inside of the power supply and control box of the UV lure showing the bank of 12-volt sealed lead-acid batteries connected in parallel via an Anderson power connector distribution block and routed through a programmable timer set to run from sunset to sunrise at Prince William Forest Park and Marine Corps Base Quantico VA, USA, 2020 (Samuel Freeze, 2020).
Figure 4.
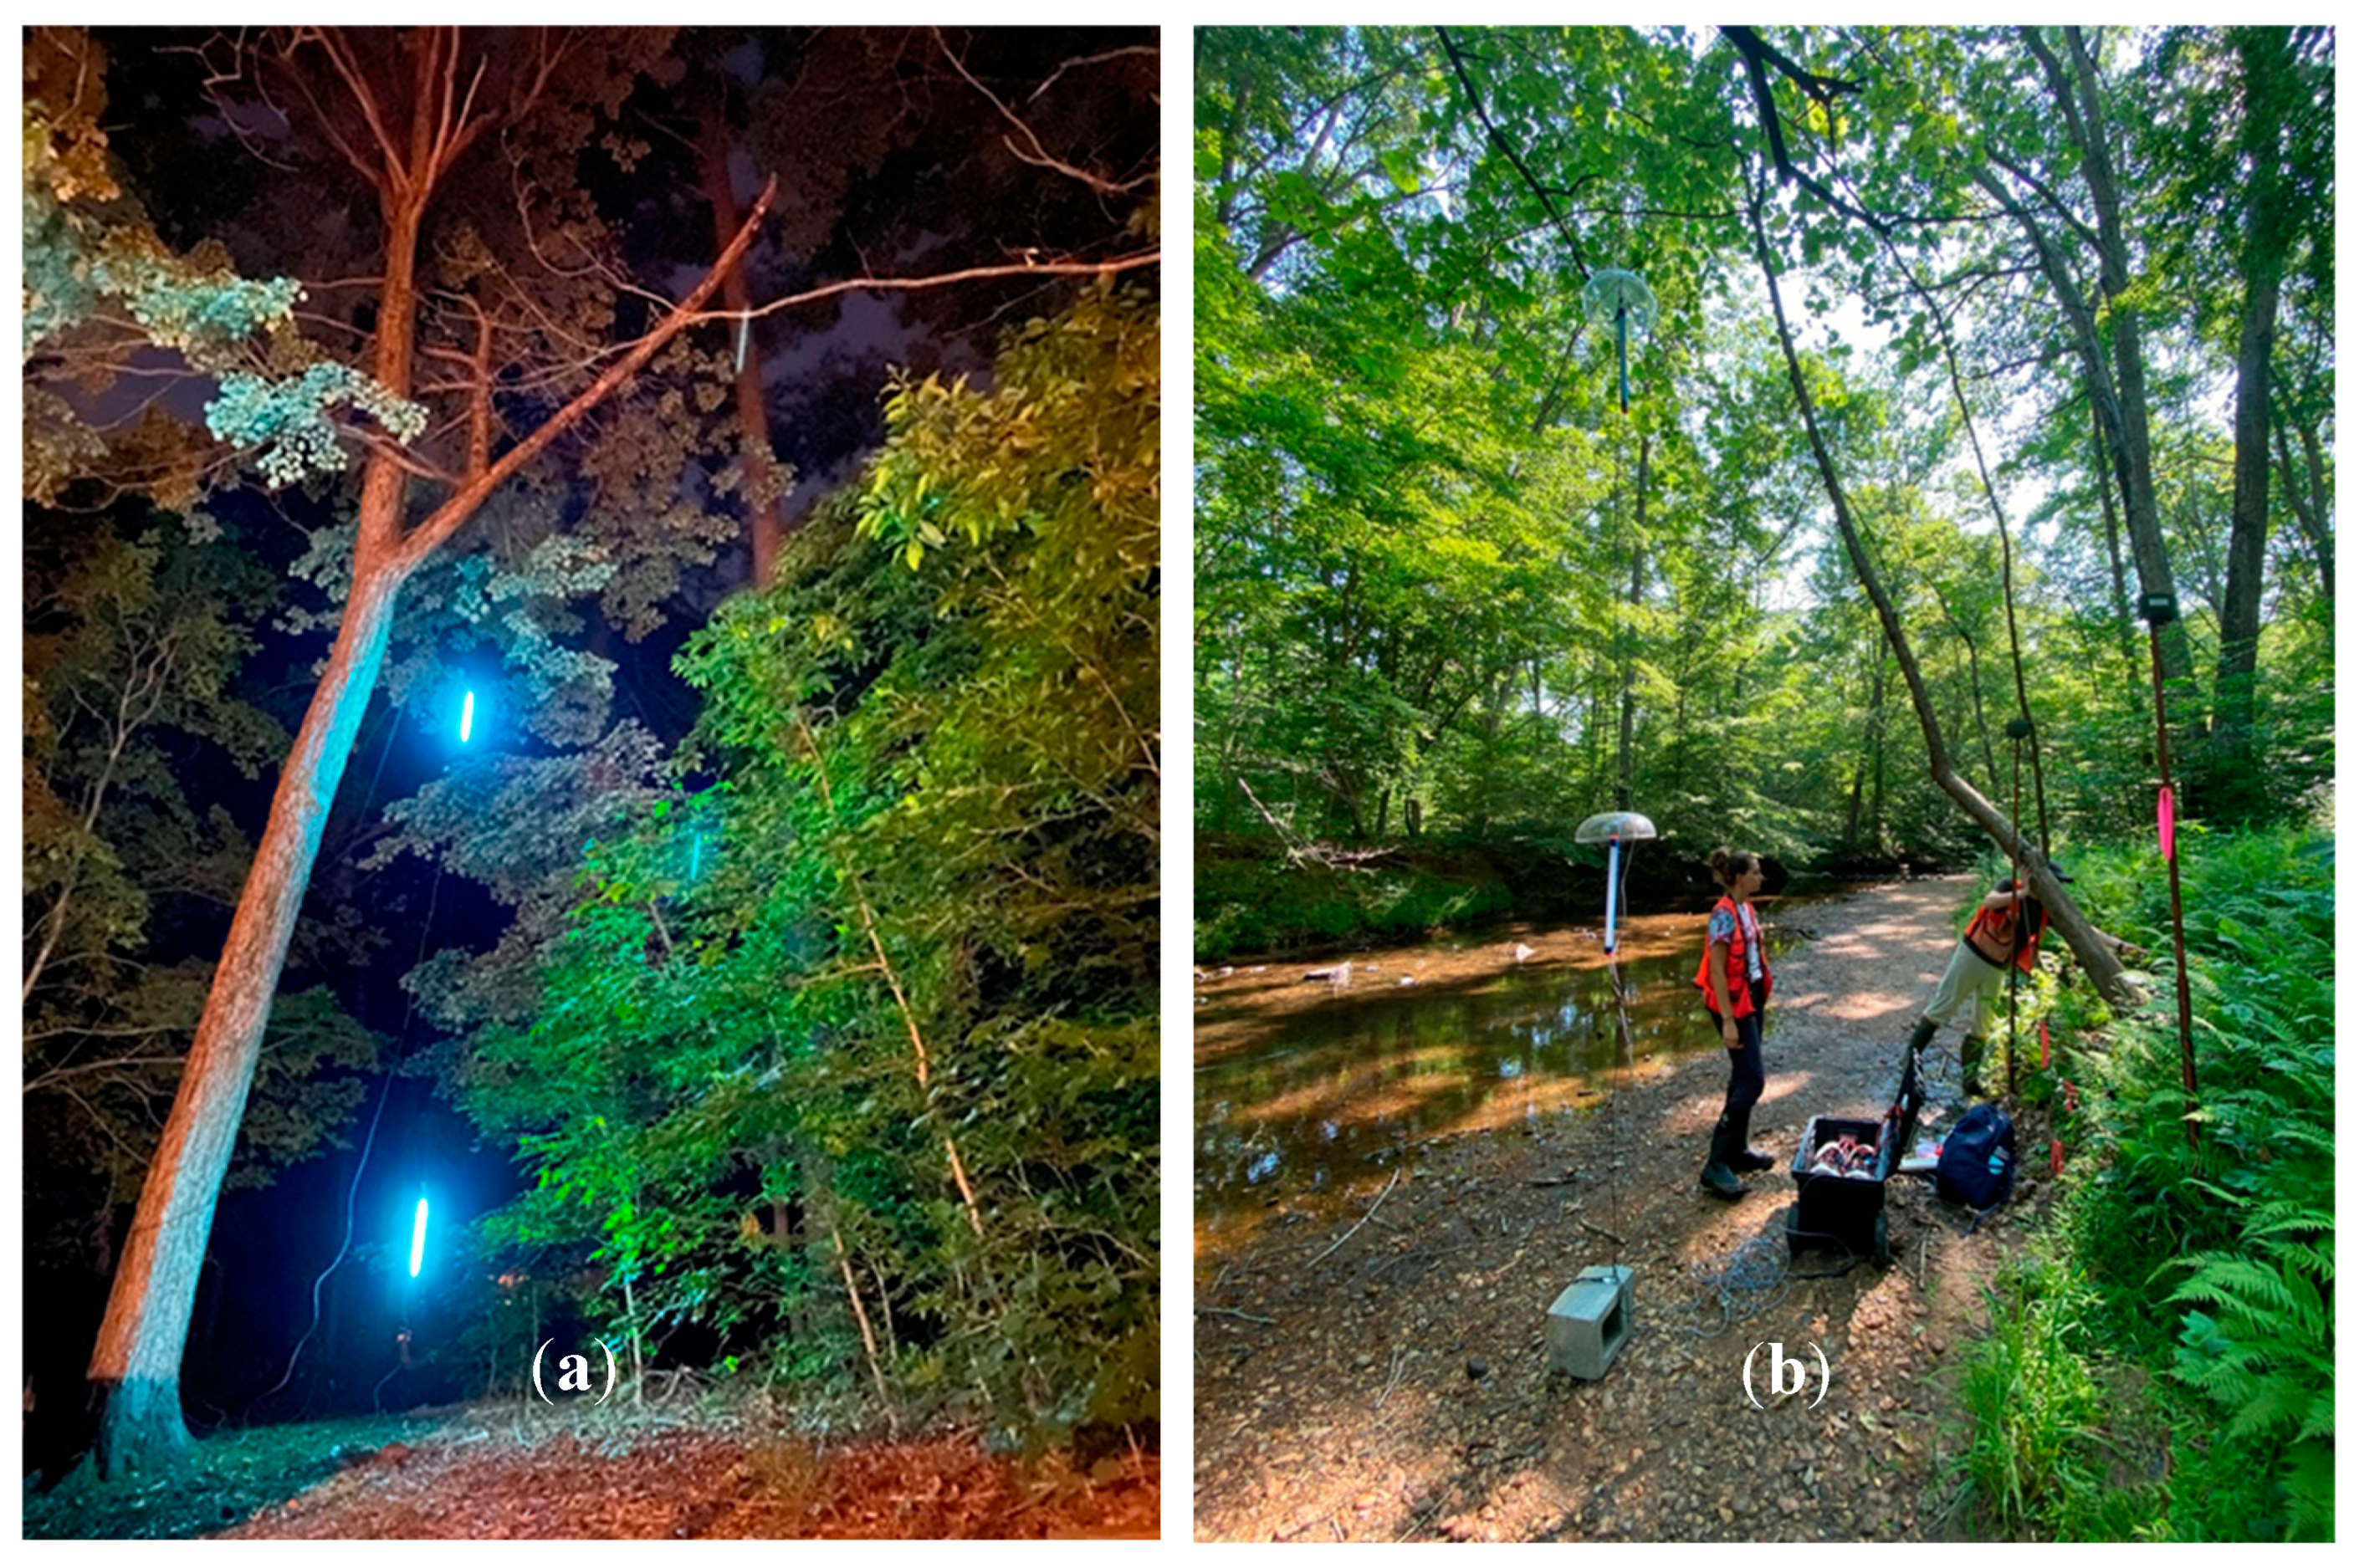
(a) Picture showing the UV light lure activated and suspended from a tree in Prince William Forest Park, VA, USA, 2020–2021 (Samuel Freeze, 2020). Note that additional fill light was added to this picture. (b) Picture showing a UV lure site deployed along a stream corridor in Prince William Forest Park, VA, USA, 2020–2021 (Samuel Freeze, 2020). Note the two UV lights hanging from the tree with bat detectors on poles located nearby.
Figure 5.
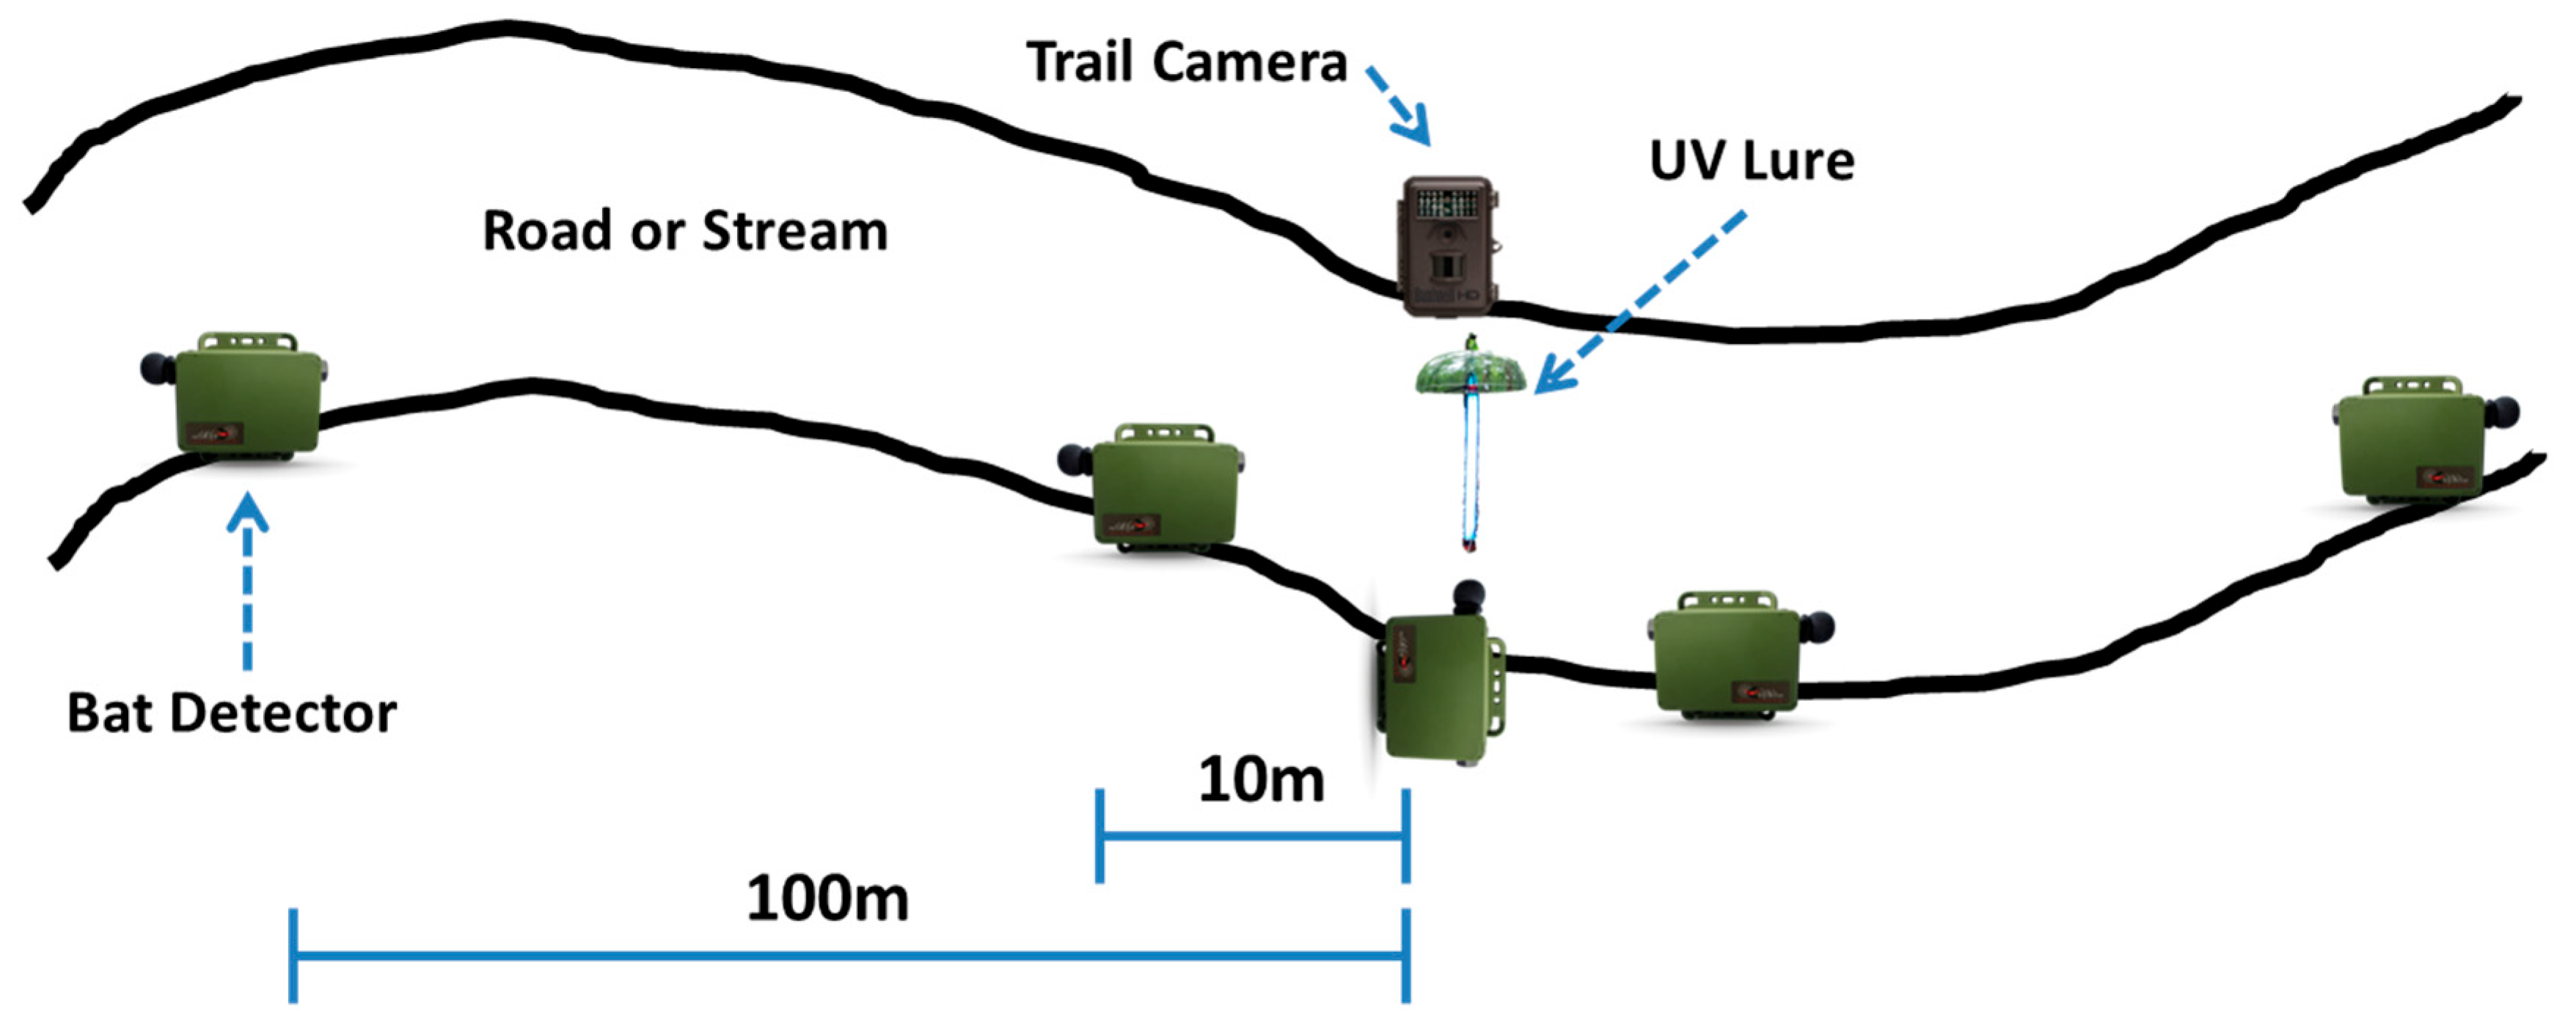
Diagram showing the layout of UV lure sampling site of the five detector positions (center/0 m, 10 m, and 100 m) along with the lure at the center of the site and a trail camera used to confirm lure operation in Prince William Forest Park and Marine Corps Base Quantico, VA, USA, 2020–2021 (Samuel Freeze, 2020).
Figure 6.
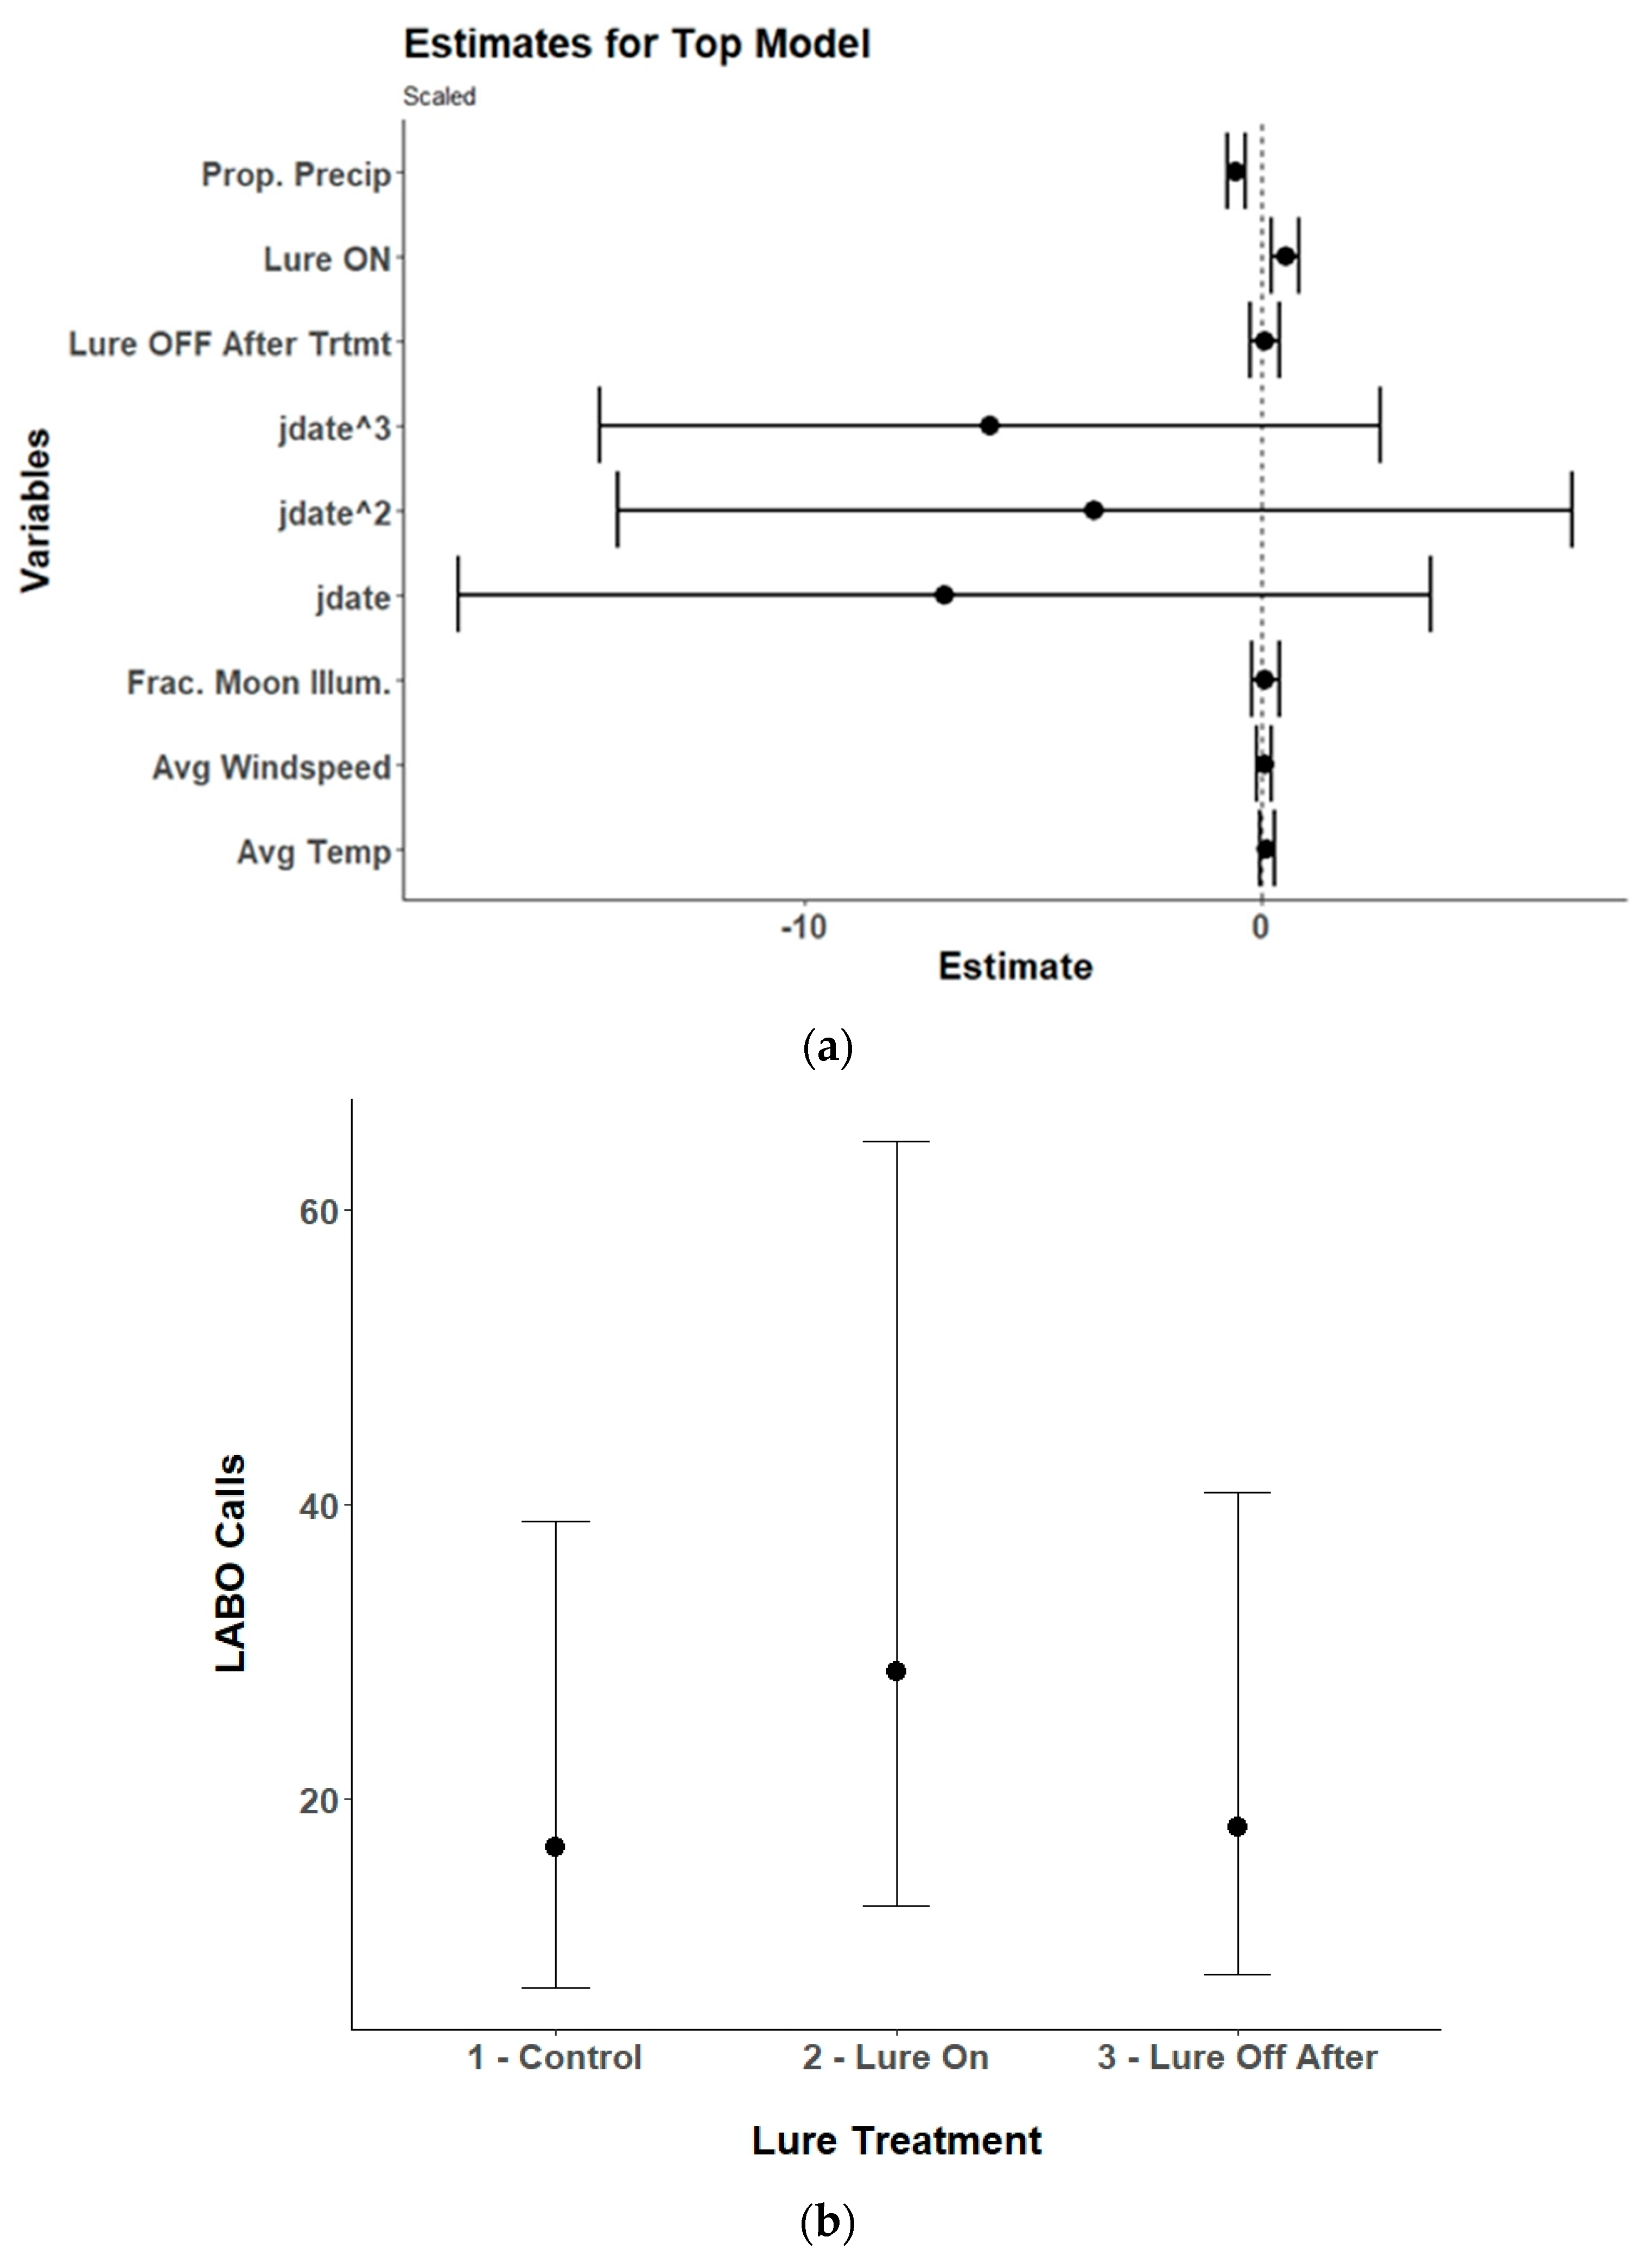
(a) Model estimates and 95% confidence intervals from the selected top generalized linear mixed model for eastern red bats (Lasiurus borealis; LABO) showing the response of received eastern red bat echolocation passes to the UV light lure treatments (control/lure off before treatment, lure on, and lure off after treatment), environmental variables, and the linear (yday), quadratic (yday2), and cubic (yday3) day of the year at Prince William Forest Park and Marine Corps Base Quantico, VA, USA from 2020 to 2021. Environmental variables included proportion of the night with measurable precipitation (Prop. Precip), average nightly temperature (Avg. Temp), average nightly windspeed (Avg. Windspeed), and the fraction of the moon illuminated at midnight (Frac. Moon Illum.). All numeric variables are centered and scaled. (b) Estimated marginal means and 95% confidence intervals from the top selected model for eastern red bats showing model predictions for eastern red bat echolocation passes during the three different UV lure treatments conditions. Conditions included light off before treatment (control), light on, and light off after treatment.
![Animals 15 02458 g006 Animals 15 02458 g006]()
Figure 7.
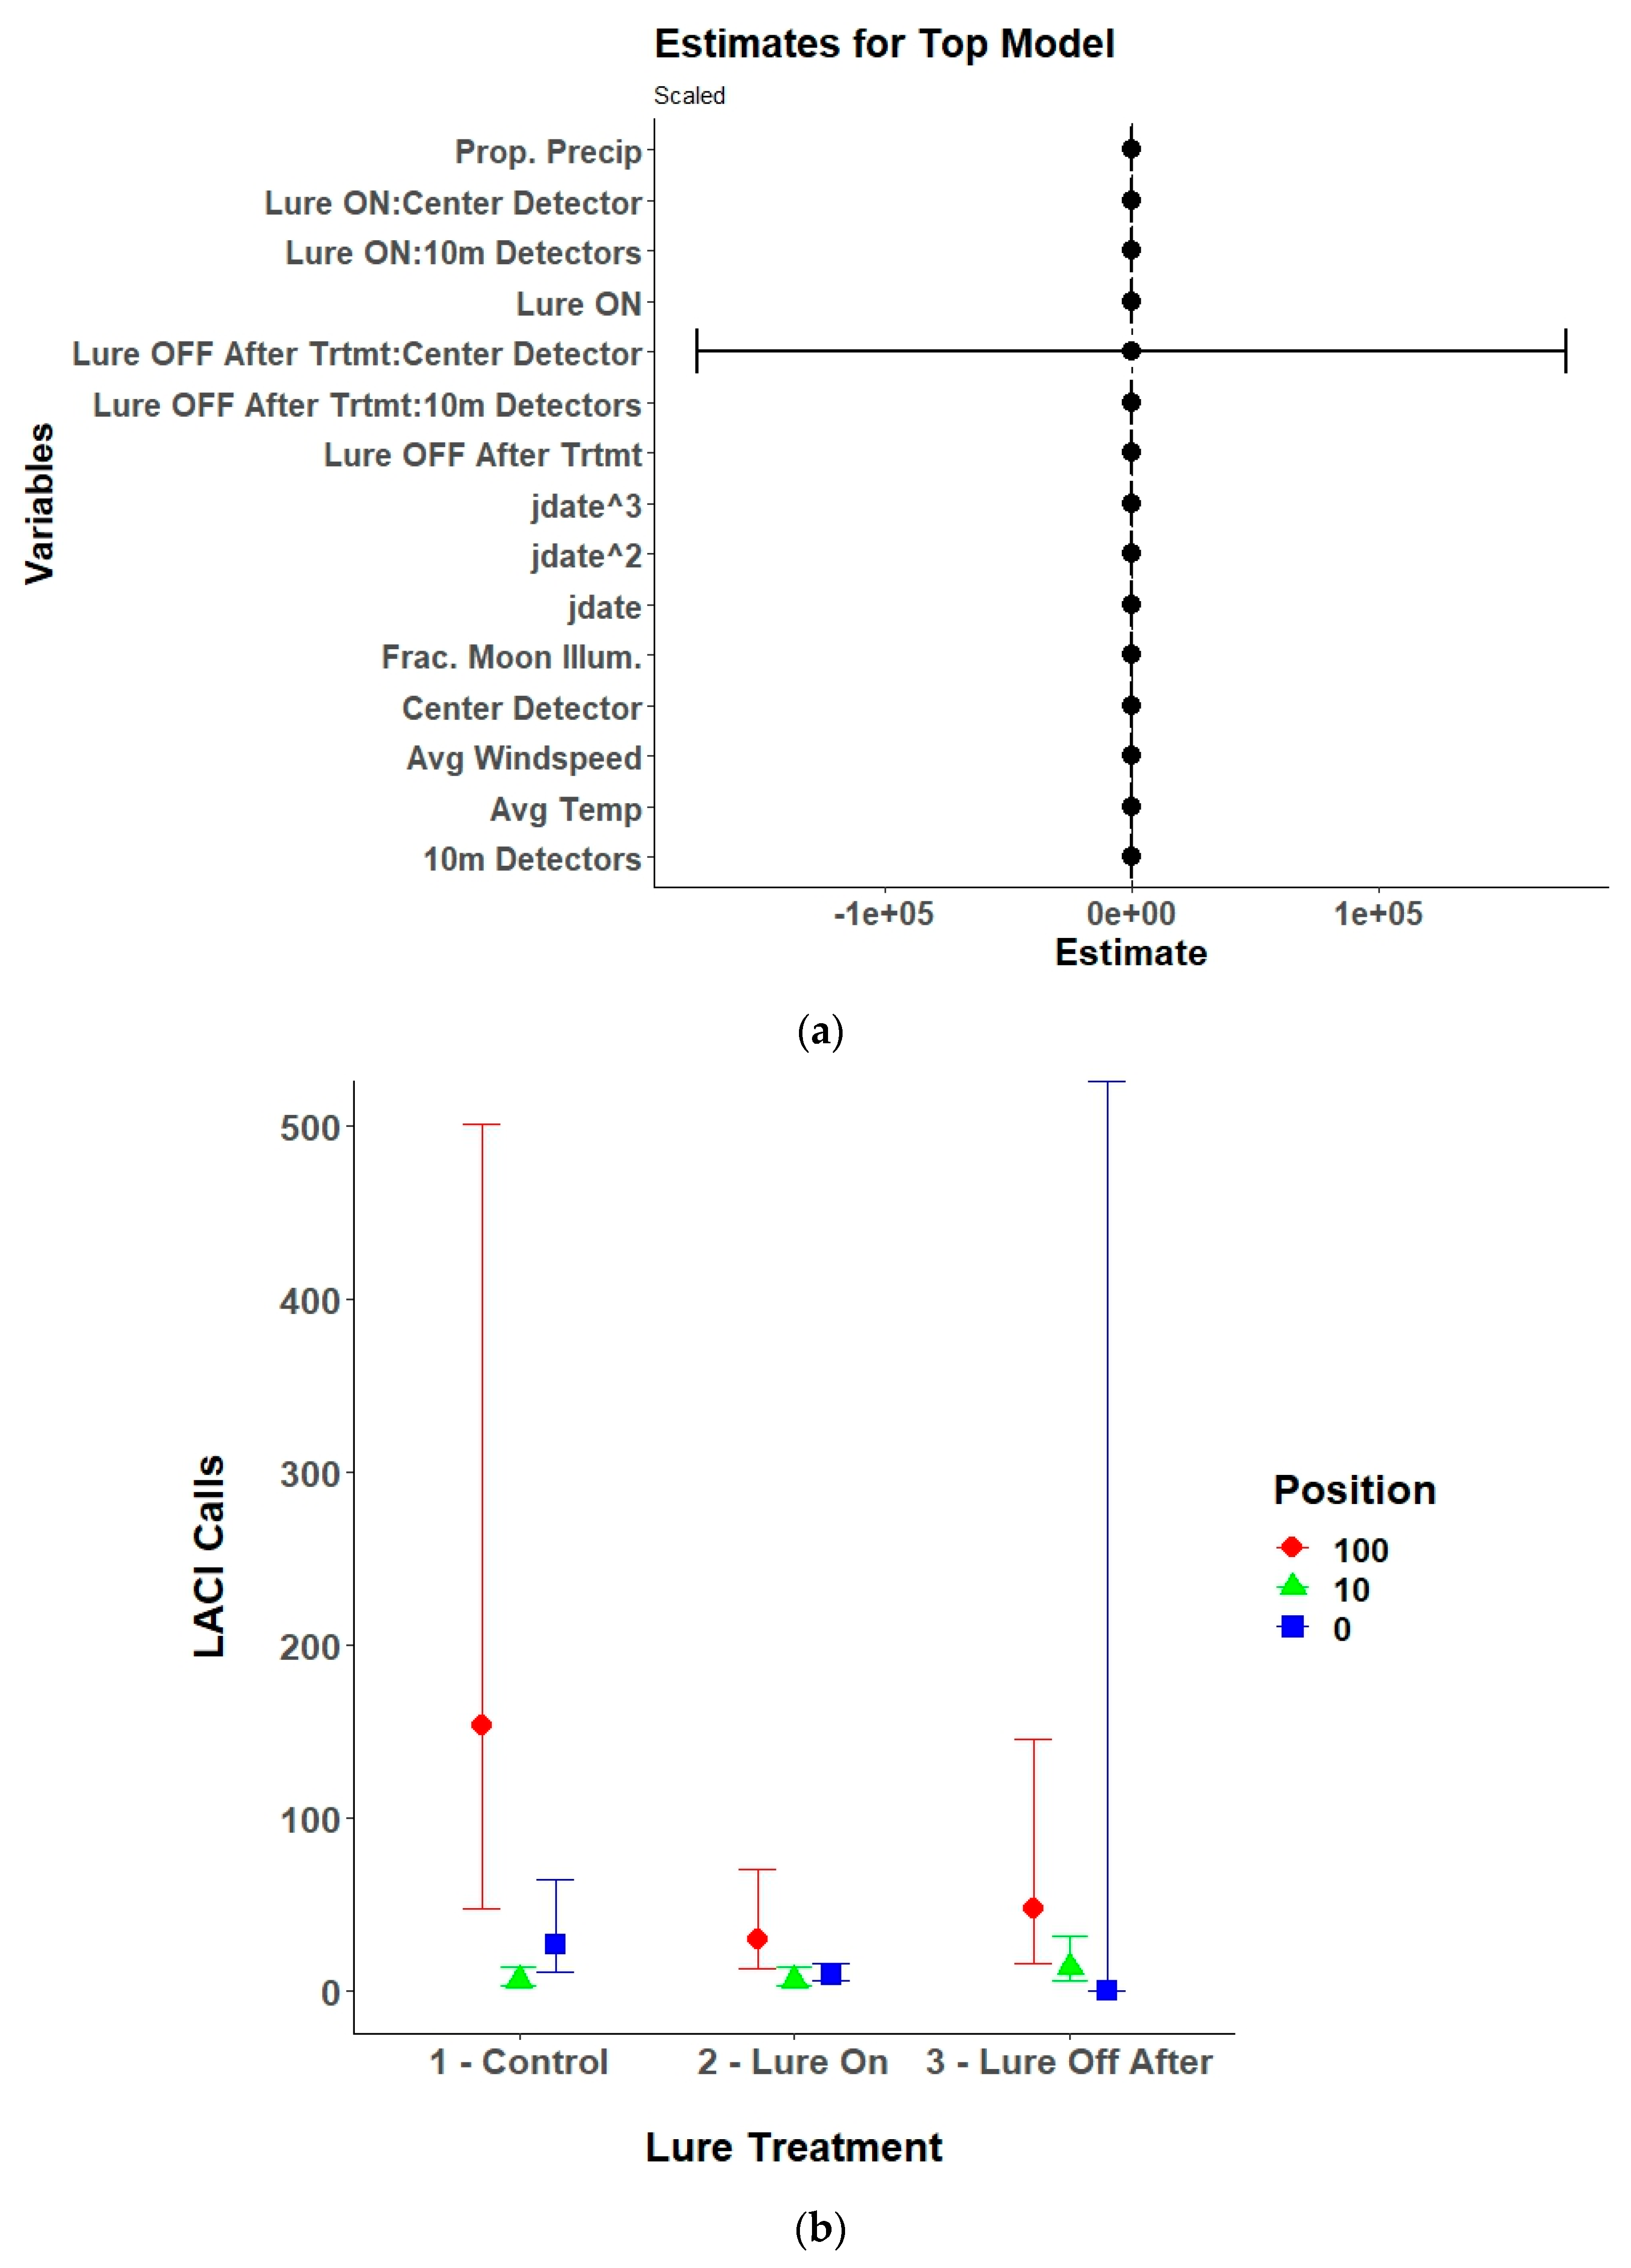
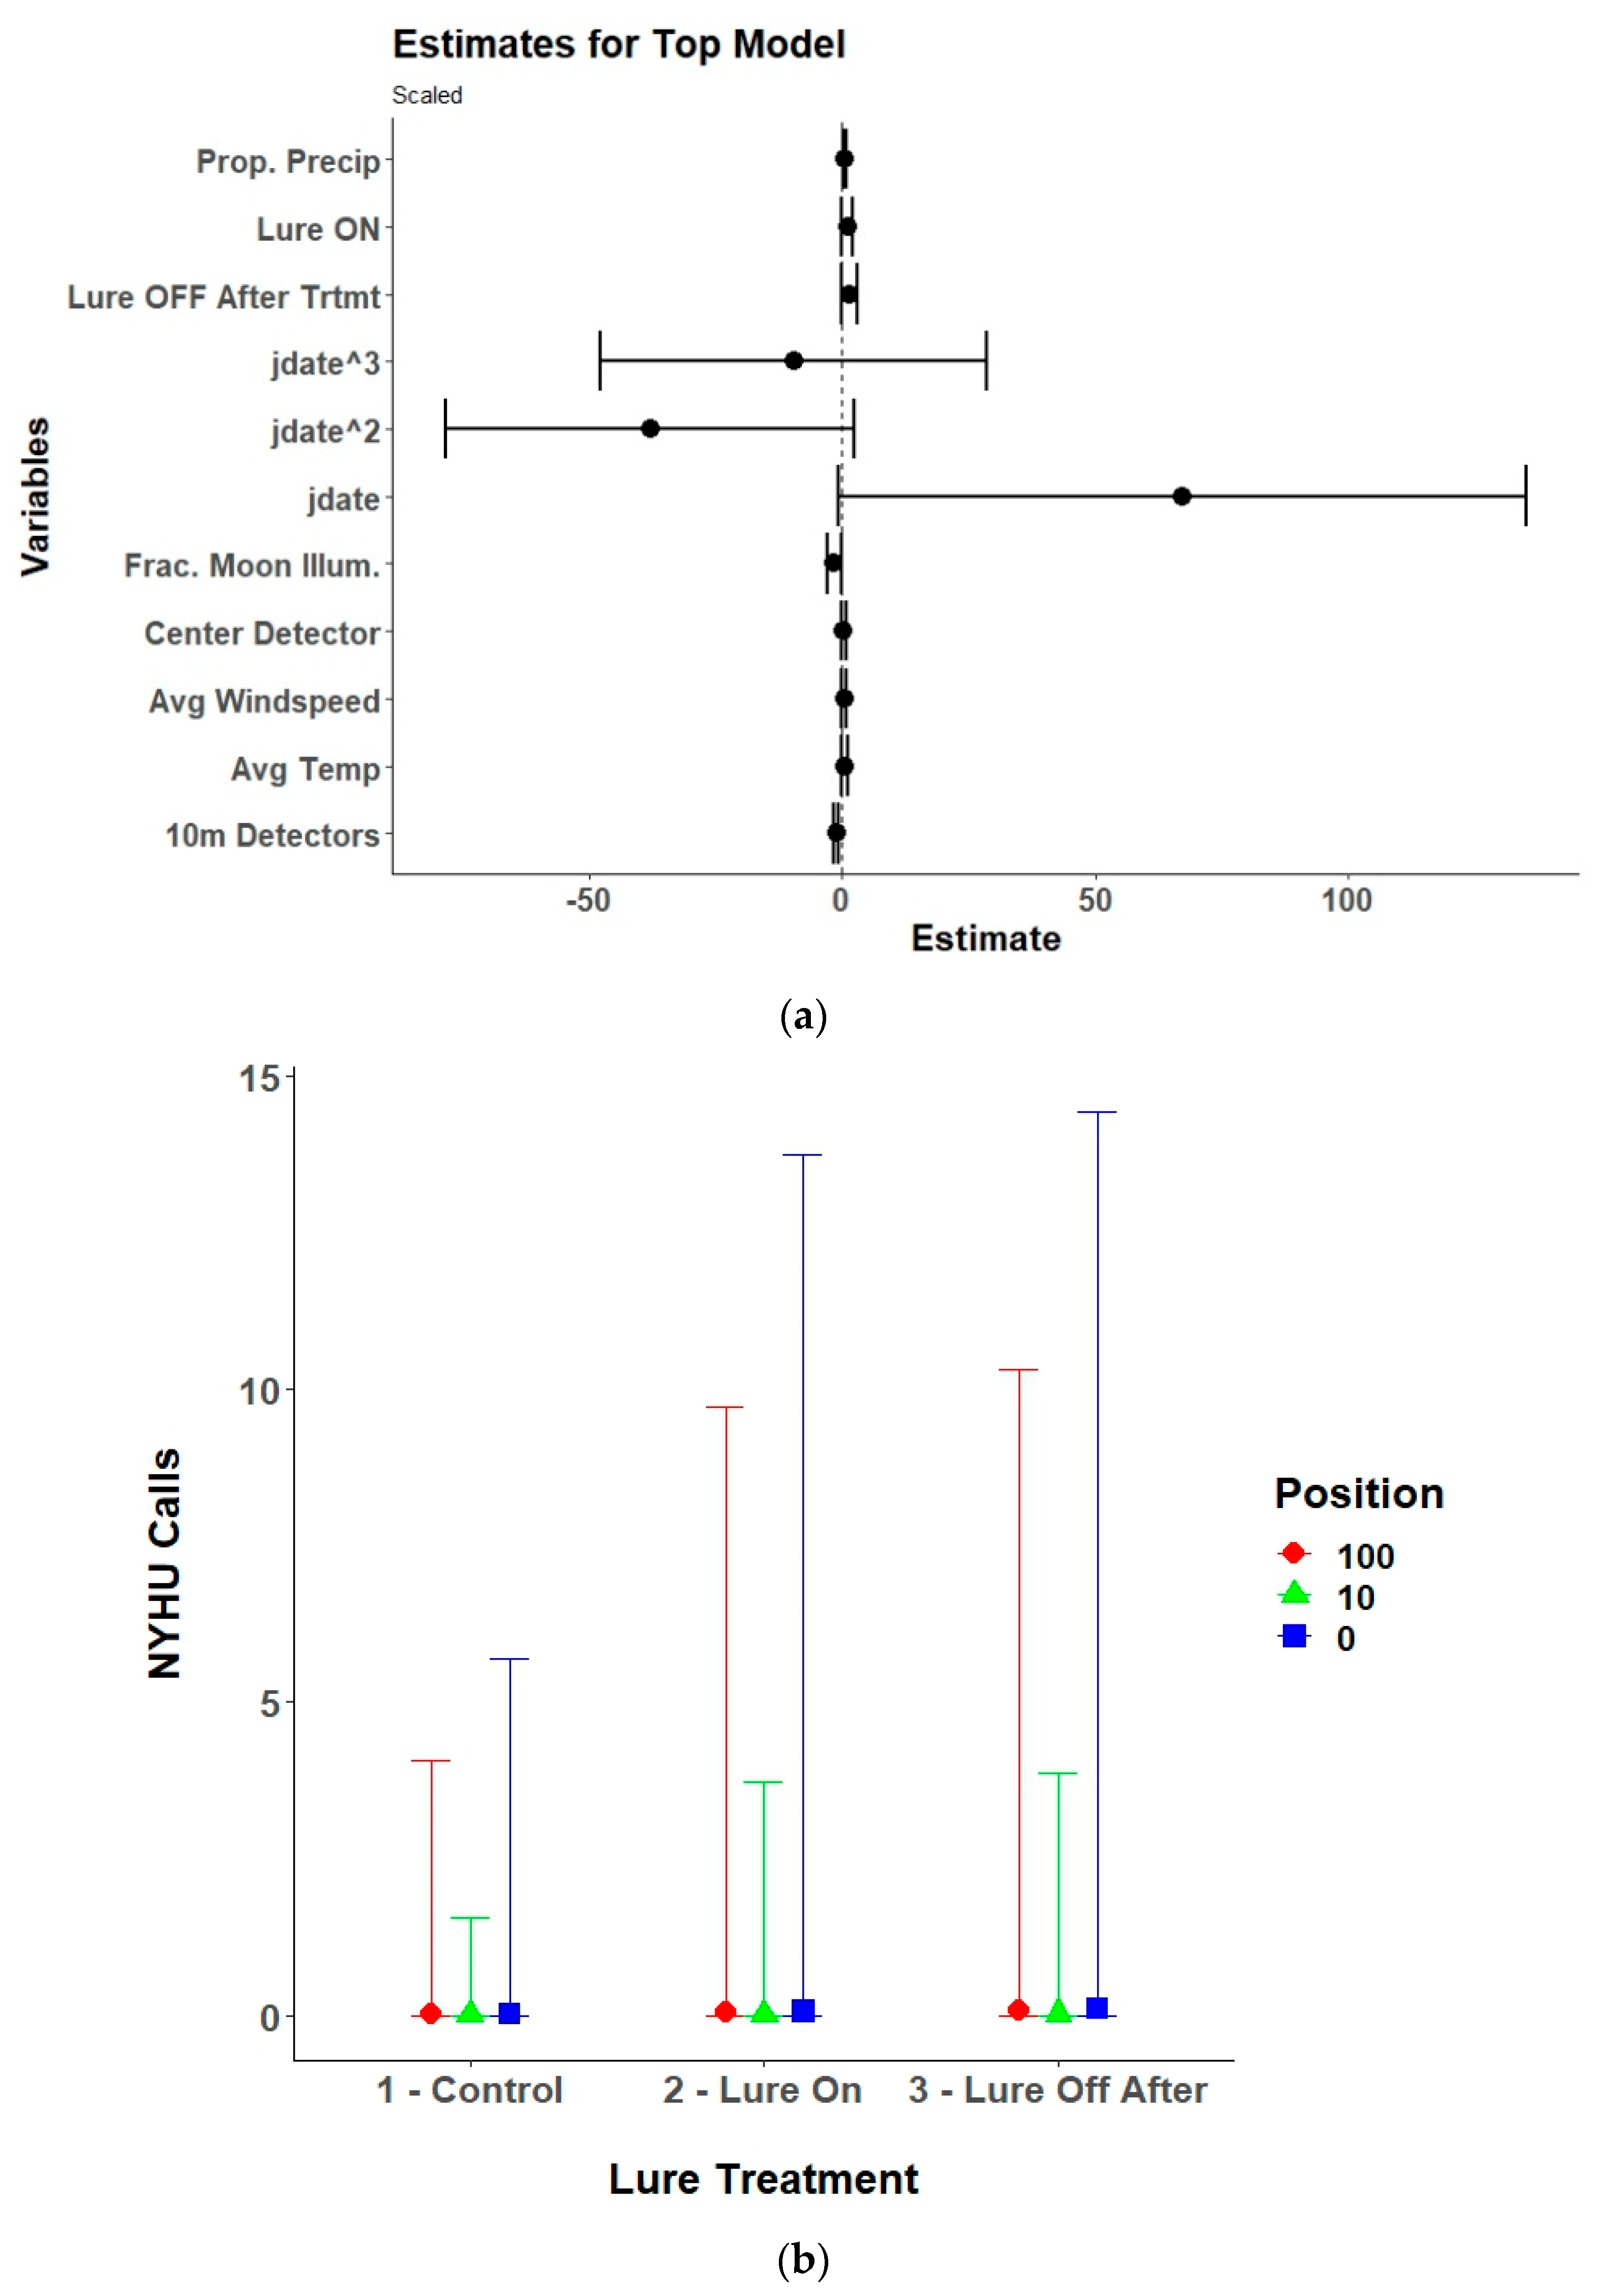
(a) Model estimates and 95% confidence intervals from the selected top generalized linear mixed model for North American hoary bats (Lasiurus cinereus; LACI) showing the response of received North American hoary bat echolocation passes to the interaction of UV light lure treatments (control/lure off before treatment, lure on, and lure off after treatment) with detector position (center/0 m, 10 m, and 100 m), along with environmental variables, and the linear (yday), quadratic (yday2), and cubic (yday3) day of the year at Prince William Forest Park and Marine Corps Base Quantico, VA, USA from 2020 to 2021. Environmental variables included proportion of the night with measurable precipitation (Prop. Precip), average nightly temperature (Avg. Temp), average nightly windspeed (Avg. Windspeed), and the fraction of the moon illuminated at midnight (Frac. Moon Illum.). All numeric variables are centered and scaled. (b) Estimated marginal means and 95% confidence intervals from the top selected model for North American hoary bats showing model predictions for North American hoary bat echolocation passes during the three different UV lure treatments conditions at the three different detector positions. Lure treatment conditions included light off before treatment (control), light on, and light off after treatment. Detector positions included the center/0 m, 10 m, and 100 m positions.
![Animals 15 02458 g007 Animals 15 02458 g007]()
Figure 8.
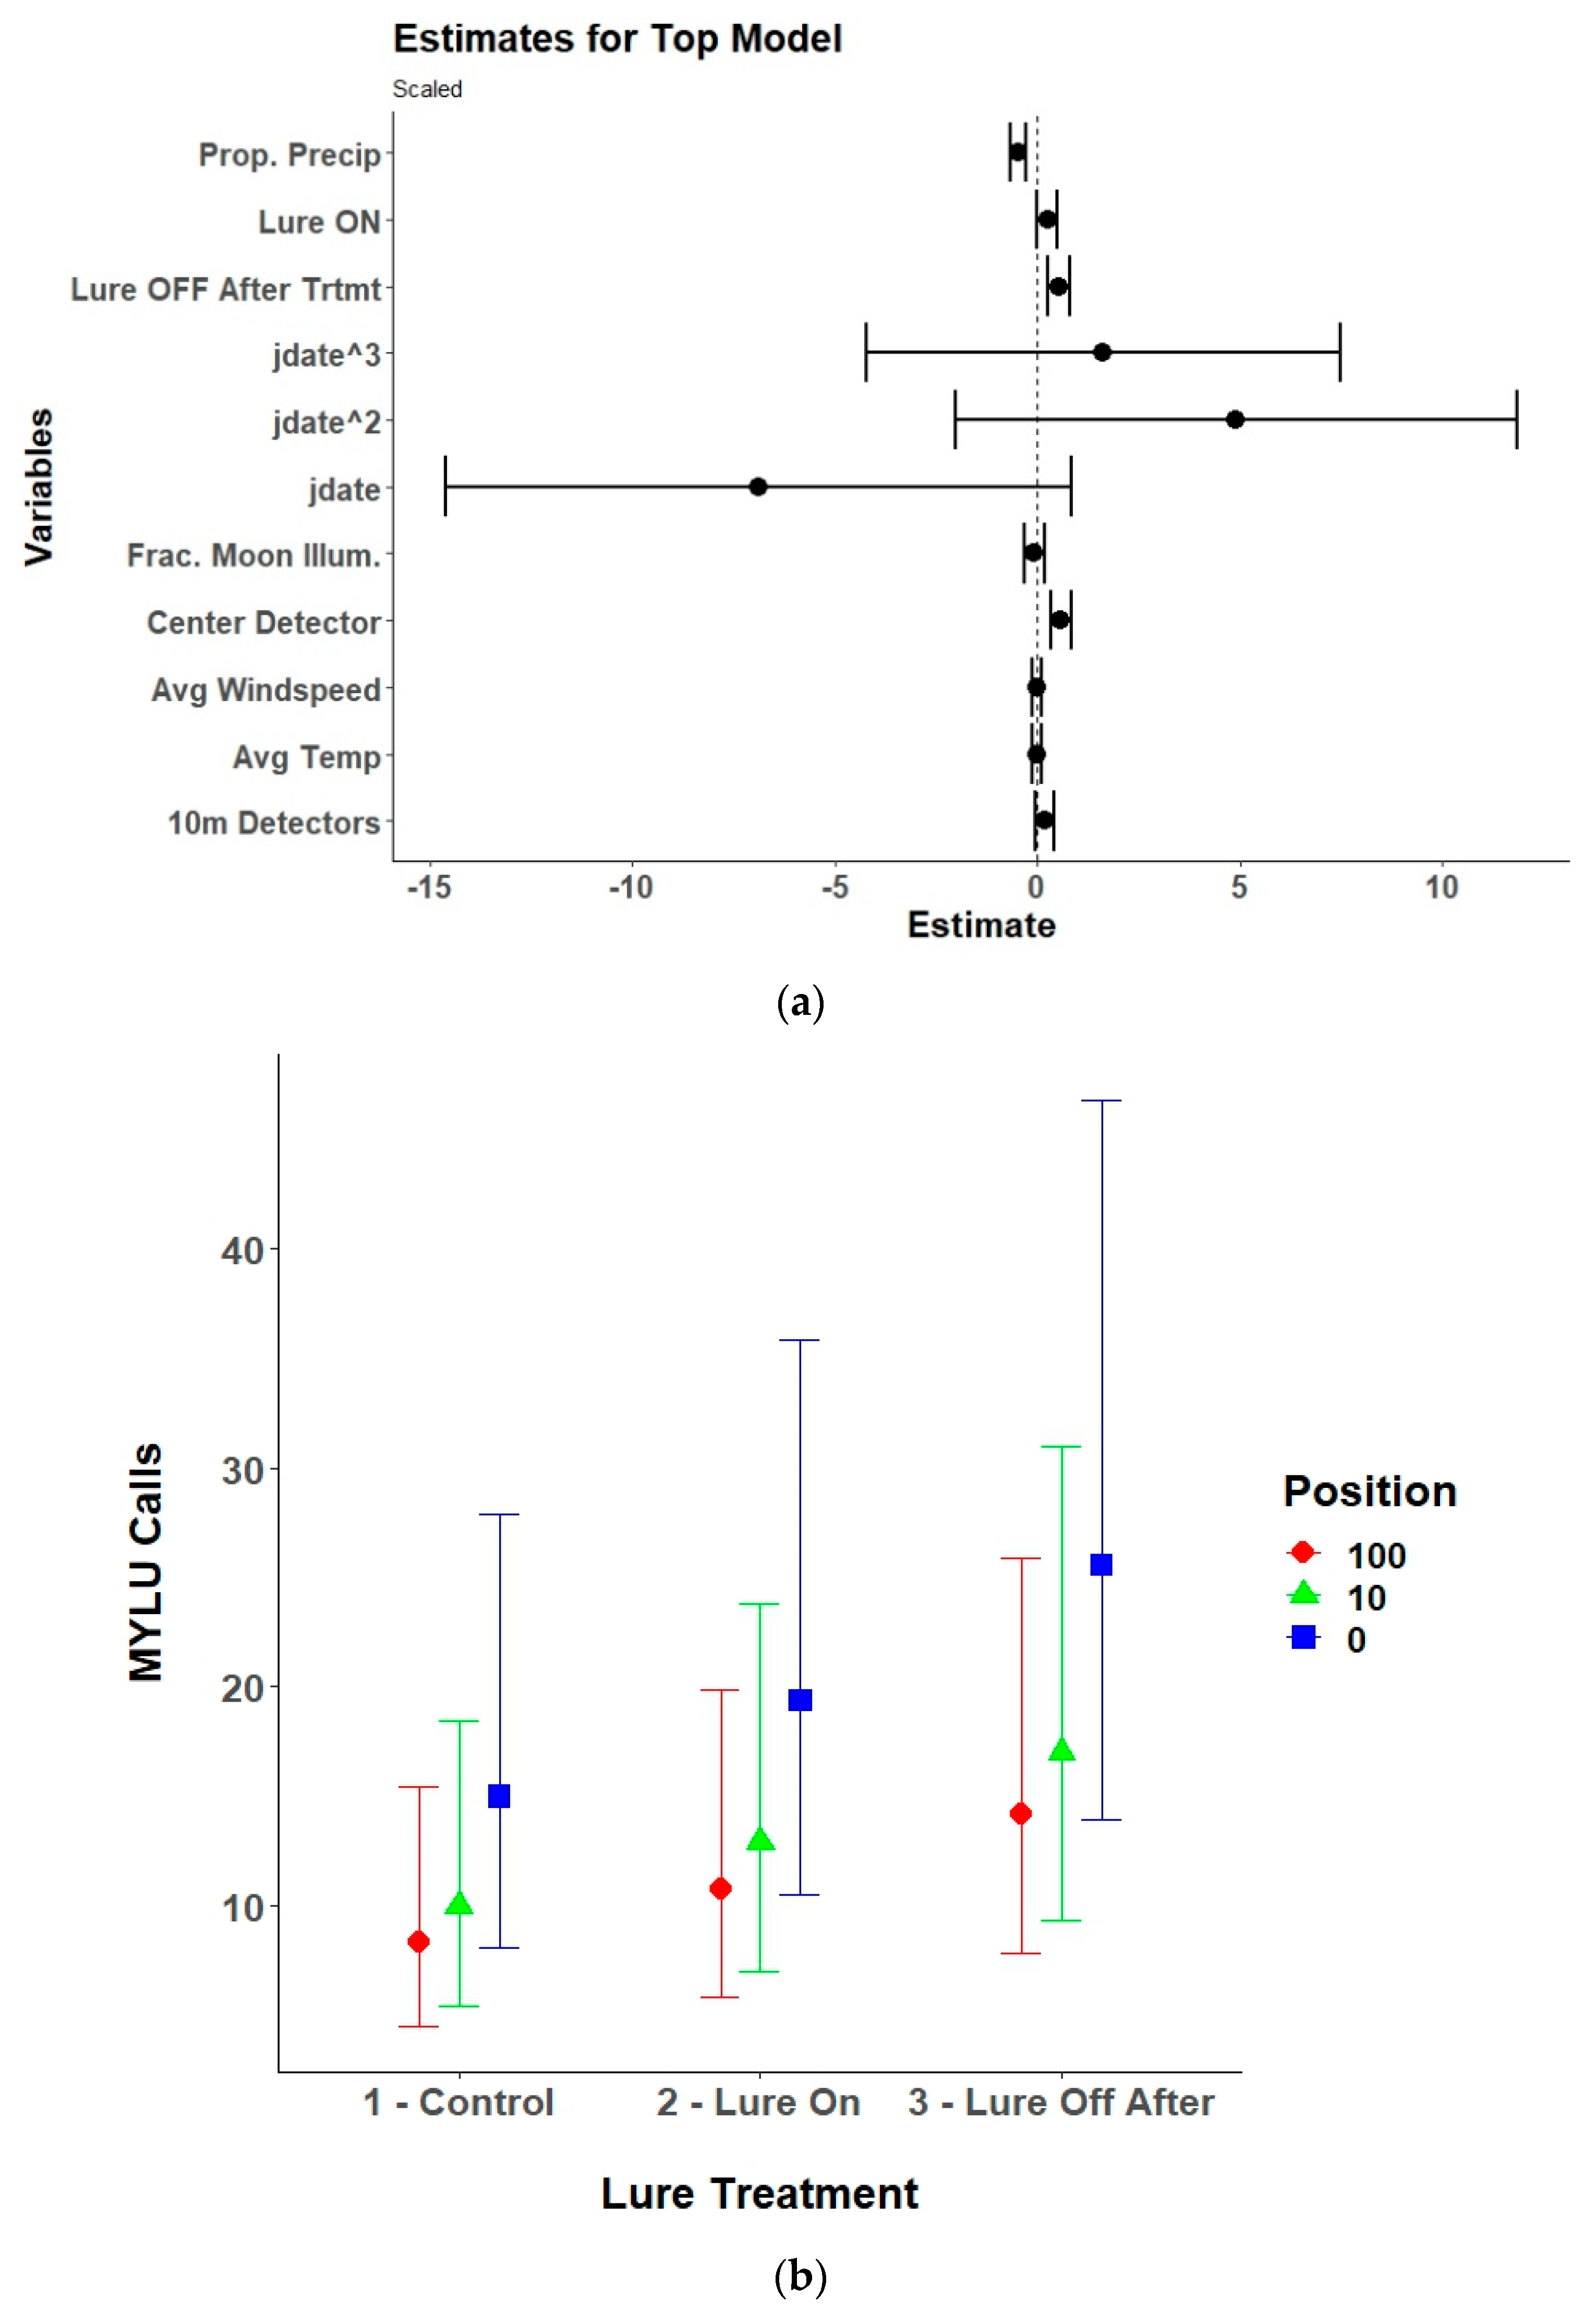
(a) Model estimates and 95% confidence inervals from the selected top generalized linear mixed model for little brown bats (Myotis lucifugus; MYLU) showing the response of received little brown bat echolocation passes to the UV light lure treatments (control/lure off before treatment, lure on, and lure off after treatment), detector position (center/0 m, 10 m, and 100 m), environmental variables, and the linear (yday), quadratic (yday2), and cubic (yday3) day of the year at Prince William Forest Park and Marine Corps Base Quantico, VA, USA from 2020 to 2021. Environmental variables included proportion of the night with measurable precipitation (Prop. Precip), average nightly temperature (Avg. Temp), average nightly windspeed (Avg. Windspeed), and the fraction of the moon illuminated at midnight (Frac. Moon Illum.). All numeric variables are centered and scaled. (b) Estimated marginal means and 95% confidence intervals from the top selected model for little brown bats showing model predictions for little brown bat echolocation passes during the three different UV lure treatments conditions at the three different detector positions. Lure treatment conditions included light off before treatment (control), light on, and light off after treatment. Detector positions included the center/0 m, 10 m, and 100 m positions.
![Animals 15 02458 g008 Animals 15 02458 g008]()
Figure 9.
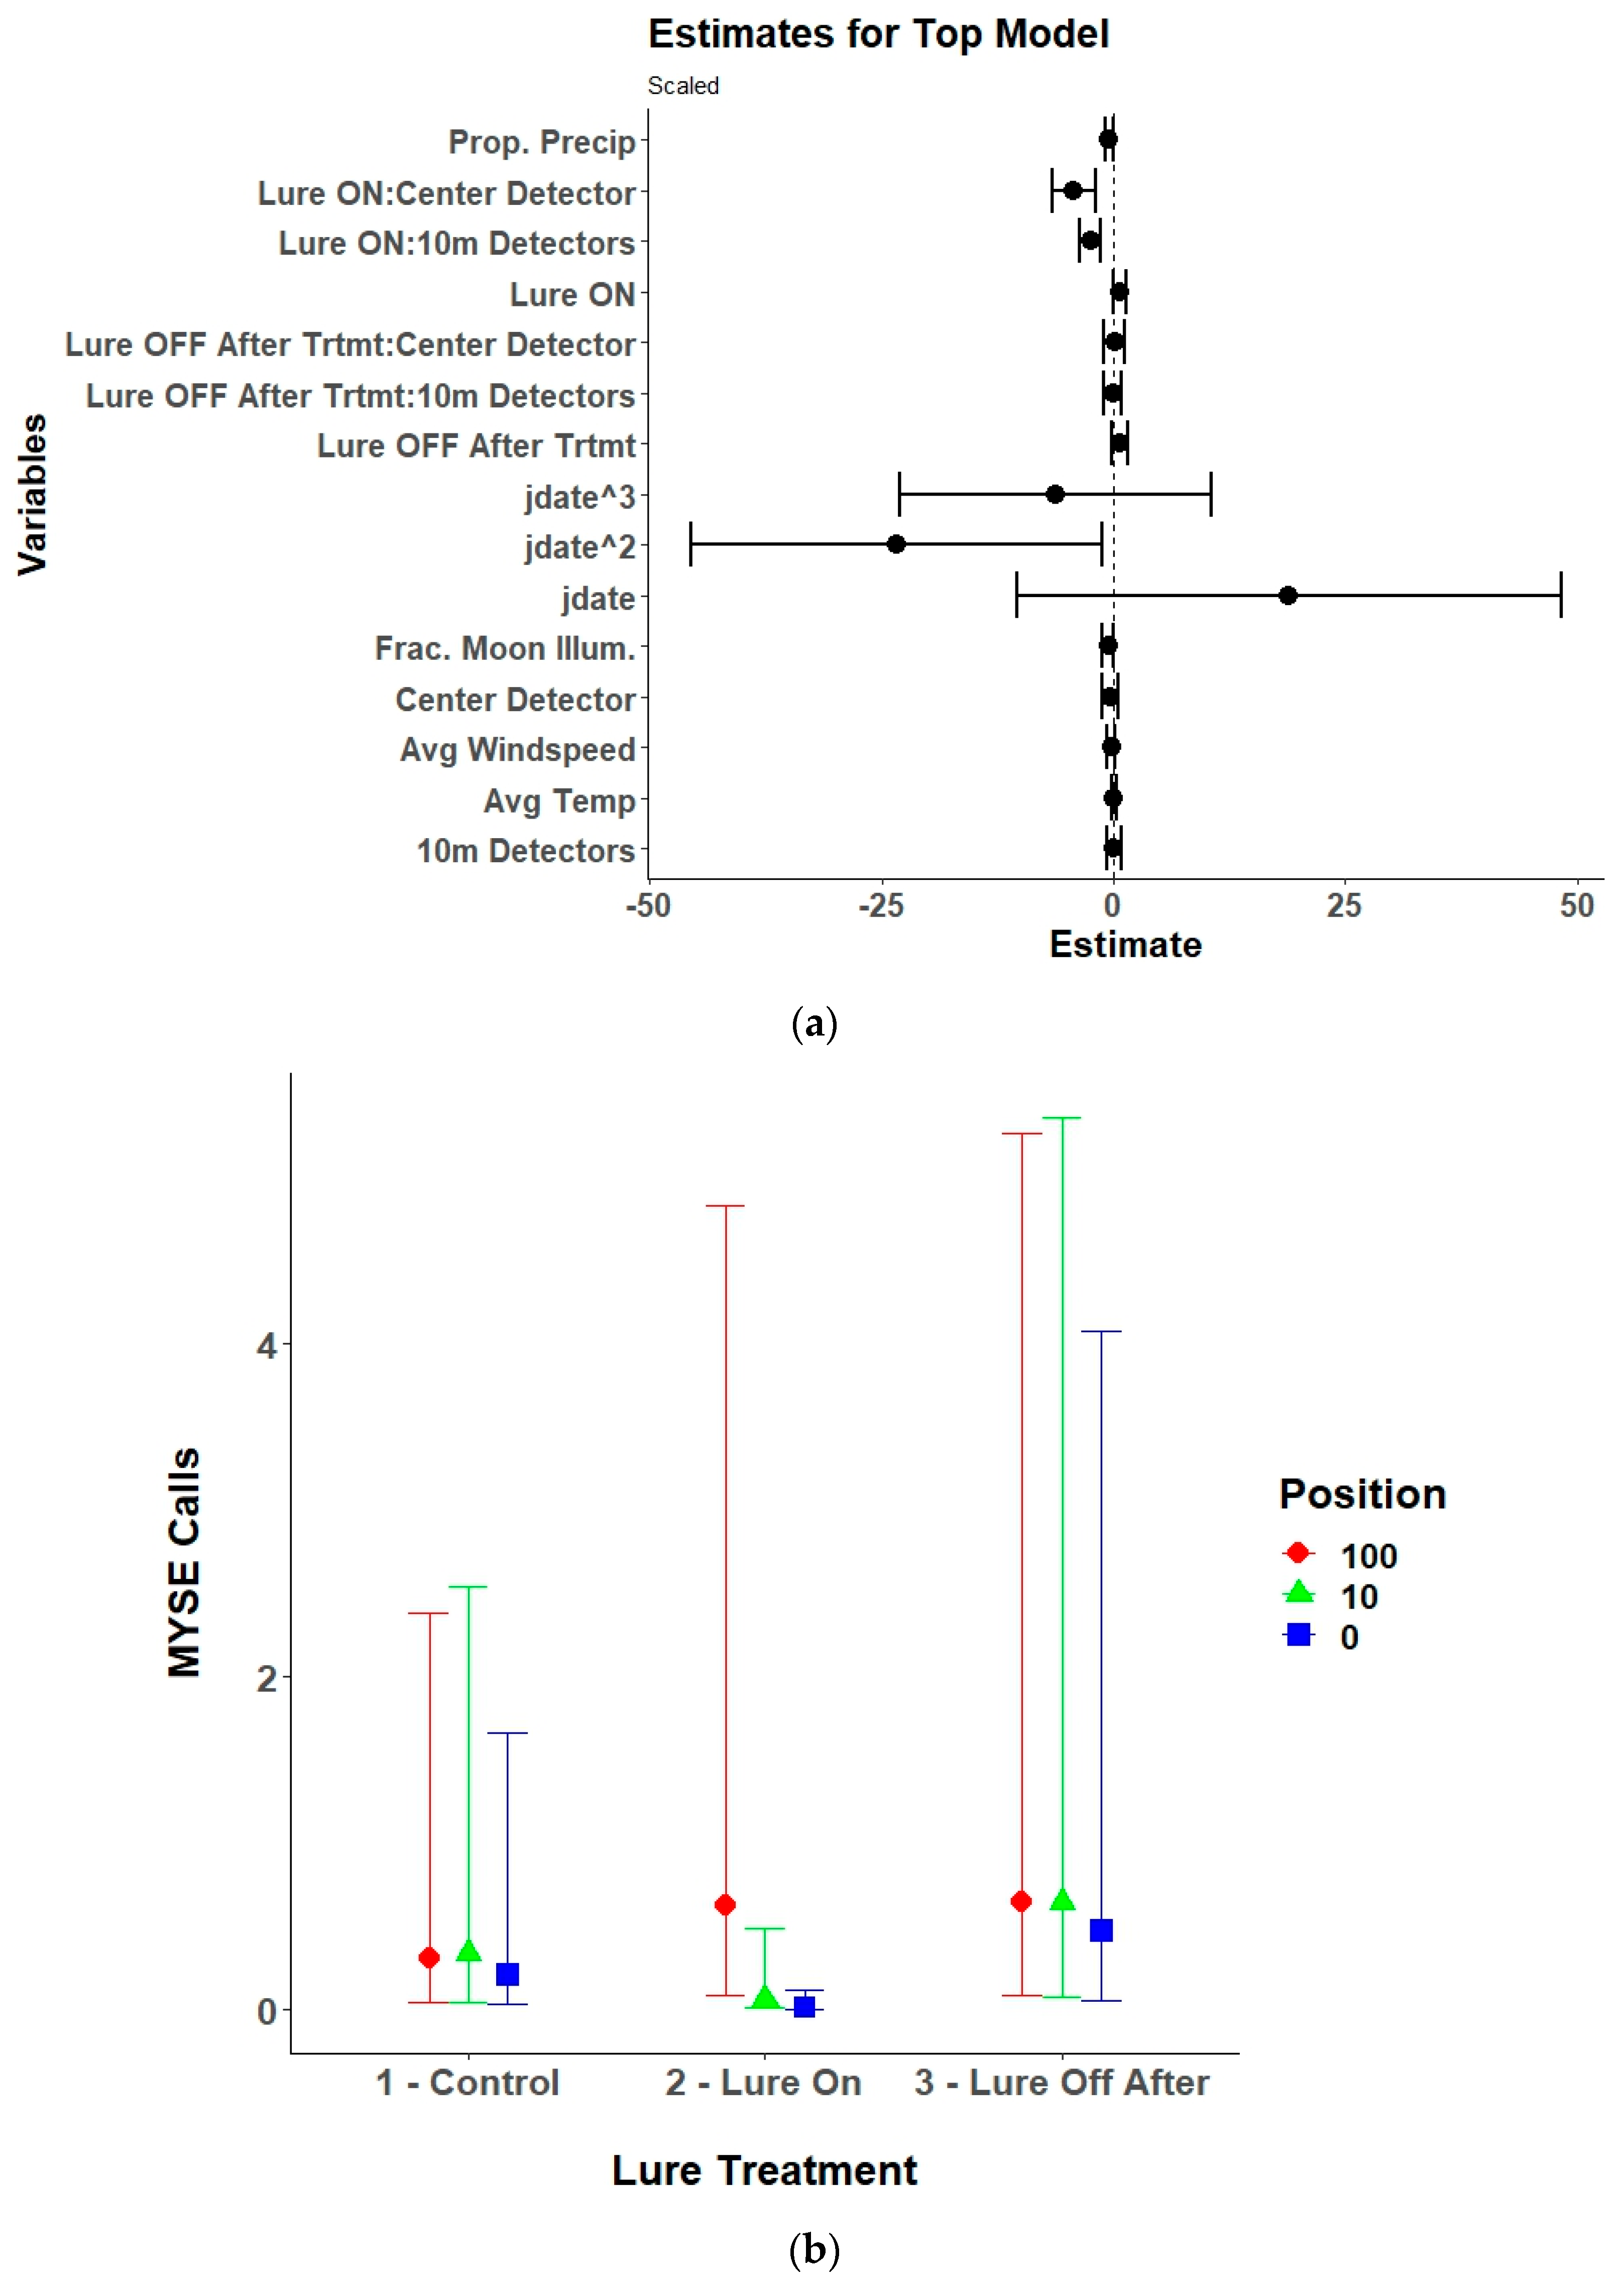
(a) Model estimates and 95% confidence intervals from the selected top generalized linear mixed model for northern long-eared bats (Myotis septentrionalis; MYSE) showing the response of received northern long-eared bat echolocation passes to the interaction of UV light lure treatments (control/lure off before treatment, lure on, and lure off after treatment) with detector position (center/0 m, 10 m, and 100 m), along with environmental variables, and the linear (yday), quadratic (yday2), and cubic (yday3) day of the year at Prince William Forest Park and Marine Corps Base Quantico, VA, USA from 2020 to 2021. Environmental variables included proportion of the night with measurable precipitation (Prop. Precip), average nightly temperature (Avg. Temp), average nightly windspeed (Avg. Windspeed), and the fraction of the moon illuminated at midnight (Frac. Moon Illum.). All numeric variables are centered and scaled. (b) Estimated marginal means and 95% confidence intervals from the top selected model for northern long-eared bats showing model predictions for northern long-eared bat echolocation passes during the three different UV lure treatments conditions at the three different detector positions. Lure treatment conditions included light off before treatment (control), light on, and light off after treatment. Detector positions included the center/0 m, 10 m, and 100 m positions.
![Animals 15 02458 g009 Animals 15 02458 g009]()
Figure 10.
(a) Model estimates and 95% confidence intervals from the selected top generalized linear mixed model for evening bats (Nycticeus humeralis; NYHU) showing the response of received evening bat echolocation passes to the UV light lure treatments (control/lure off before treatment, lure on, and lure off after treatment), detector position (center/0 m, 10 m, and 100 m), environmental variables, and the linear (yday), quadratic (yday2), and cubic (yday3) day of the year at Prince William Forest Park and Marine Corps Base Quantico, VA, USA from 2020 to 2021. Environmental variables included proportion of the night with measurable precipitation (Prop. Precip), average nightly temperature (Avg. Temp), average nightly windspeed (Avg. Windspeed), and the fraction of the moon illuminated at midnight (Frac. Moon Illum.). All numeric variables are centered and scaled. (b) Estimated marginal means and 95% confidence intervals from the top selected model for evening bats showing model predictions for evening bat echolocation passes during the three different UV lure treatments conditions at the three different detector positions. Lure treatment conditions included light off before treatment (control), light on, and light off after treatment. Detector positions included the center/0 m, 10 m, and 100 m positions.
![Animals 15 02458 g010 Animals 15 02458 g010]()
Figure 11.
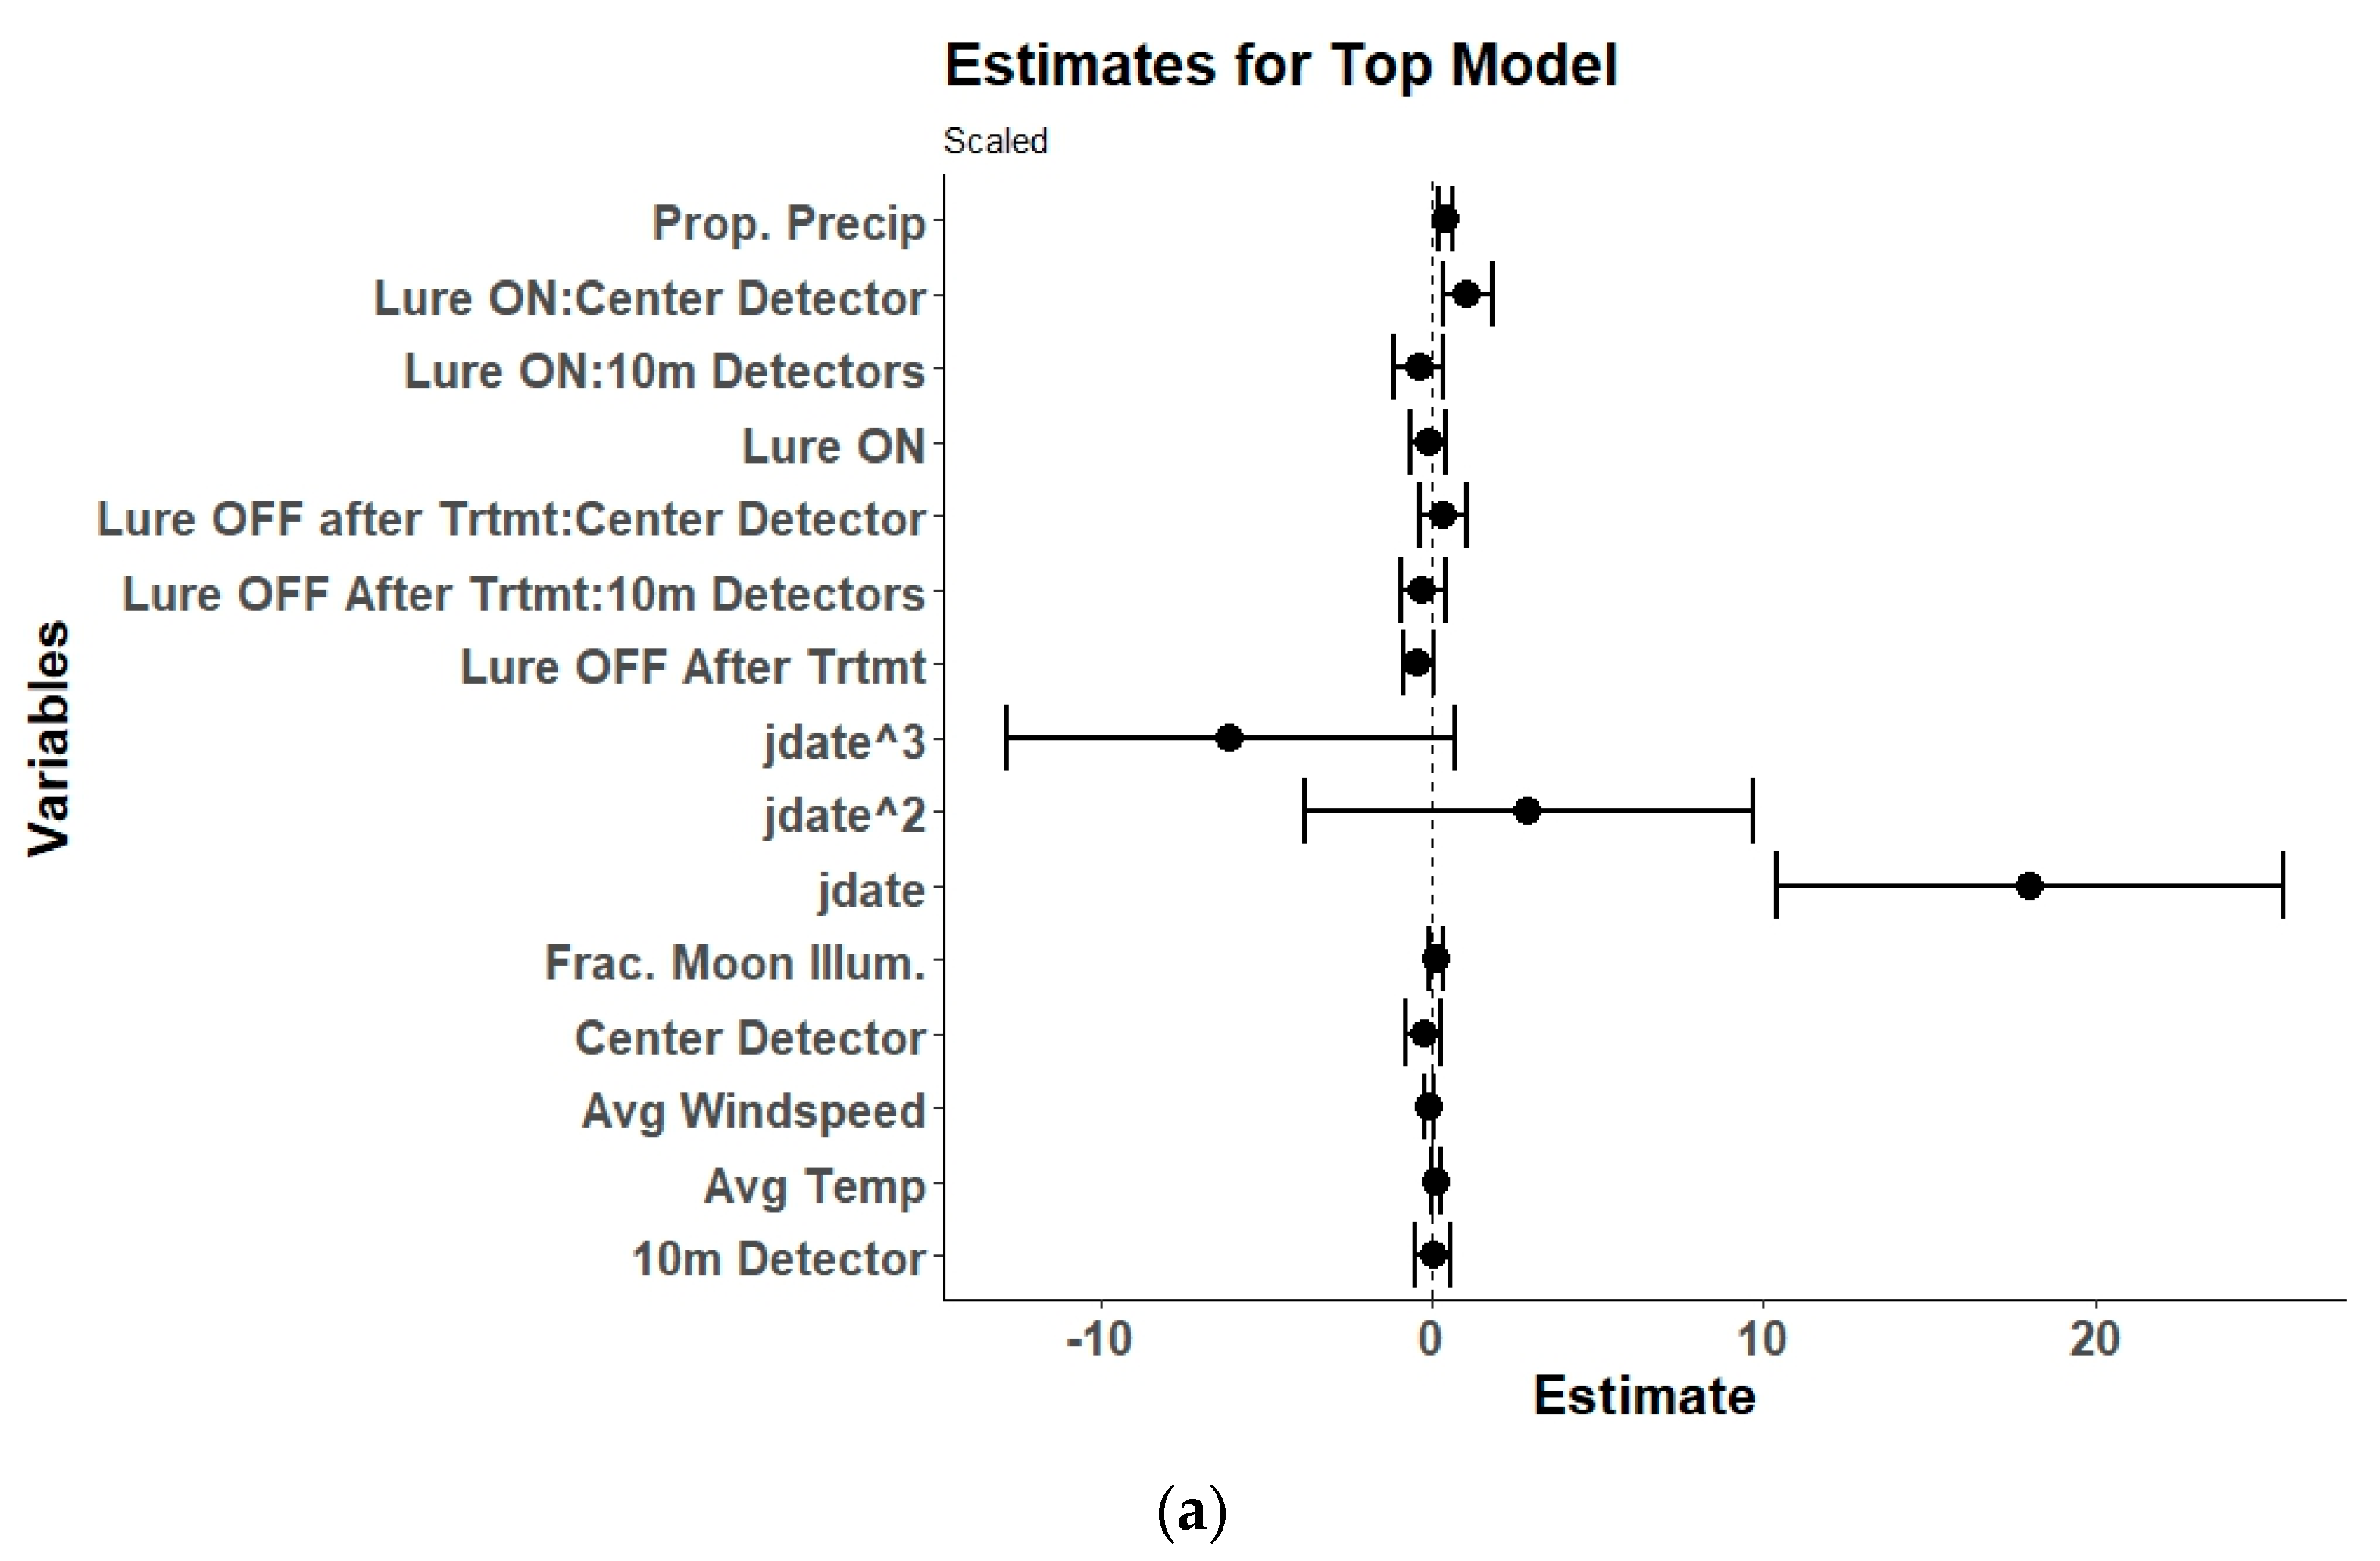
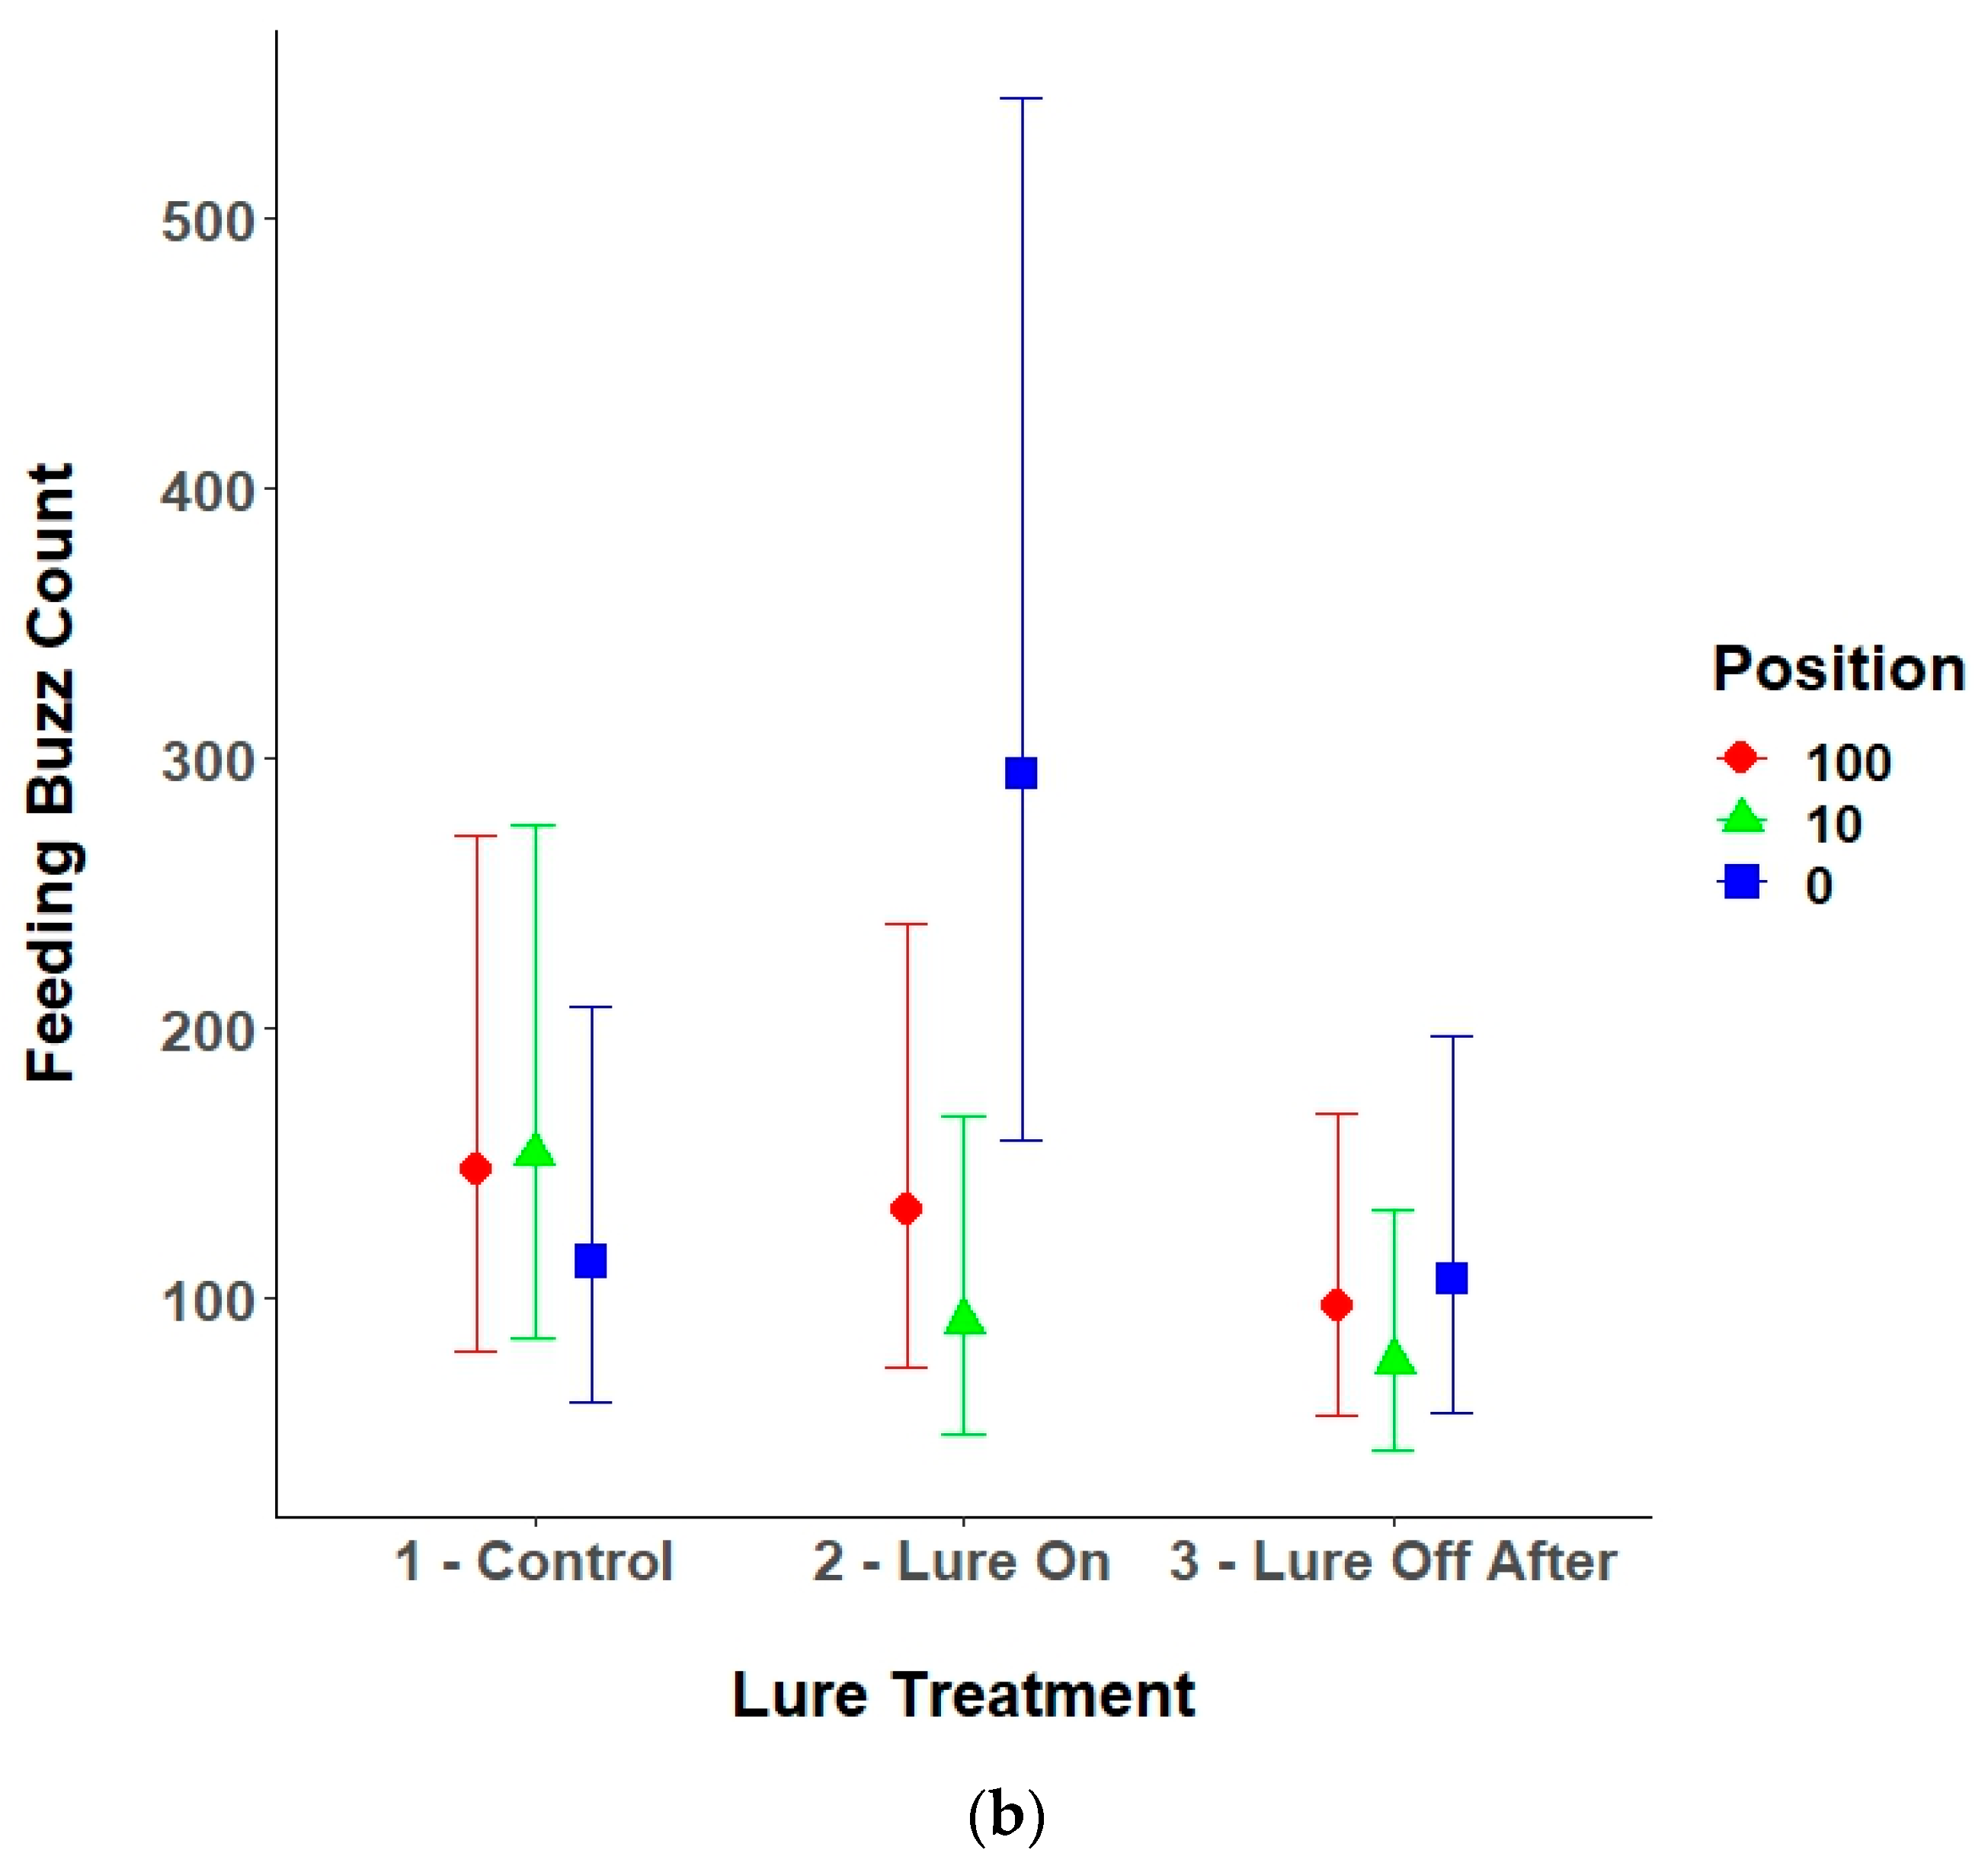
(a) Model estimates and 95% confidence intervals from the selected top generalized linear mixed model for bat feeding buzzes showing the response of received feeding buzz passes to the interaction of UV light lure treatments (control/lure off before treatment, lure on, and lure off after treatment) with detector position (center/0 m, 10 m, and 100 m), along with environmental variables, and the linear (yday), quadratic (yday2), and cubic (yday3) day of the year at Prince William Forest Park and Marine Corps Base Quantico, VA, USA from 2020 to 2021. Environmental variables included proportion of the night with measurable precipitation (Prop. Precip), average nightly temperature (Avg. Temp), average nightly windspeed (Avg. Windspeed), and the fraction of the moon illuminated at midnight (Frac. Moon Illum.). All numeric variables are centered and scaled. (b) Estimated marginal means and 95% confidence intervals from the top selected model for feeding buzzes showing model predictions for feeding buzz passes during the three different UV lure treatments conditions at the three different detector positions. Lure treatment conditions included light off before treatment (control), light on, and light off after treatment. Detector positions included the center/0 m, 10 m, and 100 m positions.
![Animals 15 02458 g011a Animals 15 02458 g011a]()
![Animals 15 02458 g011b Animals 15 02458 g011b]()
Table 1.
List of the ten a priori generalized linear mixed models (GLMMs) used to model the effect of the UV light lure (Lure) and detector position (Distance) within a site along with environmental variables on received echolocation passes of bats at Prince William Forest Park and Marine Corps Base Quantico, VA, USA, 2020–2021. The environmental variables included fraction of the moon illuminated at midnight (Moon), proportion of the night with measurable precipitation (Precipitation), average nightly temperature (Temperature), average nightly windspeed (Windspeed), and day of the year (yday). Day of the year includes a linear, quadratic, and cubic term. Lure treatment consists of three conditions: lure off before treatment, lure on, lure off after treatment. Detection position (Distance) includes 100 m, 10 m, and 0 m (at the lure). A plus sign (+) indicates an additive effect and an asterisk (*) indicates an interactive effect.
| Model Name | Formula |
|---|
| Null | ~1 |
| Global with Interaction | ~Lure * Distance + Precipitation + Temperature + Windspeed + Moon + poly(yday, factor = 3) + (1|Site) |
| Global | ~Lure + Distance + Precipitation + Temperature + Windspeed + Moon + poly(yday, factor = 3) + (1|Site) |
| Lure | ~Lure + poly(yday, factor = 3) + (1|Site) |
| Distance | ~Distance + poly(yday, factor = 3) + (1|Site) |
| Lure and Distance | ~Lure + Distance + poly(yday, factor = 3) + (1|Site) |
| Lure and Distance Interaction | ~Lure * Distance + poly(yday, factor = 3) + (1|Site) |
| Weather | ~Precipitation + Temperature + Windspeed + Moon + poly(yday, factor = 3) + (1|Site) |
| Lure and Weather | ~Lure + Precipitation + Temperature + Windspeed + Moon + poly(yday, factor = 3) + (1|Site) |
| Distance and Weather | ~Distance + Precipitation + Temperature + Windspeed + Moon + poly(yday, factor = 3) + (1|Site) |
Table 2.
Top model selected for each species of bat (top), all species combined (middle), and feeding buzzes (bottom) using Akaike Information Criteria corrected for small sample size (AICc) at Prince William Forest Park and Marine Corps Base Quantico, VA, USA, 2020–2021. We considered models that were within two delta AICc of the top model and then selected the most parsimonious model that included the lure treatment effect. Models that did not converge were not included in the final model set. For full AICc model selection tables, see
Appendix A. Models that included a significant effect of lure treatment (
p < 0.05) are indicated by an asterisk.
| Species | Top Model | ωi |
|---|
| Eastern red bat (Lasiurus borealis) | Lure and Weather * | 0.82 |
| Big brown bat (Eptesicus fuscus) | Lure | 0.45 |
| Little brown bat (Myotis lucifugus) | Global no interaction * | 0.94 |
| Northern long-eared bat (Myotis septentrionalis) | Global with interaction * | 0.91 |
| North American hoary bat (Lasiurus cinereus) | Global with interaction * | 0.45 |
| Indiana bat (Myotis sodalis) | Distance | 0.51 |
| Evening bat (Nycticeus humeralis) | Global no interaction * | 0.37 |
| Tricolored bat (Perimyotis subflavus) | Distance and weather | 0.72 |
| Silver-haired bat (Lasionycteris noctivagans) | did not converge | NA |
| Brazilian free-tailed bat (Tadarida brasiliensis) | Null | NA |
| All Species Combined | Lure and Weather | 0.41 |
| Feeding Buzzes | Global with Interaction * | 0.94 |
Table 3.
Model AIC ranking table (top), model output for the selected top generalized linear mixed model (middle), and preplanned orthogonal contrasts (bottom) for the eastern red bat (Lasiurus borealis) showing the response of received eastern red bat echolocation passes to the UV lure treatments, environmental variables, and the linear (yday), quadratic (yday2), and cubic (yday3) day of the year at Prince William Forest Park and Marine Corps Base Quantico, VA, USA, 2020–2021. Environmental variables included proportion of the night with measurable precipitation (Prop. Precip), average nightly temperature (Avg. Temp), average nightly windspeed (Avg. Windspeed), and the fraction of the moon illuminated at midnight (Frac. Moon Illum.). All numeric variables are centered and scaled. The coefficient values (β), standard errors (SE), 95% lower (LCL) and upper (UCL) confidence levels, and p values are shown. The contrasts test preplanned comparisons between lure treatment levels.
| Model | AICc | ΔAIC | ωi |
| Lure and Weather | 2633.33 | 0.00 | 0.82 |
| Global no Interaction | 2637.07 | 3.74 | 0.13 |
| Global with Interaction | 2639.08 | 5.76 | 0.05 |
| Weather Only | 2643.93 | 10.61 | <0.01 |
| Distance and Weather | 2647.66 | 14.34 | <0.01 |
| Lure Only | 2652.95 | 19.62 | <0.01 |
| Lure and Distance | 2656.08 | 22.76 | <0.01 |
| Lure, Distance, and Interaction | 2657.30 | 23.97 | <0.01 |
| Distance Only | 2676.86 | 43.53 | <0.01 |
| Null Model | 2862.54 | 229.21 | <0.01 |
| Variables | β | SE | LCL | UCL | p Value |
| Lure ON | 0.54 | 0.15 | 0.24 | 0.84 | 0.001 |
| Lure OFF After Trtmt | 0.08 | 0.17 | −0.26 | 0.41 | 0.645 |
| Prop. Precip | −0.55 | 0.10 | −0.74 | −0.36 | <0.001 |
| Avg. Temp | 0.13 | 0.08 | −0.03 | 0.29 | 0.106 |
| Avg. Windspeed | 0.07 | 0.08 | −0.08 | 0.22 | 0.389 |
| Frac. Moon Illum. | 0.09 | 0.15 | −0.21 | 0.40 | 0.547 |
| yday | −6.93 | 5.42 | −17.56 | 3.69 | 0.201 |
| yday2 | −3.65 | 5.33 | −14.10 | 6.80 | 0.494 |
| yday3 | −5.93 | 4.36 | −14.48 | 2.61 | 0.174 |
| Preplanned Contrast | β | SE | LCL | UCL | p-value |
| Before Treatment, Lure OFF versus Lure ON | 0.54 | 0.15 | 0.19 | 0.89 | 0.001 |
| Before Treatment, Lure OFF versus After Treatment, Lure OFF | 0.08 | 0.17 | −0.30 | 0.46 | 0.645 |
Table 4.
Model AIC ranking table (top), model output for the selected top generalized linear mixed model (middle), and preplanned orthogonal contrasts (bottom) for feeding buzzes showing the response of received feeding buzz passes to the UV lure treatments, detector position, an interaction between lure treatment and detector position, environmental variables, and the linear (yday), quadratic (yday2), and cubic (yday3) day of the year at Prince William Forest Park and Marine Corps Base Quantico, VA, USA 2020–2021. Environmental variables included proportion of the night with measurable precipitation (Prop. Precip), average nightly temperature (Avg. Temp), average nightly windspeed (Avg. Windspeed), and the fraction of the moon illuminated at midnight (Frac. Moon Illum.). All numeric variables are centered and scaled. The coefficient values (β), standard errors (SE), 95% lower (LCL) and upper (UCL) confidence levels, and p values are shown. The contrasts test preplanned comparisons between lure treatment levels and bat detector positions within a site.
| Model | AICc | ΔAIC | ωi |
| Global with Interaction | 5259.90 | 0.00 | 0.94 |
| Global no Interaction | 5266.78 | 6.88 | 0.03 |
| Lure, Distance, and Interaction | 5267.66 | 7.76 | 0.02 |
| Lure and Weather | 5269.53 | 9.63 | 0.01 |
| Lure and Distance | 5271.08 | 11.18 | <0.01 |
| Distance and Weather | 5272.79 | 12.88 | <0.01 |
| Lure Only | 5273.86 | 13.95 | <0.01 |
| Distance Only | 5276.14 | 16.23 | <0.01 |
| Weather Only | 5276.90 | 16.99 | <0.01 |
| Null Model | 5522.56 | 262.66 | <0.01 |
| Variables | β | SE | LCL | UCL | p Value |
| Lure ON | −0.11 | 0.27 | −0.63 | 0.42 | 0.694 |
| Lure OFF After Trtmt | −0.41 | 0.25 | −0.91 | 0.08 | 0.099 |
| 10 m Detector | 0.04 | 0.27 | −0.50 | 0.57 | 0.899 |
| Center Detector | −0.26 | 0.27 | −0.79 | 0.26 | 0.326 |
| Prop. Precip | 0.40 | 0.11 | 0.19 | 0.61 | <0.001 |
| Avg. Temp | 0.12 | 0.08 | −0.03 | 0.27 | 0.129 |
| Avg. Windspeed | −0.12 | 0.07 | −0.26 | 0.02 | 0.082 |
| Frac. Moon Illum. | 0.12 | 0.11 | −0.09 | 0.33 | 0.265 |
| yday | 18.05 | 3.90 | 10.41 | 25.70 | <0.001 |
| yday2 | 2.90 | 3.46 | −3.88 | 9.69 | 0.401 |
| yday3 | −6.09 | 3.44 | −12.83 | 0.65 | 0.077 |
| Lure ON:10 m Detectors | −0.41 | 0.38 | −1.15 | 0.33 | 0.279 |
| Lure OFF After Trtmt:10 m Detectors | −0.28 | 0.34 | −0.94 | 0.39 | 0.413 |
| Lure ON:Center Detector | 1.06 | 0.38 | 0.31 | 1.81 | 0.006 |
| Lure OFF after Trtmt:Center Detector | 0.36 | 0.37 | −0.36 | 1.07 | 0.331 |
| Contrast | β | SE | LCL | UCL | p Value |
| Before Treatment, Lure OFF at Center Detector versus Lure ON at Center Detector | 0.95 | 0.28 | 0.25 | 1.65 | 0.001 |
| Before Treatment, Lure OFF at Center Detector versus After Treatment, Lure OFF at Center Detector | −0.06 | 0.28 | −0.76 | 0.65 | 0.836 |
| Lure ON at Center and 10 m Detectors versus Lure ON at 100 m Detector | −0.21 | 0.24 | −0.81 | 0.39 | 0.511 |
| Lure ON at Center Detector versus Lure ON at 10 m Detector | 1.17 | 0.27 | 0.49 | 1.84 | <0.001 |

