
Hair Metabolomic Profiling of Diseased Forest Musk Deer (Moschus berezovskii) Using Ultra-High-Performance Liquid Chromatography–Tandem Mass Spectrometry (UHPLC-MS/MS)


Simple Summary
Abstract
1. Introduction
2. Materials and Methods
2.1. Hair Collection
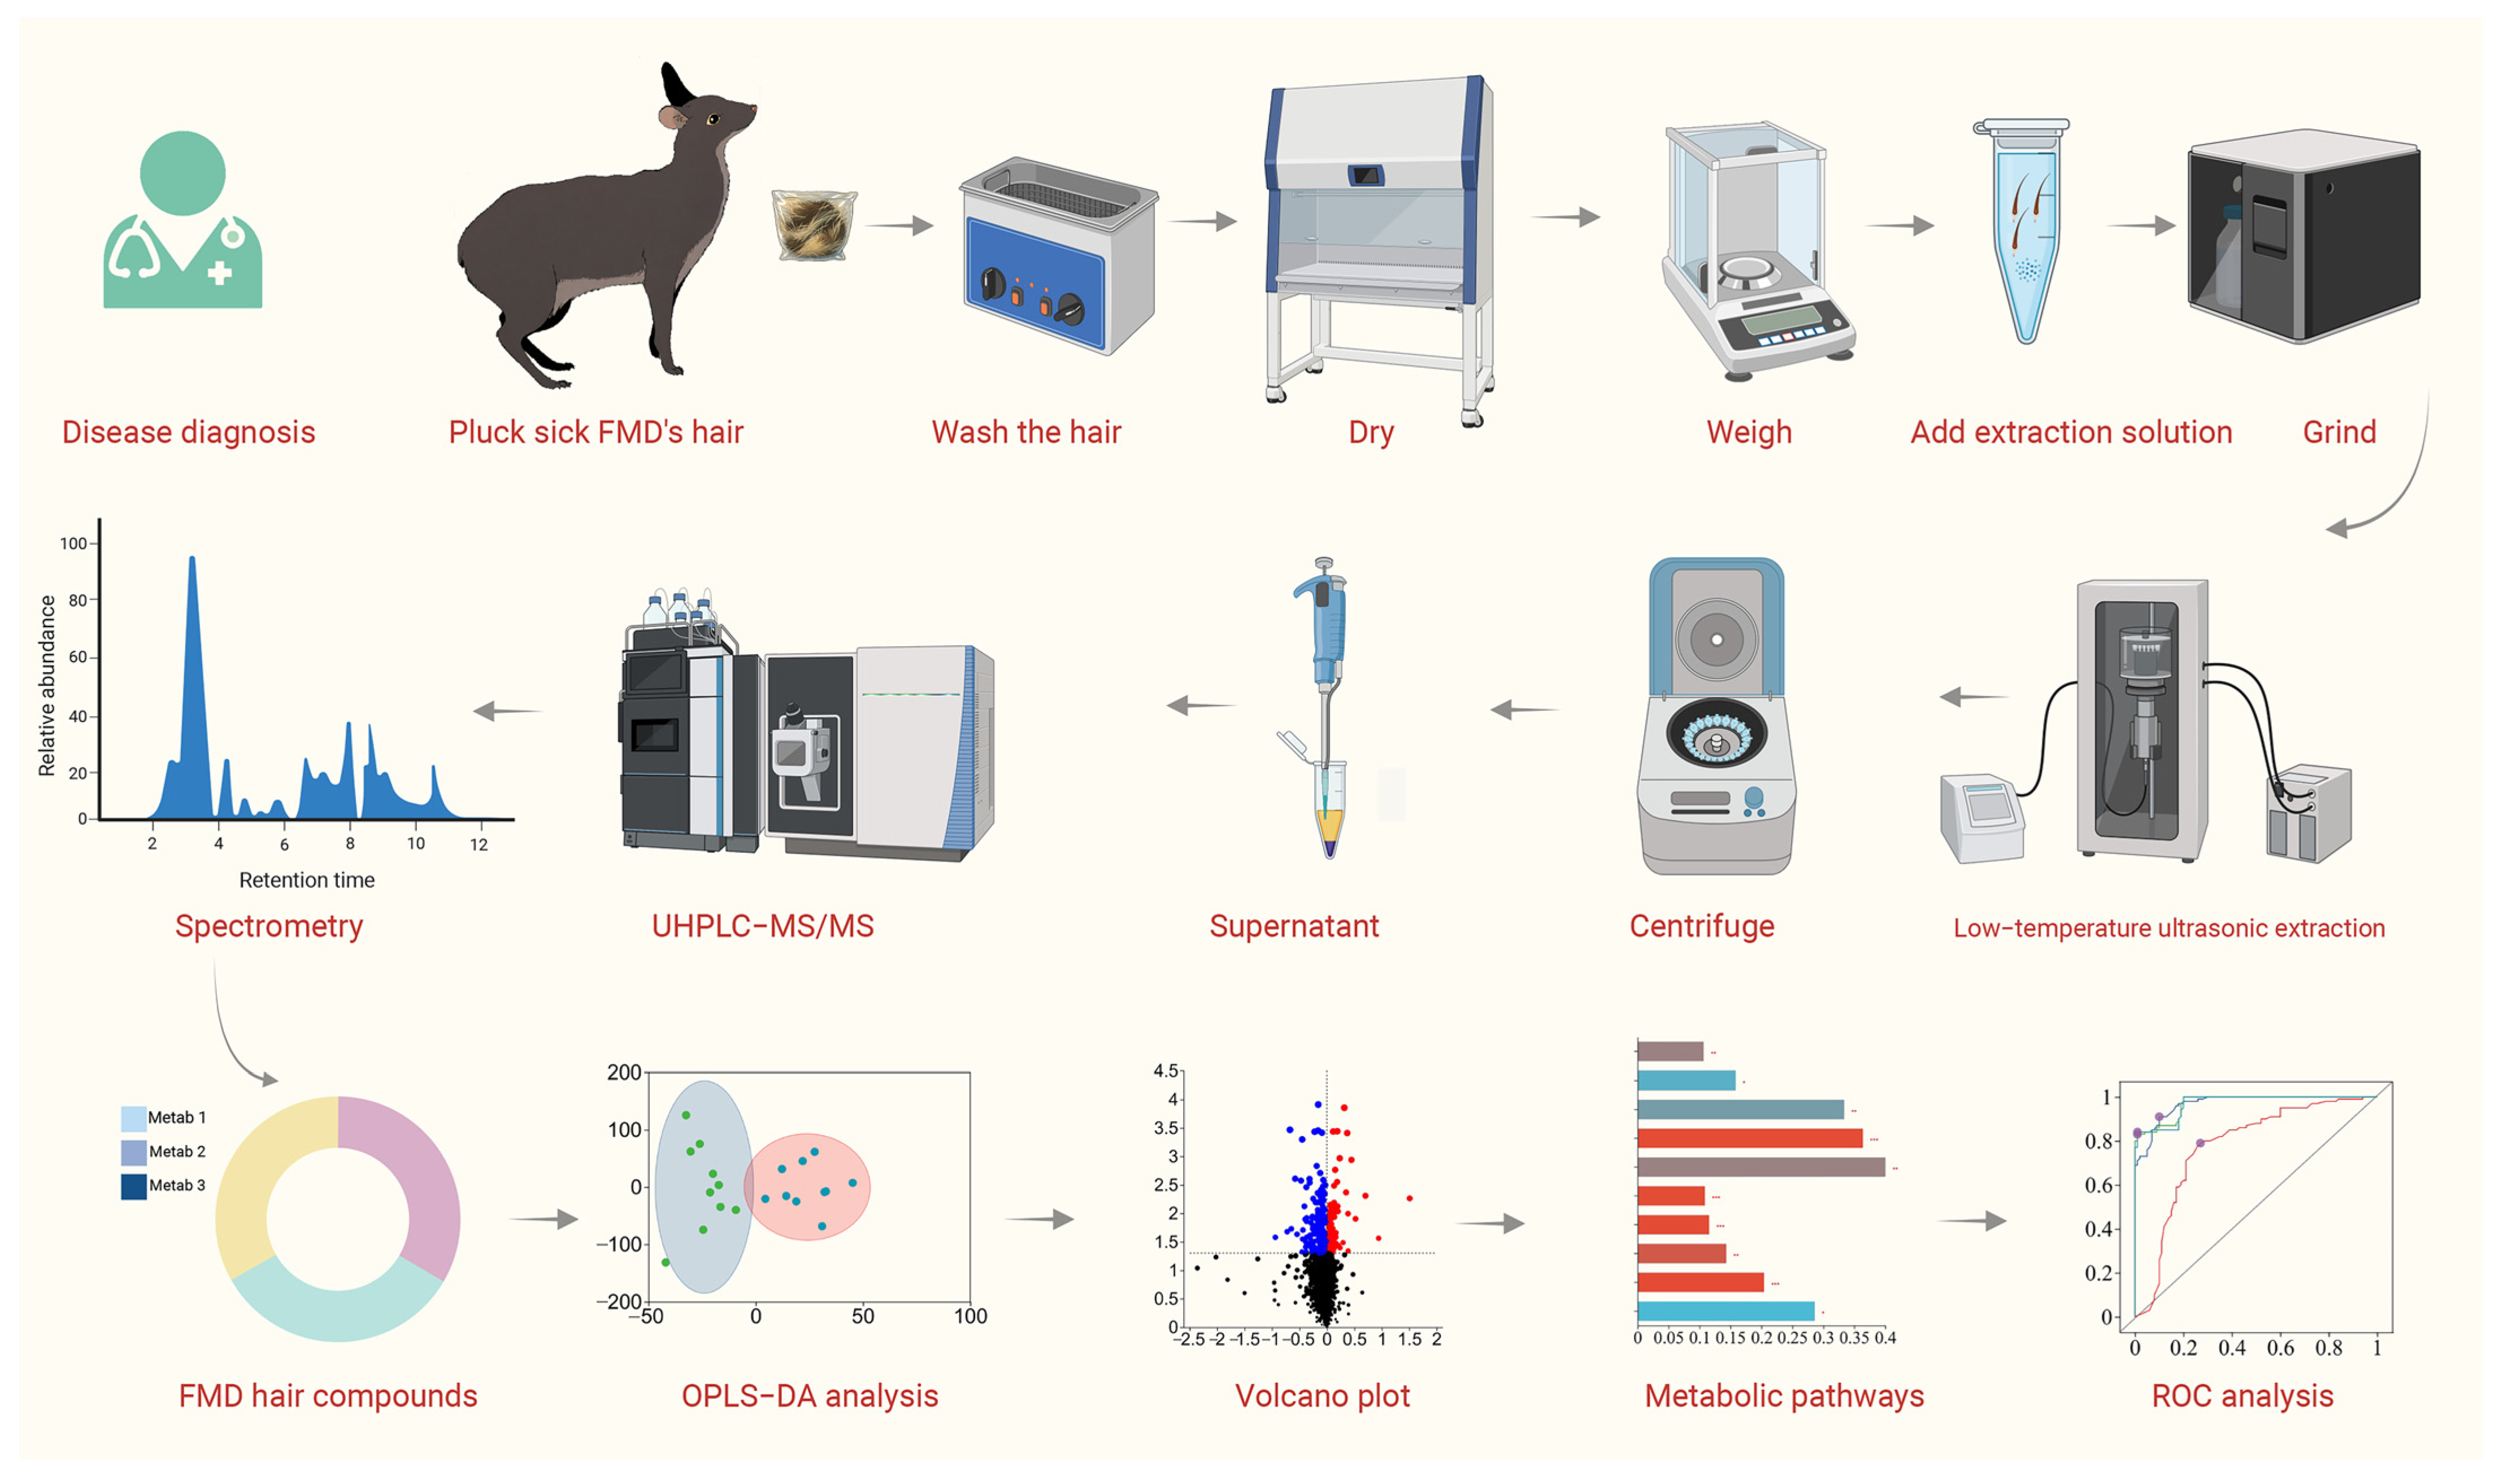
2.2. Metabolome Extraction
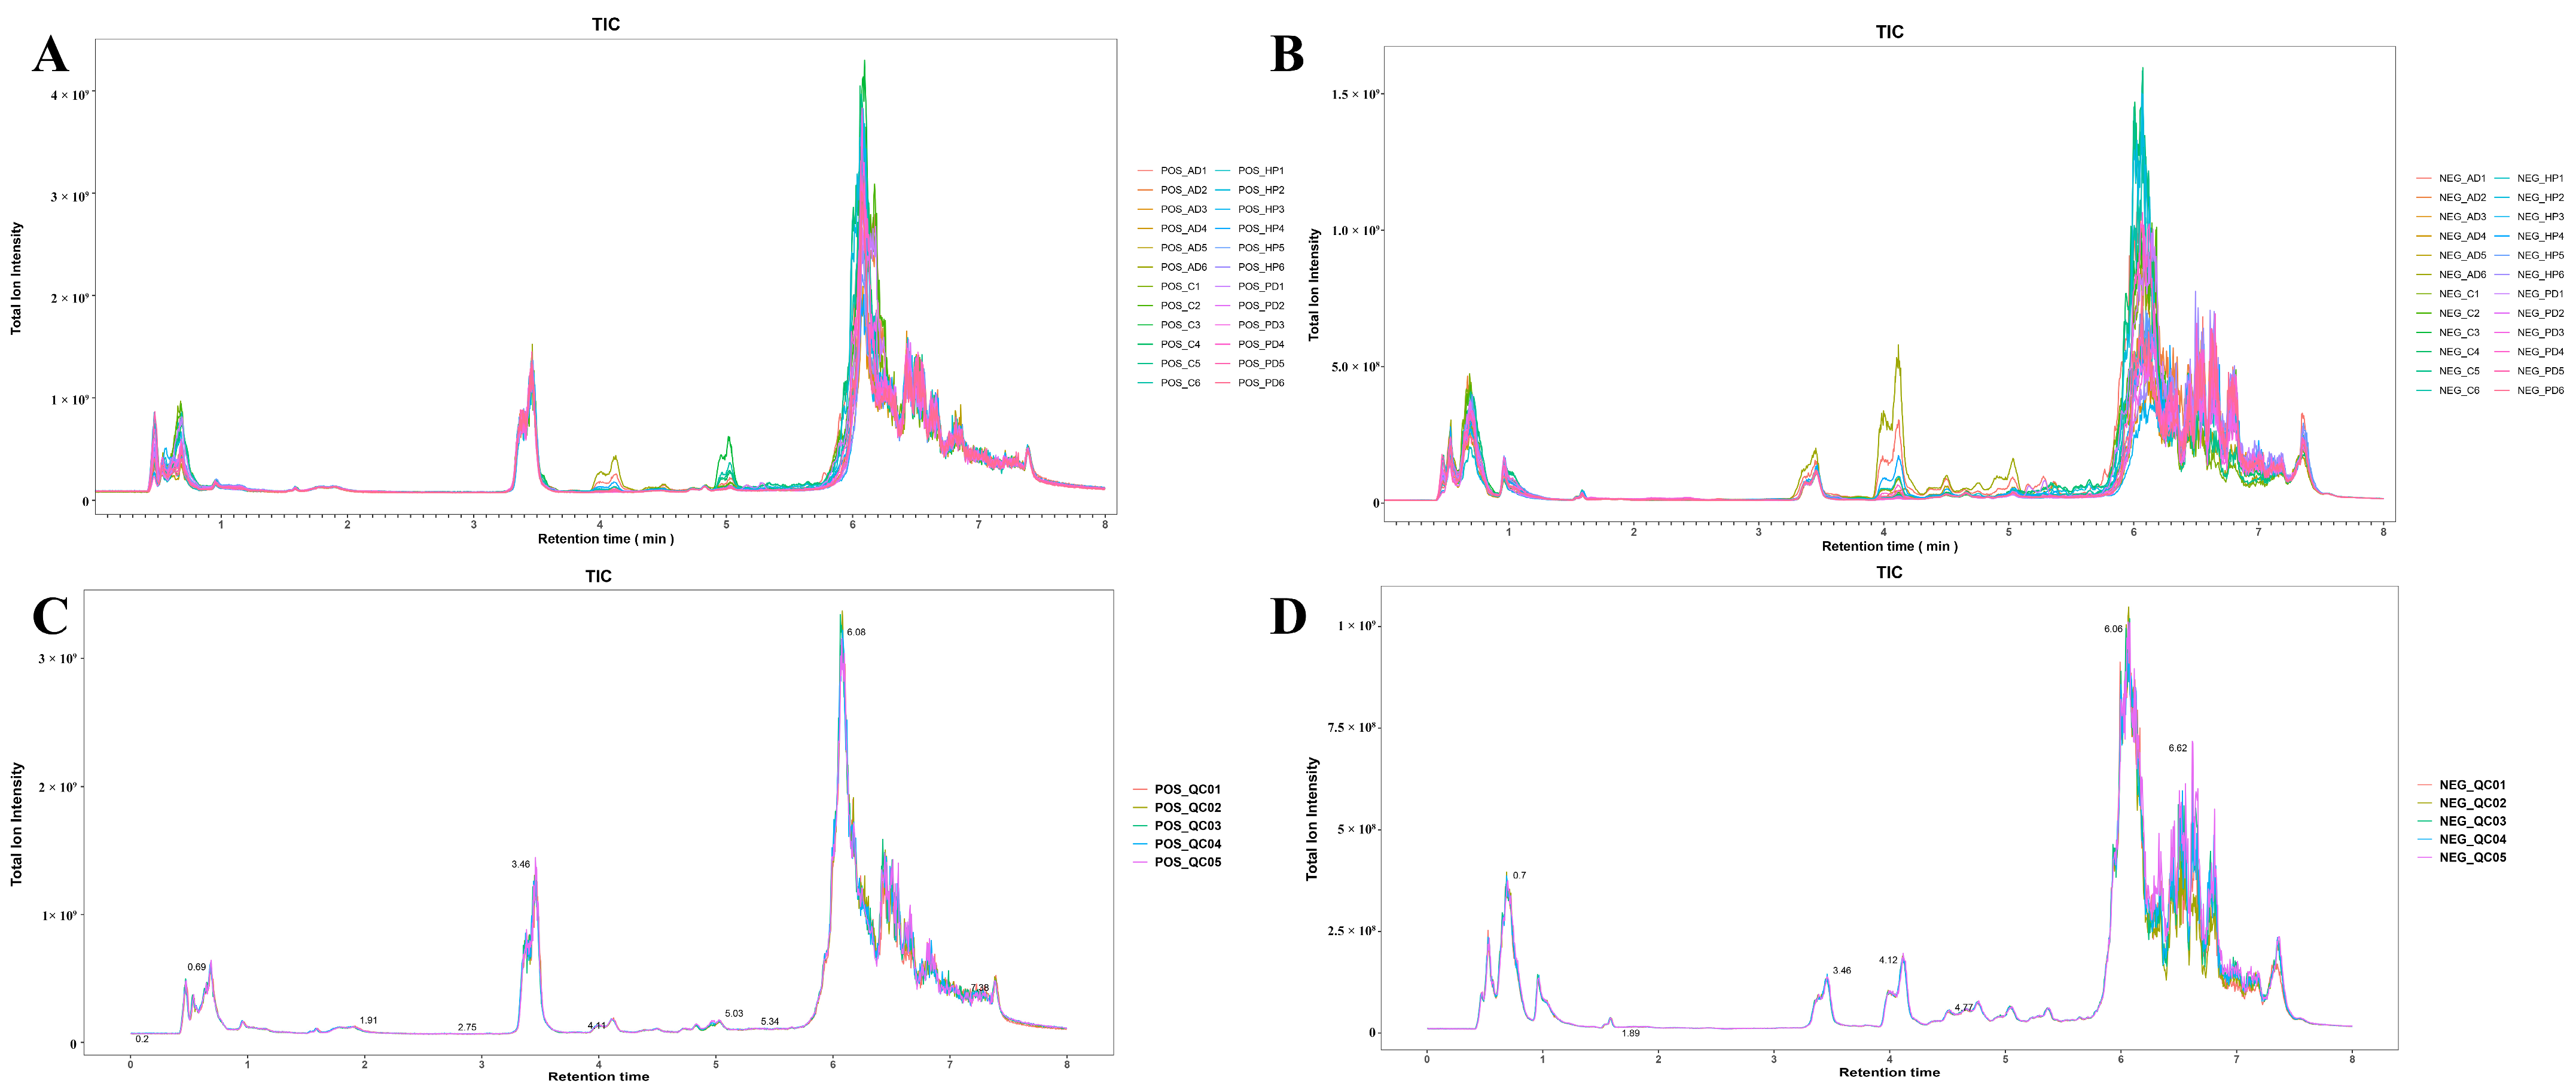
2.3. UHPLC-MS/MS Profiling
2.4. Hair Metabolomic Data Mining
3. Results
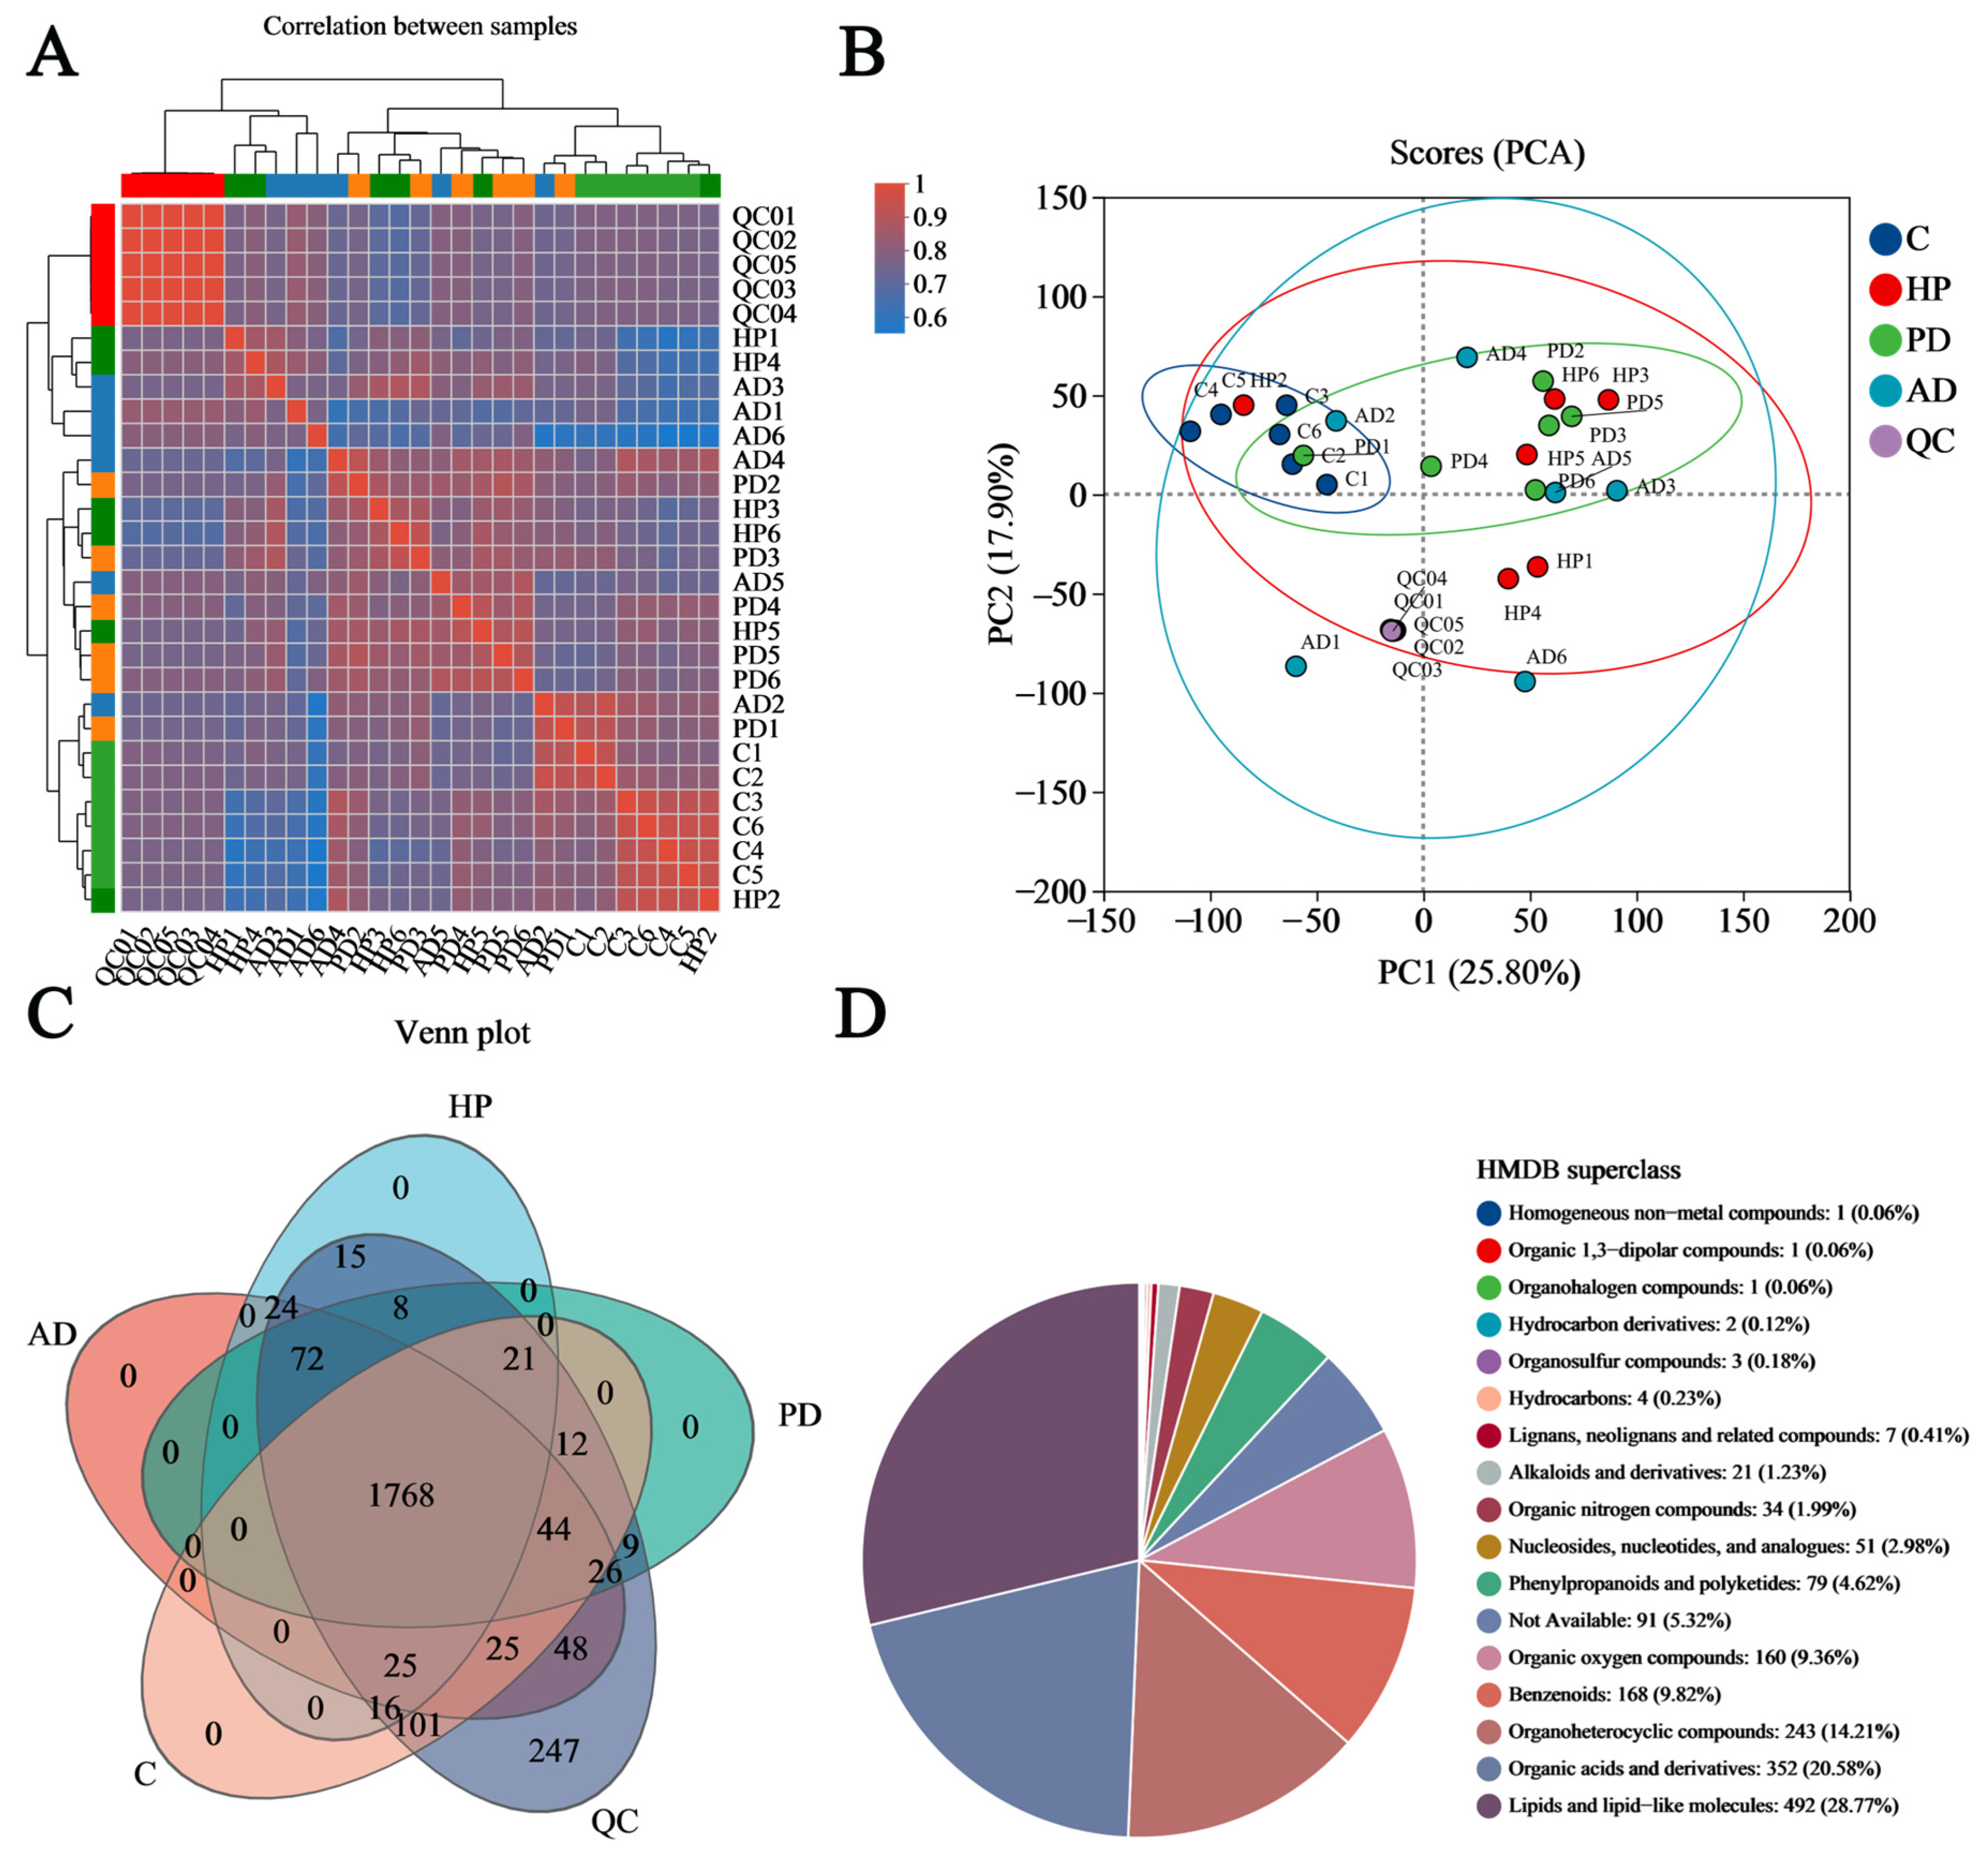
3.1. Untargeted Metabolomic Characterization of Hair Samples from Captive FMD
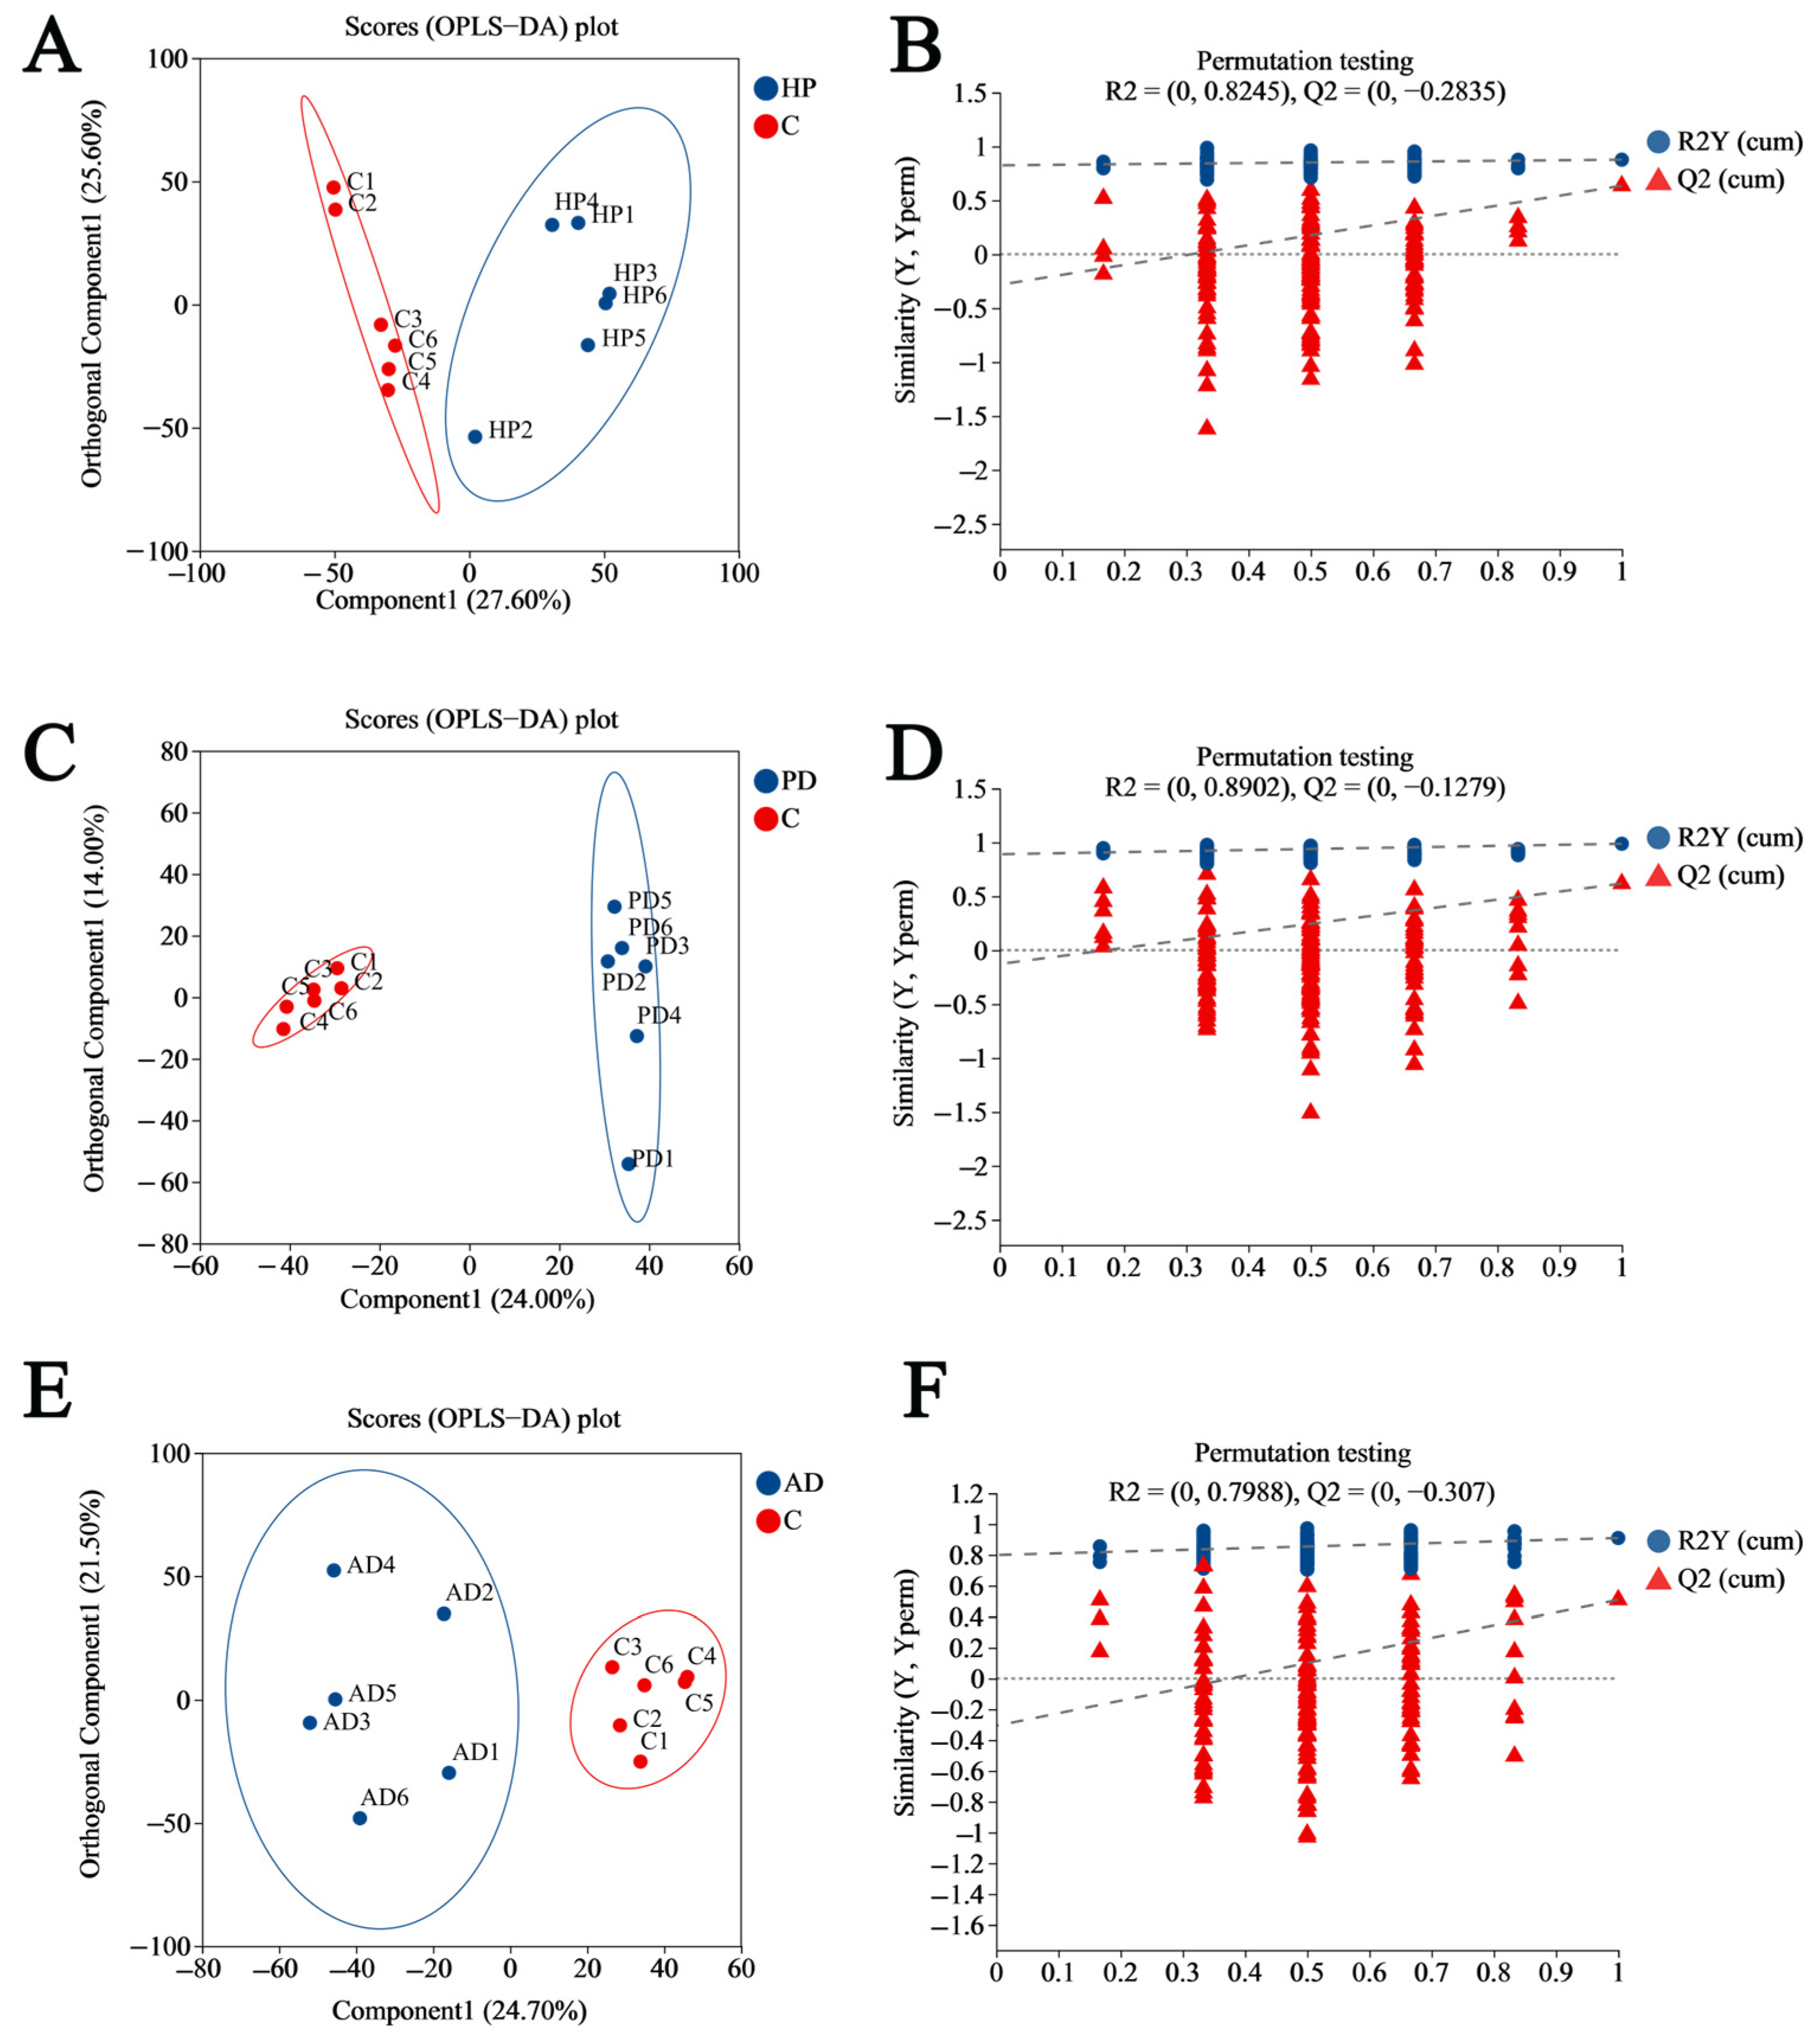
3.2. Establishing the OPLS-DA Model
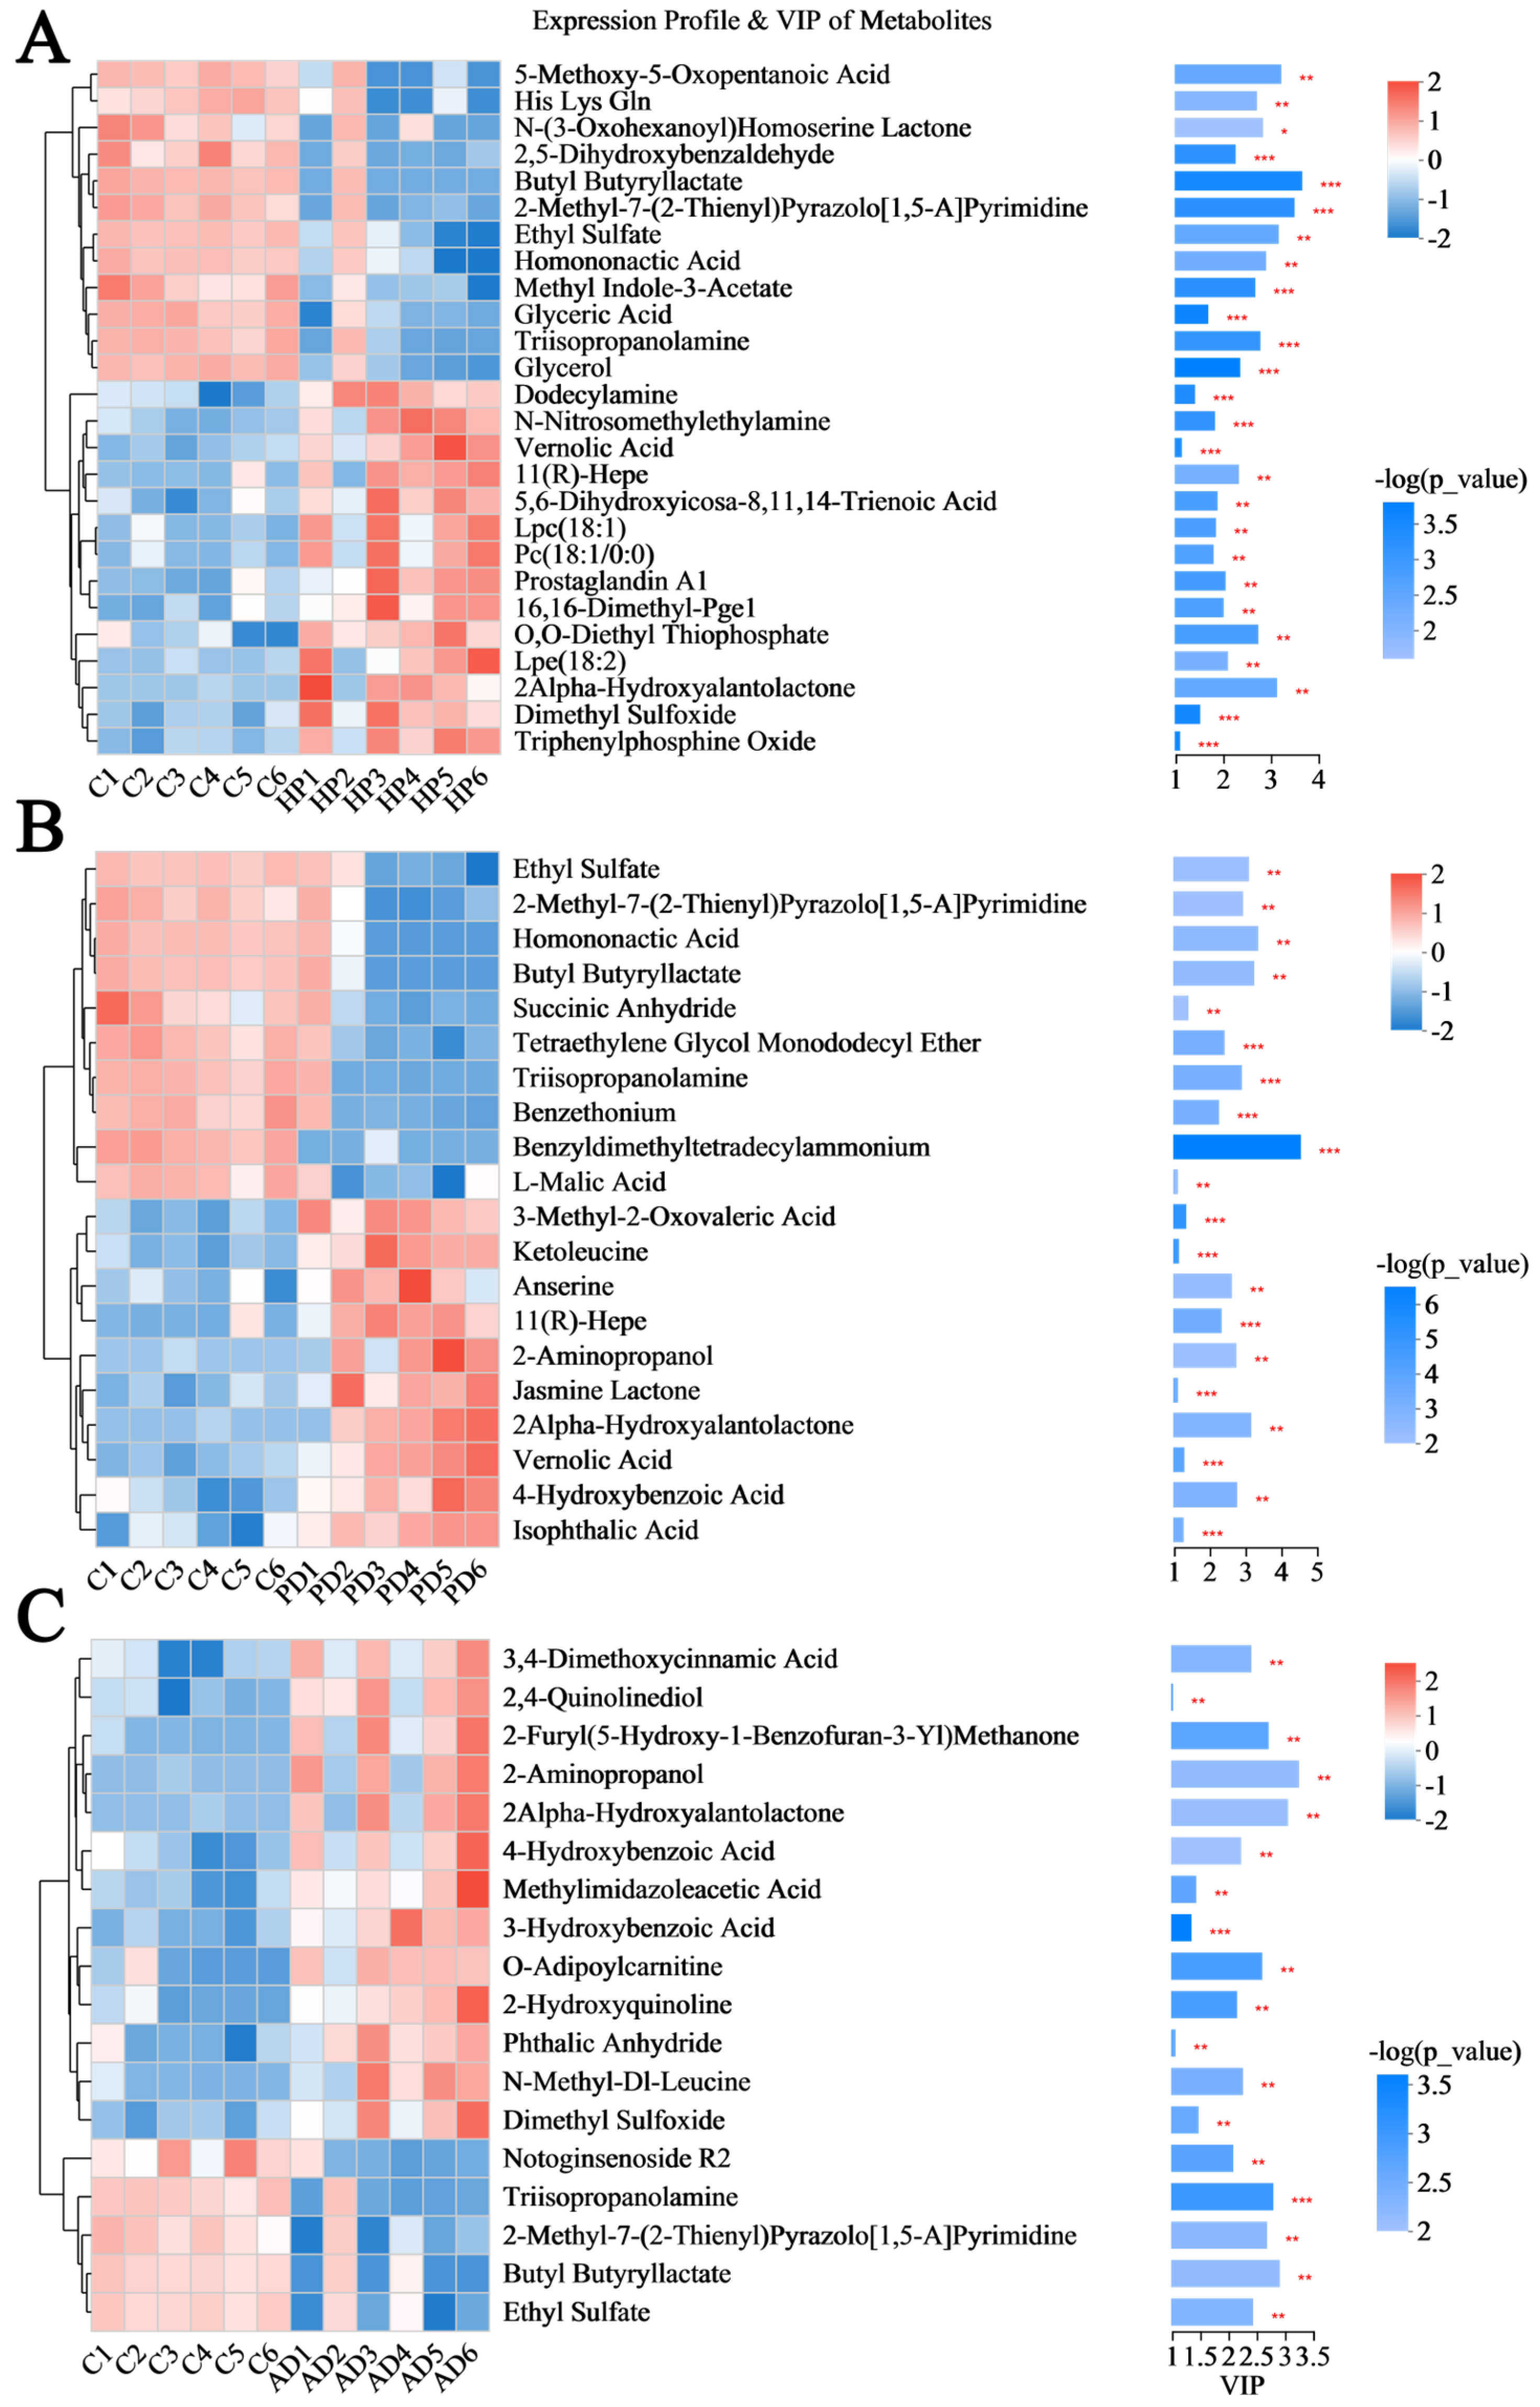
3.3. Screening Differential Hair Metabolites Between Healthy and Diseased Forest Musk Deer
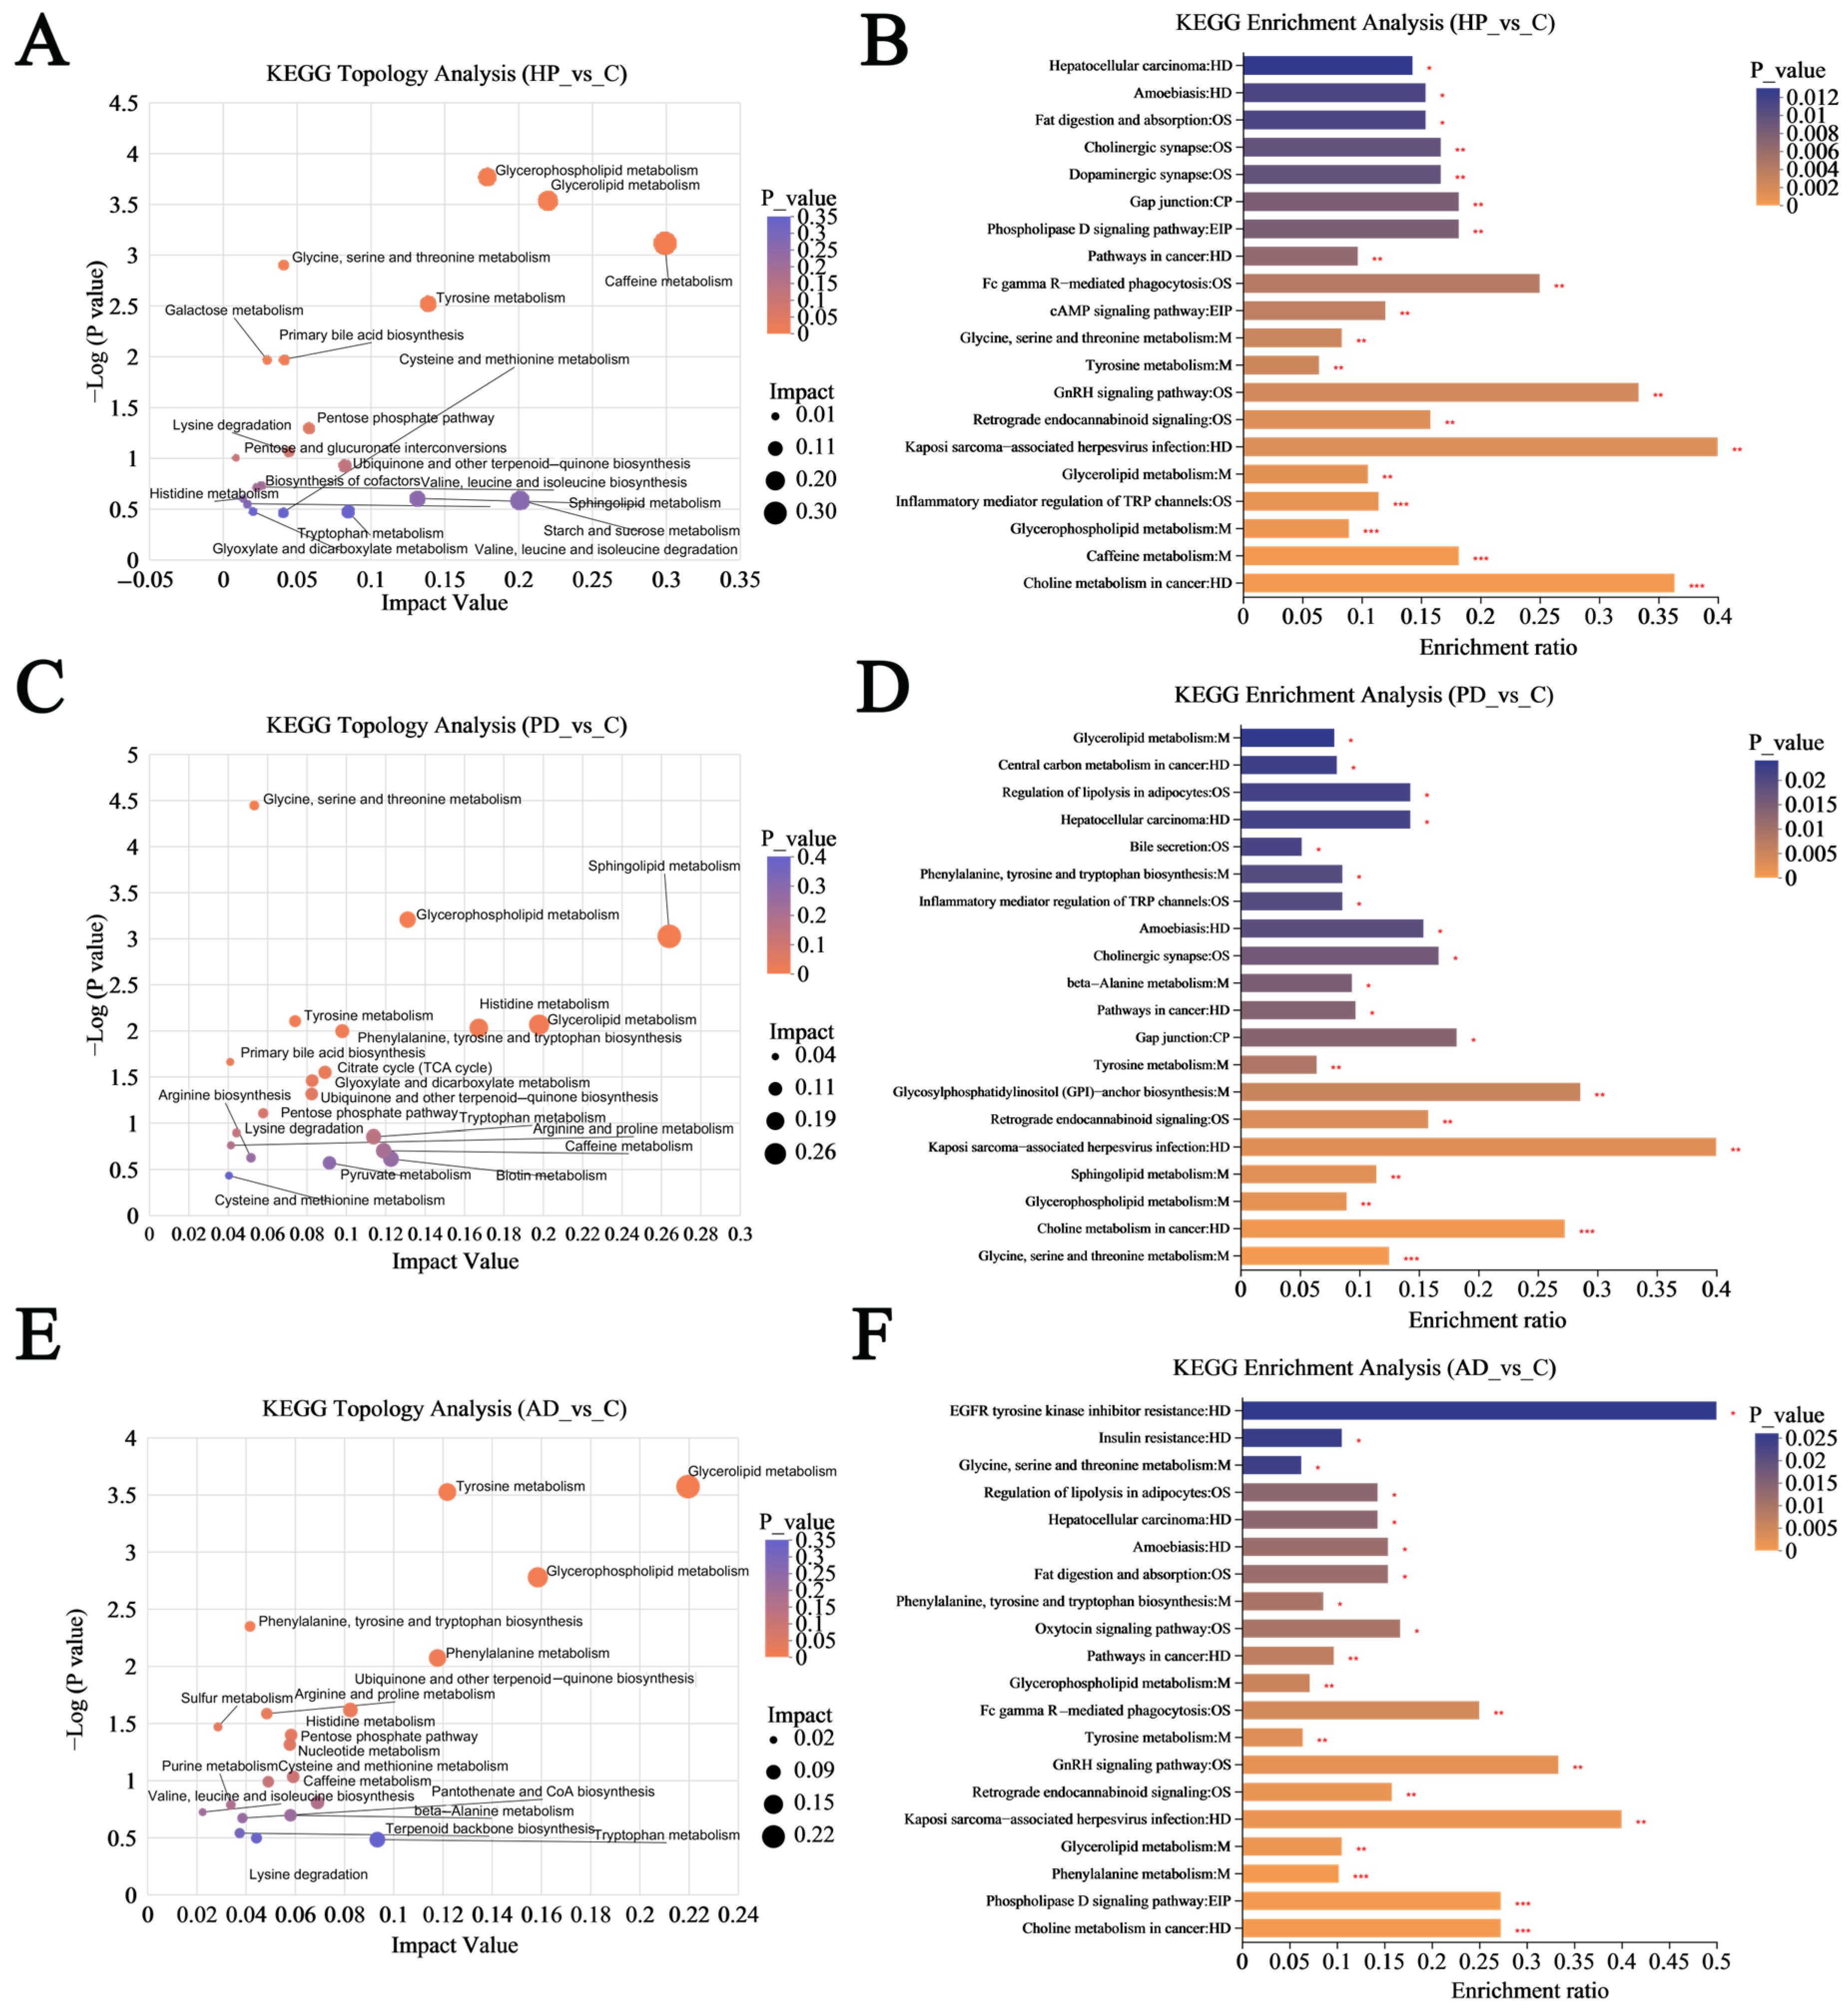
3.4. Functional Analysis of Altered Hair Metabolites
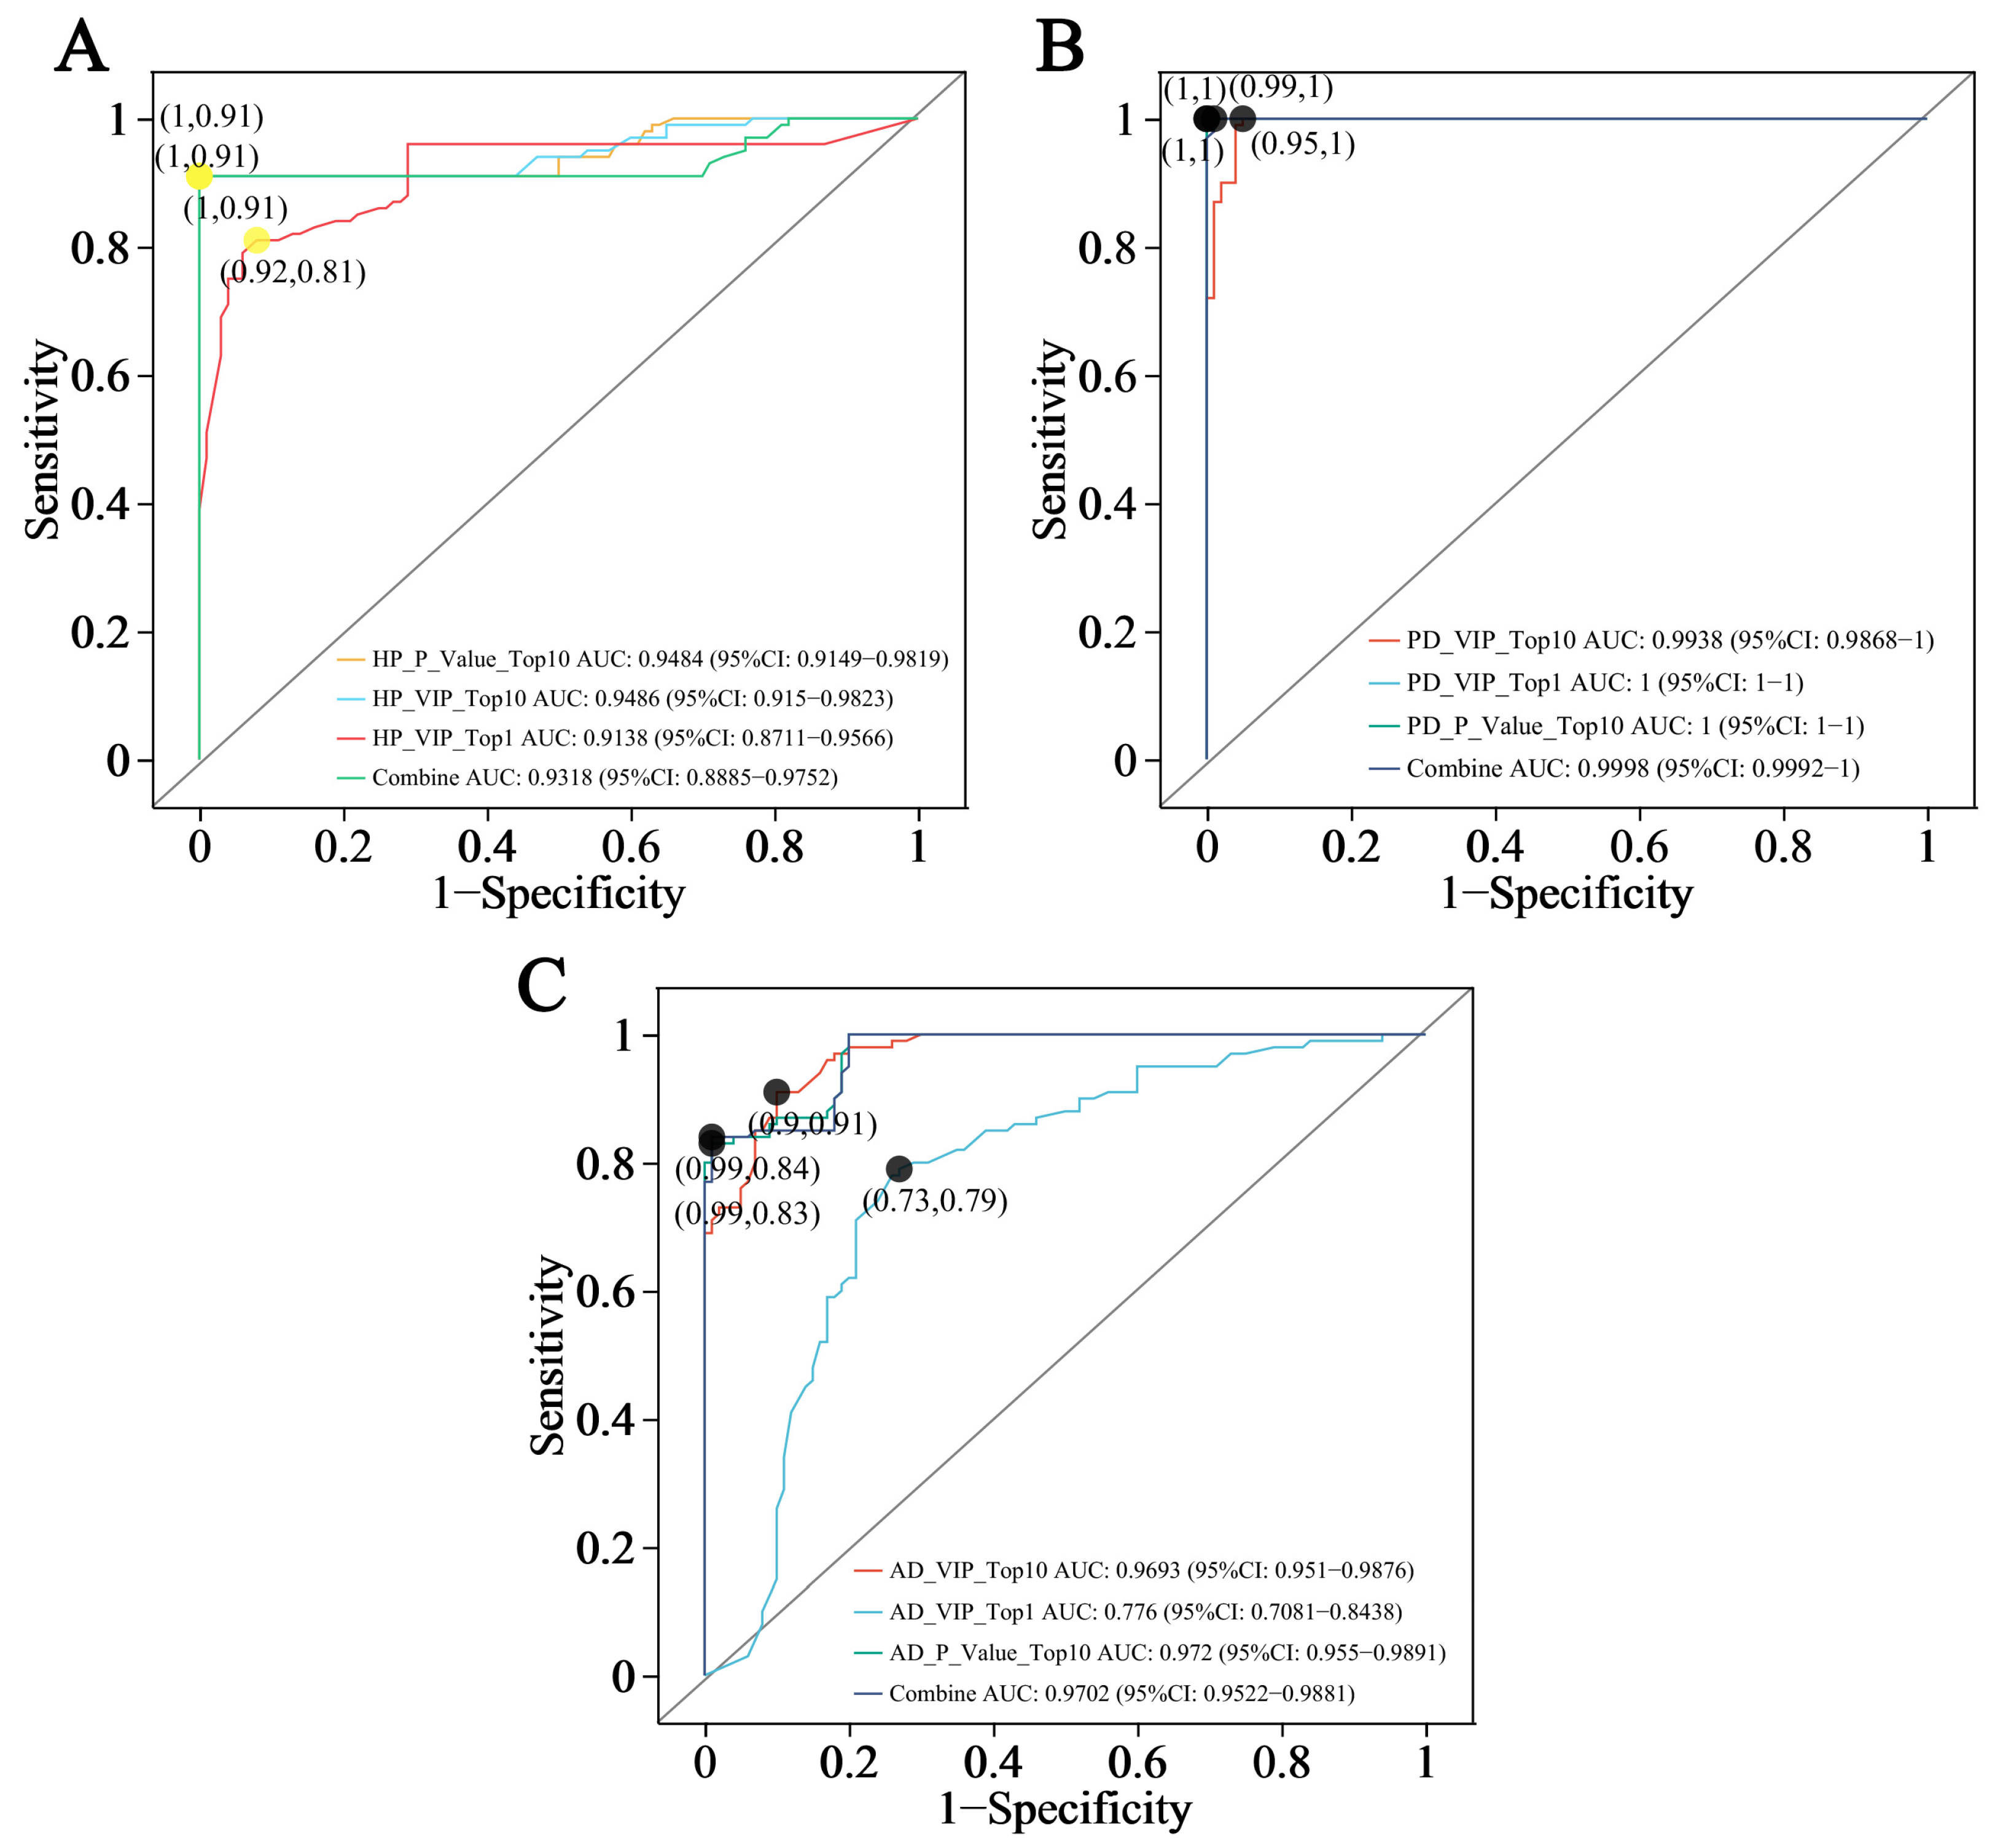
3.5. ROC Analysis of Biomarker Candidates
4. Discussion
5. Conclusions
Author Contributions
Funding
Institutional Review Board Statement
Informed Consent Statement
Data Availability Statement
Conflicts of Interest
References
- Sheng, H.; Liu, Z. The Musk Deer of China, 1st ed.; Shanghai Science and Technology Press: Shanghai, China, 2007; pp. 11–12, 138. [Google Scholar]
- Feng, H.; Wang, L.; Cao, F.; Ma, J.; Tang, J.; Feng, C.; Su, Z. Forest Musk Deer (Moschus berezovskii) in China: Research and Protection. J. Vertebr. Biol. 2023, 72, 22067. [Google Scholar] [CrossRef]
- Wang, Y.; Harris, R. Moschus berezovskii; Errata Version Published in 2016; 2015:E.T13894A103431781; The IUCN Red List of Threatened Species: Cambridge, UK, 2015. [Google Scholar]
- Jie, H.; Feng, X.; Zhao, G.; Zeng, D.; Zhang, C.; Chen, Q. Research Progress on Musk Secretion Mechanism of Forest Musk Deer. China J. Chin. Meter. Med. 2014, 39, 4522–4525. [Google Scholar]
- Li, Y.; Shi, M.; Zhang, B.; Wu, J.; Wang, Y.; Li, M.; Wu, Y.; Hu, X.; Hu, D.; Huang, Z.; et al. Effects of Different Weaning Times on the Stress Response and the Intestinal Microbiota Composition of Female Forest Musk Deer (Moschus berezovskii) and Their Fawns. PLoS ONE 2022, 17, e0276542. [Google Scholar] [CrossRef] [PubMed]
- He, L.; Wang, W.-X.; Li, L.-H.; Liu, B.-Q.; Liu, G.; Liu, S.-Q.; Qi, L.; Hu, D.-F. Effects of Crowding and Sex on Fecal Cortisol Levels of Captive Forest Musk Deer. Biol. Res. 2014, 47, 48. [Google Scholar] [CrossRef] [PubMed]
- Yang, S.; Zhang, M.; Li, Y.; Cha, M.; Xu, S.; Liu, Y.; Guo, X.; Zhang, T.; Shi, M.; Liu, S.; et al. The Effect Of Musk Extraction Procedures On The Stress Response Of Farmed Forest Musk Deer (Moschus berezovskii). J. Anim. Plant Sci. JAPS 2020, 30, 1424–1434. [Google Scholar]
- Zhang, Y.; Wang, R.; Hu, Q.; Lv, N.; Zhang, L.; Yang, Z.; Zhou, Y.; Wang, X. Characterization of Pseudomonas Aeruginosa Bacteriophages and Control Hemorrhagic Pneumonia on a Mice Model. Front. Microbiol. 2024, 15, 1396774. [Google Scholar] [CrossRef] [PubMed]
- Zhao, K.; Liu, Y.; Zhang, X.; Palahati, P.; Wang, H.; Yue, B. Detection and Characterization of Antibiotic-Resistance Genes in Arcanobacterium Pyogenes Strains from Abscesses of Forest Musk Deer. J. Med. Microbiol. 2011, 60, 1820–1826. [Google Scholar] [CrossRef] [PubMed]
- Xu, S. Preliminary Study on Natural Diets, Digestibility and Phytobezoar DiseaseIsk Deer. Ph.D. Thesis, Beijing Forestry University, Beijing, China, 2022. [Google Scholar]
- Han, J.; Feng, M.; Fang, J.; Lv, D.; Wang, J. Isolation and Identification of Pathogenic Bacteria Causing Hemorrhagic pneumoniain in Moschus berezovsky and Preparation of Bacterial Ghost Vaccine. Chin. J. Vet. Med. 2024, 60, 27–34. [Google Scholar]
- Zhao, W.; Tian, Q.; Luo, Y.; Wang, Y.; Yang, Z.; Yao, X.; Cheng, J.; Zhou, X.; Wang, W. Isolation, Identification, and Genome Analysis of Lung-Pathogenic Klebsiella pneumoniae (LPKP) in Forest Musk Deer. J. Zoo Wildl. Med. 2017, 48, 1039–1048. [Google Scholar] [CrossRef] [PubMed]
- Luo, X.; Wang, P.; Cheng, J.; Luo, Y.; Dai, L.; Zhou, X.; Zou, L.; Li, B.; Xiao, J. Characterization of Virulence Genes and Antimicrobial Resistance of Lung-Pathogenic Escherichia coli Isolates in Forest Musk Deer (Moschus berezovskii). J. Zoo Wildl. Med. 2017, 47, 540–550. [Google Scholar] [CrossRef] [PubMed]
- Chen, Q.; Zhao, K.; Li, H.; Liu, K.; Li, J.; Prithiviraj, Y.C.; Yue, B.; Zhang, X. Antibacterial and Anti-Virulence Effects of Furazolidone on Trueperella Pyogenes and Pseudomonas Aeruginosa. BMC Vet. Res. 2022, 18, 114. [Google Scholar] [CrossRef] [PubMed]
- Zhao, K.; Li, X.; Palahati, P.; Zeng, B.; Zhang, X.; Yue, B. Isolation and identification of pathogens of musk deer abscess disease and antibiotic susceptibility Assay. Sichuan J. Zool. 2011, 30, 522–526. (In Chinese) [Google Scholar]
- Zhao, K.; Tian, Y.; Yue, B.; Wang, H.; Zhang, X. Virulence Determinants and Biofilm Production among Trueperella Pyogenes Recovered from Abscesses of Captive Forest Musk Deer. Arch. Microbiol. 2013, 195, 203–209. [Google Scholar] [CrossRef] [PubMed]
- Deng, Y.; Li, Q.; Yan, L.; Zhang, B.; Yang, H.; Fu, P.; Sun, S.; Yan, Q. Comparison of Virulence and Pathogenicity of Two Pseudomonas aeruginosa Strains from the Lung of Forest Musk Deer. J. Northwest A&F Univ. (Nat. Sci. Ed.) 2022, 50, 10–18. (In Chinese) [Google Scholar]
- Zhao, K.; Ma, J.; Wang, X.; Guo, Y.; Yue, B.; Chu, Y. Population Divergence of Pseudomonas aeruginosa Can Lead to the Coexistence with Escherichia coli in Animal Suppurative Lesions. Vet. Microbial. 2019, 231, 169–176. [Google Scholar] [CrossRef] [PubMed]
- Yang, S.; Zhang, T.; Li, Y.; Xu, S.; Zhang, M.; Hu, X.; Liu, S.; Hu, D.; Wronski, T. Identifying Personality Traits and Their Potential Application to the Management of Captive Forest Musk Deer (Moschus berezovskii). Appl. Anim. Behav. Sci. 2021, 234, 105168. [Google Scholar] [CrossRef]
- Jang, W.; Choi, J.; Park, B.; Seo, J.; Seo, Y.H.; Lee, S.; Jeong, C.; Lee, S. Hair Metabolomics in Animal Studies and Clinical Settings. Molecules 2019, 24, 2195. [Google Scholar] [CrossRef] [PubMed]
- Clifford, S.; Jeffrey, K.; Bruford, M.; Wickings, E. Identification of Polymorphic Microsatellite Loci in the Gorilla (Gorilla gorilla gorilla) Using Human Primers: Application to Noninvasively Collected Hair Samples. Mol. Ecol. 1999, 8, 1556–1558. [Google Scholar] [CrossRef] [PubMed]
- Balcombe, J.; Barnard, N.; Sandusky, C. Laboratory Routines Cause Animal Stress. Contemp. Top. Lab. Anim. Sci. 2004, 43, 42–51. [Google Scholar] [PubMed]
- Sulek, K.; Han, T.; Villas-Boas, S.; Wishart, D.; Soh, S.; Kwek, K.; Gluckman, P.; Chong, Y.; Kenny, L.; Baker, P. Hair Metabolomics: Identification of Fetal Compromise Provides Proof of Concept for Biomarker Discovery. Theranostics 2014, 4, 953–959. [Google Scholar] [CrossRef] [PubMed]
- Raposo, J.; Navarro, P.; Sarmiento, A.; Arribas, E.; Irazola, M.; Alonso, R. Analytical Proposal for Trace Element Determination in Human Hair. Application to the Biscay Province Population, Northern Spain. Microchem. J. 2014, 116, 125–134. [Google Scholar] [CrossRef]
- Sponheimer, M.; Robinson, T.; Ayliffe, L.; Passey, B.; Roeder, B.; Shipley, L.; Lopez, E.; Cerling, T.; Dearing, D.; Ehleringer, J. An Experimental Study of Carbon-Isotope Fractionation between Diet, Hair, and Feces of Mammalian Herbivores. Can. J. Zool. 2003, 81, 871–876. [Google Scholar] [CrossRef]
- Yang, Y.; Yin, Y.; Tang, X.; Xia, Y.; Zhang, J.; Yan, C.; Zhang, W.; Zhang, H.; Han, T. Evaluating Different Extraction Approaches for GC-MS Based Metabolomics Analysis of the Giant Pandas’ Fur. Toxics 2022, 10, 688. [Google Scholar] [CrossRef] [PubMed]
- Parker, G.; Leppert, T.; Anex, D.S.; Hilmer, J.; Matsunami, N.; Baird, L.; Stevens, J.; Parsawar, K.; Durbin-Johnson, B.; Rocke, D.; et al. Demonstration of Protein-Based Human Identification Using the Hair Shaft Proteome. PLoS ONE 2016, 11, e0160653. [Google Scholar] [CrossRef] [PubMed]
- Rice, R.; Bradshaw, K.; Durbin-Johnson, B.; Rocke, D.; Eigenheer, R.; Phinney, B.; Sundberg, J. Differentiating Inbred Mouse Strains from Each Other and Those with Single Gene Mutations Using Hair Proteomics. PLoS ONE 2012, 7, e51956. [Google Scholar] [CrossRef] [PubMed]
- Dunn, W.B.; Broadhurst, D.; Begley, P.; Zelena, E.; Francis-McIntyre, S.; Anderson, N.; Brown, M.; Knowles, J.D.; Halsall, A.; Haselden, J.N.; et al. Procedures for Large-Scale Metabolic Profiling of Serum and Plasma Using Gas Chromatography and Liquid Chromatography Coupled to Mass Spectrometry. Nat. Protoc. 2011, 6, 1060–1083. [Google Scholar] [CrossRef] [PubMed]
- Chang, C.; Hsu, J.; Hsiao, P.; Chen, Y.; Liao, P. Identifying Hair Biomarker Candidates for Alzheimer’s Disease Using Three High Resolution Mass Spectrometry-Based Untargeted Metabolomics Strategies. J. Am. Soc. Mass Spectrom. 2023, 34, 550–561. [Google Scholar] [CrossRef] [PubMed]
- Zhang, J.; Xue, C.; Kolachalama, V.; Donald, W. Interpretable Machine Learning on Metabolomics Data Reveals Biomarkers for Parkinson’s Disease. ACS Cent. Sci. 2023, 9, 1035–1045. [Google Scholar] [CrossRef] [PubMed]
- Yin, N.; Jiang, X.; Yu, M.; Yang, Y.; Ge, H.; Han, T.; Qi, H. The Maternal Hair Metabolome Is Capable of Discriminating Intrahepatic Cholestasis of Pregnancy from Uncomplicated Pregnancy. Front. Endocrinol. 2024, 14, 1280833. [Google Scholar] [CrossRef] [PubMed]
- Chang, C.; Hsu, J.; Lo, Y.; Liu, Y.; Mee-inta, O.; Lee, H.; Kuo, Y.-M.; Liao, P. Characterization of Hair Metabolome in 5xFAD Mice and Patients with Alzheimer’s Disease Using Mass Spectrometry-Based Metabolomics. ACS Chem. Neurosci. 2024, 15, 527–538. [Google Scholar] [CrossRef] [PubMed]
- Nakahara, Y.; Kikura, R.; Yasuhara, M.; Mukai, T. Hair Analysis for Drug Abuse. XIV. Identification of Substances Causing Acute Poisoning Using Hair Root. I. Methamphetamine. Forensic Sci. Int. 1997, 84, 157–164. [Google Scholar] [CrossRef] [PubMed]
- Phillips, K.; Tukan, A.; Rigodanzo, A.; Reusch, R.; Brasky, K.; Meyer, J. Quantification of Hair Cortisol Concentration in Common Marmosets (Callithrix jacchus) and Tufted Capuchins (Cebus apella). Am. J. Primatol. 2018, 80, e22879. [Google Scholar] [CrossRef] [PubMed]
- Shen, B.; Yi, X.; Sun, Y.; Bi, X.; Du, J.; Zhang, C.; Quan, S.; Zhang, F.; Sun, R.; Qian, L.; et al. Proteomic and Metabolomic Characterization of COVID-19 Patient Sera. Cell 2020, 182, 59–72.e15. [Google Scholar] [CrossRef] [PubMed]
- Bao, W.; Cao, C.; Li, S.; Bo, L.; Zhang, M.; Zhao, X.; Liu, Y.; Sun, C. Metabonomic Analysis of Quercetin against the Toxicity of Acrylamide in Rat Urine. Food Funct. 2017, 8, 1204–1214. [Google Scholar] [CrossRef] [PubMed]
- Sun, X.; Sui, W.; Mu, Z.; Xie, S.; Deng, J.; Li, S.; Seki, T.; Wu, J.; Jing, X.; He, X.; et al. Mirabegron Displays Anticancer Effects by Globally Browning Adipose Tissues. Nat. Commun. 2023, 14, 7610. [Google Scholar] [CrossRef] [PubMed]
- Olsen, J.; Severinsen, R.; Rasmussen, T.; Hentzer, M.; Givskov, M.; Nielsen, J. Synthesis of New 3- and 4-Substituted Analogues of Acyl Homoserine Lactone Quorum Sensing Autoinducers. Bioorg. Med. Chem. Lett. 2002, 12, 325–328. [Google Scholar] [CrossRef] [PubMed]
- Liu, L.; Huang, L.; Ding, X.; Yan, L.; Jia, S.; Dai, Y.; Xie, Y.; Zhong, C. Identification of Quorum-Sensing Molecules of N-Acyl-Homoserine Lactone in Gluconacetobacter Strains by Liquid Chromatography-Tandem Mass Spectrometry. Molecules 2019, 24, 2694. [Google Scholar] [CrossRef] [PubMed]
- Miller, M.B.; Bassler, B. Quorum Sensing in Bacteria. Annu. Rev. Microbiol. 2001, 55, 165–199. [Google Scholar] [CrossRef] [PubMed]
- Rutherford, S.; Bassler, B. Bacterial Quorum Sensing: Its Role in Virulence and Possibilities for Its Control. Cold Spring Harb. Perspect. Med. 2012, 2, a012427. [Google Scholar] [CrossRef] [PubMed]
- Smith, R.; Harris, S.; Phipps, R.; Iglewski, B. The Pseudomonas Aeruginosa Quorum-Sensing Molecule N-(3-Oxododecanoyl)Homoserine Lactone Contributes to Virulence and Induces Inflammation In Vivo. J. Bacteriol. 2002, 184, 1132–1139. [Google Scholar] [CrossRef] [PubMed]
- Wu, Q.; Yang, W.; Zhao, W.; Cheng, J.; Luo, Y.; Wang, Y.; Yang, Z.; Yao, X. lsolation, identification and whole genome sequence analysis of Pseudomonas aeruginosa (ST1249) from lung of forest musk deer. J. Northwest Univ. Nat. Sci. 2020, 48, 9–17. [Google Scholar]
- Ma, X.; Chen, L.; He, Y.; Zhao, L.; Yu, W.; Xie, Y.; Yu, Y.; Xu, Y.; Zheng, Y.; Li, R.; et al. Targeted Lipidomics Reveals Phospholipids and Lysophospholipids as Biomarkers for Evaluating Community-Acquired Pneumonia. Ann. Transl. Med. 2022, 10, 395. [Google Scholar] [CrossRef] [PubMed]
- Yoder, M.; Yan, Z.; Yuan, Y.; Holian, O.; Kuo, S.; van Breemen, R.; Thomas, L.; Lum, H. Bioactive Lysophosphatidylcholine 16:0 and 18:0 Are Elevated in Lungs of Asthmatic Subjects. Allergy Asthma Immunol. Res. 2014, 6, 61–65. [Google Scholar] [CrossRef] [PubMed]
- Chen, L.; Zhao, L.; Shang, Y.; Xu, Y.; Gao, Z. Admission Lysophosphatidylethanolamine Acyltransferase Level Predicts the Severity and Prognosis of Community-Acquired Pneumonia. Infection 2021, 49, 877–888. [Google Scholar] [CrossRef] [PubMed]
- Tang, J.; Suo, L.; Li, F.; Yang, C.; Bian, K.; Wang, Y. ITRAQ-Based Quantitative Proteomics Analysis of Forest Musk Deer with Pneumonia. Front. Vet. Sci. 2022, 9, 1012276. [Google Scholar] [CrossRef] [PubMed]
- Hornik, T.C.; Vilalta, A.; Brown, G.C. Activated Microglia Cause Reversible Apoptosis of Pheochromocytoma Cells, Inducing Their Cell Death by Phagocytosis. J. Cell Sci. 2016, 129, 65–79. [Google Scholar] [CrossRef] [PubMed]
- Lopez-Andreo, M.; Gomez-Fernandez, J.; Corbalan-Garcia, S. The Simultaneous Production of Phosphatidic Acid and Diacylglycerol Is Essential for the Translocation of Protein Kinase Cε to the Plasma Membrane in RBL-2H3 Cells. Mol. Biol. Cell 2003, 14, 4885–4895. [Google Scholar] [CrossRef] [PubMed]
- Natarajan, V.; Scribner, W.; Taher, M. 4-Hydroxynonenal, a Metabolite of Lipid Peroxidation, Activates Phospholipase D in Vascular Endothelial Cells. Free Radic. Biol. Med. 1993, 15, 365–375. [Google Scholar] [CrossRef] [PubMed]
- Zhao, R.; Jiang, S.; Zhang, L.; Yu, Z. Mitochondrial Electron Transport Chain, ROS Generation and Uncoupling (Review). Int. J. Mol. Med. 2019, 44, 3–15. [Google Scholar] [CrossRef] [PubMed]
- Bakken, I.; Sonnewald, U.; Clark, J.; Bates, T. [U-13C]Glutamate Metabolism in Rat Brain Mitochondria Reveals Malic Enzyme Activity. Neuroreport 1997, 8, 1567–1570. [Google Scholar] [CrossRef] [PubMed]
- Anderson, N.; Mucka, P.; Kern, J.; Feng, H. The Emerging Role and Targetability of the TCA Cycle in Cancer Metabolism. Protein Cell 2018, 9, 216–237. [Google Scholar] [CrossRef] [PubMed]
- Choi, I.; Son, H.; Baek, J. Tricarboxylic Acid (TCA) Cycle Intermediates: Regulators of Immune Responses. Life 2021, 11, 69. [Google Scholar] [CrossRef] [PubMed]
- Patra, K.; Hay, N. The Pentose Phosphate Pathway and Cancer. Trends Biochem, Sci. 2014, 39, 347–354. [Google Scholar] [CrossRef] [PubMed]
- Schaeper, J.; Shamsi, S.; Danielson, N. Separation of Phosphorylated Sugars Using Capillary Electrophoresis with Indirect Photometric Detection. J. Capillary Electrophor. 1996, 3, 215–221. [Google Scholar] [PubMed]
- Sims, P.; Reed, G. Method for the Enzymatic Synthesis of 2-Phospho-D-Glycerate from Adenosine 5′-Triphosphate and D-Glycerate via D-Glycerate-2-Kinase. J. Mol. Catal. B Enzym. 2005, 32, 77–81. [Google Scholar] [CrossRef]
- Noh, J.; Farhataziz, N.; Kinter, M.; Yan, X.; Sun, Y. Colonic Dysregulation of Major Metabolic Pathways in Experimental Ulcerative Colitis. Metabolites 2024, 14, 194. [Google Scholar] [CrossRef] [PubMed]
- Ooi, M.; Nishiumi, S.; Yoshie, T.; Shiomi, Y.; Kohashi, M.; Fukunaga, K.; Nakamura, S.; Matsumoto, T.; Hatano, N.; Shinohara, M.; et al. GC/MS-Based Profiling of Amino Acids and TCA Cycle-Related Molecules in Ulcerative Colitis. Inflamm. Res. 2011, 60, 831–840. [Google Scholar] [CrossRef] [PubMed]
- Wang, M.; Zeng, J.; Zhu, Y.; Chen, X.; Guo, Q.; Tan, H.; Cui, B.; Song, S.; Deng, Y. A 4-Hydroxybenzoic Acid-Mediated Signaling System Controls the Physiology and Virulence of Shigella Sonnei. Microbiol. Spectr. 2023, 11, e04835-22. [Google Scholar] [CrossRef] [PubMed]
- Han, C.; Guo, N.; Bu, Y.; Peng, Y.; Li, X.; Ma, X.; Yang, M.; Jia, X.; Zhang, J.; Liu, X.; et al. Intestinal Microbiota and Antibiotic-Associated Acute Gastrointestinal Injury in Sepsis Mice. Aging 2021, 13, 10099–10111. [Google Scholar] [CrossRef] [PubMed]
- Tasker, J.; Herman, J. Mechanisms of Rapid Glucocorticoid Feedback Inhibition of the Hypothalamic–Pituitary–Adrenal Axis. Stress 2011, 14, 398–406. [Google Scholar] [CrossRef] [PubMed]
- Ziegler, C.; Mohn, C.; Lamounier-Zepter, V.; Rettori, V.; Bornstein, S.; Krug, A.; Ehrhart-Bornstein, M. Expression and Function of Endocannabinoid Receptors in the Human Adrenal Cortex. Horm. Metab. Res. 2010, 42, 88–92. [Google Scholar] [CrossRef] [PubMed]
- Reisenberg, M.; Singh, P.K.; Williams, G.; Doherty, P. The Diacylglycerol Lipases: Structure, Regulation and Roles in and beyond Endocannabinoid Signalling. Philos. Trans. R. Soc. B Biol. Sci. 2012, 367, 3264–3275. [Google Scholar] [CrossRef] [PubMed]
- Kondev, V.; Bluett, R.; Najeed, M.; Rosas-Vidal, L.; Grueter, B.; Patel, S. Ventral Hippocampal Diacylglycerol Lipase-Alpha Deletion Decreases Avoidance Behaviors and Alters Excitation-Inhibition Balance. Neurobiol. Stress. 2023, 22, 100510. [Google Scholar] [CrossRef] [PubMed]
- Savinainen, J.; Saario, S.; Laitinen, J.T. The Serine Hydrolases MAGL, ABHD6 and ABHD12 as Guardians of 2-Arachidonoylglycerol Signalling through Cannabinoid Receptors. Acta Physiol. 2012, 204, 267–276. [Google Scholar] [CrossRef] [PubMed]
- Hill, M.; Bierer, L.; Makotkine, I.; Golier, J.; Galea, S.; McEwen, B.; Hillard, C.; Yehuda, R. Reductions in Circulating Endocannabinoid Levels in Individuals with Post-Traumatic Stress Disorder Following Exposure to the World Trade Center Attacks. Psychoneuroendocrinology 2013, 38, 2952–2961. [Google Scholar] [CrossRef] [PubMed]
- Mwanza, C.; Chen, Z.; Zhang, Q.; Chen, S.; Wang, W.; Deng, H. Simultaneous HPLC-APCI-MS/MS Quantification of Endogenous Cannabinoids and Glucocorticoids in Hair. J. Chromatogr. B 2016, 1028, 1–10. [Google Scholar] [CrossRef] [PubMed]
- Li, D.; Hu, D.; Zhang, T.; Guo, X.; Shi, M.; Jin, W.; Zhang, B.; Liu, S. Cortisol content in hair of captive forest musk deer(Moschus berezovskii) and its indication. J. Nanjing For. Univ. (Nat. Sci. Ed.) 2022, 46, 236–240. (In Chinese) [Google Scholar]
- Li, Y.; Zhang, T.; Shi, M.; Zhang, B.; Hu, X.; Xu, S.; Ding, J.; Liu, S.; Hu, D.; Rubenstein, D. Characterization of Intestinal Microbiota and Fecal Cortisol, T3, and IgA in Forest Musk Deer (Moschus berezovskii) from Birth to Weaning. Integr. Zool. 2021, 16, 300–312. [Google Scholar] [CrossRef] [PubMed]
- Macbeth, B.; Cattet, M.; Stenhouse, G.B.; Gibeau, M.L.; Janz, D.M. Hair Cortisol Concentration as a Noninvasive Measure of Long-Term Stress in Free-Ranging Grizzly Bears (Ursus arctos): Considerations with Implications for Other Wildlife. Can. J. Zool. 2010, 88, 935–949. [Google Scholar] [CrossRef]
- Dettenborn, L.; Tietze, A.; Bruckner, F.; Kirschbaum, C. Higher Cortisol Content in Hair among Long-Term Unemployed Individuals Compared to Controls. Psychoneuroendocrinology 2010, 35, 1404–1409. [Google Scholar] [CrossRef] [PubMed]


| ID | Age (Years) | Gender | Description of Conditions |
|---|---|---|---|
| HP1 | 0.7 | ♀ | Hemorrhagic pneumonia |
| HP2 | 3 | ♂ | Hemorrhagic pneumonia |
| HP3 | 0.7 | ♂ | Hemorrhagic pneumonia, infant, infected from mother in the same enclosure |
| HP4 | 2 | ♀ | Hemorrhagic pneumonia |
| HP5 | 3 | ♂ | Hemorrhagic pneumonia |
| HP6 | 2 | ♀ | Hemorrhagic pneumonia, pregnant female |
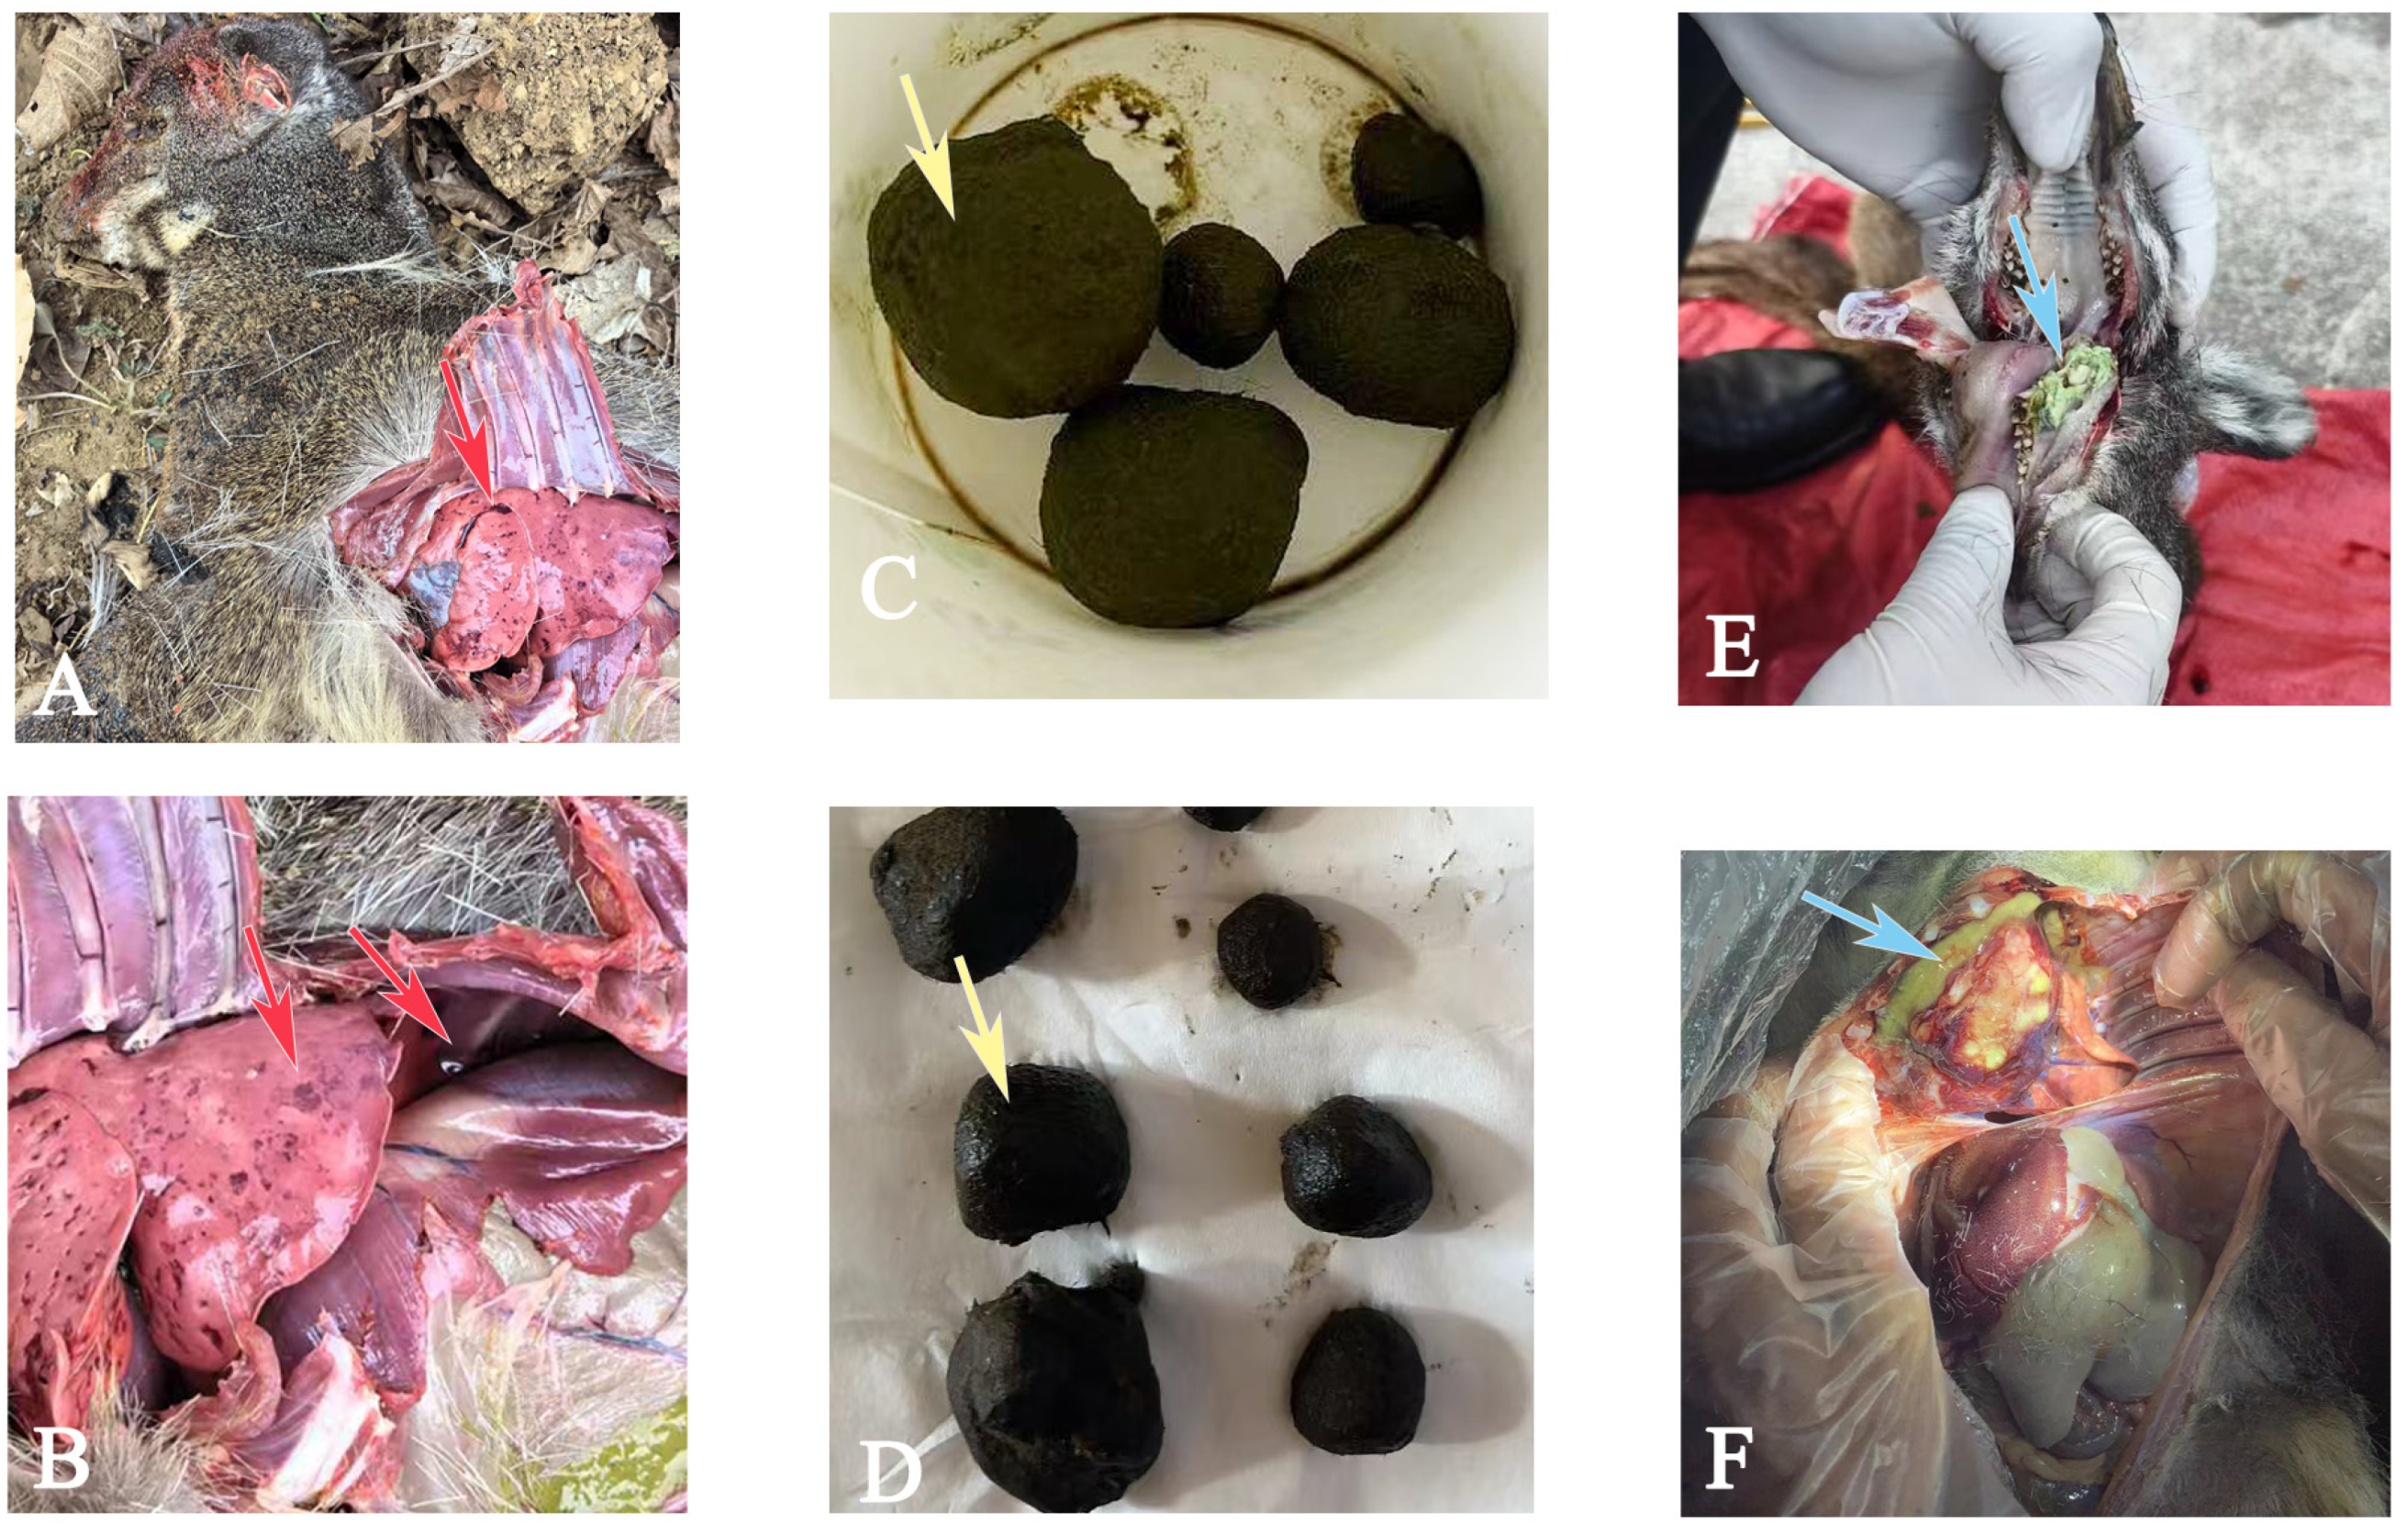
| PD1 | 2 | ♀ | Anorexia, rumen indigestion, presence of phytobezoars |
| PD2 | 4 | ♀ | Indigestion, chronic fecal impaction with undigested fibers, phytobezoars |
| PD3 | 2 | ♀ | Death due to gastrointestinal blockage induced by phytobezoars |
| PD4 | 6 | ♂ | Anorexia, vomiting, gastrointestinal obstruction caused by phytobezoars |
| PD5 | 2 | ♂ | Gastrointestinal obstruction caused by phytobezoars |
| PD6 | 4 | ♂ | Phytobezoar-induced gastrointestinal disease, anorexia, sudden death during treatment |
| AD1 | 1.5 | ♀ | Abscess disease, continuous weight loss |
| AD2 | 0.7 | ♂ | Post-mortem examination revealed abscesses in the lungs, sudden death in infant |
| AD3 | 1.8 | ♀ | Greenish pus in the leg, continuous weight loss |
| AD4 | 7 | ♂ | Post-mortem examination revealed abscesses in the thigh muscles and lungs |
| AD5 | 4 | ♂ | Visible abscess in the leg |
| AD6 | 7 | ♂ | Visible abscess in the leg |
| C1 | 0.7 | ♀ | Healthy, no record of past illness |
| C2 | 2 | ♀ | Healthy, no record of past illness |
| C3 | 4 | ♂ | Healthy, no record of past illness |
| C4 | 3 | ♂ | Healthy, no record of past illness |
| C5 | 2 | ♂ | Healthy, no record of past illness |
| C6 | 6 | ♂ | Healthy, no record of past illness |
Disclaimer/Publisher’s Note: The statements, opinions and data contained in all publications are solely those of the individual author(s) and contributor(s) and not of MDPI and/or the editor(s). MDPI and/or the editor(s) disclaim responsibility for any injury to people or property resulting from any ideas, methods, instructions or products referred to in the content. |
© 2025 by the authors. Licensee MDPI, Basel, Switzerland. This article is an open access article distributed under the terms and conditions of the Creative Commons Attribution (CC BY) license (https://creativecommons.org/licenses/by/4.0/).
Share and Cite
Yi, L.; Jiang, H.; Li, Y.; Xu, Z.; Zhang, H.; Hu, D. Hair Metabolomic Profiling of Diseased Forest Musk Deer (Moschus berezovskii) Using Ultra-High-Performance Liquid Chromatography–Tandem Mass Spectrometry (UHPLC-MS/MS). Animals 2025, 15, 2155. https://doi.org/10.3390/ani15142155
Yi L, Jiang H, Li Y, Xu Z, Zhang H, Hu D. Hair Metabolomic Profiling of Diseased Forest Musk Deer (Moschus berezovskii) Using Ultra-High-Performance Liquid Chromatography–Tandem Mass Spectrometry (UHPLC-MS/MS). Animals. 2025; 15(14):2155. https://doi.org/10.3390/ani15142155
Chicago/Turabian StyleYi, Lina, Han Jiang, Yajun Li, Zongtao Xu, Haolin Zhang, and Defu Hu. 2025. "Hair Metabolomic Profiling of Diseased Forest Musk Deer (Moschus berezovskii) Using Ultra-High-Performance Liquid Chromatography–Tandem Mass Spectrometry (UHPLC-MS/MS)" Animals 15, no. 14: 2155. https://doi.org/10.3390/ani15142155
APA StyleYi, L., Jiang, H., Li, Y., Xu, Z., Zhang, H., & Hu, D. (2025). Hair Metabolomic Profiling of Diseased Forest Musk Deer (Moschus berezovskii) Using Ultra-High-Performance Liquid Chromatography–Tandem Mass Spectrometry (UHPLC-MS/MS). Animals, 15(14), 2155. https://doi.org/10.3390/ani15142155