3.2. Effects of Rhodotorula mucilaginosa on the Antioxidant and Immune Enzyme Activities in the Hemolymph and Hepatopancreas of Red Claw Crayfish Infected with Aeromonas veronii
The homogeneity of variance test (Brown–Forsythe test) indicated that the assumption of the homogeneity of variance across groups was satisfied (F = 0.517,
p = 0.891), fulfilling a key prerequisite for analysis of variance. Two-factor ANOVA revealed that both the
R. mucilaginosa concentrations (F = 104.497,
p < 0.001, η
2 = 0.887) and treatment durations (F = 47.097,
p < 0.001, η
2 = 0.825) had highly significant main effects on the ACP activity of red clawed crayfish. However, the interaction between these two factors was not statistically significant (F = 1.281,
p = 0.267). The model demonstrated strong explanatory power (R
2 = 0.894), indicating that variations in ACP activity were primarily independently influenced by
R. mucilaginosa concentrations and treatment durations, as shown in
Table 5 and
Table 6.
Compared with the 0 h time point, infection with
A. veronii significantly increased the activity of ACP in the hepatopancreas of red claw crayfish at specific time points across different
R. mucilaginosa dosage groups. In the 0 g/kg and 10.0 g/kg groups, the ACP activity was significantly increased at 24 h and 48 h (
p < 0.05), with the 0 g/kg group showing 28.4% and 20.1% increases at 24 h and 48 h respectively, while the 10.0 g/kg group exhibited 28.9% and 24.8% increases at the corresponding time points. In the 0.1 g/kg group, the ACP activity significantly increased by 21.0% at 24 h (
p < 0.05). In the 1.0 g/kg group, the ACP activity showed significant increases of 21.6%, 15.9%, and 8.6% at 24 h, 48 h, and 72 h, respectively (
p < 0.05). Compared with the 0 g/kg group, after infection with
A. veronii, the activity of the ACP in the hepatopancreas of red claw crayfish significantly increased at the 0 h time point in the 0.1 g/kg and 1.0 g/kg groups (
p < 0.05), with enhancements of 21.0% and 34.3%, respectively. At the 24 h and 96 h time points, the ACP activity significantly increased in the 0.1 g/kg, 1.0 g/kg, and 10.0 g/kg groups (
p < 0.05), with the 0.1 g/kg group showing 12.9% and 19.5% increases, the 1.0 g/kg group demonstrating 28.0% and 38.7% increases, and the 10.0 g/kg group exhibiting 16.8% and 18.3% increases at these time points, respectively. At the 48 h time point, the ACP activity significantly increased by 30.8% and 21.1% in the 1.0 g/kg and 10.0 g/kg groups, respectively (
p < 0.05). At the 72 h time point, the ACP activity significantly increased by 31.7% in the 1.0 g/kg group (
p < 0.05), shown in
Figure 2.
The homogeneity of variance test (Brown–Forsythe test) indicated that the assumption of the homogeneity of variance across groups was satisfied (F = 0.584,
p = 0.872), fulfilling a key prerequisite for analysis of variance. Two-factor ANOVA revealed that
R. mucilaginosa concentrations (F = 107.574,
p < 0.001, η
2 = 0.890), treatment durations (F = 147.687,
p < 0.001, η
2 = 0.937), and
R. mucilaginosa concentrations × treatment durations (F = 4.663,
p < 0.001, η
2 = 0.583) had highly significant main effects on the AKP activity of red clawed crayfish. The model demonstrated strong explanatory power (R
2 = 0.942), indicating that variations in the AKP activity were primarily independently influenced by
R. mucilaginosa concentrations and treatment durations, shown in
Table 7 and
Table 8.
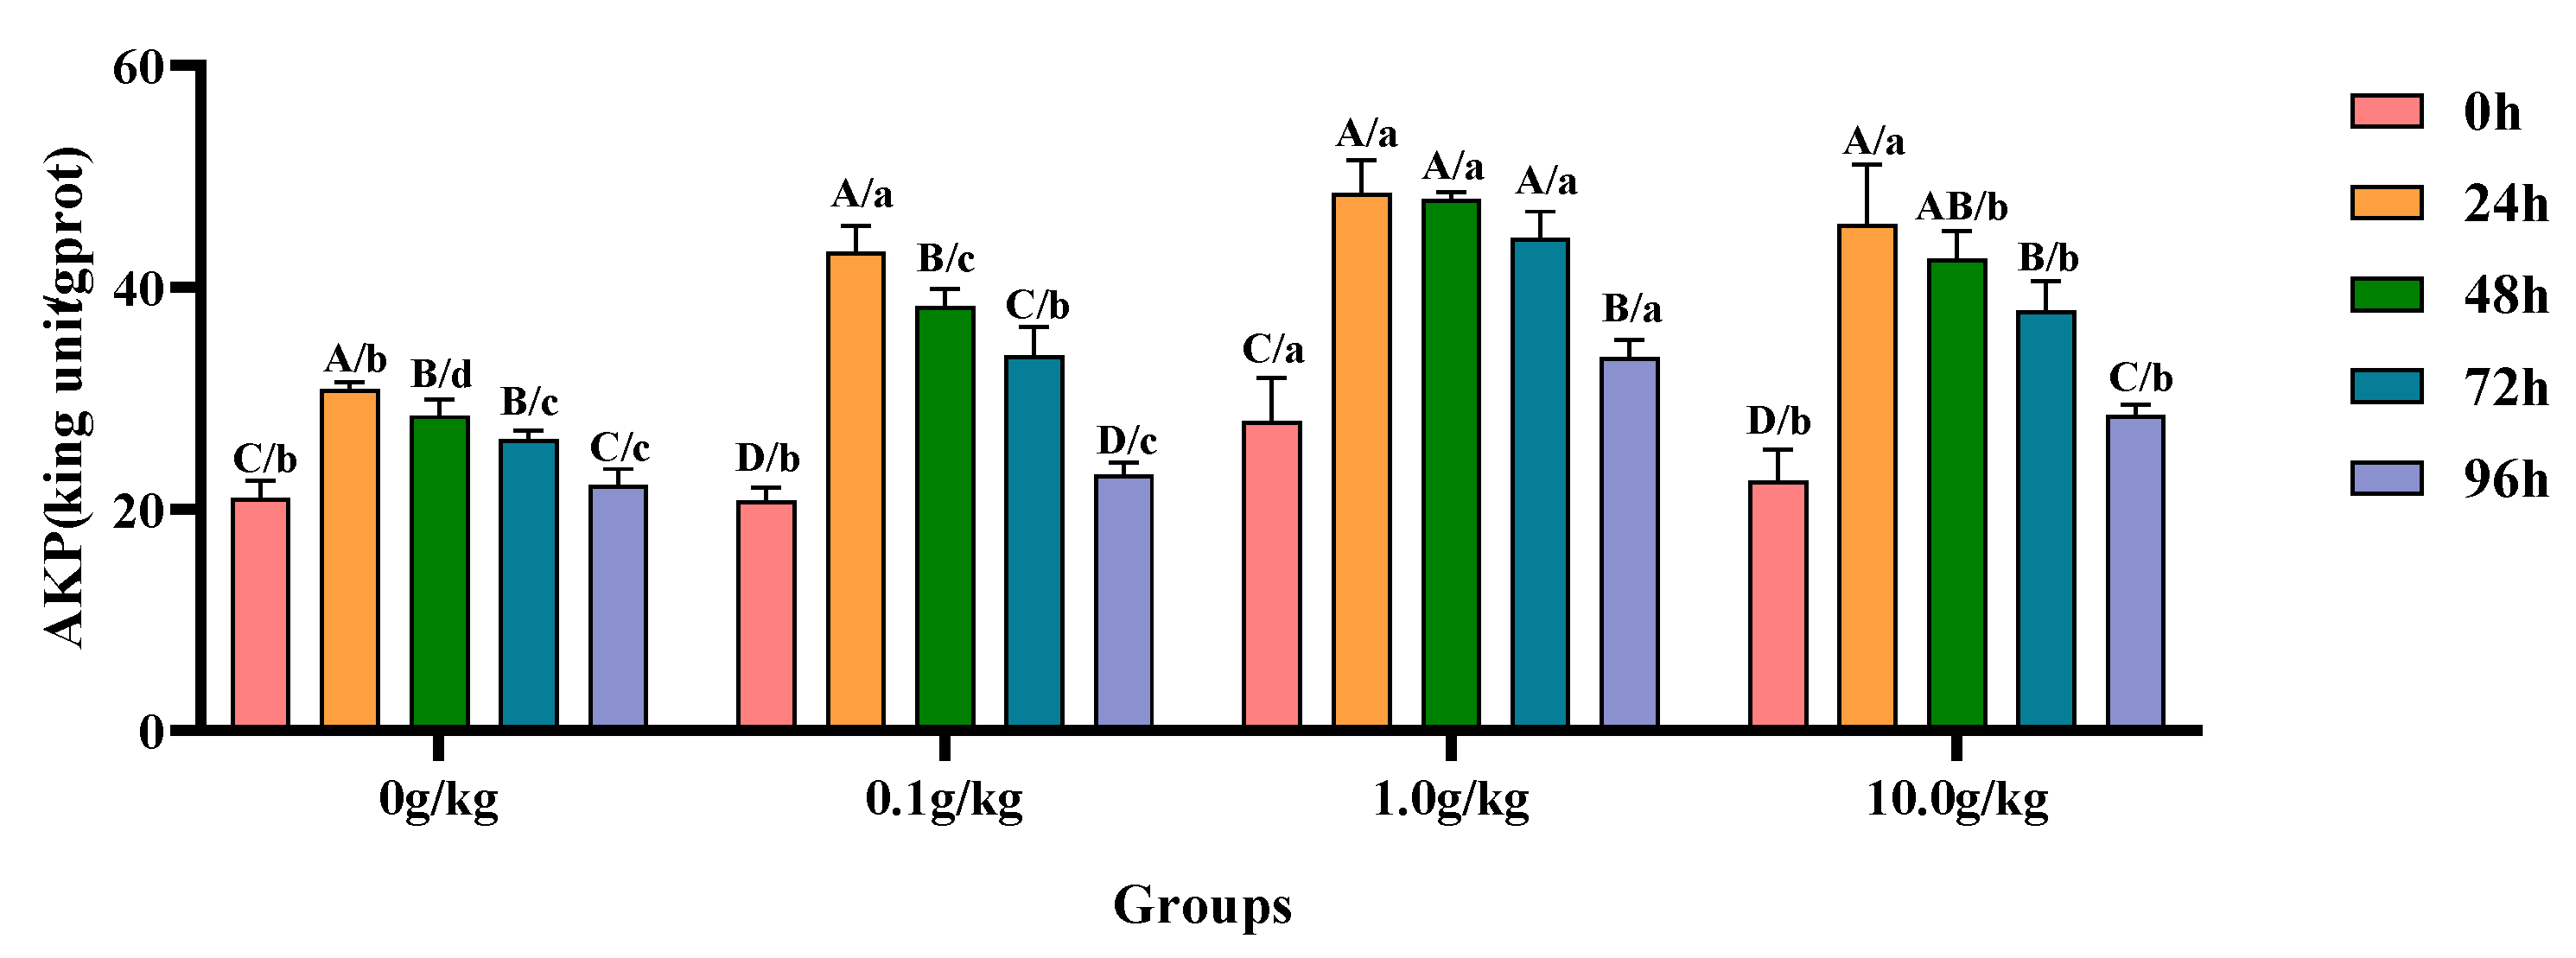
Compared with the 0 h time point, infection with
A. veronii significantly increased the activity of AKP in the hepatopancreas of red claw crayfish at specific time points across different
R. mucilaginosa dosage groups. In the 0 g/kg and 0.1 g/kg groups, the AKP activity significantly increased at 24 h, 48 h, and 72 h (
p < 0.05), with the 0 g/kg group showing increases of 32.0%, 26.2%, and 20.3%, while the 0.1 g/kg group exhibited increases of 51.9%, 45.8%, and 38.6% at these time points, respectively. In the 1.0 g/kg and 10.0 g/kg groups, the AKP activity significantly increased at 24 h, 48 h, 72 h, and 96 h (
p < 0.05), with the 1.0 g/kg group demonstrating increases of 42.5%, 41.8%, 37.2%, and 17.2%, while the 10.0 g/kg group showed increases of 50.7%, 47.2%, 40.7%, and 20.9% at these time points, respectively. Compared with the 0 g/kg group, after infection with
A. veronii, the activity of the AKP in the hepatopancreas of red claw crayfish significantly increased by 24.9% at the 0 h time point in the 1.0 g/kg group (
p < 0.05). At the 24 h, 48 h, and 72 h time points, the AKP activity significantly increased in the 0.1 g/kg, 1.0 g/kg, and 10.0 g/kg groups (
p < 0.05), with increases of 28.5%, 36.4%, and 32.5% at 24 h; 25.8%, 40.8%, and 33.3% at 48 h; and 22.2%, 40.8%, and 30.7% at 72 h, respectively. At the 96 h time point, the AKP activity significantly increased by 34.2% and 22.2% in the 1.0 g/kg and 10.0 g/kg groups, respectively (
p < 0.05), as shown in
Figure 3.
The homogeneity of the variance test (Brown–Forsythe test) indicated that the assumption of homogeneity of the variance across groups was satisfied (F = 0.448,
p = 0.949), fulfilling a key prerequisite for the analysis of variance. Two-factor ANOVA revealed that both the
R. mucilaginosa concentrations (F = 38.065,
p < 0.001, η
2 = 0.741) and treatment durations (F = 70.594,
p < 0.001, η
2 = 0.876) had highly significant main effects on the CAT activity of red clawed crayfish. However, the interaction between these two factors was not statistically significant (F = 0.995,
p = 0.471). The model demonstrated strong explanatory power (R
2 = 0.868), indicating that the variations in the CAT activity were primarily independently influenced by
R. mucilaginosa concentrations and treatment durations, as shown in
Table 9 and
Table 10.
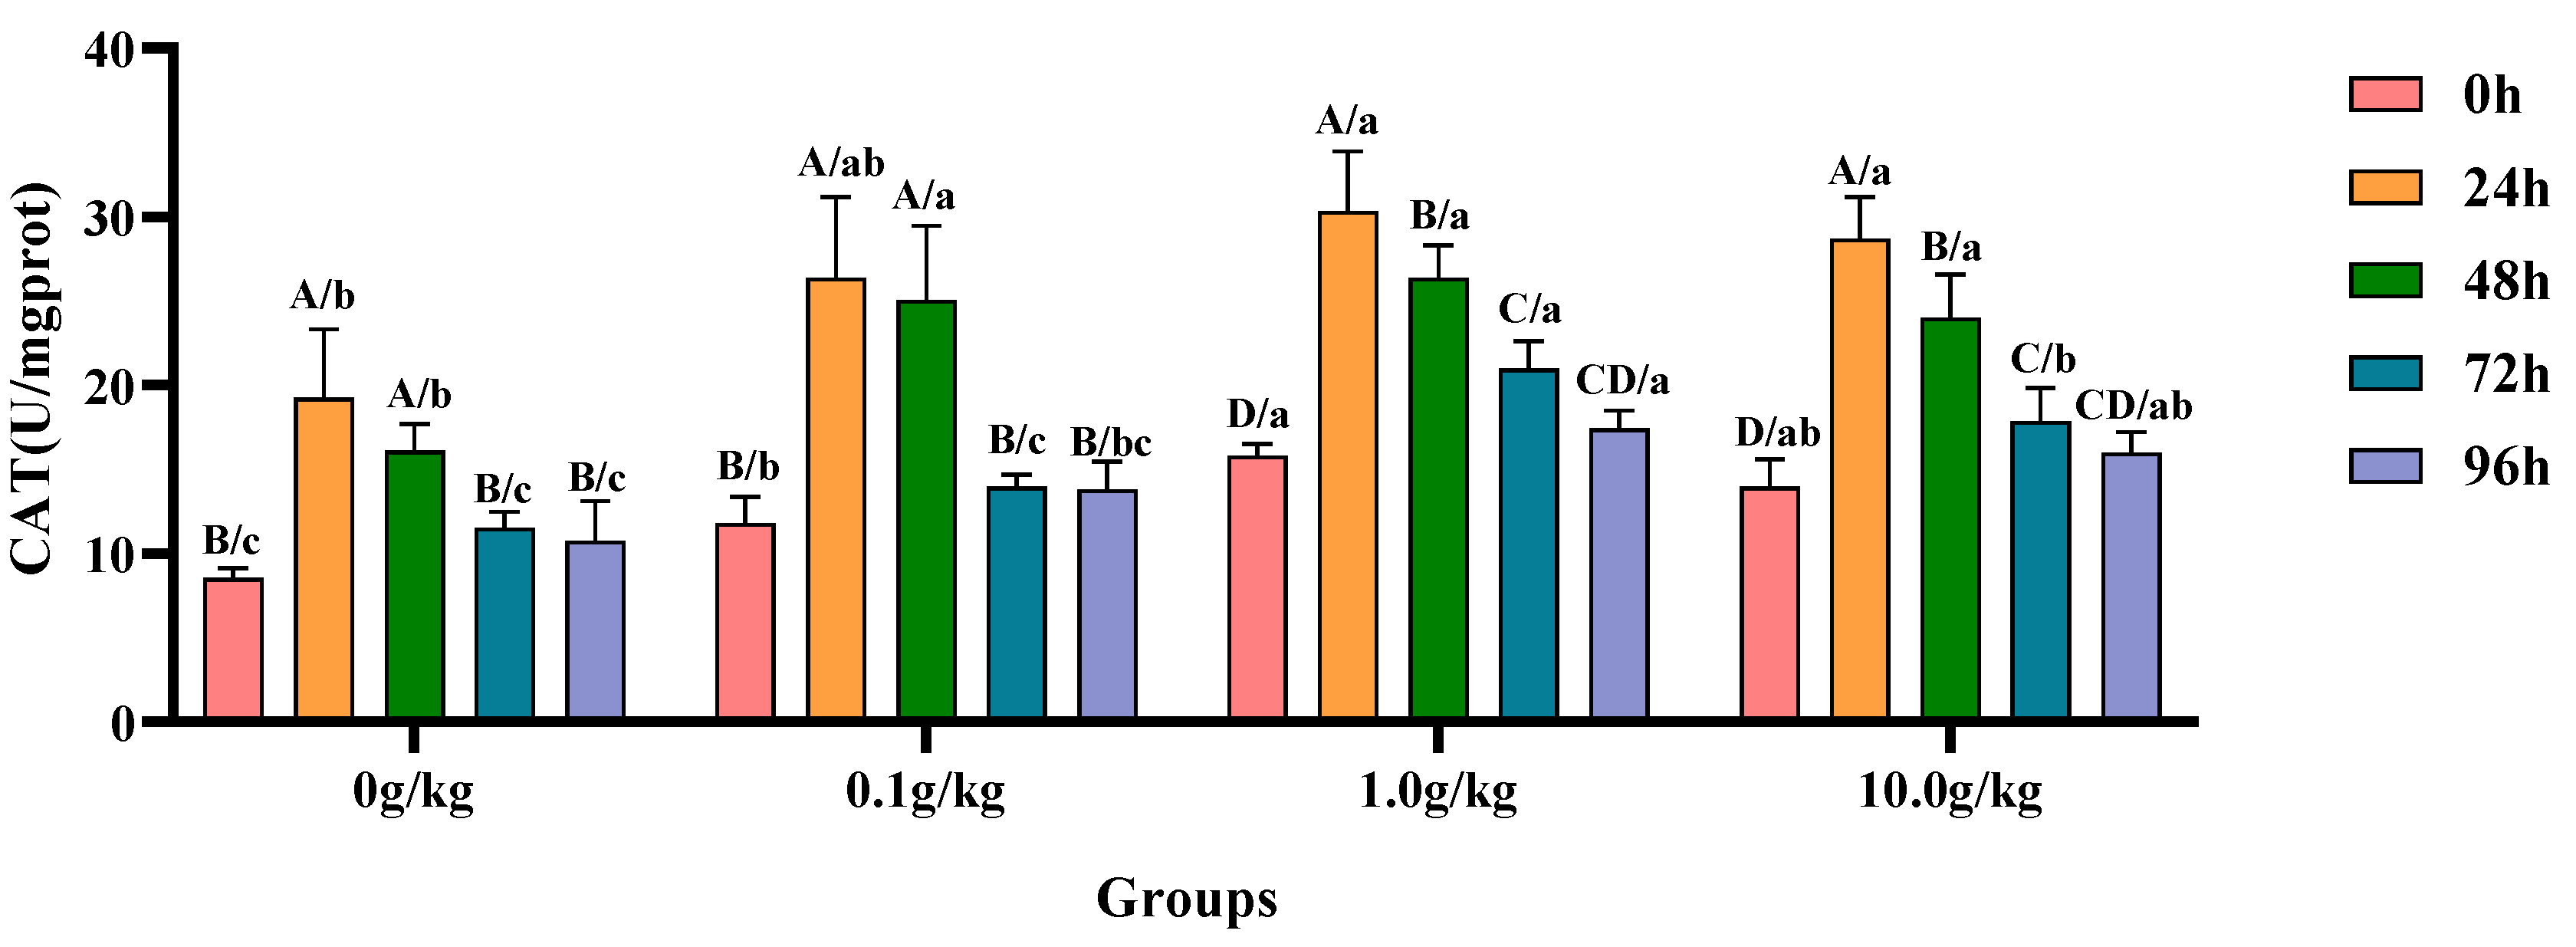
Compared with the 0 h time point, infection with
A. veronii significantly increased the activity of CAT in the hepatopancreas of red claw crayfish at specific time points across different
R. mucilaginosa dosage groups. In the 0 g/kg and 0.1 g/kg groups, CAT activity was significantly increased at 24 h and 48 h (
p < 0.05), with the 0 g/kg group showing 55.6% and 46.9% increases and the 0.1 g/kg group exhibiting 55.2% and 52.9% increases at these time points, respectively. In the 1.0 g/kg and 10.0 g/kg groups, the CAT activity significantly increased at 24 h, 48 h, and 72 h (
p < 0.05), with the 1.0 g/kg group demonstrating increases of 47.8%, 40.0%, and 24.6%, while the 10.0 g/kg group showed increases of 51.3%, 41.8%, and 21.8% at these time points, respectively. Compared with the 0 g/kg group, after infection with
A. veronii, the activity of CAT in the hepatopancreas of red claw crayfish significantly increased at the 0 h and 48 h time points in the 0.1 g/kg, 1.0 g/kg, and 10.0 g/kg groups (
p < 0.05), with increases of 27.6%, 45.9%, and 38.7% at 0 h and 35.7%, 38.9%, and 32.8% at 48 h respectively. At the 24 h, 72 h, and 96 h time points, the CAT activity significantly increased in the 1.0 g/kg and 10.0 g/kg groups (
p < 0.05), with increases of 36.5% and 32.9% at 24 h, 45.1% and 35.5% at 72 h, and 38.3% and 32.8% at 96 h, respectively, as shown in
Figure 4.
The homogeneity of variance test (Brown–Forsythe test) indicated that the assumption of homogeneity of variance across groups was satisfied (F = 1.042,
p = 0.482), fulfilling a key prerequisite for the analysis of variance. Two-factor ANOVA revealed that both the
R. mucilaginosa concentrations (F = 48.854,
p < 0.001, η
2 = 0.786) and treatment durations (F = 368.024,
p < 0.001, η
2 = 0.974) had highly significant main effects on the SOD activity of red clawed crayfish. The interaction between these two factors was significant (F = 2.536,
p = 0.014, η
2 = 0.432). The model demonstrated strong explanatory power (R
2 = 0.965), indicating that the variations in SOD activity were primarily independently influenced by
R. mucilaginosa concentrations and treatment durations, as shown in
Table 11 and
Table 12.
Compared with the 0 h time point, infection with
A. veronii significantly increased the activity of SOD in the hepatopancreas of red claw crayfish at specific time points across different
R. mucilaginosa dosage groups. In the 0 g/kg, 0.1 g/kg, and 1.0 g/kg groups, the SOD activity significantly increased at 24 h, 48 h, 72 h, and 96 h (
p < 0.05), with the 0 g/kg group showing increases of 45.1%, 30.0%, 27.7%, and 17.3%, the 0.1 g/kg group exhibiting increases of 38.5%, 22.3%, 23.2%, and 11.0%, and the 1.0 g/kg group demonstrating increases of 38.2%, 24.0%, 22.0%, and 17.4% at these time points, respectively. In the 10.0 g/kg group, the SOD activity was significantly increased at 24 h, 48 h, and 72 h (
p < 0.05), with increases of 35.1%, 18.0%, and 10.6%, respectively. Compared with the 0 g/kg group, after infection with
A. veronii, the activity of SOD in the hepatopancreas of red claw crayfish significantly increased at the 0 h, 24 h, 48 h, and 96 h time points in the 0.1 g/kg, 1.0 g/kg, and 10.0 g/kg groups (
p < 0.05), with increases of 14.7%, 19.1%, and 19.0% at 0 h; 4.3%, 8.9%, and 4.2% at 24 h; 5.2%, 12.1%, and 5.1% at 48 h; and 8.2%, 19.3%, and 7.5% at 96 h, respectively. At the 72 h time point, the SOD activity significantly increased by 9.5% and 12.8% in the 0.1 g/kg and 1.0 g/kg groups, respectively (
p < 0.05), as shown in
Figure 5.
The homogeneity of variance test (Brown–Forsythe test) indicated that the assumption of homogeneity of variance across groups was satisfied (F = 0.613,
p = 0.822), fulfilling a key prerequisite for the analysis of variance. The two-factor ANOVA revealed that
R. mucilaginosa concentrations (F = 200.358,
p < 0.001, η
2 = 0.938), treatment durations (F = 458.341,
p < 0.001, η
2 = 0.979), and
R. mucilaginosa concentrations × treatment durations (F = 10.695,
p < 0.001, η
2 = 0.762) had highly significant main effects on the TP content of the red clawed crayfish. The model demonstrated strong explanatory power (R
2 = 0.977), indicating that variations in the TP content were primarily independently influenced by
R. mucilaginosa concentrations and treatment durations, as shown in
Table 13 and
Table 14.
Compared with the 0 h time point,
A. veronii infection resulted in a significant decrease (10.1%) in hemolymph TP content at 96 h in the 0.1 g/kg group (
p < 0.05). The 1.0 g/kg group showed significant increases in the TP content of 17.1% at 24 h and 12.9% at 48 h post-infection (
p < 0.05). In the 10.0 g/kg group, the TP content was significantly elevated by 16.7% at 24 h (
p < 0.05). The treatment groups exhibited significantly elevated TP content relative to the 0 g/kg control at multiple post-infection time intervals, with the 0.1, 1.0, and 10.0 g/kg groups showing increases of 9.9%, 14.5%, and 9.2% at 0 h, 10.1%, 26.2%, and 15.5% at 48 h and 15.9%, 26.2%, and 17.0% at 72 h, respectively (
p < 0.05), while the 1.0 and 10.0 g/kg groups maintained significantly higher levels at 24 h (24.2% and 19.2%) and 96 h (14.0% and 10.1%) (
p < 0.05), as shown in
Figure 6.
The homogeneity of variance test (Brown–Forsythe test) indicated that the assumption of homogeneity of variance across groups was satisfied (F = 0.678,
p = 0.795), fulfilling a key prerequisite for the analysis of variance. Two-factor ANOVA revealed that
R. mucilaginosa concentrations (F = 2017.012,
p < 0.001, η
2 = 0.993), treatment durations (F = 788.309,
p < 0.001, η
2 = 0.987), and
R. mucilaginosa concentrations × treatment durations (F = 90.450,
p < 0.001, η
2 = 0.964) had highly significant main effects on the AKP activity of red clawed crayfish. The model demonstrated strong explanatory power (R
2 = 0.974), indicating that variations in the AKP activity were primarily independently influenced by
R. mucilaginosa concentrations and treatment durations, shown in
Table 15 and
Table 16.
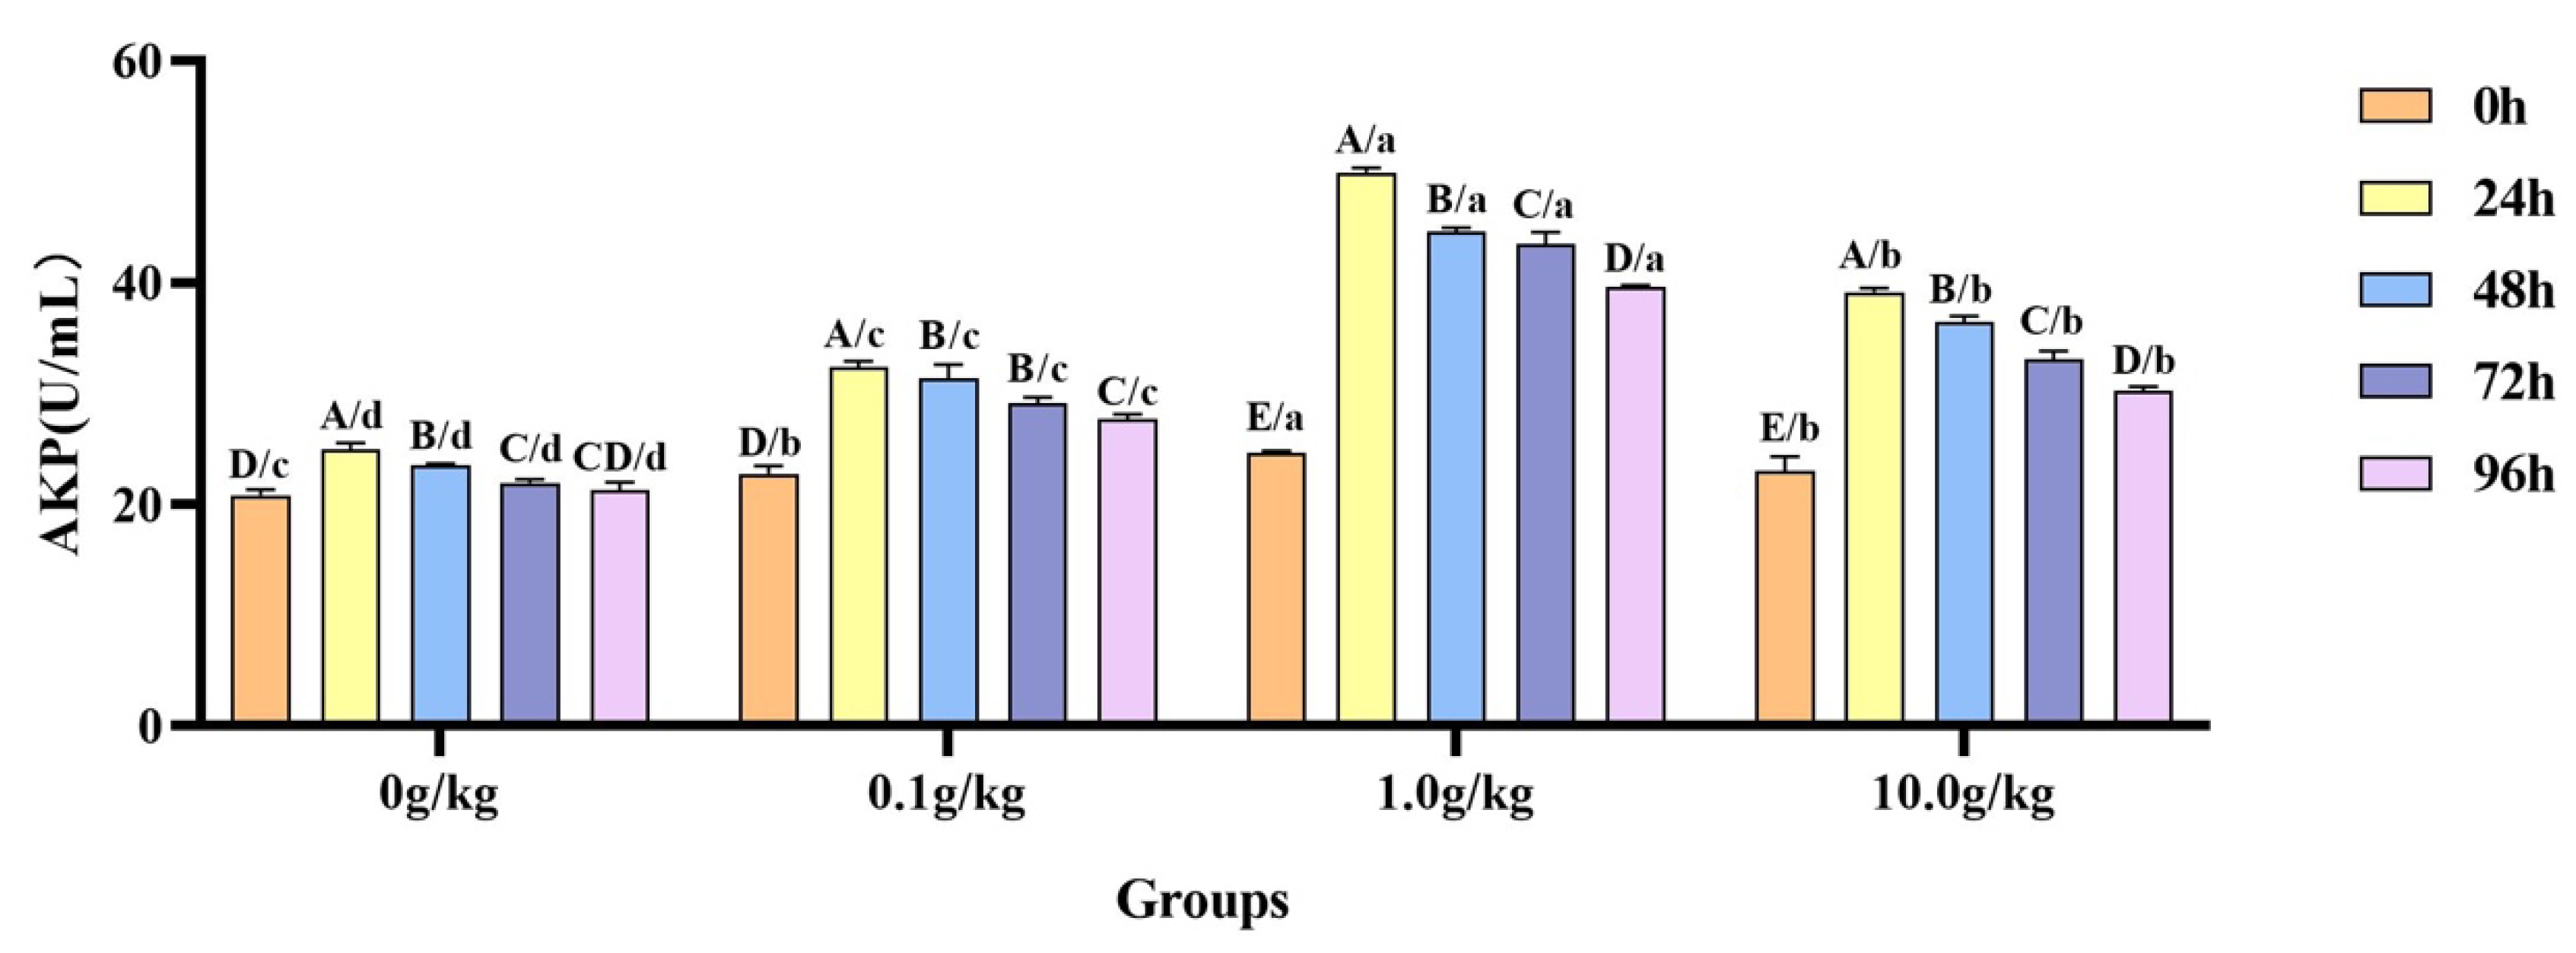
A comparative analysis revealed that
A. veronii infection induced significant temporal increases in hemolymph AKP activity across
R. mucilaginosa dosage groups (
Figure 7). The 0 g/kg group showed 16.4%, 11.5%, and 5.0% elevations at 24 h, 48 h, and 72 h, respectively (
p < 0.05). More pronounced enhancements were observed in the supplemented groups, as follows: 0.1 g/kg (29.9%, 27.6%, 22.1%, 17.9%), 1.0 g/kg (50.7%, 44.8%, 43.4%, 38.0%), and 10.0 g/kg (41.2%, 36.8%, 30.3%, 24.0%) at corresponding time points (24–96 h) (
p < 0.05). Compared with the 0 g/kg group, after infection with
A. veronii, the activity of the AKP in the hemolymph of red claw crayfish significantly increased at the 0 h, 24 h, 48 h, 72 h, and 96 h time points in the 0.1 g/kg, 1.0 g/kg, and 10.0 g/kg groups (
p < 0.05), with enhancements of 8.3%, 15.4%, and 9.5% at 0 h; 23.1%, 50.1%, and 36.4% at 24 h; 25.1%, 47.2%, and 40.0% at 48 h; 24.8%, 49.6%, and 33.6% at 72 h; and 23.2%, 46.4%, and 29.8% at 96 h, respectively, as shown in
Figure 7.
The homogeneity of variance test (Brown–Forsythe test) indicated that the assumption of homogeneity of variance across the groups was satisfied (F = 0.491,
p = 0.907), fulfilling a key prerequisite for the analysis of variance. Two-factor ANOVA revealed that both the
R. mucilaginosa concentrations (F = 52.406,
p < 0.001, η
2 = 0.979) and treatment durations (F = 155.019,
p < 0.001, η
2 = 0.939) had highly significant main effects on the LZM activity of red clawed crayfish. The interaction between these two factors was significant (F = 3.353,
p = 0.002, η
2 = 0.501). The model demonstrated strong explanatory power (R
2 = 0.931), indicating that variations in the LZM activity were primarily independently influenced by
R. mucilaginosa concentrations and treatment durations, as shown in
Table 17 and
Table 18.
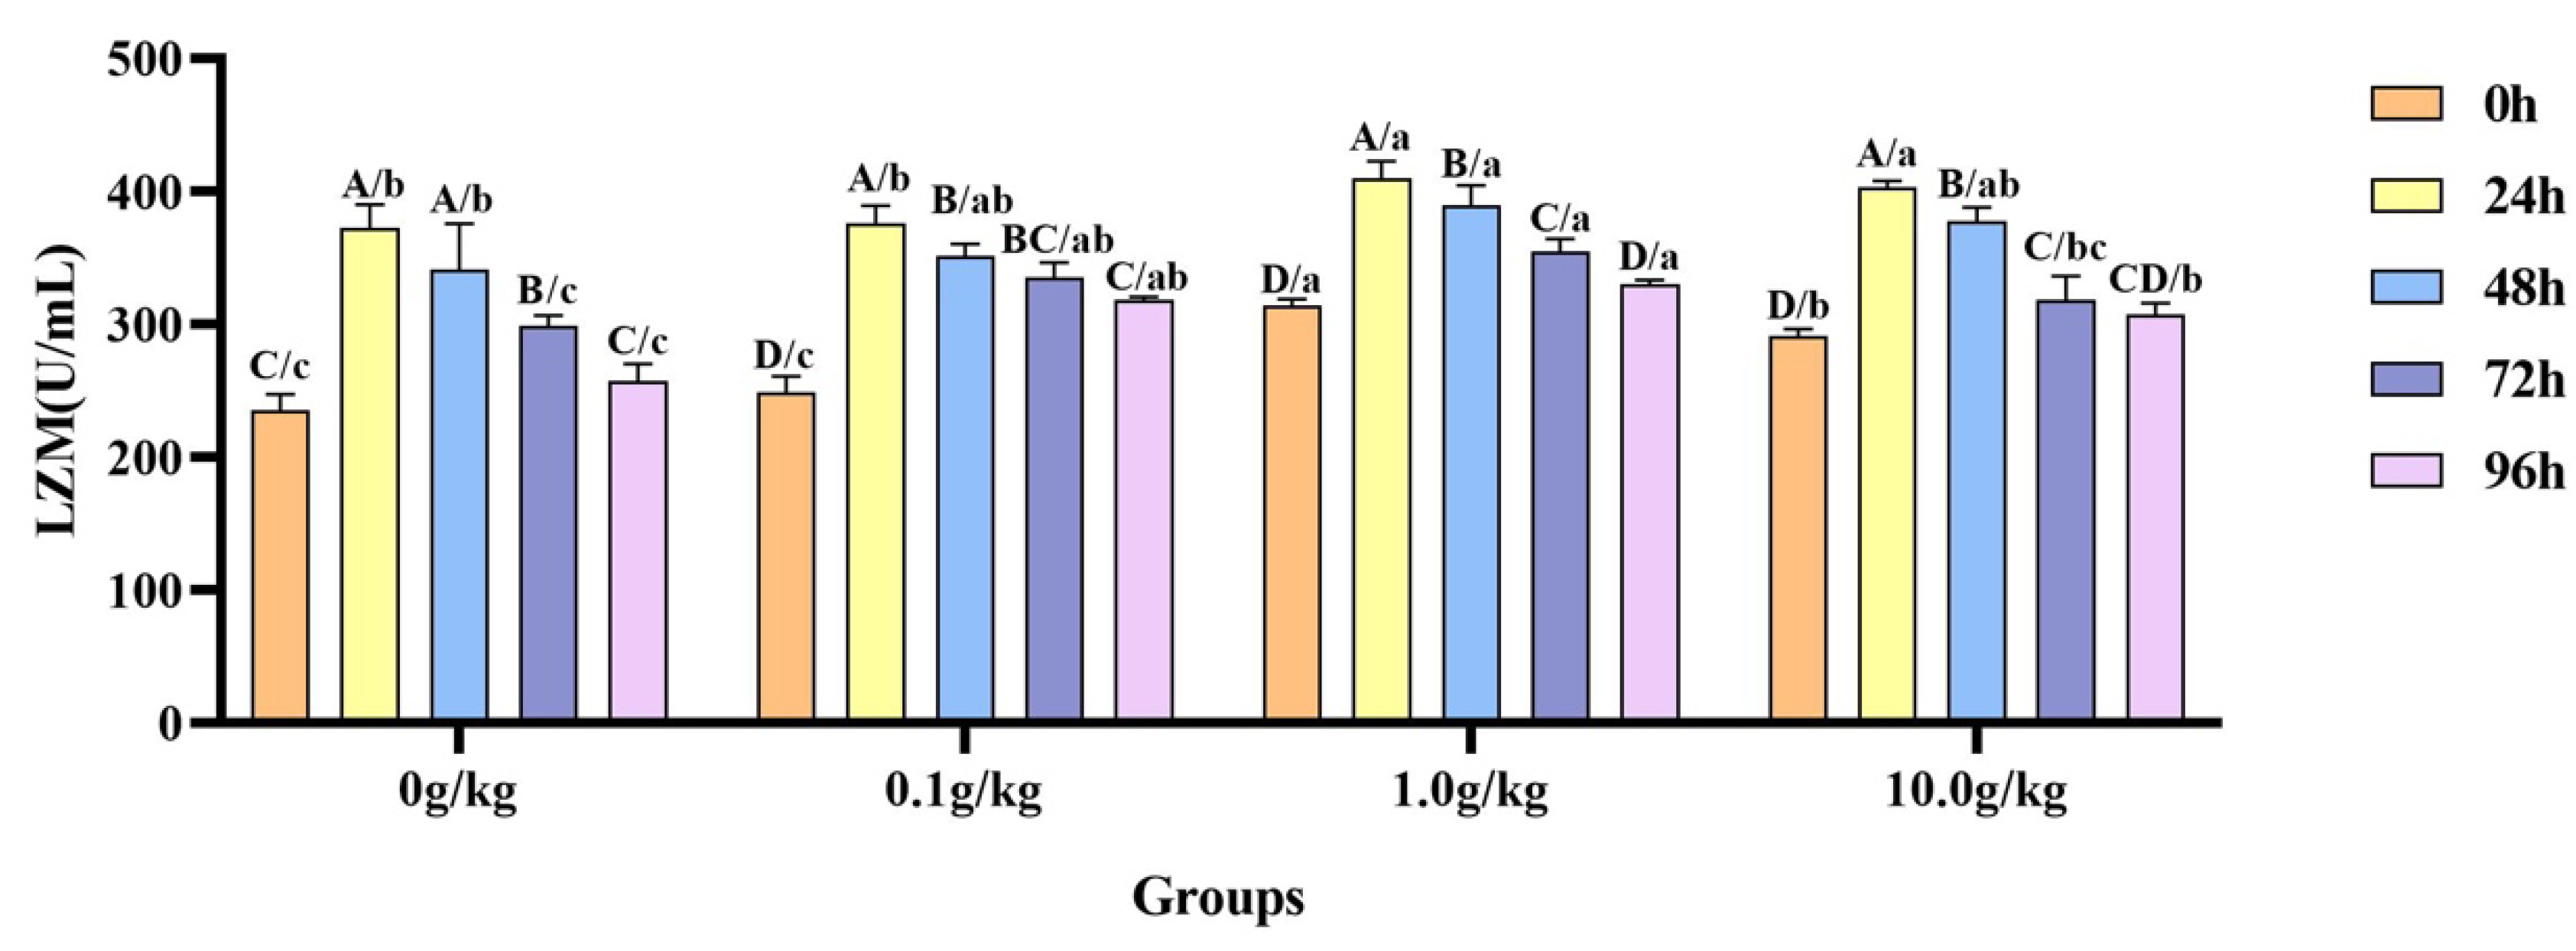
Compared with the 0 h time point, infection with
A. veronii significantly increased the activity of the LZM in the hemolymph of red claw crayfish at specific time points across different
R. mucilaginosa dosage groups. In the 0 g/kg, 1.0 g/kg, and 10.0 g/kg groups, the LZM activity significantly increased at 24 h, 48 h, and 72 h (
p < 0.05), with the activity in the 0 g/kg group being enhanced by 36.8%, 31.0%, and 21.2% at the three time points, the 1.0 g/kg group by 23.4%, 19.4%, and 11.6%, and the 10.0 g/kg group by 27.7%, 22.7%, and 8.3%, respectively. In the 0.1 g/kg group, the LZM activity significantly increased at 24 h, 48 h, 72 h, and 96 h (
p < 0.05), with elevations of 33.7%, 29.2%, 25.8%, and 21.8%, respectively. Compared with the 0 g/kg group, after infection with
A. veronii, the activity of the LZM in the hemolymph of red claw crayfish significantly increased at the 0 h and 24 h time points in the 1.0 g/kg and 10.0 g/kg groups (
p < 0.05), showing enhancements of 25.0% and 19.2% at 0 h and 9.0% and 7.6% at 24 h, respectively. At the 48 h time point, the LZM activity significantly increased by 12.4% in the 1.0 g/kg group (
p < 0.05). At the 72 h time point, the LZM activity significantly increased in the 0.1 g/kg (10.9%) and 1.0 g/kg (15.8%) groups (
p < 0.05). At the 96 h time point, the LZM activity was significantly increased in the 0.1 g/kg (19.0%), 1.0 g/kg (21.9%), and 10.0 g/kg (16.1%) groups (
p < 0.05), as shown in
Figure 8.
The homogeneity of variance test (Brown–Forsythe test) indicated that the assumption of homogeneity of variance across the groups was satisfied (F = 0.752,
p = 0.720), fulfilling a key prerequisite for the analysis of variance. Two-factor ANOVA revealed that both the
R. mucilaginosa concentrations (F = 53.786,
p < 0.001, η
2 = 0.801) and treatment durations (F = 60.722,
p < 0.001, η
2 = 0.859) had highly significant main effects on the AST activity of red clawed crayfish. The interaction between these two factors was significant (F = 2.160,
p = 0.034, η
2 = 0.393). The model demonstrated strong explanatory power (R
2 = 0.875), indicating that variations in the AST activity were primarily independently influenced by
R. mucilaginosa concentrations and treatment durations, as shown in
Table 19 and
Table 20.
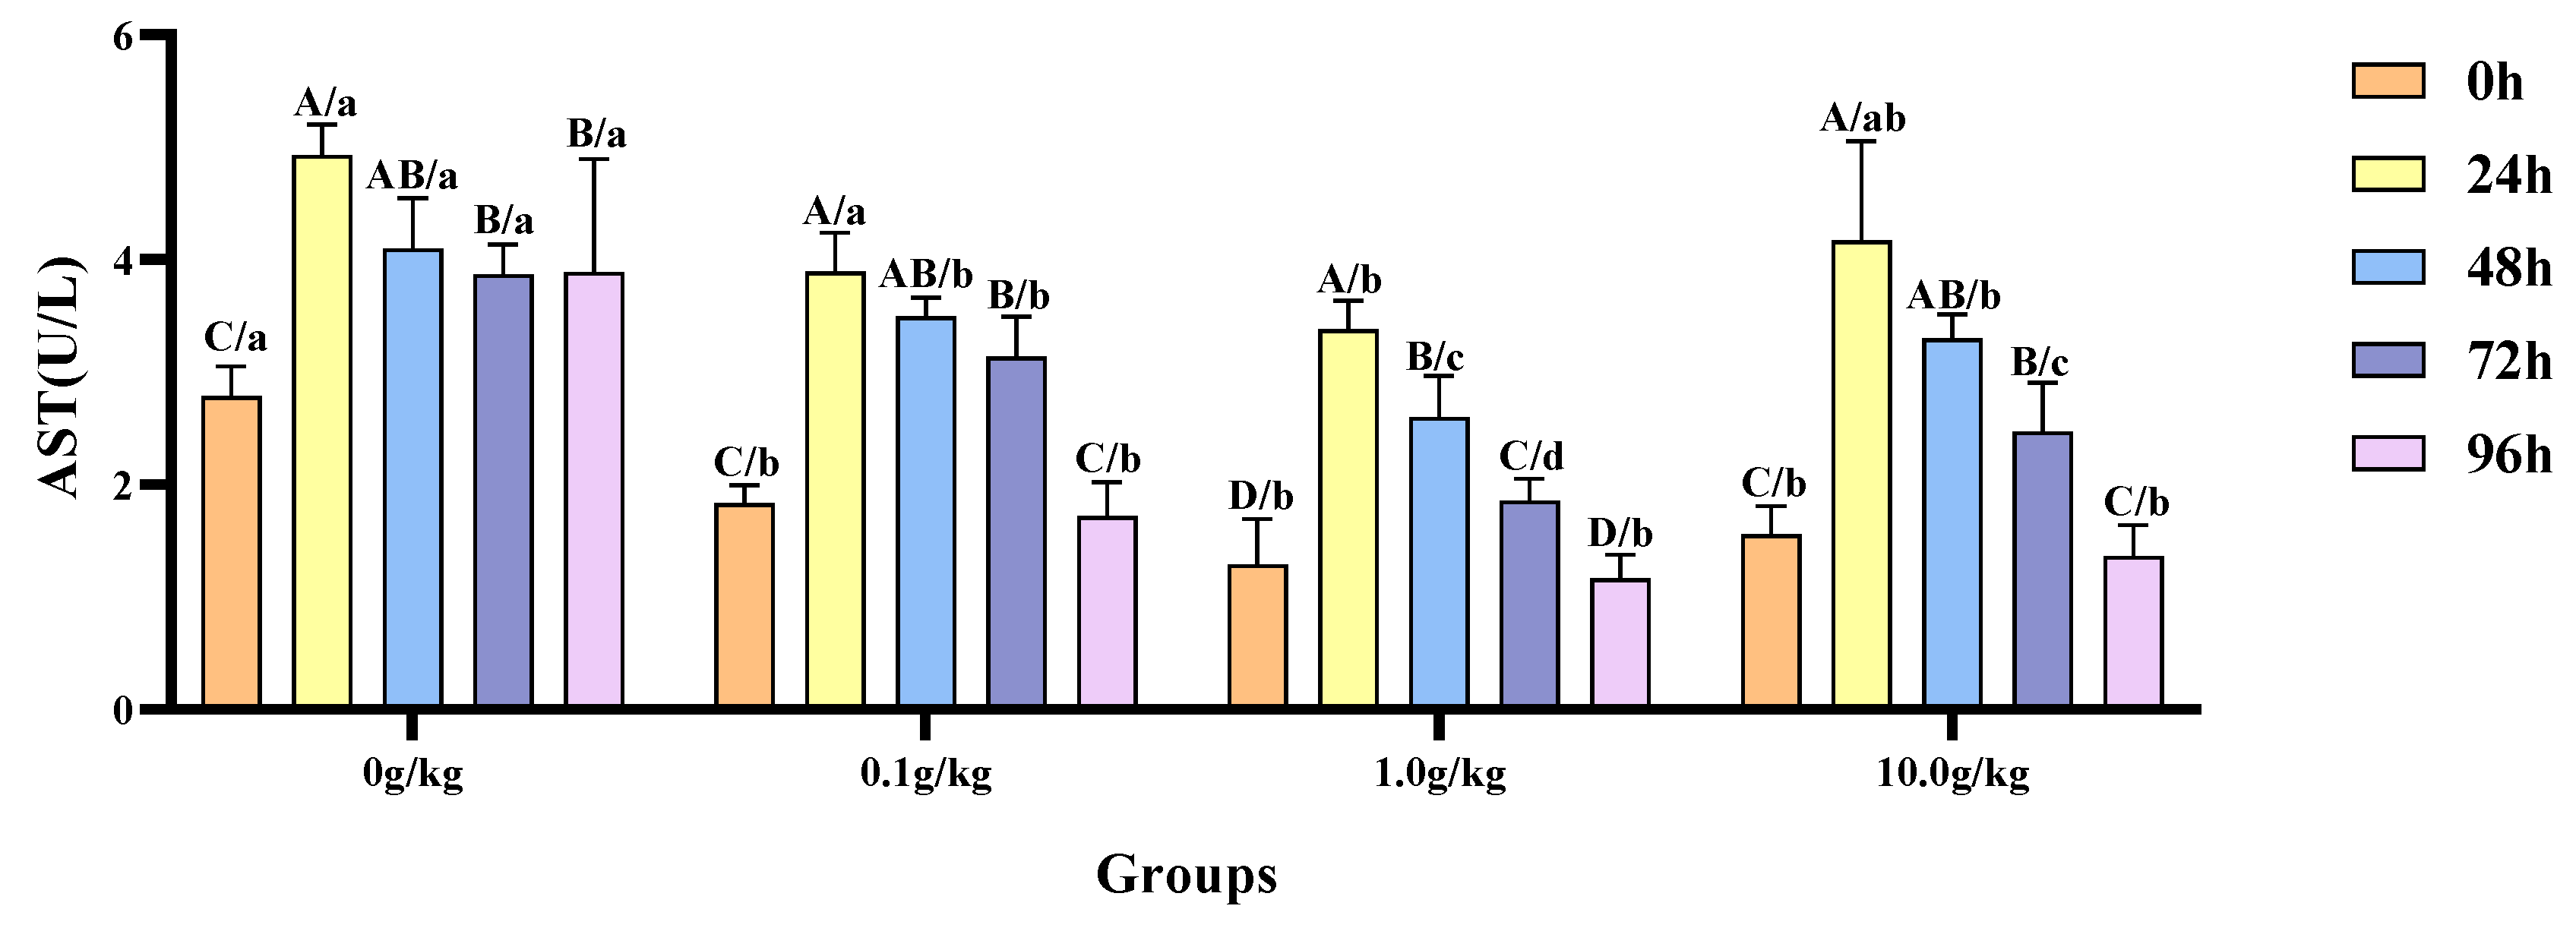
Relative to the baseline measurements at 0 h, the hemolymph AST activity in red claw crayfish exhibited significant elevation at designated intervals following
A. veronii infection, with variations observed among distinct dosage cohorts of
R. mucilaginosa supplementation. Within the 0 g/kg group, enzymatic activity demonstrated statistically substantial rises (
p < 0.05) of 43.5%, 32.0%, 28.0%, and 28.4% at 24 h, 48 h, 72 h, and 96 h post-infection respectively. The experimental groups receiving 0.1 g/kg, 1.0 g/kg, and 10.0 g/kg dosages displayed marked AST activation (
p < 0.05) during the 24 h, 48 h, and 72 h examinations, with the 0.1 g/kg cohort showing increments of 53.0%, 47.6%, and 41.7% and the 1.0 g/kg group demonstrating 61.9%, 50.5%, and 30.7% enhancements; while the 10.0 g/kg supplementation yielded 60.2%, 52.8%, and 37.0% augmented activity at corresponding timepoints. When benchmarked against the untreated control,
A.-veronii-challenged crayfish administered with 0.1 g/kg, 1.0 g/kg, or 10.0 g/kg
R. mucilaginosa manifested statistically significant suppression (
p < 0.05) of hemolymph AST levels at 0 h (52.3%, 116.3%, and 79.0% reduction, respectively), 48 h (17.4%, 57.6%, and 24.3%), 72 h (23.3%, 108.0%, and 56.4%), and 96 h (126.4%, 232.8%, and 185.1%), indicating dose-dependent modulation of enzymatic response. Notably, a singular 45.7% diminution (
p < 0.05) was recorded exclusively in the 1.0 g/kg treatment group at 24 h, as visually documented in
Figure 9.
The homogeneity of variance test (Brown–Forsythe test) indicated that the assumption of the homogeneity of variance across groups was satisfied (F = 0.718,
p = 0.765), fulfilling a key prerequisite for analysis of variance. Two-factor ANOVA revealed that both the
R. mucilaginosa concentrations (F = 69.984,
p < 0.001, η
2 = 0.840) and treatment durations (F = 32.677,
p < 0.001, η
2 = 0.766) had highly significant main effects on the ALT activity of red clawed crayfish. However, the interaction between these two factors was not statistically significant (F = 1.933,
p = 0.059). The model demonstrated strong explanatory power (R
2 = 0.854), indicating that variations in the ALT activity were primarily independently influenced by
R. mucilaginosa concentrations and treatment durations, as shown in
Table 21 and
Table 22.
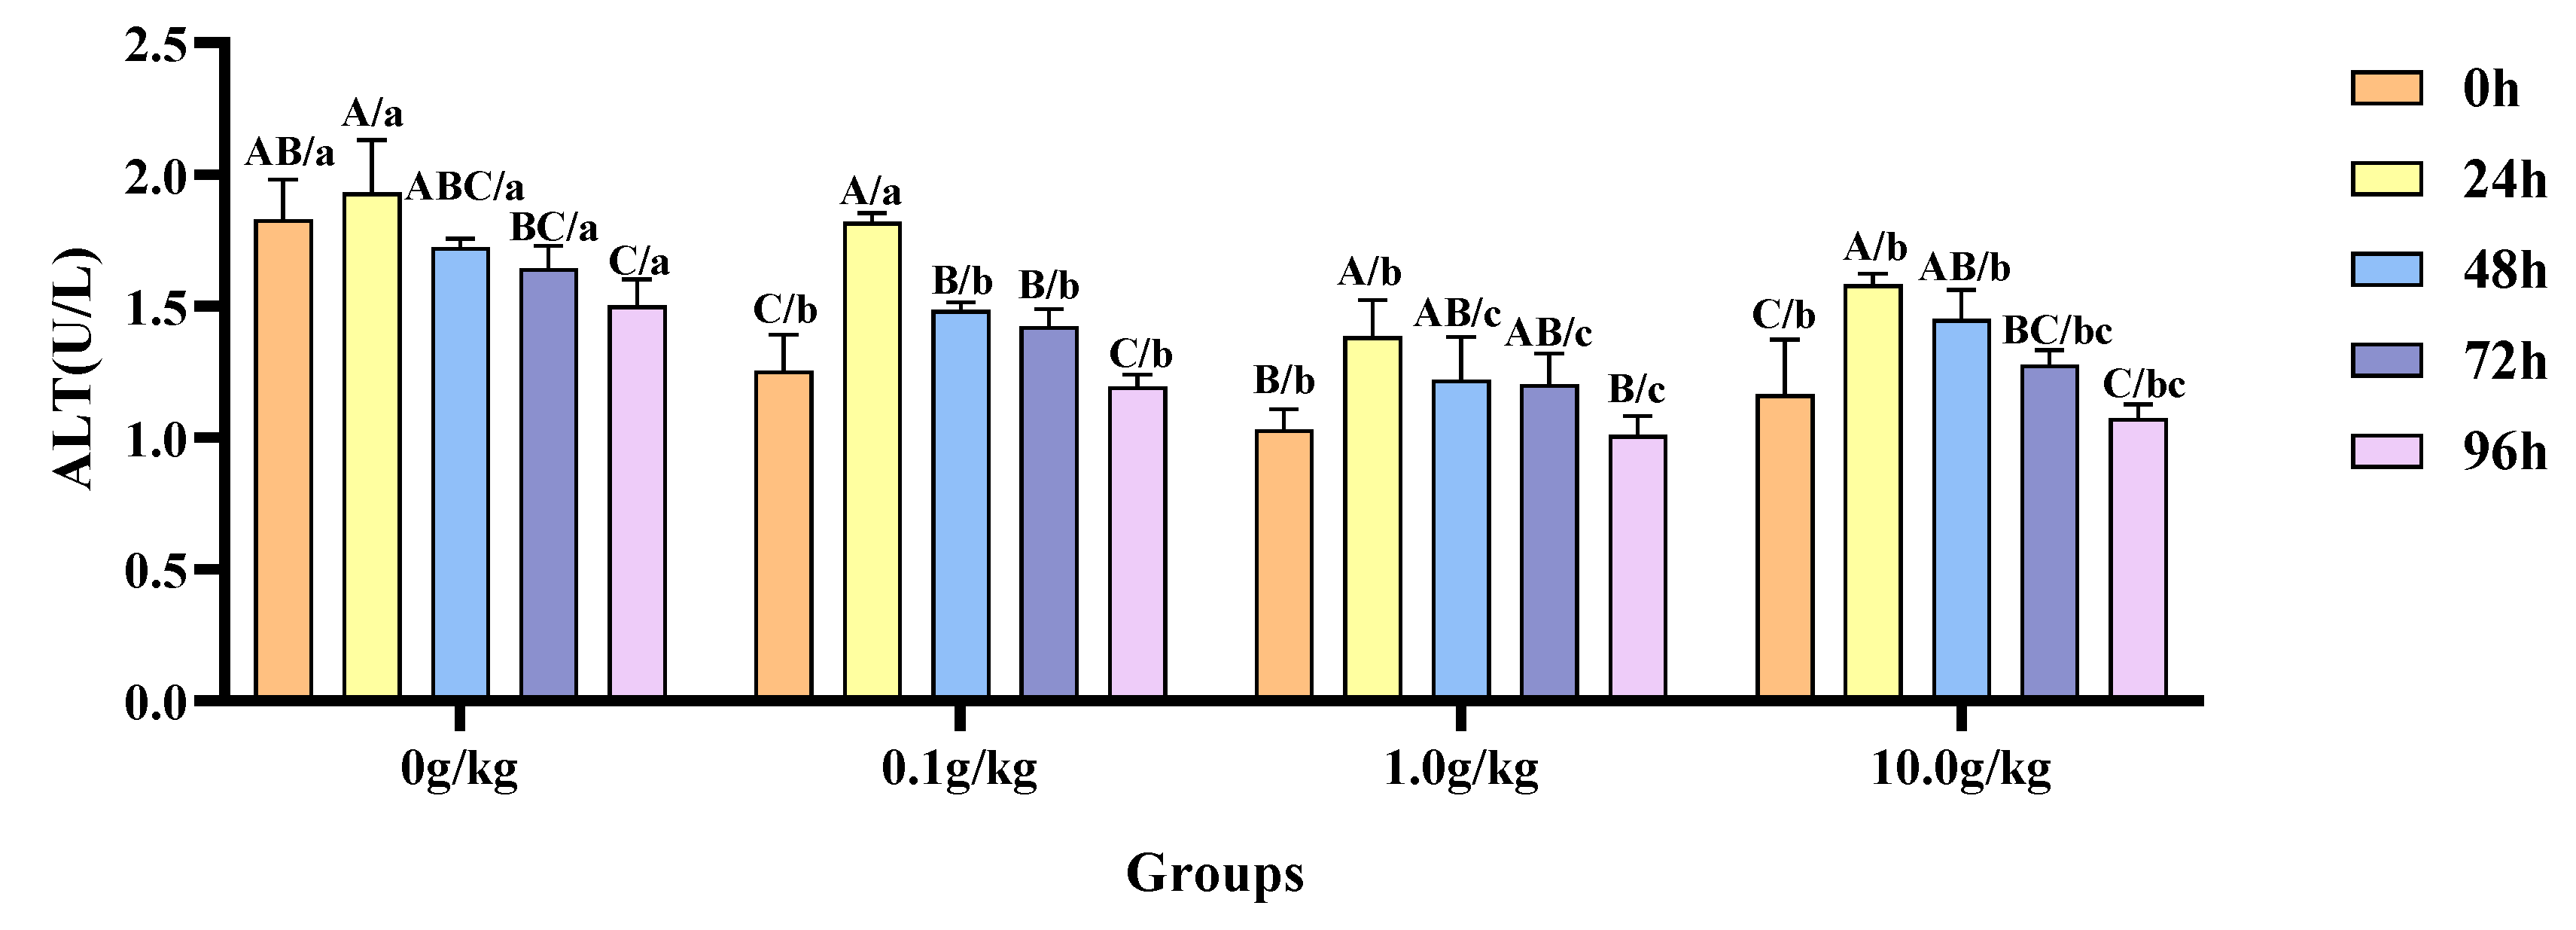
Relative to the baseline measurements at 0 h,
A. veronii infection induced a statistically significant reduction (
p < 0.05) in hemolymph ALT activity by 21.8% at 96 h in the 0 g/kg group. Conversely, the 0.1 g/kg
R. mucilaginosa supplementation group exhibited marked declines (
p < 0.05) in the enzymatic activity—31.0%, 15.5%, and 11.8%—at 24 h, 48 h, and 72 h post-infection, respectively. In the 1.0 g/kg group, the ALT activity was significantly increased by 25.5% at 24 h (
p < 0.05). The highest dosage group (10.0 g/kg) demonstrated significant attenuation (
p < 0.05) of ALT activity, with reductions of 26.3% and 19.6% recorded at 24 h and 48 h, respectively. When benchmarked against the untreated control,
A.-veronii-infected crayfish receiving
R. mucilaginosa exhibited dose-dependent suppression (
p < 0.05) of ALT activity at 0 h (45.8%, 77.4%, and 56.9% reductions for 0.1 g/kg, 1.0 g/kg, and 10.0 g/kg groups), 48 h (16.0%, 41.3%, and 18.9%), 72 h (15.4%, 36.6%, and 28.6%), and 96 h (28.5%, 48.6%, and 39.8%), underscoring the probiotic’s regulatory effects across multiple temporal phases. Notably, at 24 h post-infection, the 1.0 g/kg and 10.0 g/kg groups displayed further ALT inhibition (
p < 0.05) by 39.5% and 22.1%, respectively, as illustrated in
Figure 10.
3.3. Effects of Rhodotorula mucilaginosa on the Relative Expression Levels of Antioxidant- and Immune-Related Genes in the Hepatopancreas of Red Claw Crayfish Infected with Aeromonas veronii
The homogeneity of variance test (Brown–Forsythe test) indicated that the assumption of homogeneity of variance across the groups was satisfied (F = 1.326,
p = 0.329), fulfilling a key prerequisite for the analysis of variance. Two-factor ANOVA revealed that
R. mucilaginosa concentrations (F = 153.178,
p < 0.001, η
2 = 0.920), treatment durations (F = 36.672,
p < 0.001, η
2 = 0.986), and
R. mucilaginosa concentrations × treatment durations (F = 6.184,
p < 0.001, η
2 = 0.650) had highly significant main effects on the
spi gene expression of red clawed crayfish. The model demonstrated strong explanatory power (R
2 = 0.918), indicating that variations in
spi gene expression were primarily independently influenced by
R. mucilaginosa concentrations and treatment durations, as shown in
Table 23 and
Table 24.
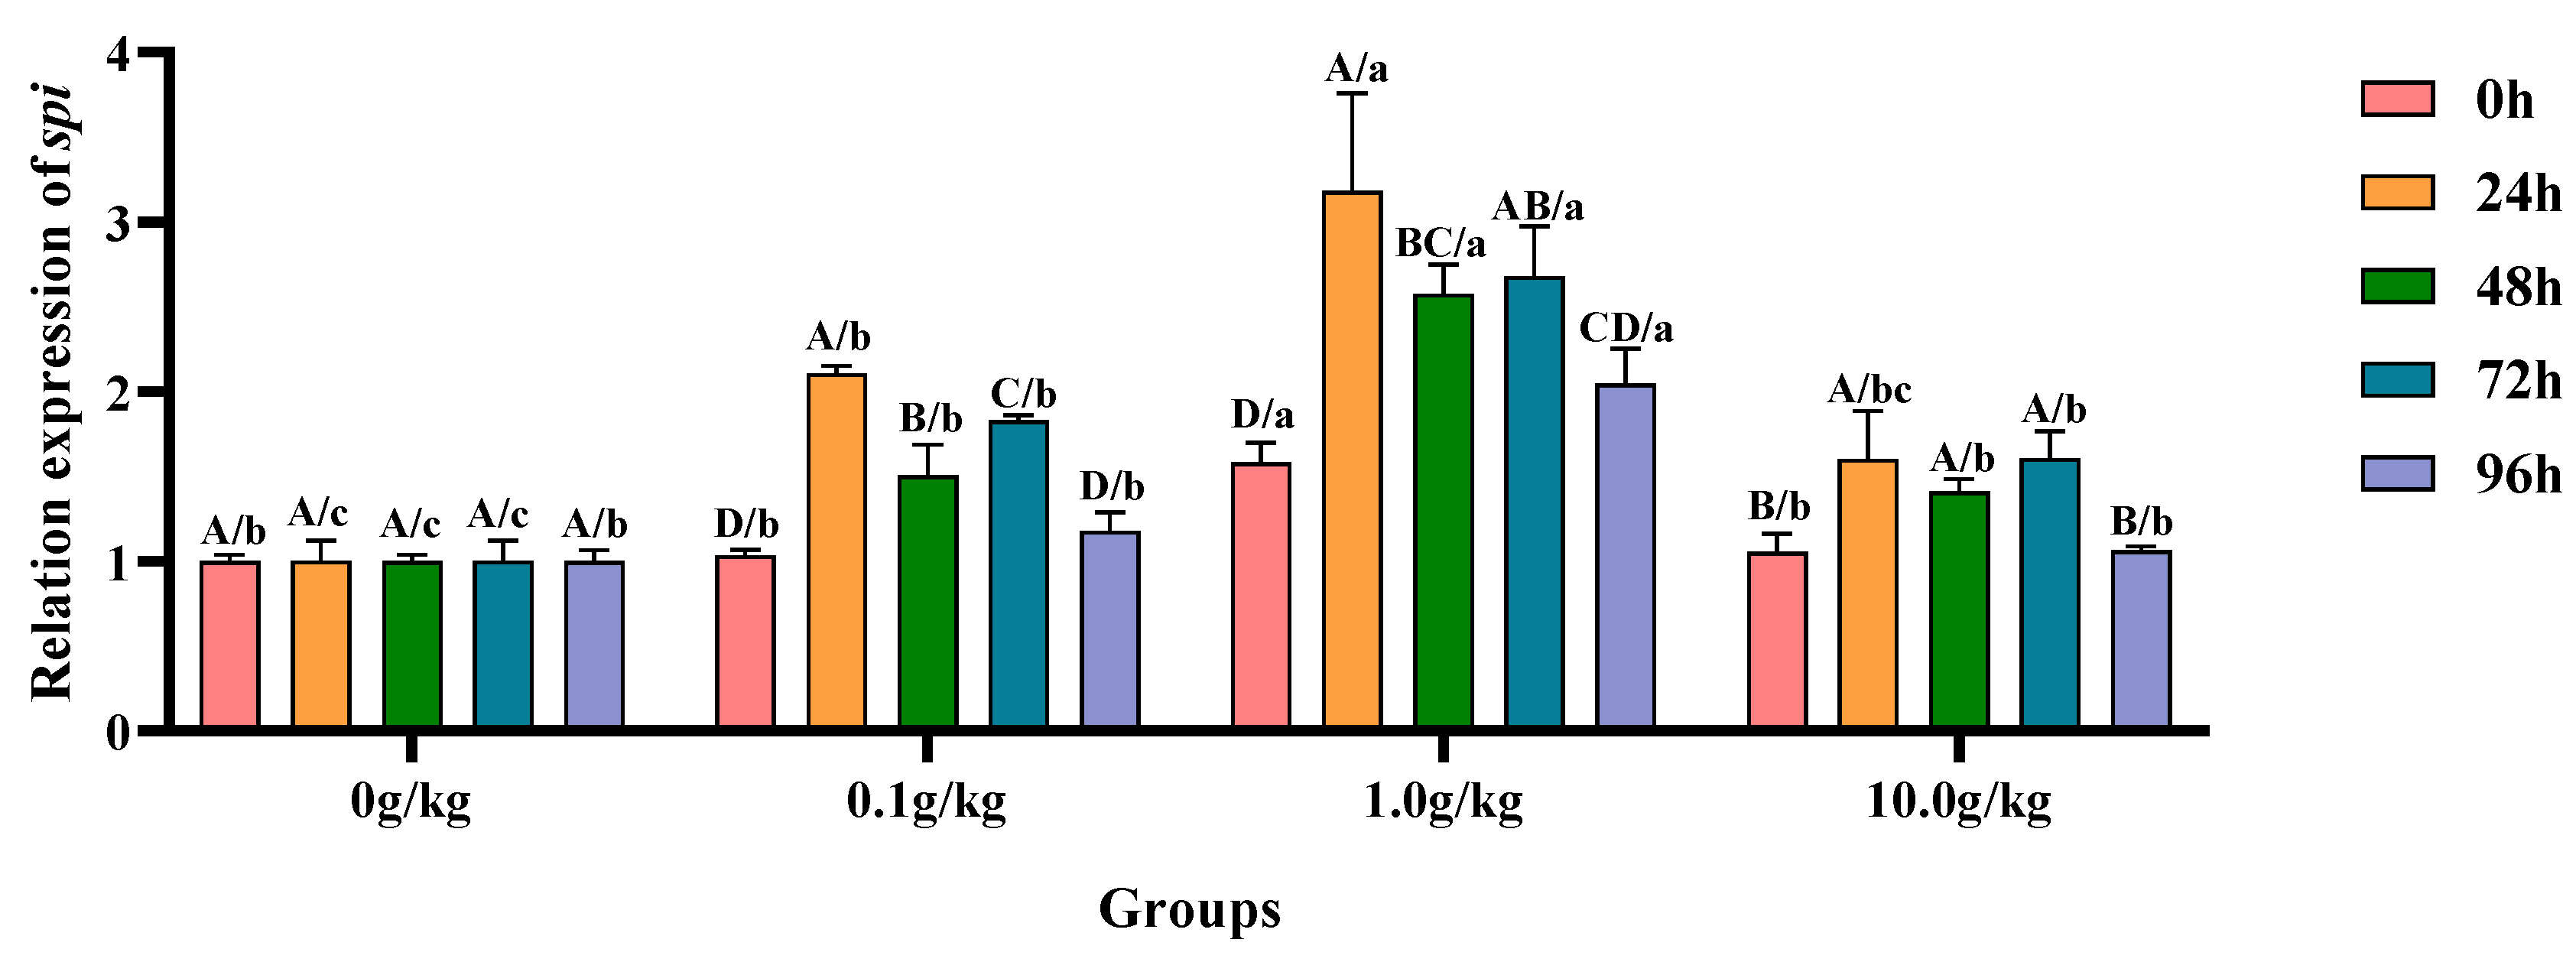
Relative to the baseline levels at 0 h,
A. veronii challenge induced statistically significant upregulation (
p < 0.05) of hepatopancreatic
spi gene expression across all supplemented groups (0.1, 1.0, and 10.0 g/kg
R. mucilaginosa), with the 0.1 g/kg cohort exhibiting increases of 50.2%, 38.6%, and 40.9% and the 1.0 g/kg group demonstrating 50.9%, 31.2%, and 43.5% elevations; while the 10.0 g/kg group showed more moderate upregulations of 34.2%, 25.2%, and 34.3% at 24 h, 48 h, and 72 h, respectively. When compared with untreated controls, the 1.0 g/kg supplementation group displayed particularly pronounced transcriptional activation (
p < 0.05) of the
spi gene following
A. veronii infection, with expression levels augmented by 36.8% and 51.1% at the initial (0 h) and terminal (96 h) observation periods, respectively. The 24 h post-infection interval revealed striking upregulation (
p < 0.05) in both the 0.1 g/kg (52.4% increase) and 1.0 g/kg (68.4% increase) treatment groups, indicating particularly robust early-phase genetic responses in these cohorts. Subsequent examinations at 48 h and 72 h documented sustained transcriptional enhancement (
p < 0.05) across all experimental groups, with 48 h measurements showing 33.6%, 61.2%, and 29.1% increases for 0.1, 1.0, and 10.0 g/kg doses, respectively, while 72 h analyses revealed further upregulation of 45.2%, 62.5%, and 37.5% in corresponding treatment groups, as visually summarized in
Figure 11.
The homogeneity of variance test (Brown–Forsythe test) indicated that the assumption of homogeneity of variance across the groups was satisfied (F = 0.645,
p = 0.825), fulfilling a key prerequisite for analysis of variance. Two-factor ANOVA revealed that both the
R. mucilaginosa concentrations (F = 63.661,
p < 0.001, η
2 = 0.827) and treatment durations (F = 24.067,
p < 0.001, η
2 = 0.706) had highly significant main effects on the
sod gene expression of red clawed crayfish. The interaction between these two factors was significant (F = 3.380,
p = 0.002, η
2 = 0.504). The model demonstrated strong explanatory power (R
2 = 0.840), indicating that variations in the
sod gene expression were primarily independently influenced by
R. mucilaginosa concentrations and treatment durations, as shown in
Table 25 and
Table 26.
Relative to the baseline measurements at 0 h,
A. veronii infection induced statistically significant upregulation (
p < 0.05) of the hepatopancreatic
sod gene expression in both the 0.1 g/kg (23.6%, 20.0%, and 13.5% increases) and 10.0 g/kg (28.0%, 22.9%, and 21.9% increases) treatment groups at 24 h, 48 h, and 72 h post-infection, respectively, demonstrating dose-dependent transcriptional activation patterns. The 1.0 g/kg supplementation group exhibited prolonged upregulation (
p < 0.05) of the
sod expression, with elevations of 31.1% at 24 h, 23.6% at 48 h, 18.3% at 72 h, and 12.1% at 96 h, indicating sustained oxidative stress response throughout the experimental period. When benchmarked against untreated controls, all
R.-mucilaginosa-supplemented groups showed significant enhancement (
p < 0.05) in
sod expression following
A. veronii challenge, as follows: at 24 h (22.2%, 41.0%, and 23.5% for 0.1, 1.0, and 10.0 g/kg, respectively), 48 h (18.6%, 34.4%, and 18.1%), and 72 h (12.7%, 30.4%, and 17.7%), with the 1.0 g/kg dose consistently eliciting the most pronounced transcriptional response across these timepoints. A late-stage upregulation (
p < 0.05) of 24.9% was uniquely observed in the 1.0 g/kg group at 96 h, suggesting prolonged antioxidant system activation at this optimal probiotic concentration, as visually documented in
Figure 12.
The homogeneity of variance test (Brown–Forsythe test) indicated that the assumption of homogeneity of variance across the groups was satisfied (F = 0.692,
p = 0.781), fulfilling a key prerequisite for the analysis of variance. Two-factor ANOVA revealed that
R. mucilaginosa concentrations (F = 76.809,
p < 0.001, η
2 = 0.852), treatment durations (F = 82.211,
p < 0.001, η
2 = 0.892), and
R. mucilaginosa concentrations × treatment durations (F = 12.943,
p < 0.001, η
2 = 0.795) had highly significant main effects on the
chh gene expression of red clawed crayfish. The model demonstrated strong explanatory power (R
2 = 0.922), indicating that variations in the
chh gene expression were primarily independently influenced by
R. mucilaginosa concentrations and treatment durations, as shown in
Table 27 and
Table 28.
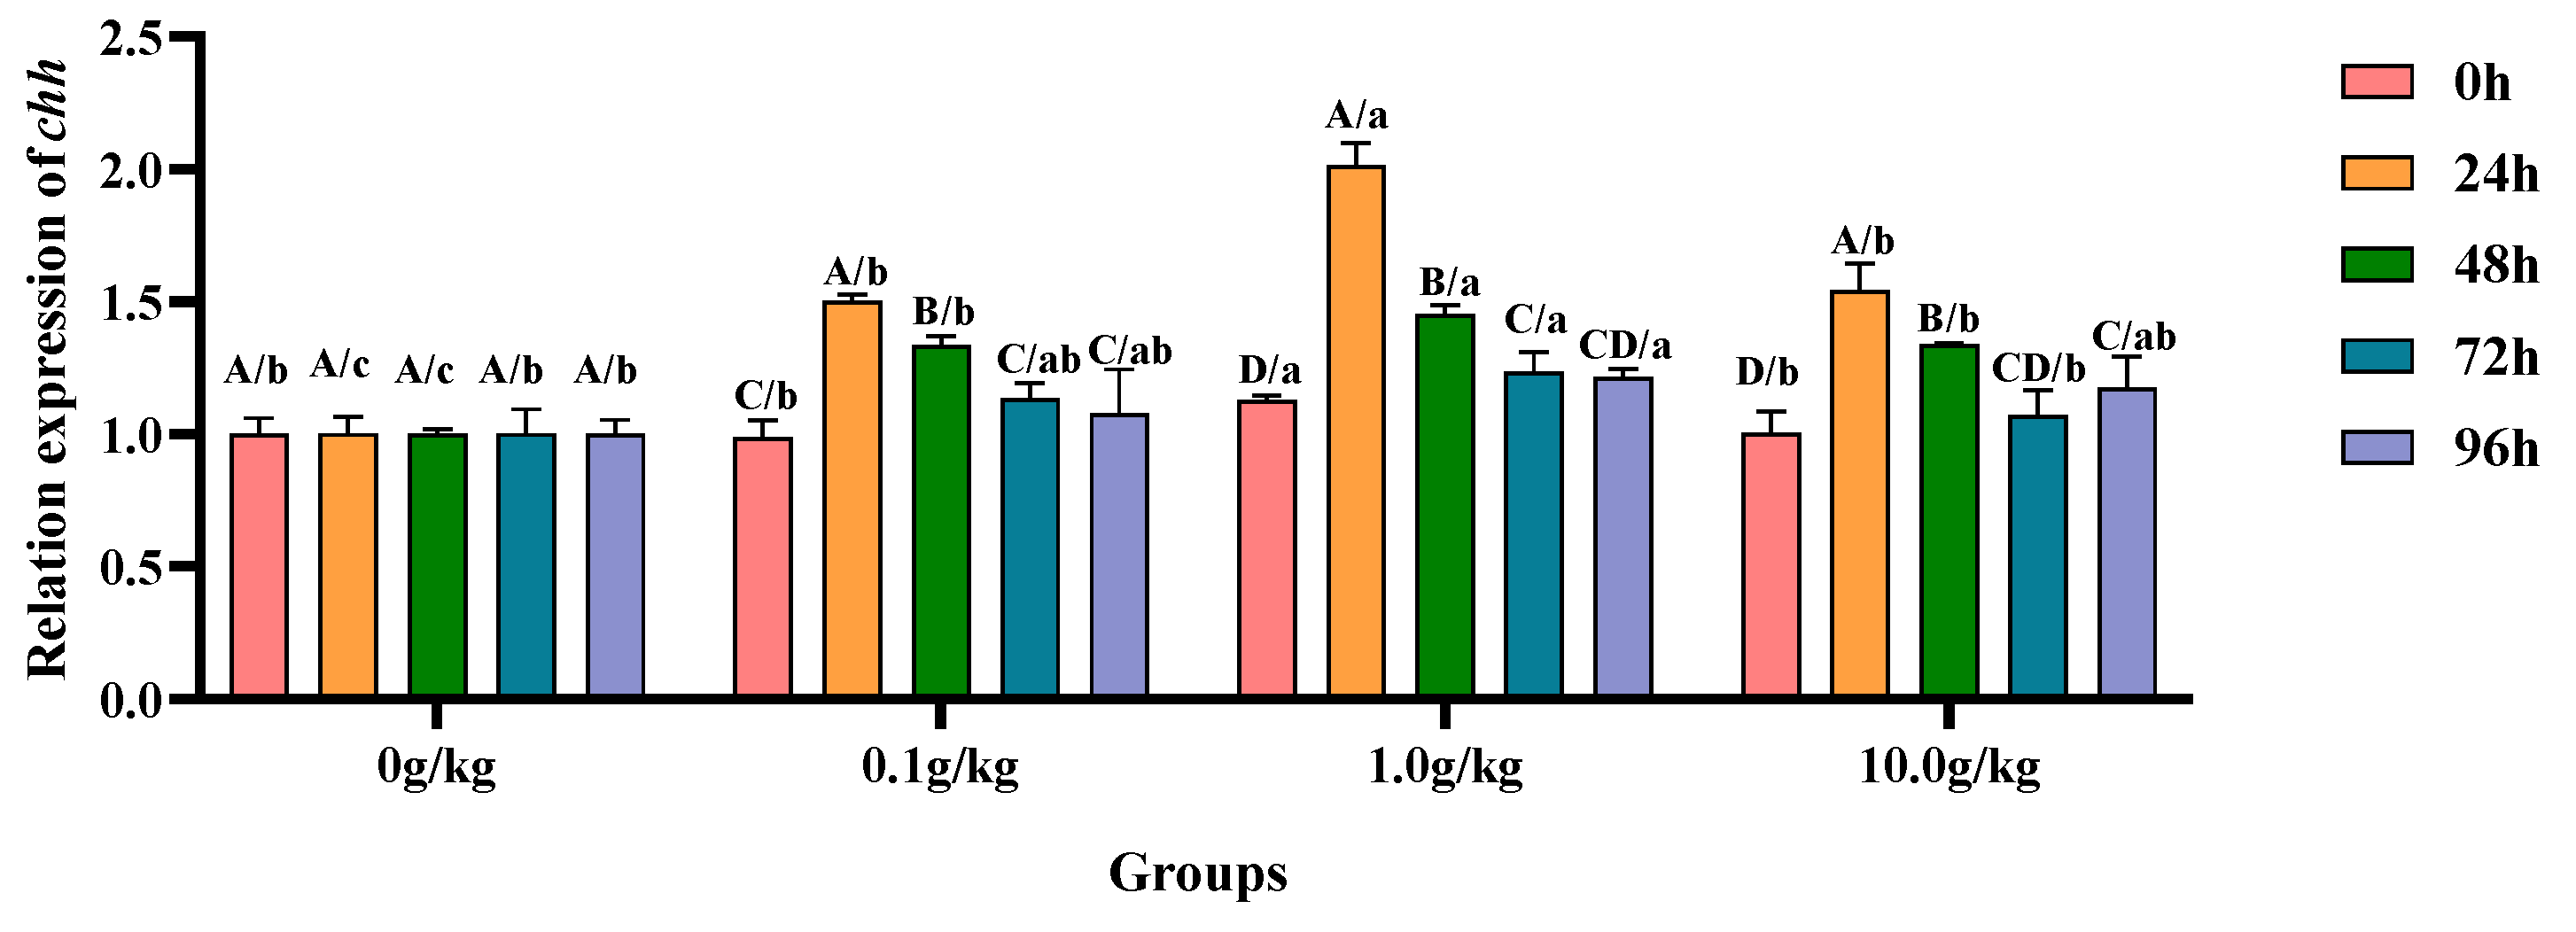
Relative to the baseline levels at 0 h,
A. veronii infection induced statistically significant upregulation (
p < 0.05) of the hepatopancreatic
chh gene expression in the 0.1 g/kg group, with increases of 34.2% at 24 h and 26.0% at 48 h post-infection, demonstrating early-phase endocrine response modulation. The 1.0 g/kg supplementation cohort exhibited pronounced
chh transcriptional activation (
p < 0.05), showing 44.0% elevation at 24 h followed by progressive decreases to 22.5% at 48 h and 8.7% at 72 h, indicating dose-dependent temporal expression patterns. The high-dose (10.0 g/kg) group displayed sustained
chh upregulation (
p < 0.05) with 34.9%, 24.9%, and 14.5% increases at 24 h, 72 h, and 96 h, respectively, revealing prolonged endocrine system stimulation at elevated probiotic concentrations. When compared with the untreated controls, the 1.0 g/kg group demonstrated significant
chh enhancement (
p < 0.05) at baseline (0 h, 11.2%) and later stages (72 h, 18.9%; 96 h, 17.6%), suggesting this intermediate dosage optimally primes and maintains crustacean hyperglycemic hormone production. Comparative analysis revealed consistent
chh upregulation (
p < 0.05) across all supplemented groups during peak response periods, as follows: at 24 h (33.3%, 50.3%, and 35.1% for 0.1, 1.0, and 10.0 g/kg, respectively) and 48 h (25.1%, 31.2%, and 25.2%), with the 1.0 g/kg dose eliciting the maximal transcriptional response, as visually documented in
Figure 13.
The homogeneity of variance test (Brown–Forsythe test) indicated that the assumption of homogeneity of variance across the groups was satisfied (F = 0.664,
p = 0.806), fulfilling a key prerequisite for the analysis of variance. Two-factor ANOVA revealed that the
R. mucilaginosa concentrations (F = 148.873,
p < 0.001, η
2 = 0.918), treatment durations (F = 137.888,
p < 0.001, η
2 = 0.932), and
R. mucilaginosa concentrations × treatment durations (F = 24.759,
p < 0.001, η
2 = 0.881) had highly significant main effects on the
alf gene expression of red clawed crayfish. The model demonstrated strong explanatory power (R
2 = 0.956), indicating that variations in the
alf gene expression were primarily independently influenced by
R. mucilaginosa concentrations and treatment durations, as shown in
Table 29 and
Table 30.
Relative to the baseline levels at 0 h,
A. veronii infection induced significant upregulation (
p < 0.05) of the hepatopancreatic
alf gene expression in the 0.1 g/kg group, showing progressive increases of 36.6% at 24 h, 22.9% at 48 h, and 15.3% at 72 h post-infection. Both the 1.0 g/kg and 10.0 g/kg groups exhibited marked
alf upregulation (
p < 0.05) during early infection stages, with the 1.0 g/kg group demonstrating 49.5% and 20.3% increases at 24 h and 48 h, respectively, while the 10.0 g/kg group showed 37.2% and 19.9% elevations at the corresponding timepoints. When compared with the untreated controls, the 1.0 g/kg group displayed significant baseline enhancement (
p < 0.05) of the
alf expression (17.9% increase at 0 h), suggesting pre-infection priming effects at this optimal dosage. During the peak response periods (24 h and 48 h), all supplemented groups showed significant
alf activation (
p < 0.05), as follows: at 24 h (40.1%, 58.6%, and 37.9% for 0.1, 1.0, and 10.0 g/kg, respectively) and 48 h (27.1%, 34.5%, and 20.6%), with the 1.0 g/kg dose consistently eliciting maximal response. Late-phase analyses revealed sustained
alf upregulation (
p < 0.05) in the 0.1 g/kg (19.9% at 72 h; 9.0% at 96 h) and 1.0 g/kg (23.1% at 72 h; 22.0% at 96 h) groups, demonstrating prolonged genetic activation particularly at the intermediate dosage, as illustrated in
Figure 14.


 ,
, 


