
Carbohydrate Metabolism in the Intercaruncular Endometrium Is Affected by Form of Supplemental Selenium at Maternal Recognition of Pregnancy in Beef Heifers


Simple Summary
Abstract
1. Introduction
2. Materials and Methods
2.1. Animals and Experimental Procedure
2.2. Experimental Regimen and Tissue Collection
2.3. Serum Analyses
2.4. RNA Extraction
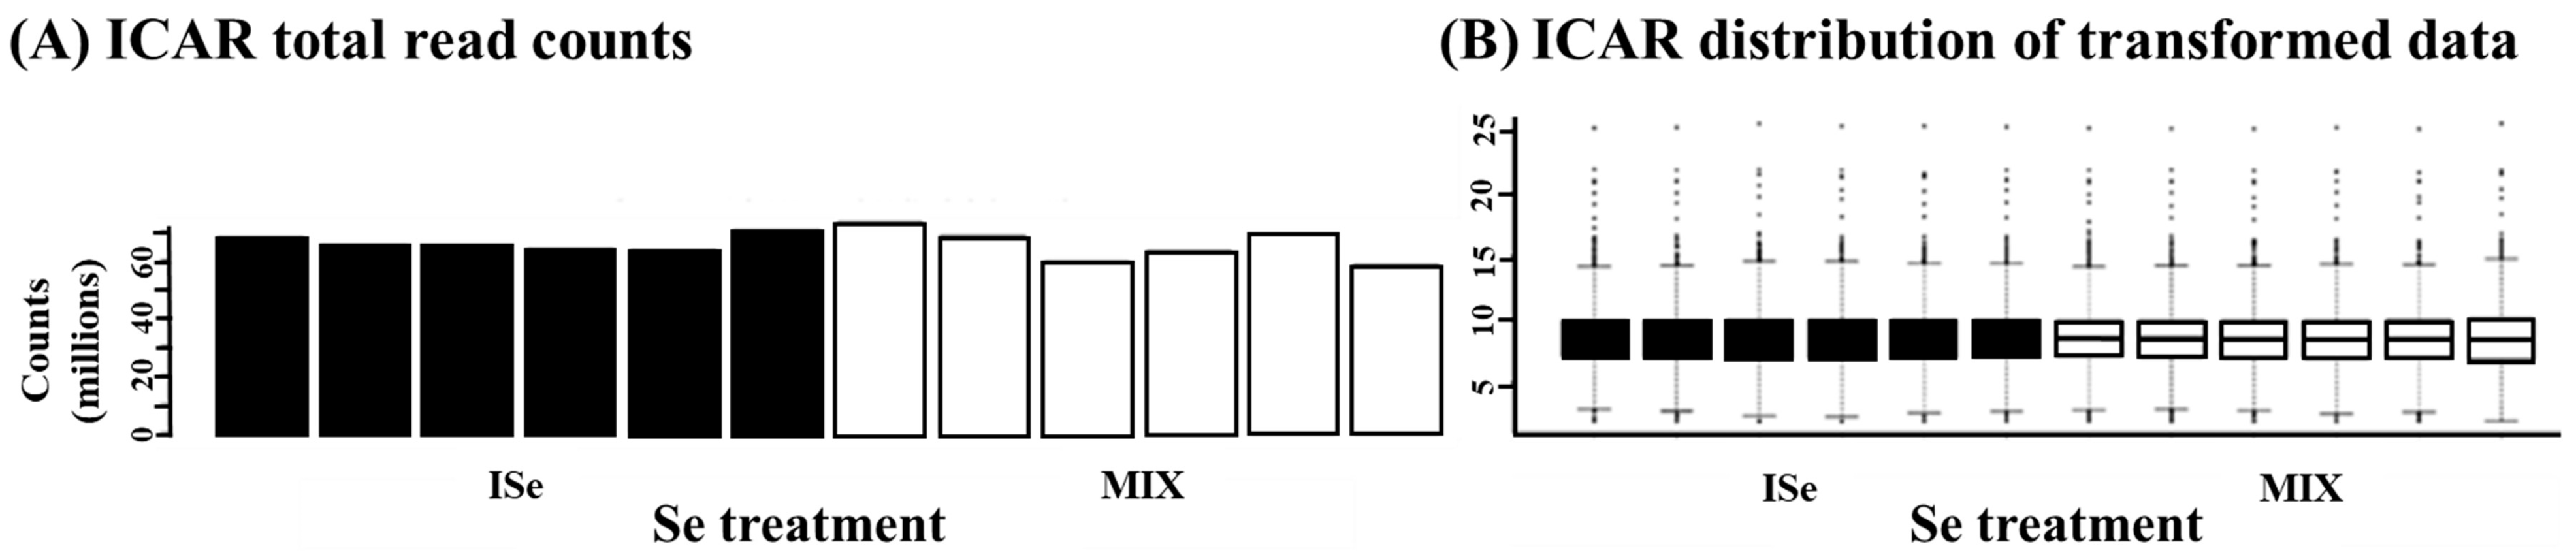
2.5. RNA Sequencing
Functional Analysis
2.6. Real-Time PCR Analysis
2.7. Statistical Analysis
3. Results
3.1. qPCR of Selenoproteins and Selenoprotein P Receptors in ICAR
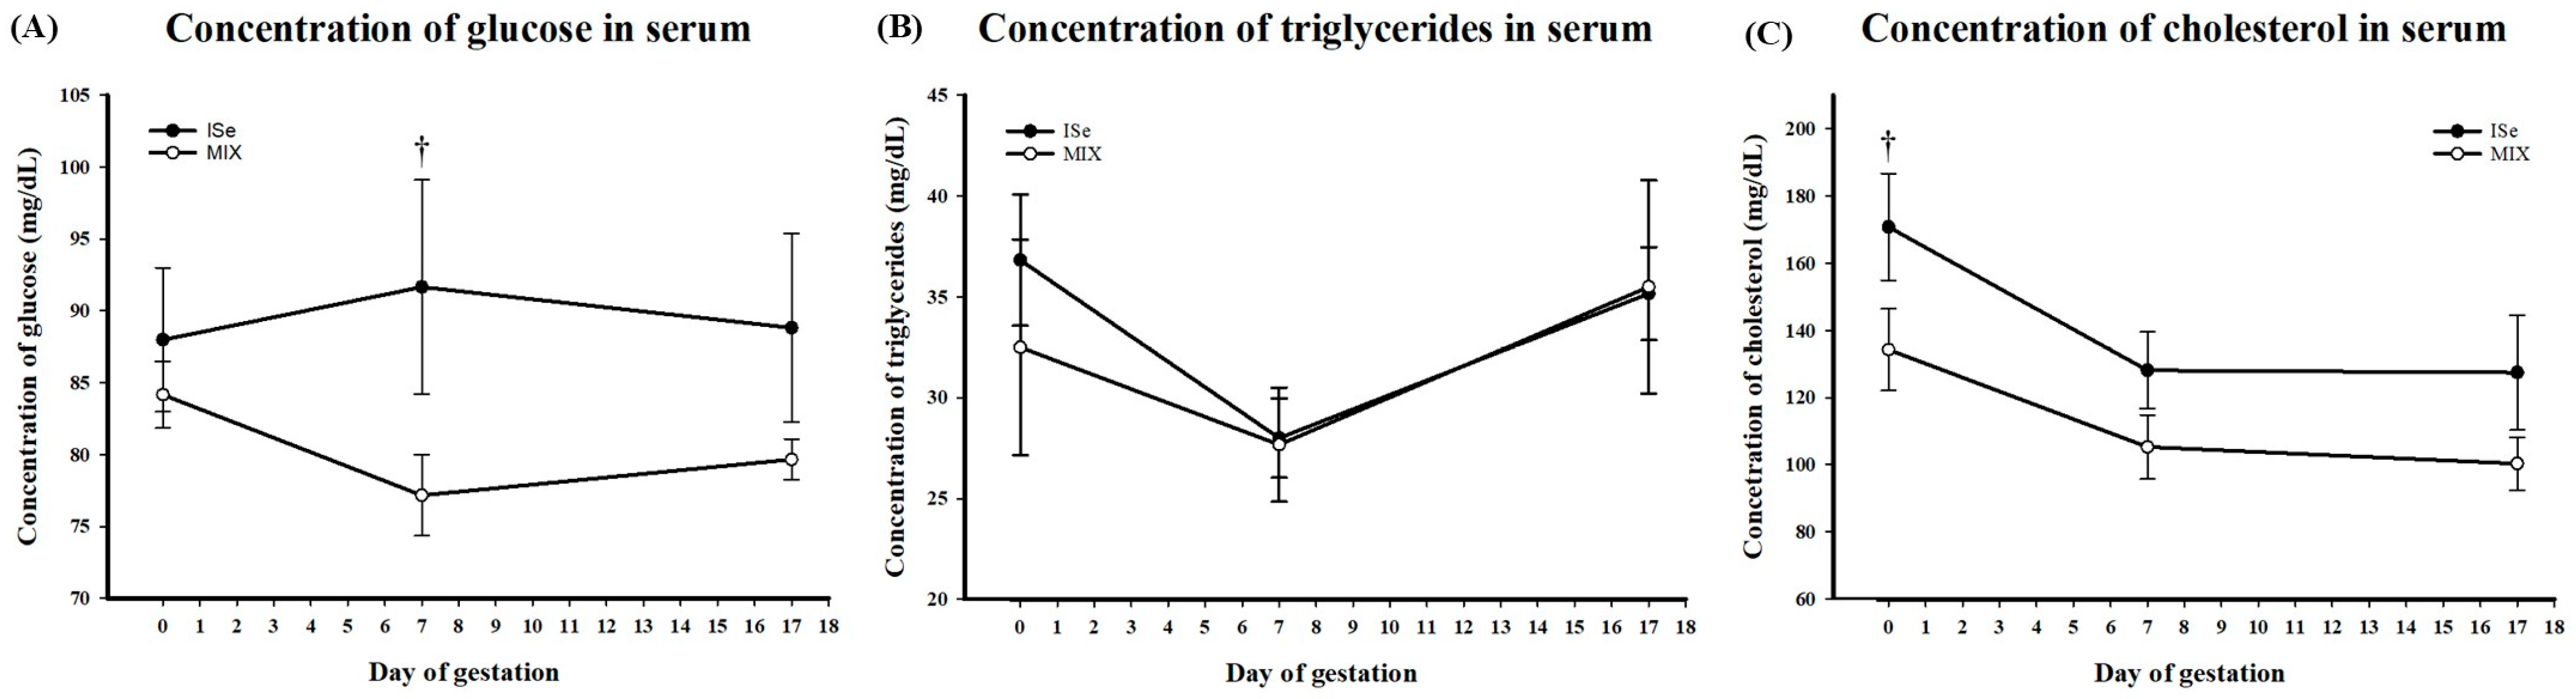
3.2. Serum Glucose, Triglycerides, and Cholesterol
3.3. RNA-Sequencing in ICAR
3.3.1. Cluster Analyses
3.3.2. Differentially Expressed Genes
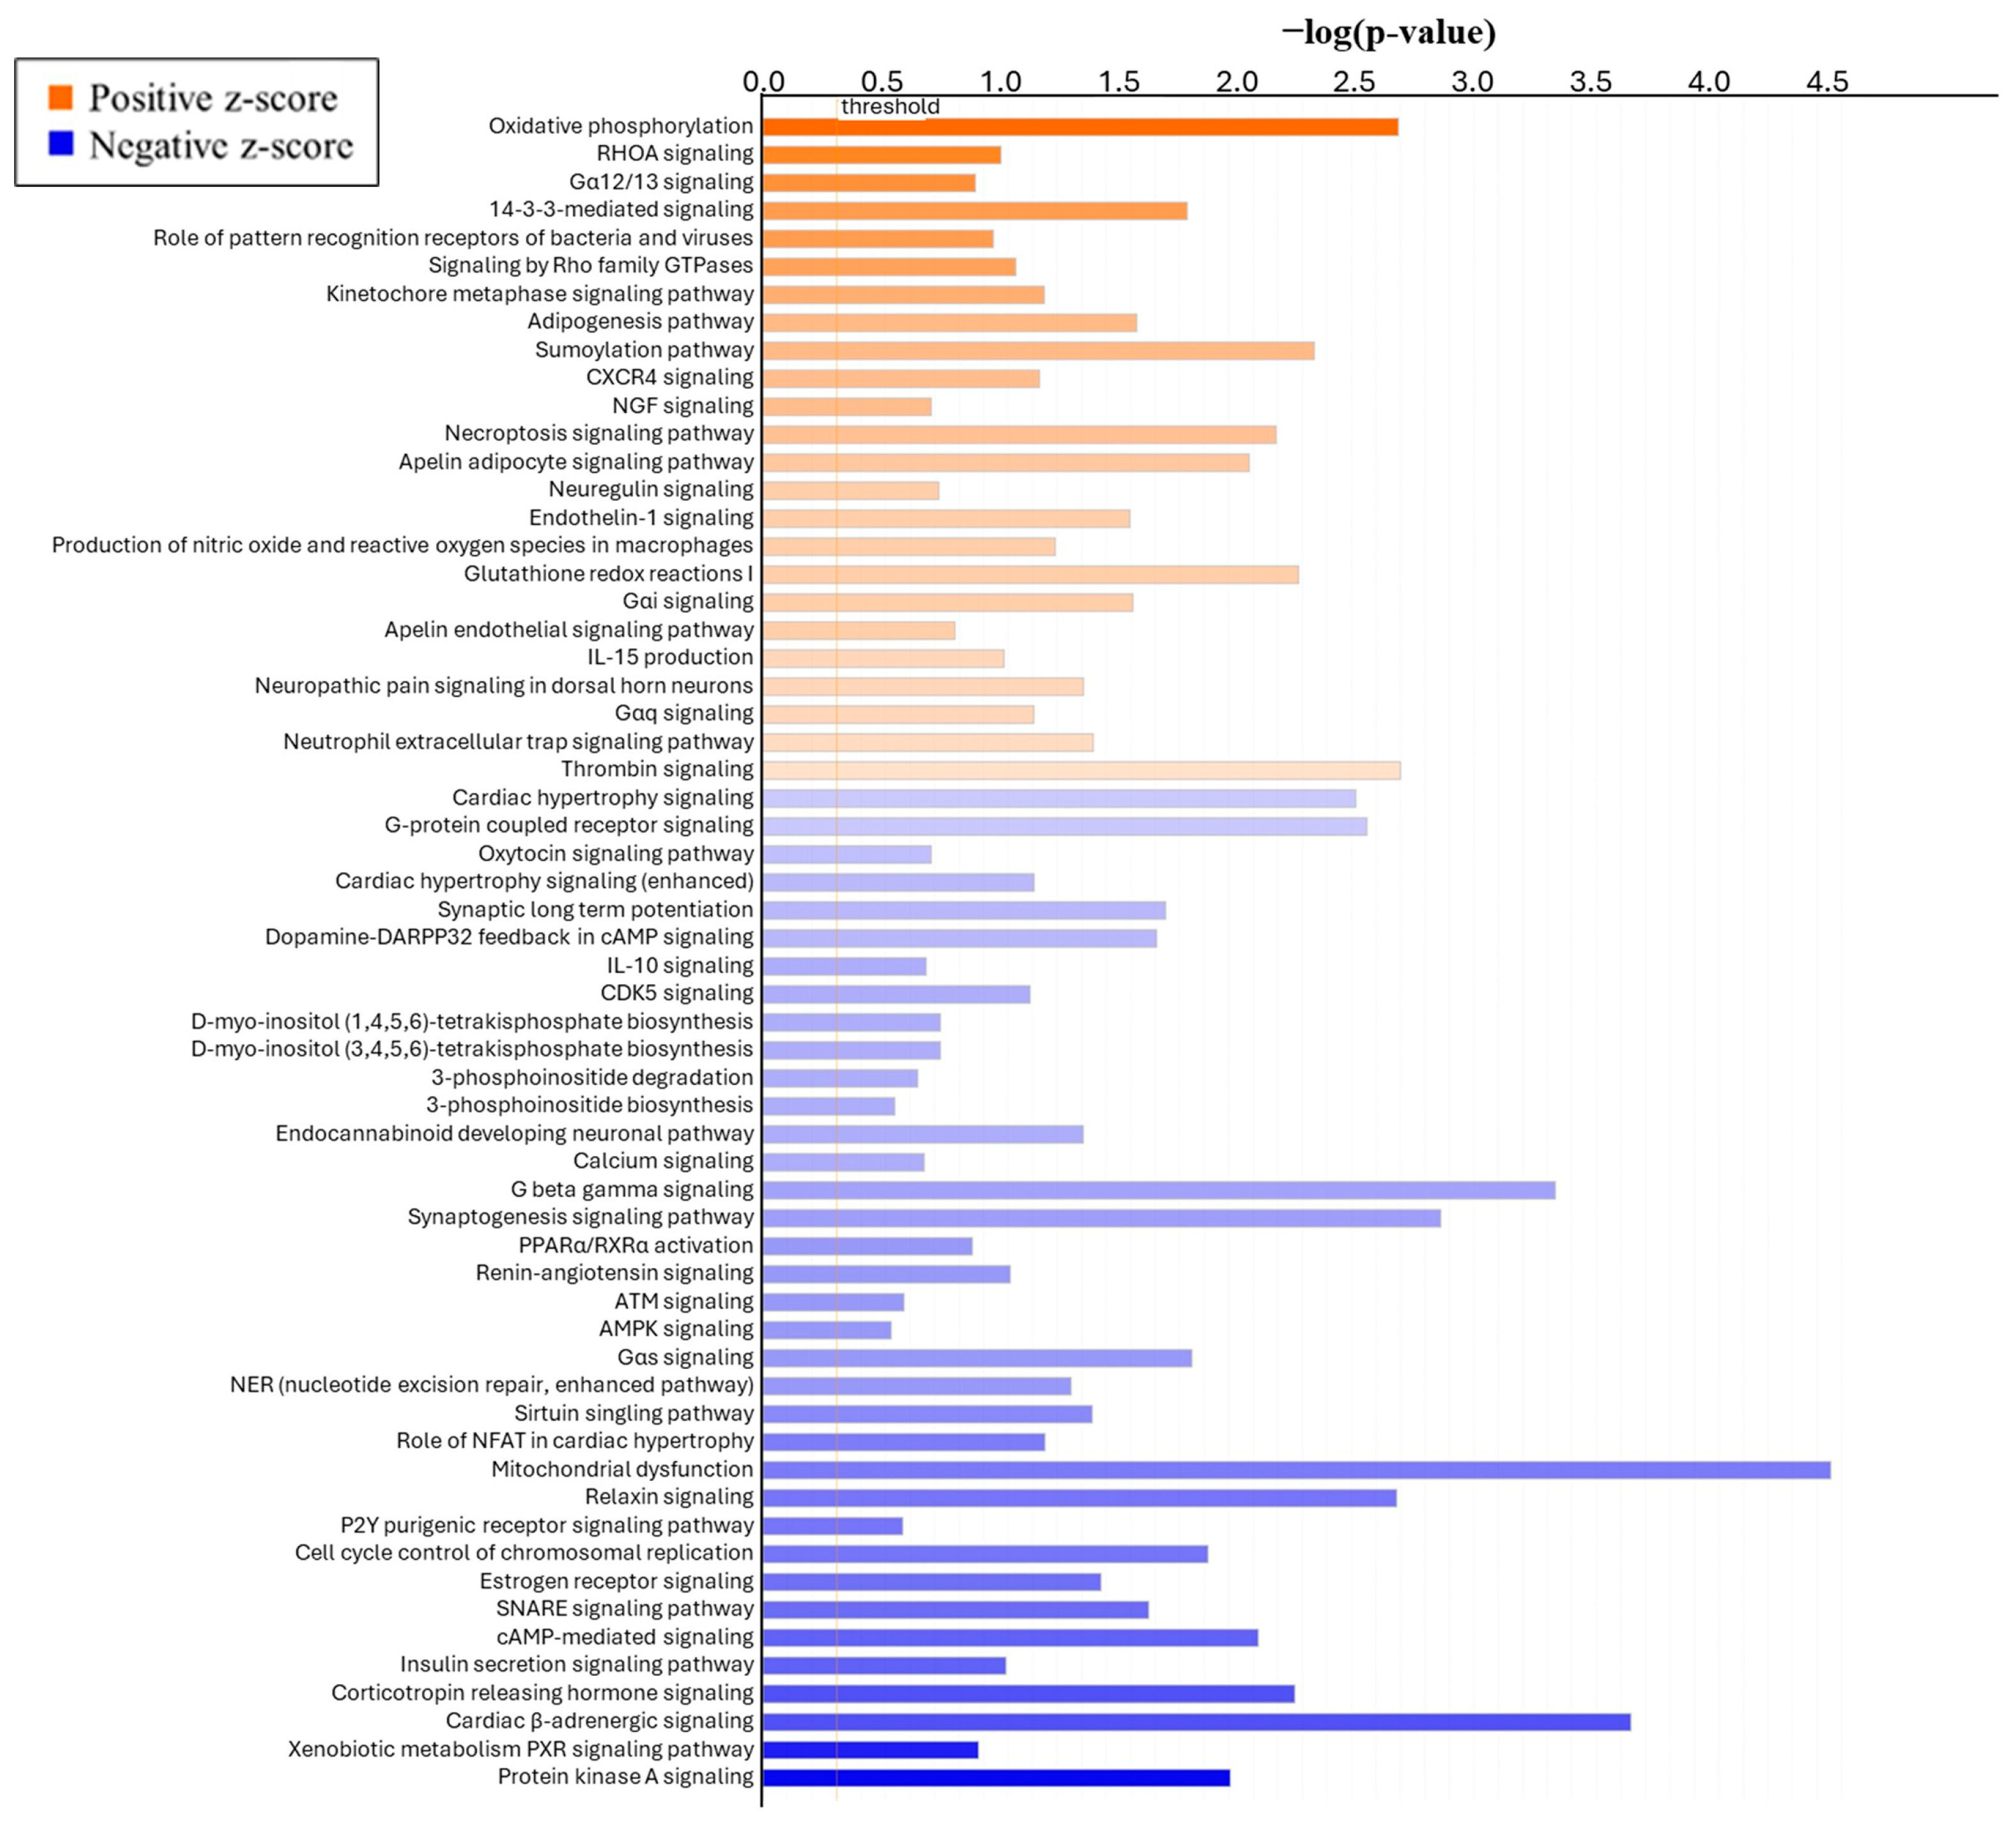
3.3.3. Pathway and Gene Network Analysis
3.3.4. RNA Sequencing Corroboration Using qPCR Analysis
4. Discussion
4.1. Selenoproteins and Selenoprotein P Receptors in ICAR
4.2. Serum Glucose, Triglycerides, and Cholesterol
4.3. Global Transcriptomics in ICAR Endometrium
5. Conclusions
Author Contributions
Funding
Institutional Review Board Statement
Informed Consent Statement
Data Availability Statement
Acknowledgments
Conflicts of Interest
Appendix A

| Gene | Gene Name | Accession Number 1 | Oligonucleotide Primer Design (5′ to 3′) Direction | Amplicon Length (bp) | Product Identity (%) 2 |
|---|---|---|---|---|---|
| Reference transcripts | |||||
| Actb | Actin beta | NM_173979.3 | F: GAGCGGGAAATCGTCCGTGAC R: GTGTTGGCGTAGAGGTCCTTGC | 278 | 99 |
| Gapdh | Glyceraldehyde-3-phosphate dehydrogenase | NM_001034034.2 | F: ACATCAAGTGGGGTGATGCT R: GGCATTGCTGACAATCTTGA | 289 | 99 |
| Hprt1 | Hypoxanthine phosphoribosyltransferase 1 | NM_001034035.2 | F: GCCAGCCGGCTACGTTAT R: ATCCAACAGGTCGGCAAAGA | 256 | 100 |
| Gene | Gene Name | Accession Number 1 | Oligonucleotide Primer Design (5′ to 3′) Direction | Amplicon Length (bp) | Product Identity (%) 2 |
|---|---|---|---|---|---|
| Enzymatic transcripts | |||||
| Dio1 | Iodothyronine deiodinase 1 | NM_001122593.2 | F: TCCTGTAGTCCGCCTGTCA R: TCCGGTGATTCTTGATGTCCA | 242 | 99 |
| Dio2 | Iodothyronine deiodinase 2 | NM_001010992.4 | F: GATGGGCATCCTCAGCGTAG R: TTCTCCTGGGCACCATTTCC | 315 | 100 |
| Dio3 | Iodothyronine deiodinase 3 | NM_001010993.3 | F: AAGTGGAGCTCAACAGCGAT R: AGTCGAGGATGTGCTGGTTC | 213 | 100 |
| Glutathione peroxidases | |||||
| Gpx1 | Glutathione peroxidase 1 | NM_174076.3 | F: GCAACCAGTTTGGGCATCAG R: TAGGGTCGGTCATGAGAGCA | 210 | 100 |
| Gpx2 | Glutathione peroxidase 2 | NM_001163139.2 | F: AACAGCCTCAAGTACGTCCG R: TCGGTCATGAGGGAAAACGG | 158 | 100 |
| Gpx3 | Glutathione peroxidase 3 | NM_174077.5 | F: GCACCATCTATGAGTACGGGG R: CCCCATTCACATCGCCTTTC | 315 | 100 |
| Gpx4 | Glutathione peroxidase 4 | NM_174770.3 | F: GATCAAAGAGTTCGCCGCTG R: CCATACCGCTTCACCACACA | 198 | 100 |
| Gpx6 | Glutathione peroxidase 6 | NM_001163142.1 | F: CACTGTTCCTGGTCGGCTTA R: CCCAGCACAACTACACCGAA | 259 | 100 |
| Thioredoxin reductases | |||||
| Txnrd1 | Thioredoxin reductase 1 | NM_174625.5 | F: AAGGCCGCGTTATTTGGGTA R: CCTGGTGTCCCTGCTTCAAT | 306 | 100 |
| Txnrd2 | Thioredoxin reductase 2 | NM_174626.2 | F: CAAATGGCTTCGCTGGTCAC R: TTCGTATGCACACCAGCCTT | 230 | 100 |
| Txnrd3 | Thioredoxin reductase 3 | XM_015468824.1 | F: CGGCGTATGACTACGACCTC R: GACTGTACTCCCAGCCGAAC | 249 | 100 |
| Other selenoproteins | |||||
| Selenof | Selenoprotein F | NM_001034759.2 | F: GCAGCTCCTGTGATTTGCTT R: TTTAGCACAGGGTCTGAACCG | 241 | 100 |
| Selenoh | Selenoprotein H | NM_001321327.1 | F: CACGAGCTGACGAGTCTACG R: CTTCTTCAGCTCCTCCAGCA | 235 | 100 |
| Selenoi | Selenoprotein I | NM_001075257.2 | F: TCTGGCTTTCTGCTGGTTGT R: TGGTCAAAAAGCTCCCCCAG | 212 | 100 |
| Selenok | Selenoprotein K | NM_001037489.3 | F: CCGTTTTGTCGATTCACGGC R: CAGATGAGCTTCCGTAGCCT | 278 | 100 |
| Selenom | Selenoprotein M | NM_001163171.2 | F: CCCACTCTACCACAACCTGG R: ACCTAAAGGTCTGCGTGGTC | 249 | 100 |
| Selenon | Selenoprotein N | NM_001114976.2 | F: GTGGCCATGTACCCCTTCAA R: GGGATGGGTTCTCCTGGTTG | 265 | 100 |
| Selenoo | Selenoprotein O | NM_001163193.2 | F: TGGACAGGTATGACCCCGAT R: ATCTTCTGCAGGTAGTGCCG | 202 | 100 |
| Selenop | Selenoprotein P | NM_174459.3 | F: TCAGGTCTTCATCACCACCA R: GTGGCAACAGCAGCTACTCA | 201 | 100 |
| Selenor | Selenoprotein R, Methionine sulfoxide reductase B1 (MSRB1) | NM_001034810.2 | F: GAACCACTTTGAGCCGGGTA R: GGCCATCGTTCAGGAACTCA | 221 | 100 |
| Selenos | Selenoprotein S | NM_001046114.3 | F: CCCACCCTCGAGACCGA R: GCCCAGGACTGTCTTCTTCC | 394 | 100 |
| Selenot | Selenoprotein T | NM_001103103.2 | F: TGGTCACCTTCCATCCATGC R: AAGAGGTACAACGAGCCTGC | 240 | 100 |
| Selenov | Selenoprotein V | NM_001163244.2 | F: ACTCCATTGGCCACCGATTT R: AGGCCACAGTAAACCACTCG | 224 | 100 |
| Selenow | Selenoprotein W | NM_001163225.1 | F: AGTGTTCGTAGCGGGAAAGC R: CGCGAGAACATCAGGGAAGG | 233 | 98 |
| Selenophosphate synthetase | |||||
| Sephs2 | Selenophosphate synthetase 2 | NM_001114732.2 | F: GATCCCTACATGATGGGGCG R: GTTTACCACCGTTTGCCCAC | 219 | 100 |
| Selenoprotein P receptors | |||||
| Lrp2 | LDL receptor related protein 2 | XM_024983502.1 | F: GTGGTTTGGGTTACCGTTGC R: GGCACCCTGTTAGCTGTGAT | 304 | 99 |
| Lrp8 | LDL receptor related protein 8 | NM_001097565.1 | F: AGCCACCCTTTTGGGATAGC R: AAGGCACAGGTACTCACAGC | 231 | 100 |
| Tfrc | Transferrin receptor | NM_001206577.1 | F: CCAGGTTTAGTCTGGCTCGG R: GGTCTGCCCAGAATATGCGA | 339 | 99 |
| Gene | Gene Name | Accession Number 1 | Oligonucleotide Primer Design (5′ to 3′) Direction | Amplicon Length (bp) | Product Identity (%) 2 |
|---|---|---|---|---|---|
| Carbohydrate Metabolism | |||||
| Adcy2 | PREDICTED: Adenylate cyclase 2 | XM_024981538.1 | F: ATCAGCACCACGGATGTACC R: GAAGATCAGGCAAGCGCAAG | 267 | 99 |
| Aldob | Aldolase, fructose-bisphosphate B | NM_001034485.2 | F: CAGTTCCGCGAACTCCTCTT R: AGCGTTCAGAAAGGCCATCA | 232 | 100 |
| Apoe | Apolipoprotein E | NM_173991.2 | F: ACGCTGACGACCTGAAGAAG R: CCTCTAGCTGCTGGCGTATC | 261 | 100 |
| Bmp4 | Bone morphogenetic protein 4 | NM_001045877.1 | F: ACTTCGAGGCCACACTTCTG R: AGAGTTTTCGCTGGTCCCTG | 245 | 100 |
| Edn1 | Endothelin 1 | NM_181010.2 | F: CTTCTAGGTCCAAGCGCTCC R: CTGATGGCCTCCAACCTTCTT | 259 | 99 |
| Gaa | Alpha glucosidase | NM_173913.2 | F: CATGACTTGGAGGTGGTCCC R: GTGGTGGTCAGGTTCTCCAG | 308 | 100 |
| Gnaq | Guanine nucleotide binding protein (G protein), q polypeptide | NM_001110002.1 | F: CGAGCACAATAAGGCTCATGC R: TTGTTGCGTAGGCAGGTAGG | 223 | 100 |
| Manba | Mannosidase beta | NM_174387.2 | F: CAGTCGCAGCGAGATAGTGA R: TCTGAGTGAAGGTGTGACGC | 22 | 99 |
| Mstn * | Myostatin | NM_001001525.3 | F: TGCCCACGGAGTCTGATCTT R: TGCCTGGGTTCATGTCAAGT | 237 | 100 |
| Neu3 | Neuraminidase 3 | NM_174122.3 | F: ATGGAGGAGCCGGGGTT R: CAGGGTTCCTGCCTGACATA | 400 | 100 |
| Pygl | Glycogen phosphorylase L | NM_001075203.2 | F: GAAGTGCCCCAAGAGGGTTT R: ATGGAATCCAGGAAGCAGGC | 213 | 100 |
| Sgsh | N-sulfoglucosamine sulfohydrolase | NM_001102189.2 | F: ACAACAGCGCCATCTCTACC R: AGGAATTTCCGGACCAGCAG | 367 | 99 |
| Slc1a4 | Solute carrier family 1 member 4 | NM_001081577.1 | F: AGTGACCTACAACACGAGCG R: ACATGATGCCCACAGGTACG | 233 | 100 |
| Spp1 | Secreted phosphoprotein 1 | NM_174187.2 | F: GCCTGACCCATCTCAGAAGC R: TCTGAACGTTAGATCGGCGG | 386 | 99 |
| Canonical Wnt Signaling | |||||
| Cpt1a | Carnitine palmitoyltransferase 1A | NM_001304989.2 | F: GGGTCTACGATTCCGCTCTG R: GGCATCCAGAGACTGCTTGT | 339 | 100 |
| Ctnnb1 | Catenin beta 1 | NM_001076141.1 | F: CAGCAGTTTGTGGAGGGAGT R: GAACTGGTCAGCTCAACCGA | 371 | 100 |
| Dkk1 * | Dickkopf WNT signaling pathway inhibitor 1 | NM_001205544.1 | F: GGCAGCAAGTACCAGACCAT R: AGAAGGCATGCATATCCCGTT | 207 | 100 |
| Fzd6 | PREDICTED: Frizzled class receptor 6, transcript variant X1 | XM_010812158.3 | F: TGCACAGAATGGGCTGGATT R: GTACCATGATTTGCCGTCGC | 212 | 100 |
| Lrp5 | PREDICTED: LDL receptor related protein 5, transcript variant X1 | XM_024987583.1 | F: CTGGAGGAGTTCTCAGCCCAC R: TTCAGAGAGGCGTCGCAGTC | 386 | 100 |
| Lrp6 | PREDICTED: LDL receptor related protein 6, transcript variant X1 | XM_005207028.4 | F: GTGCCCTGGAACATGTGGTA R: TTCACGGTTGAGTCCAAGCA | 398 | 100 |
Appendix B
| ID | Gene | Expr Log Ratio |
|---|---|---|
| ENSBTAG00000019988 | GNA15 | 1.284 |
| ENSBTAG00000002982 | PITPNM3 | 1.041 |
| ENSBTAG00000011808 | MSTN | 0.988 |
| ENSBTAG00000004855 | PRDX6 | 0.975 |
| ENSBTAG00000018223 | CHI3L1 | 0.935 |
| ENSBTAG00000010123 | APOE | 0.784 |
| ENSBTAG00000019079 | PLCB2 | 0.656 |
| ENSBTAG00000016021 | GAA | 0.650 |
| ENSBTAG00000004150 | NRG1 | 0.612 |
| ENSBTAG00000038062 | FUT4 | 0.598 |
| ENSBTAG00000015267 | SGSH | 0.563 |
| ENSBTAG00000018119 | AOAH | 0.527 |
| ENSBTAG00000008096 | EDN1 | 0.490 |
| ENSBTAG00000046155 | RGN | 0.433 |
| ENSBTAG00000037527 | OAS1 | 0.386 |
| ENSBTAG00000001420 | ABHD12 | 0.354 |
| ENSBTAG00000000134 | MPDU1 | 0.349 |
| ENSBTAG00000030434 | FUCA1 | 0.328 |
| ENSBTAG00000010336 | TALDO1 | 0.326 |
| ENSBTAG00000021504 | TIRAP | 0.322 |
| ENSBTAG00000014534 | EEF1A1 | 0.303 |
| ENSBTAG00000025931 | NEU3 | 0.294 |
| ENSBTAG00000010136 | CMAS | 0.280 |
| ENSBTAG00000004587 | DUSP6 | 0.273 |
| ENSBTAG00000011056 | IDS | 0.258 |
| ENSBTAG00000005371 | DPAGT1 | 0.257 |
| ENSBTAG00000016845 | GALNT7 | 0.234 |
| ENSBTAG00000009789 | GNAQ | −0.185 |
| ENSBTAG00000011709 | IMPA1 | −0.203 |
| ENSBTAG00000034436 | PDPK1 | −0.204 |
| ENSBTAG00000011494 | PYGL | −0.291 |
| ENSBTAG00000005997 | ABCB1 | −0.296 |
| ENSBTAG00000011761 | LRP6 | −0.348 |
| ENSBTAG00000021999 | CPT1A | −0.423 |
| ENSBTAG00000005359 | TGFB2 | −0.426 |
| ENSBTAG00000050602 | HAS3 | −0.540 |
| ENSBTAG00000001879 | PER2 | −0.556 |
| ENSBTAG00000010206 | UAP1 | −0.579 |
| ENSBTAG00000000507 | NR4A1 | −0.591 |
| ENSBTAG00000002699 | KIT | −0.630 |
| ENSBTAG00000023600 | APOD | −0.631 |
| ENSBTAG00000019026 | EXTL2 | −0.634 |
| ENSBTAG00000014674 | CHRM2 | −0.745 |
| ENSBTAG00000001649 | ZFPM2 | −0.779 |
| ENSBTAG00000019761 | MANBA | −0.841 |
| ENSBTAG00000024957 | SNCA | −0.903 |
| ENSBTAG00000019892 | HAS2 | −0.961 |
| ENSBTAG00000019210 | ADCY2 | −1.030 |
| ENSBTAG00000015358 | ALDOB | −1.077 |
| ENSBTAG00000005260 | SPP1 | −1.311 |
References
- Ammerman, C.B.; Miller, S.M. Selenium in ruminant nutrition: A review. J. Dairy Sci. 1975, 58, 1561–1577. [Google Scholar] [CrossRef]
- Flohe, L.; Gunzler, W.A.; Schock, H.H. Glutathione peroxidase: A selenoenzyme. FEBS Lett. 1973, 32, 132–134. [Google Scholar] [CrossRef]
- Labunskyy, V.M.; Hatfield, D.L.; Gladyshev, V.N. Selenoproteins: Molecular pathways and physiological roles. Physiol. Rev. 2014, 94, 739–777. [Google Scholar] [CrossRef]
- Carr, S.N.; Crites, B.R.; Pate, J.L.; Hughes, C.H.K.; Matthews, J.C.; Bridges, P.J. Form of supplemental selenium affects the expression of mRNA transcripts encoding selenoproteins, and proteins regulating cholesterol uptake, in the corpus luteum of grazing beef cows. Animals 2022, 12, 313. [Google Scholar] [CrossRef]
- Cerny, K.L.; Anderson, L.; Burris, W.R.; Rhoads, M.; Matthews, J.C.; Bridges, P.J. Form of supplemental selenium fed to cycling cows affects systemic concentrations of progesterone but not those of estradiol. Theriogenology 2016, 85, 800–806. [Google Scholar] [CrossRef]
- Crites, B.R.; Carr, S.N.; Matthews, J.C.; Bridges, P.J. Form of dietary selenium affects mRNA encoding cholesterol biosynthesis and immune response elements in the early luteal phase bovine corpus luteum. J. Anim. Sci. 2022, 100, skac135. [Google Scholar] [CrossRef]
- Spencer, T.E.; Bazer, F.W. Biology of progesterone action during pregnancy recognition and maintenance of pregnancy. Front. Biosci. 2002, 7, 1879–1898. [Google Scholar] [CrossRef]
- Carter, F.; Forde, N.; Duffy, P.; Wade, M.; Fair, T.; Crowe, M.; Evans, A.; Kenny, D.; Roche, J.; Lonergan, P. Effect of increasing progesterone concentration from Day 3 of pregnancy on subsequent embryo survival and development in beef heifers. Reprod. Fertil. Dev. 2008, 20, 368–375. [Google Scholar] [CrossRef]
- Garrett, J.E.; Geisert, R.D.; Zavy, M.T.; Morgan, G.L. Evidence for maternal regulation of early conceptus growth and development in beef cattle. J. Reprod. Fertil. 1988, 84, 437–446. [Google Scholar] [CrossRef]
- Mansouri-Attia, N.; Aubert, J.; Reinaud, P.; Giraud-Delville, C.; Taghouti, G.; Galio, L.; Everts, R.E.; Degrelle, S.; Richard, C.; Hue, I.; et al. Gene expression profiles of bovine caruncular and intercaruncular endometrium at implantation. Physiol. Genom. 2009, 39, 14–27. [Google Scholar] [CrossRef]
- Atkinson, B.A.; King, G.J.; Amoroso, E.C. Development of the caruncular and intercaruncular regions in the bovine endometrium. Biol. Reprod. 1984, 30, 763–774. [Google Scholar] [CrossRef]
- Martal, J.; Chêne Camous, N.; Huynh, L.; Lantier, F.; Hermier, P.; L’haridon, R.; Charpigny, G.; Charlier, M.; Chaouat, G. Recent developments and potentialities for reducing embryo mortality in ruminants: The role of IFN-t and other cytokines in early pregnancy. Reprod. Fertil. Dev. 1997, 9, 355–380. [Google Scholar] [CrossRef]
- Crites, R.B.; Carr, N.S.; Anderson, H.L.; Matthews, C.J.; Bridges, J.P. Form of dietary selenium affects mRNA encoding inter-feron-stimulated and progesterone-induced genes in the bovine endometrium and conceptus length at maternal recognition of pregnancy. J. Anim. Sci. 2022, 100, skac137. [Google Scholar] [CrossRef]
- Forde, N.; Carter, F.; Fair, T.; Crowe, M.A.; Evans, A.C.O.; Spencer, T.E.; Bazer, F.W.; McBride, R.; Boland, M.P.; O’Gaora, P.; et al. Progesterone-regulated changes in endometrial gene expression contribute to advanced conceptus development in cattle. Biol. Reprod. 2009, 81, 784–794. [Google Scholar] [CrossRef]
- Gerloff, B.J. Effect of selenium supplementation on dairy cattle. J. Anim. Sci. 1992, 70, 3934–3940. [Google Scholar] [CrossRef]
- Dargatz, D.A.; Ross, P.F. Blood selenium concentrations in cows and heifers on 253 cow-calf operations in 18 states. J. Anim. Sci. 1996, 74, 2891–2895. [Google Scholar] [CrossRef]
- Wahlen, R.; Evans, L.; Turner, J.; Hearn, R. The use of collision/ reaction cell ICP-MS for the determination of elements in blood and serum samples. Spectroscopy 2005, 20, 84–89. [Google Scholar]
- Bogdanova, E.A.; Barsova, E.V.; Shagina, I.A.; Scheglov, A.; Anisimova, V.; Vagner, L.L.; Lukyanov, S.A.; Shagin, D.A. Normalization of full-length-enriched cDNA. In cDNA Libraries: Methods and Applications; Methods in Molecular Biology; Lu, C., Browse, J., Wallis, J.G., Eds.; Humana Press: Totawa, NJ, USA, 2011. [Google Scholar] [CrossRef]
- Ewels, P.A.; Peltzer, A.; Fillinger, S.; Patel, H.; Alnebert, J.; Wilm, A.; Garcia, M.U.; Di Tommaso, P.; Nahnsen, S. The nf-core framework for community-curated bioinformatics pipelines. Nat. Biotechnol. 2020, 38, 276–278. [Google Scholar] [CrossRef]
- Dobin, A.; Davis, C.A.; Schlesinger, F.; Drenkow, J.; Zaleski, C.; Jha, S.; Batut, P.; Chaisson, M.; Gingeras, T.R. STAR: Ultrafast universal RNA-seq aligner. Bioinformatics 2013, 29, 15–21. [Google Scholar] [CrossRef]
- Danecek, P.; Bonfield, J.K.; Liddle, J.; Marshall, J.; Ohan, V.; Pollard, M.O.; Whitwham, A.; Keane, T.; McCarthy, S.A.; Davies, R.M.; et al. Twelve years of SAMtools and BCFtools. Gigascience 2021, 10, giab008. [Google Scholar] [CrossRef]
- García-Alcalde, F.; Okonechnikov, K.; Carbonell, J.; Cruz, L.M.; Götz, S.; Tarazona, S.; Dopazo, J.; Meyer, T.F.; Conesa, A. Qualimap: Evaluating next-generation sequencing alignment data. Bioinformatics 2012, 28, 2678–2679. [Google Scholar] [CrossRef]
- Wang, L.; Wang, S.; Li, W. RSeQC: Quality control of RNA-seq experiments. Bioinformatics 2012, 28, 2184–2185. [Google Scholar] [CrossRef]
- Sayols, S.; Scherzinger, D.; Klein, H. dupRadar: A Bioconductor package for the assessment of PCR artifacts in RNA-Seq data. BMC Bioinform. 2016, 17, 428. [Google Scholar] [CrossRef]
- Daley, T.; Smith, A.D. Predicting the molecular complexity of sequencing libraries. Nat. Methods. 2013, 10, 325–327. [Google Scholar] [CrossRef]
- Liao, Y.; Smyth, G.K.; Shi, W. featureCounts: An efficient general purpose program for assigning sequence reads to genomic features. Bioinformatics 2014, 30, 923–930. [Google Scholar] [CrossRef]
- Ge, S.X.; Son, E.W.; Yao, R. iDEP: An integrated web application for differential expression and pathway analysis of RNA-Seq data. BMC Bioinform. 2018, 19, 534. [Google Scholar] [CrossRef]
- Love, M.I.; Huber, W.; Anders, S. Moderated estimation of fold change and dispersion for RNA-seq data with DESeq2. Genome Biol. 2014, 15, 550. [Google Scholar] [CrossRef]
- Carr, S.N.; Crites, B.R.; Shinde, H.; Bridges, P.J. Transcriptomic chnges in response to form of selenium on the interferon-tau signaling mechanism in the caruncular tissue of beef heifers at maternal recognition of pregnancy. Int. J. Mol. Sci. 2023, 24, 17327. [Google Scholar] [CrossRef]
- Livak, K.J.; Schmittgen, T.D. Analysis of relative gene expression data using real-time quantitative PCR and the 2−ΔΔCT method. Methods 2001, 25, 402–408. [Google Scholar] [CrossRef]
- Chen, X.D.; Zhao, Z.P.; Zhao, J.C.; Lei, X.G. Evolution, regulation, and function of porcine selenogenome. Free Radic. Biol. Med. 2018, 127, 116–123. [Google Scholar] [CrossRef]
- Bianco, A.C.; Salvatore, D.; Gereben, B.; Berry, M.J.; Larsen, P.R. Biochemistry, cellular and molecular biology, and physiological roles of the iodothyronine selenodeiodinases. Endocr. Rev. 2002, 23, 38–89. [Google Scholar] [CrossRef] [PubMed]
- Mullur, R.; Liu, Y.Y.; Brent, G.A. Thyroid hormone regulation of metabolism. Physiol. Rev. 2014, 94, 355–382. [Google Scholar] [CrossRef]
- Silva, J.F.; Ocarino, N.M.; Serakides, R. Thyroid hormones and female reproduction. Biol. Reprod. 2018, 99, 907–921. [Google Scholar] [CrossRef]
- Forhead, A.J.; Fowden, A.L. Thyroid hormones in fetal growth and prepartum maturation. J. Endocrinol. 2014, 221, R87–R103. [Google Scholar] [CrossRef] [PubMed]
- Gereben, B.; Zeöld, A.; Dentice, M.; Salvatore, D.; Bianco, A.C. Activation and inactivation of thyroid hormone by deiodinases: Local action with general consequences. Cell. Mol. Life Sci. 2008, 65, 570–590. [Google Scholar] [CrossRef] [PubMed]
- Moraes, J.G.N.; Behura, S.K.; Geary, T.W.; Spencer, T.E. Analysis of the uterine lumen in fertility-classified heifers: I. Glucose, prostaglandins, and lipids. Biol. Reprod. 2020, 102, 456–474. [Google Scholar] [CrossRef]
- Chen, Y.; Ye, J.; Cao, L.; Zhang, Y.; Xia, W.; Zhu, D. Myostatin regulates glucose metabolism via the AMP-activated protein kinase pathway in skeletal muscle cells. Int. J. Biochem. Cell Biol. 2010, 42, 2072–2081. [Google Scholar] [CrossRef]
- Bobe, G.; Young, J.W.; Beitz, D.C. Invited review: Pathology, etiology, prevention, and treatment of fatty liver in dairy cows. J. Dairy Sci. 2004, 87, 3105–3124. [Google Scholar] [CrossRef]
- Miles, E.D. Effects of Estradiol Supplementation on Blood Estradiol and Metabolite Levels, and Hepatic Protein Expression, in Growing, Mature, and Senescent Beef Cattle. Ph.D. Thesis, University of Kentucky, Lexington, KY, USA, 2013. [Google Scholar]
- Goff, J.P.; Horst, R.L. Physiological changes at parturition and their relationship to metabolic disorders. J. Dairy Sci. 1997, 80, 1260–1268. [Google Scholar] [CrossRef]
- Bertics, S.J.; Grummer, R.R.; Cadorniga-Valino, C.; Stoddard, E.E. Effect of prepartum dry matter intake on liver triglyceride concentration and early lactation. J. Dairy Sci. 1992, 75, 1914–1922. [Google Scholar] [CrossRef]
- Drackley, J.K.; Veenhuizen, J.J.; Richard, M.J.; Young, J.W. Metabolic changes in blood and liver of dairy cows during either feed restriction or administration of 1,3-butanediol. J. Dairy Sci. 1991, 74, 4254–4264. [Google Scholar] [CrossRef]
- Hu, J.; Zhang, Z.; Shen, W.J.; Azhar, S. Cellular cholesterol delivery, intracellular processing and utilization for biosynthesis of steroid hormones. Nutr. Metab. 2010, 7, 47. [Google Scholar] [CrossRef] [PubMed]
- Russell, D.W. The enzymes, regulation, and genetics of bile acid synthesis. Annu. Rev. Biochem. 2003, 72, 137–174. [Google Scholar] [CrossRef] [PubMed]
- Pate, J.L.; Condon, W.A. Regulation of steroidogenesis and cholesterol synthesis by prostaglandin F-2 alpha and lipoproteins in bovine luteal cells. J. Reprod. Fertil. 1989, 87, 439–446. [Google Scholar] [CrossRef]
- Carr, S.N.; Jia, Y.; Crites, B.R.; Hamilton, C.H.; Burris, W.R.; Edwards, J.L.; Matthews, J.C.; Bridges, P.J. Form of supplemental selenium in vitamin-mineral premixes differentially affects early luteal and gestational concentrations of progesterone, and postpartum concentrations of prolactin in beef cows. Animals 2020, 10, 967. [Google Scholar] [CrossRef]
- Baboota, R.K.; Blüher, M.; Smith, U. Emerging role of bone morphogenetic protein 4 in metabolic disorders. Diabetes 2021, 70, 303–312. [Google Scholar] [CrossRef] [PubMed]
- Meijer, G.A.; Van der Meulen, J.; Bakker, J.G.; Van der Koelen, C.J.; Van Vuuren, A.M. Free amino acids in plasma and muscle of high yielding dairy cows in early lactation. J. Dairy Sci. 1995, 78, 1131–1141. [Google Scholar] [CrossRef]
- Getz, S.G.; Reardon, A.C. Apoprotein E as a lipid transport and signaling protein in the blood, liver, and artery wall. J. Lipid Res. 2009, 50, S156–S161. [Google Scholar] [CrossRef] [PubMed]
- Cousins, R.J.; Liuzzi, J.P. Trace Metal Absorption and Transport. In Physiology of the Gastrointestinal Tract, 6th ed.; Academic Press: Cambridge, MA, USA, 2018; pp. 1485–1498. [Google Scholar]
- Cruzat, V.; Rogero, M.M.; Keane, N.K.; Curi, R.; Newsholme, P. Glutamine: Metabolism and immune function, supplementation and clinical translation. Nutrients 2018, 10, 1564. [Google Scholar] [CrossRef]
- UniProt. Q3T0S5·ALDOB_BOVIN; UniProt: Cambridge, UK, 2025. [Google Scholar]
- National Center for Biotechnology Information (NCBI). Protein [Internet]. Bethesda (MD): National Library of Medicine (US), National Center for Biotechnology Information; 1988—Accession No. Q0VCM4.1, RecName: Full=Glycogen Phosphorylase, liver Form. Available online: https://www.ncbi.nlm.nih.gov/protein/Q0VCM4.1 (accessed on 20 February 2025).
- Chen, H.; Leipprandt, R.J.; Traviss, E.C.; Sopher, L.B.; Jones, Z.M.; Cavanagh, T.K.; Friderici, H.K. Molecular cloning and characterization of bovine β-mannosidase. J. Biol. Chem. 1995, 270, 3841–3848. [Google Scholar] [CrossRef]


| Gene 2 | Gene Name | qPCR 3 | |||
|---|---|---|---|---|---|
| ISe | MIX | SEM | p-Value 4 | ||
| Iodothyronine deiodinases | |||||
| Dio1 | Iodothyronine deiodinase 1 | Unable to be detected | |||
| Dio2 | Iodothyronine deiodinase 2 | 1.2178 | 0.4352 | 0.2761 | 0.02 |
| Dio3 | Iodothyronine deiodinase 3 | 1.1500 | 0.8239 | 0.2169 | 0.31 |
| Glutathione peroxidases | |||||
| Gpx1 | Glutathione peroxidase 1 | 1.0492 | 1.0758 | 0.1357 | 0.89 |
| Gpx2 | Glutathione peroxidase 2 | 1.3249 | 1.2657 | 0.3859 | 0.92 |
| Gpx3 | Glutathione peroxidase 3 | 1.0876 | 1.3000 | 0.2383 | 0.54 |
| Gpx4 | Glutathione peroxidase 4 | 1.0501 | 1.2017 | 0.1055 | 0.33 |
| Gpx6 | Glutathione peroxidase 6 | 1.3284 | 0.9822 | 0.3636 | 0.83 |
| Thioredoxin reductases | |||||
| Txnrd1 | Thioredoxin reductase 1 | 1.0296 | 1.0015 | 0.0917 | 0.83 |
| Txnrd2 | Thioredoxin reductase 2 | 1.0658 | 1.0399 | 0.1117 | 0.88 |
| Txnrd3 | Thioredoxin reductase 3 | 1.0411 | 1.0397 | 0.1250 | 0.99 |
| Other selenoproteins | |||||
| Selenof | Selenoprotein F | 1.0447 | 1.1489 | 0.1122 | 0.53 |
| Selenoh | Selenoprotein H | 1.0199 | 0.8302 | 0.1028 | 0.22 |
| Selenoi | Selenoprotein I | 1.0101 | 1.0082 | 0.0832 | 0.99 |
| Selenok | Selenoprotein K | 1.0202 | 0.9775 | 0.0933 | 0.73 |
| Selenom | Selenoprotein M | 4.7204 | 4.4863 | 2.1965 | 0.94 |
| Selenon | Selenoprotein N | 1.0283 | 0.8790 | 0.0849 | 0.24 |
| Selenoo | Selenoprotein O | 1.0437 | 0.8585 | 0.1088 | 0.26 |
| Selenop | Selenoprotein P | 1.0361 | 0.9158 | 0.1190 | 0.49 |
| Selenor | Selenoprotein R | 1.0838 | 0.8093 | 0.1803 | 0.26 |
| Selenos | Selenoprotein S | 1.0227 | 1.1723 | 0.1205 | 0.40 |
| Selenot | Selenoprotein T | 1.0519 | 0.9570 | 0.1132 | 0.57 |
| Selenov | Selenoprotein V | 1.1392 | 0.7628 | 0.2257 | 0.27 |
| Selenow | Selenoprotein W | 1.1121 | 0.9271 | 0.1809 | 0.64 |
| Sephs2 | Selenophosphate synthetase 2 | 1.0458 | 1.1432 | 0.1455 | 0.65 |
| Selenoprotein P receptors | |||||
| Lrp2 | LDL receptor related protein 2 | 1.0913 | 0.6536 | 0.1634 | 0.09 |
| Lrp8 | LDL receptor related protein 8 | 1.0196 | 0.9290 | 0.1172 | 0.60 |
| Tfrc | Transferrin receptor | 1.0294 | 0.9993 | 0.1023 | 0.84 |
| Gene ID | Gene Description | Fold Change | p-Value 2 |
|---|---|---|---|
| Up regulated in MIX | |||
| Muc4 | Mucin 4, cell surface-associated | 3.78 | <0.0001 |
| Kcnn4 | Potassium calcium-activated channel subfamily N member 4 | 3.58 | <0.01 |
| Sp7 | Sp7 transcription factor | 3.52 | <0.01 |
| Lpar5 | Lysophosphatidic acid receptor 5 | 2.91 | 0.02 |
| Orm1 | Orosomucoid 1 | 2.79 | 0.03 |
| Nxph4 | Neurexophilin 4 | 2.74 | 0.02 |
| Tmem132d | Transmembrane protein 132D | 2.67 | 0.02 |
| Dusp2 | Dual specificity phosphatase 2 | 2.48 | <0.01 |
| Tmem217 | Transmembrane protein 217 | 2.42 | 0.03 |
| Znf597 | Zinc finger protein 597 | 2.02 | 0.03 |
| Downregulated in MIX | |||
| Sycp3 | Synaptonemal complex protein 3 | −5.85 | <0.001 |
| Nalcn | Sodium leak channel, non-selective | −5.51 | 0.0001 |
| Cdhr1 | Cadherin-related family member 1 | −4.29 | 0.02 |
| Ces5a | Carboxylesterase 5A | −4.27 | 0.01 |
| Nkain2 | Sodium/potassium transporting ATPase interacting 2 | −3.82 | <0.01 |
| Dlk1 | Delta-like non-canonical Notch ligand 1 | −3.76 | 0.03 |
| Aard | Alanine and arginine-rich domain-containing protein | −3.69 | 0.04 |
| Majin | Membrane-anchored junction protein | −3.68 | 0.01 |
| Ca12 | Carbonic anhydrase 12 | −3.68 | <0.01 |
| Tas2r4 | Taste 2 receptor membrane 4 | −3.38 | <0.01 |
| Canonical Pathway 2 | Gene Symbols | Ratio 3 | Z-Score | p-Value |
|---|---|---|---|---|
| Mitochondrial Dysfunction | Up: Atp5me, Atp5mg, Cacna1s, Clic2, Cox6a1, Cox7b, Cox8a, Gsr, Map3k5, Ndufb6, Ndufb11, Ndufv3, Ppif, Prdx6, Tomm22, Tp53, Uqrc10 Down: C9orf72, Cacna1d, Hap1, Mgst3, Prkar2a, Snca | 0.07 (23/345) | −1.279 | <0.0001 |
| Cardiac-adrenergic signaling | UP: Cacna1s, Gna15 Down: Adcy2, Adcy8, Akap6, Cacna1d, Gnal, Gnaq, Palm2akap2, Pde10a, Pde6a, Ppp1r12a, Ppp1r1a, Prkar2a | 0.08 (14/180) | −1.667 | <0.0001 |
| Endocannabinoid neuronal synapse pathway | Up: Cacna1s, Gna15, Mgll, Plcb2 Down: Adcy2, Adcy8, Cacna1d, Gnal, Gnaq, Gria1, Mapk13, Prkar2a | 0.08 (12/149) | 0.302 | <0.0001 |
| G beta gamma signaling | Up: Cacna1s, Gna15, Mgll, Plcb2 Down: Adcy2, Adcy8, Cacna1d, Gnal, Gnaq, Gria1, Mapk13, Prkar2a | 0.09 (11/129) | −0.905 | <0.0001 |
| Synaptogenesis signaling pathway | Up: Apoe, Efnb1, Epha3, Ephb6, Rab3a, Rab5c, Syt17 Down: Adcy2, Adcy8, Chn1, Epha5, Epha7, Gria1, Nrxn1, Prkar2a, Snap25, Snca, Thbs2 | 0.08 (11/132) | −0.943 | <0.0001 |
| Molecular and Cellular Functions 2 | Z-Score 3 | p-Value 4 |
|---|---|---|
| Cellular assembly and organization (133 molecules) | ||
| Formation of cellular protrusions | 0.726 | <0.0001 |
| Neuritogenesis | 0.907 | <0.0001 |
| Cellular function and maintenance (207 molecules) | ||
| Cellular homeostasis | 1.424 | <0.0001 |
| Formation of cellular protrusions | 0.726 | <0.0001 |
| Organization of cells | 0.659 | <0.0001 |
| Neuritogenesis | 0.907 | <0.0001 |
| Exocytosis | 0.636 | <0.0001 |
| T cell homeostasis | 2.259 | <0.0001 |
| Cell morphology (99 molecules) | ||
| Formation of cellular protrusions | 0.726 | <0.0001 |
| Morphogenesis of neurons | 0.907 | <0.0001 |
| Neuritogenesis | 0.907 | <0.0001 |
| Cell spreading | 0.937 | 0.0007 |
| Carbohydrate metabolism (68 molecules) | ||
| Uptake of monosaccharide | −1.558 | 0.0002 |
| Uptake of D-glucose | −1.175 | 0.0003 |
| Molecular transport (149 molecules) | ||
| Transport of ions | −0.950 | <0.0001 |
| Transport of molecules | −1.640 | <0.0001 |
| Transport of metal | −0.855 | 0.0002 |
| Transport of inorganic cations | 0.555 | 0.0002 |
| Transport of metal ions | 0.555 | 0.0002 |
| Uptake of D-glucose | −1.175 | 0.0003 |
| Quantity of polyunsaturated fatty acids | 0.849 | 0.0003 |
| Concentration of eicosanoid | 1.254 | 0.0003 |
| Exocytosis | 0.636 | 0.0004 |
| RNA-Seq 3 | qPCR 3 | ||||||
|---|---|---|---|---|---|---|---|
| Gene 2 | ISe | MIX | p-Value | ISe | MIX | SEM | p-Value 4 |
| Carbohydrate metabolism | |||||||
| Adcy2 | 1.00 | 0.77 | <0.01 | 1.07 | 0.39 | 0.15 | <0.01 |
| Aldob | 1.00 | 0.79 | <0.05 | 1.45 | 0.52 | 0.84 | 0.92 |
| Apoe | 1.00 | 1.39 | <0.01 | 1.13 | 2.53 | 0.57 | 0.10 |
| Bmp4 | 1.00 | 1.18 | 0.02 | 1.04 | 1.00 | 0.14 | 0.80 |
| Edn1 | 1.00 | 1.18 | <0.05 | 1.01 | 1.34 | 0.11 | 0.07 |
| Gaa | 1.00 | 1.26 | <0.01 | 1.04 | 0.73 | 0.08 | 0.04 |
| Gnaq | 1.00 | 0.91 | <0.05 | 1.02 | 0.75 | 0.08 | 0.04 |
| Manba | 1.00 | 0.70 | <0.01 | 1.19 | 0.43 | 0.20 | <0.05 |
| Mstn * | 1.00 | 1.35 | <0.001 | 1.03 | 1.71 | 0.14 | 0.01 |
| Neu3 | 1.00 | 1.13 | 0.03 | 1.02 | 0.67 | 0.07 | 0.01 |
| Pygl | 1.00 | 0.86 | 0.034 | 1.01 | 0.71 | 0.06 | 0.01 |
| Sgsh | 1.00 | 1.23 | <0.01 | 1.02 | 0.81 | 0.48 | 0.09 |
| Slc1a4 | 1.00 | 1.42 | <0.0001 | 1.03 | 1.38 | 0.15 | 0.13 |
| Spp1 | 1.00 | 0.73 | <0.01 | 1.25 | 0.48 | 0.30 | <0.05 |
| Canonical Wnt signaling pathway | |||||||
| Cpt1a | 1.00 | 0.85 | <0.05 | 1.31 | 0.55 | 0.28 | 0.09 |
| Ctnnb1 | 1.00 | 0.95 | 0.08 | 1.01 | 0.94 | 0.13 | 0.73 |
| Dkk1 * | 1.00 | 0.83 | 0.21 | 1.10 | 0.64 | 0.15 | 0.05 |
| Fzd6 | 1.00 | 0.88 | 0.03 | 1.03 | 0.86 | 0.09 | 0.23 |
| Lrp5 | 1.00 | 1.02 | 0.79 | 1.01 | 0.72 | 0.07 | 0.01 |
| Lrp6 | 1.00 | 0.75 | 0.03 | 1.02 | 0.55 | 0.08 | <0.01 |
Disclaimer/Publisher’s Note: The statements, opinions and data contained in all publications are solely those of the individual author(s) and contributor(s) and not of MDPI and/or the editor(s). MDPI and/or the editor(s) disclaim responsibility for any injury to people or property resulting from any ideas, methods, instructions or products referred to in the content. |
© 2025 by the authors. Licensee MDPI, Basel, Switzerland. This article is an open access article distributed under the terms and conditions of the Creative Commons Attribution (CC BY) license (https://creativecommons.org/licenses/by/4.0/).
Share and Cite
Carr, S.N.; Crites, B.R.; Son, K.; Bridges, P.J. Carbohydrate Metabolism in the Intercaruncular Endometrium Is Affected by Form of Supplemental Selenium at Maternal Recognition of Pregnancy in Beef Heifers. Animals 2025, 15, 1903. https://doi.org/10.3390/ani15131903
Carr SN, Crites BR, Son K, Bridges PJ. Carbohydrate Metabolism in the Intercaruncular Endometrium Is Affected by Form of Supplemental Selenium at Maternal Recognition of Pregnancy in Beef Heifers. Animals. 2025; 15(13):1903. https://doi.org/10.3390/ani15131903
Chicago/Turabian StyleCarr, Sarah N., Benjamin R. Crites, Kwangwon Son, and Phillip J. Bridges. 2025. "Carbohydrate Metabolism in the Intercaruncular Endometrium Is Affected by Form of Supplemental Selenium at Maternal Recognition of Pregnancy in Beef Heifers" Animals 15, no. 13: 1903. https://doi.org/10.3390/ani15131903
APA StyleCarr, S. N., Crites, B. R., Son, K., & Bridges, P. J. (2025). Carbohydrate Metabolism in the Intercaruncular Endometrium Is Affected by Form of Supplemental Selenium at Maternal Recognition of Pregnancy in Beef Heifers. Animals, 15(13), 1903. https://doi.org/10.3390/ani15131903