
Machine Learning Approaches for the Prediction of Displaced Abomasum in Dairy Cows Using a Highly Imbalanced Dataset


Simple Summary
Abstract
1. Introduction
2. Material and Methods
2.1. Data
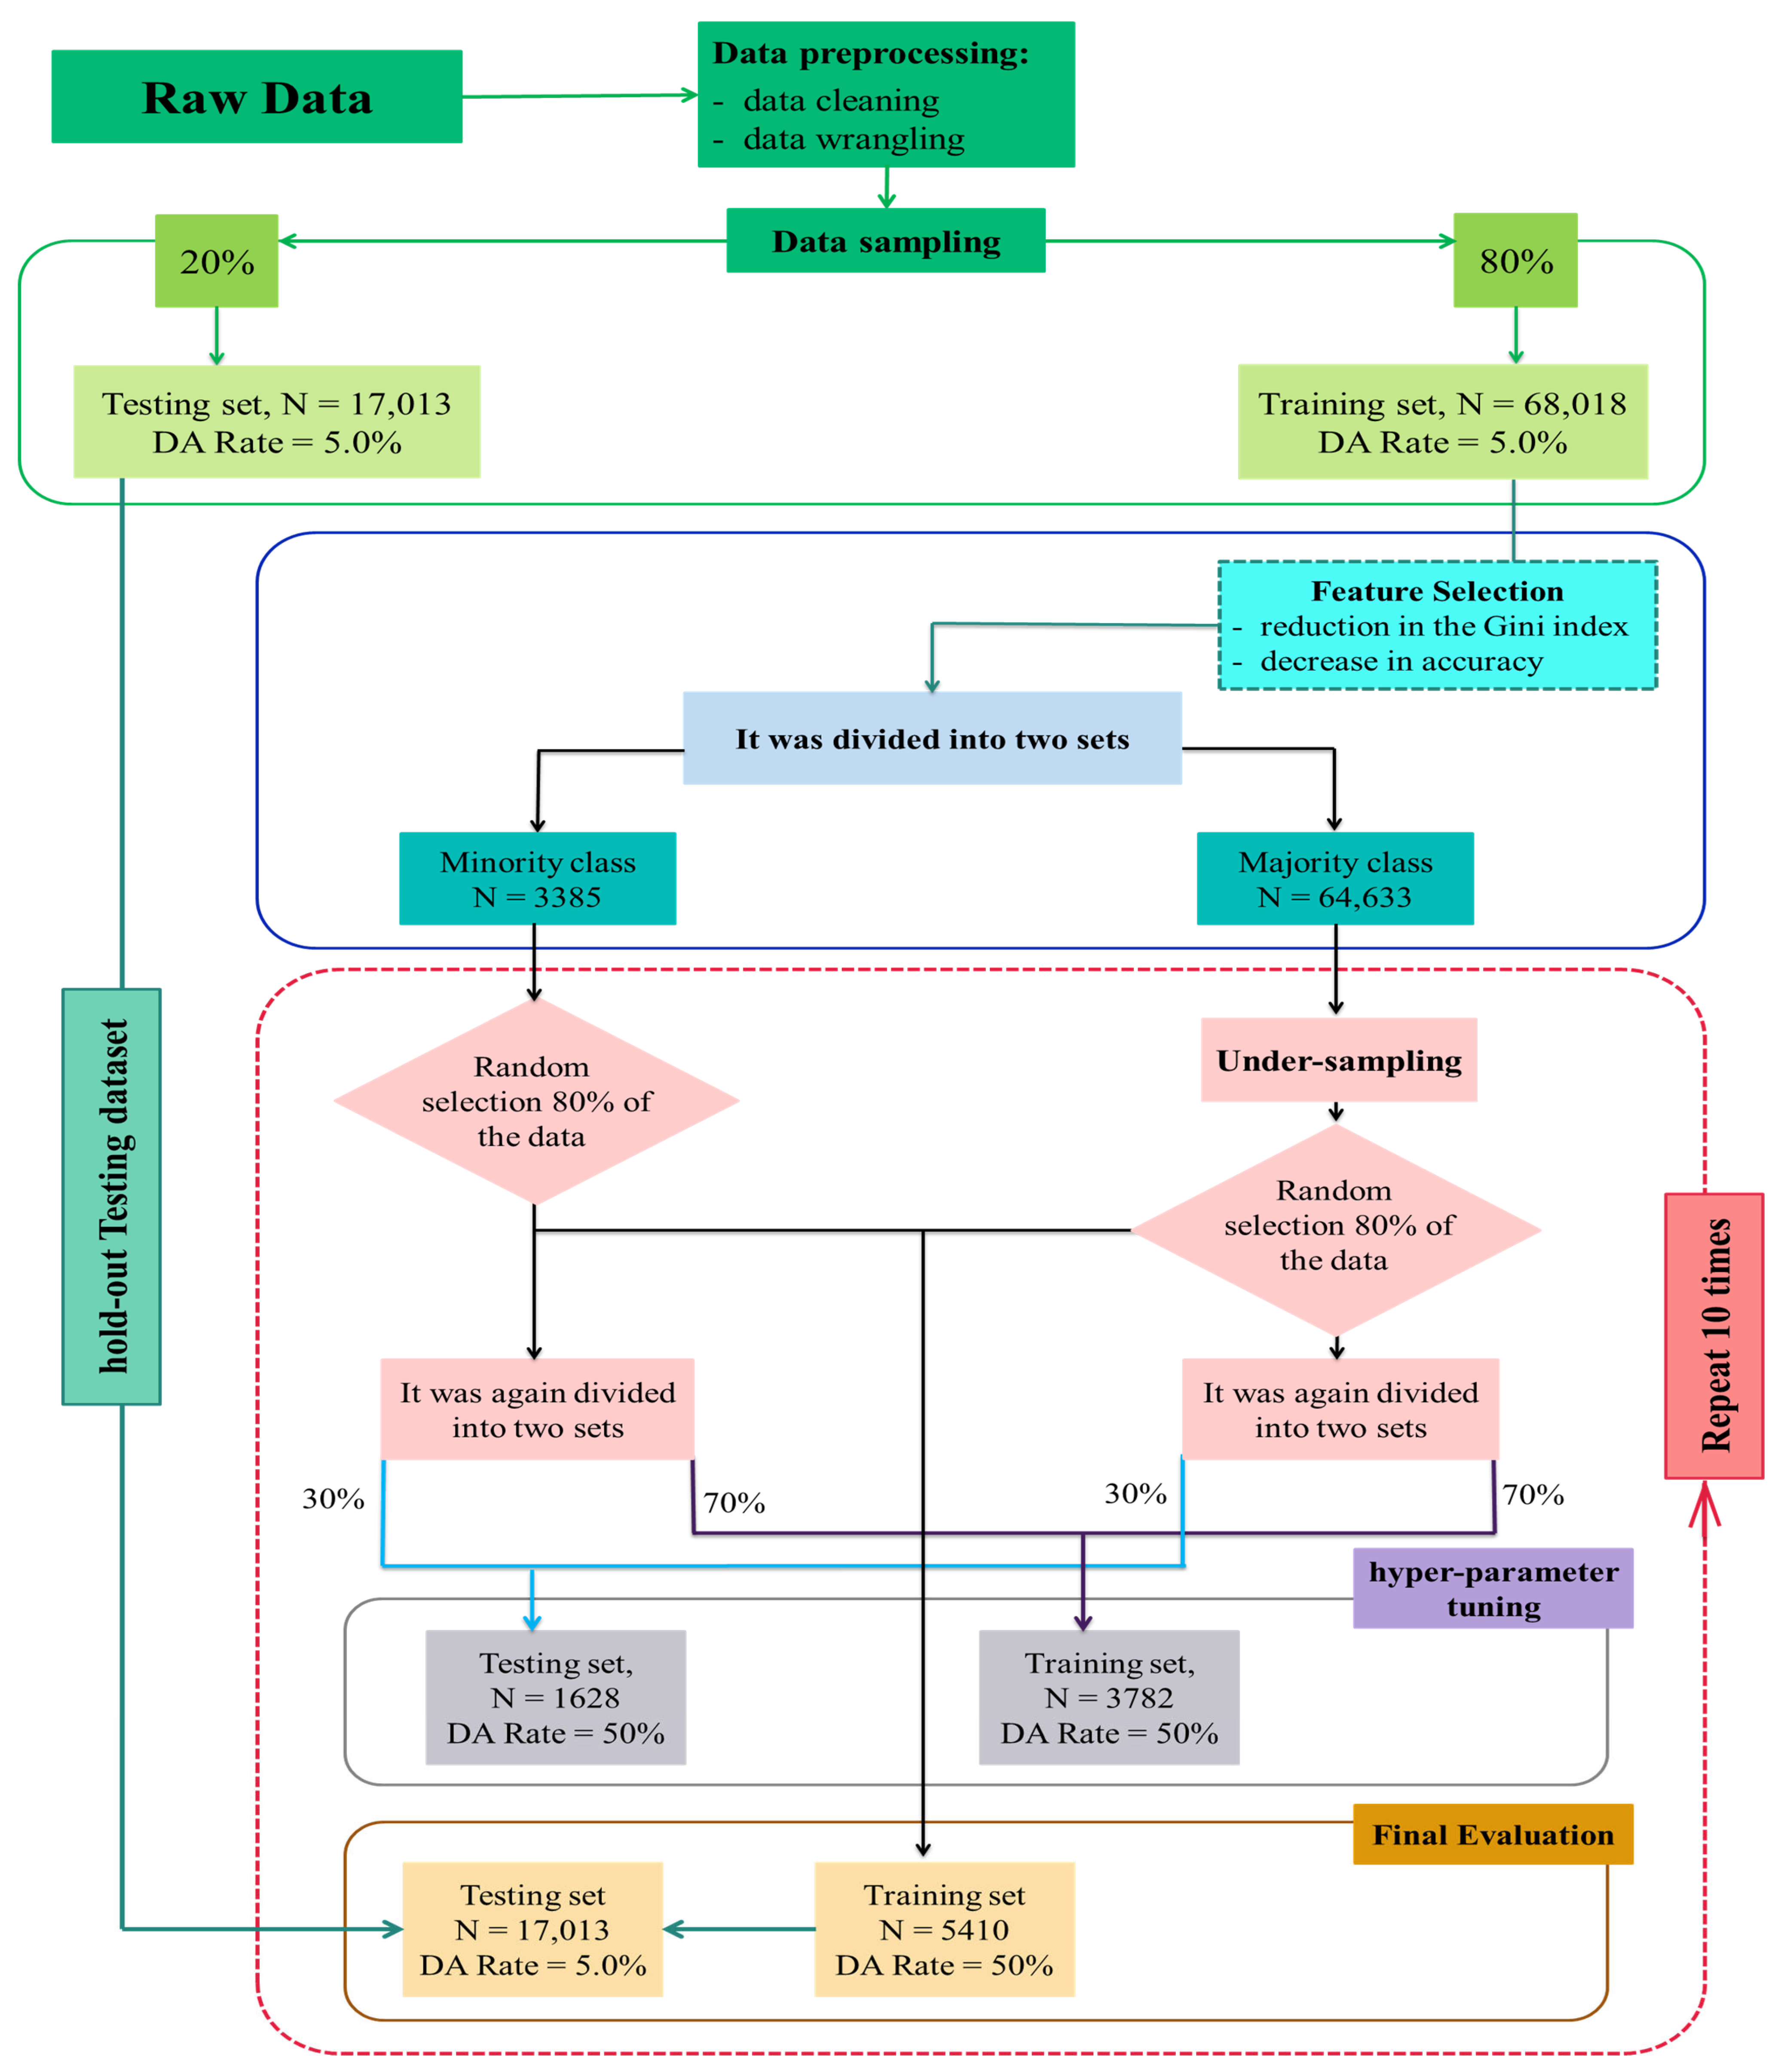
2.2. Machine Learning Methodology
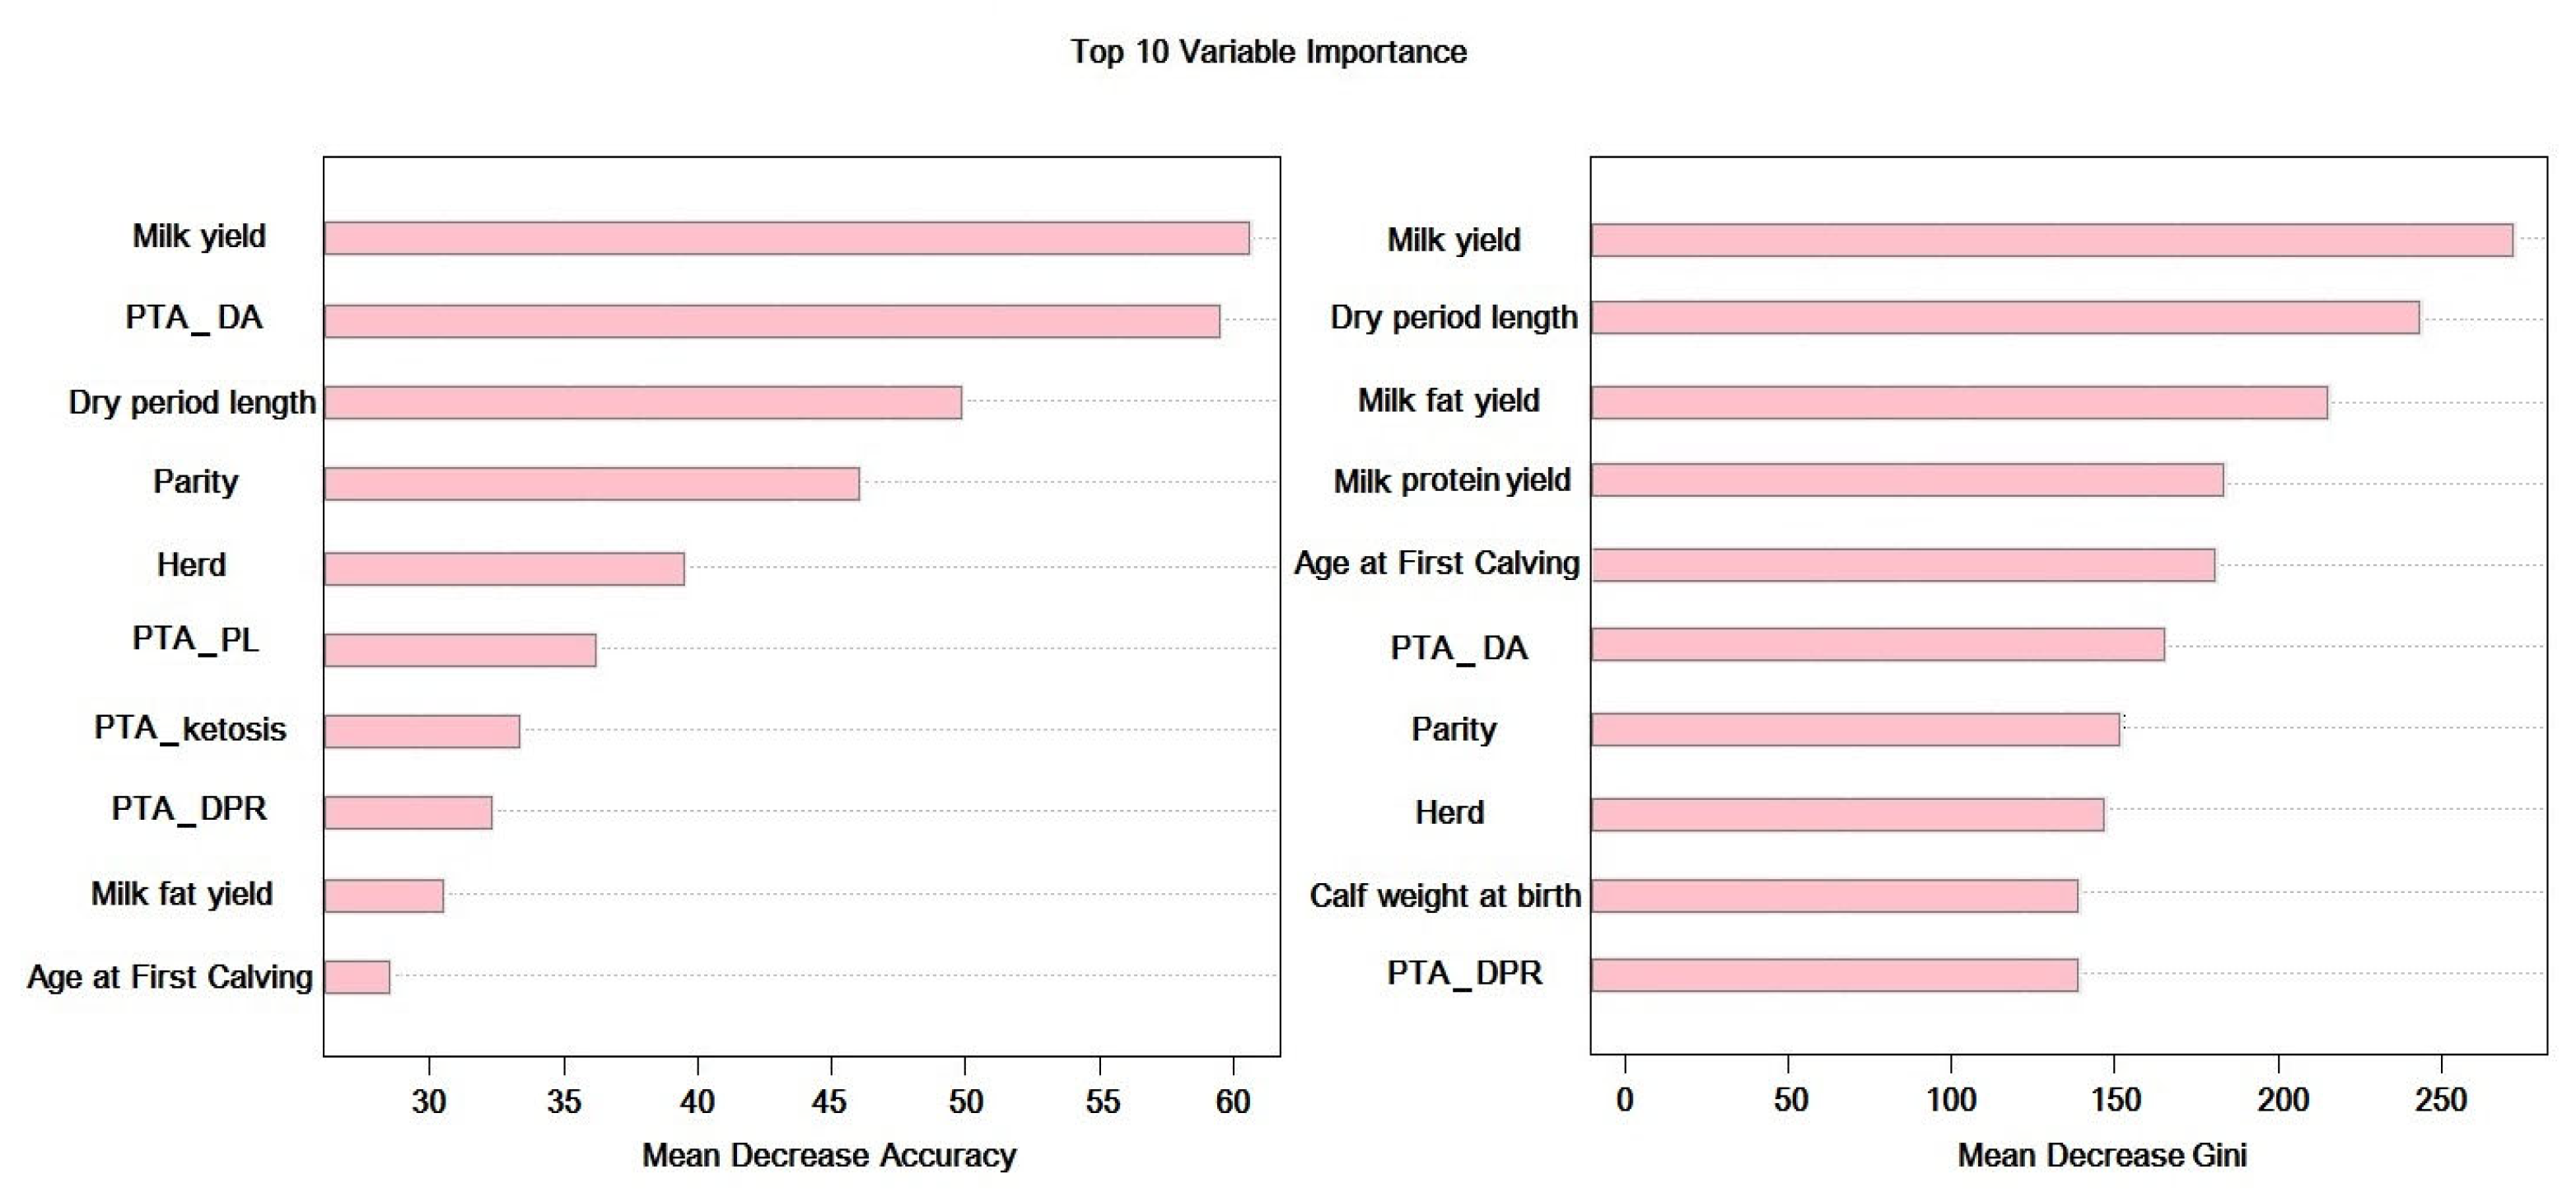
2.2.1. Feature Selection
2.2.2. Hyperparameter Tuning
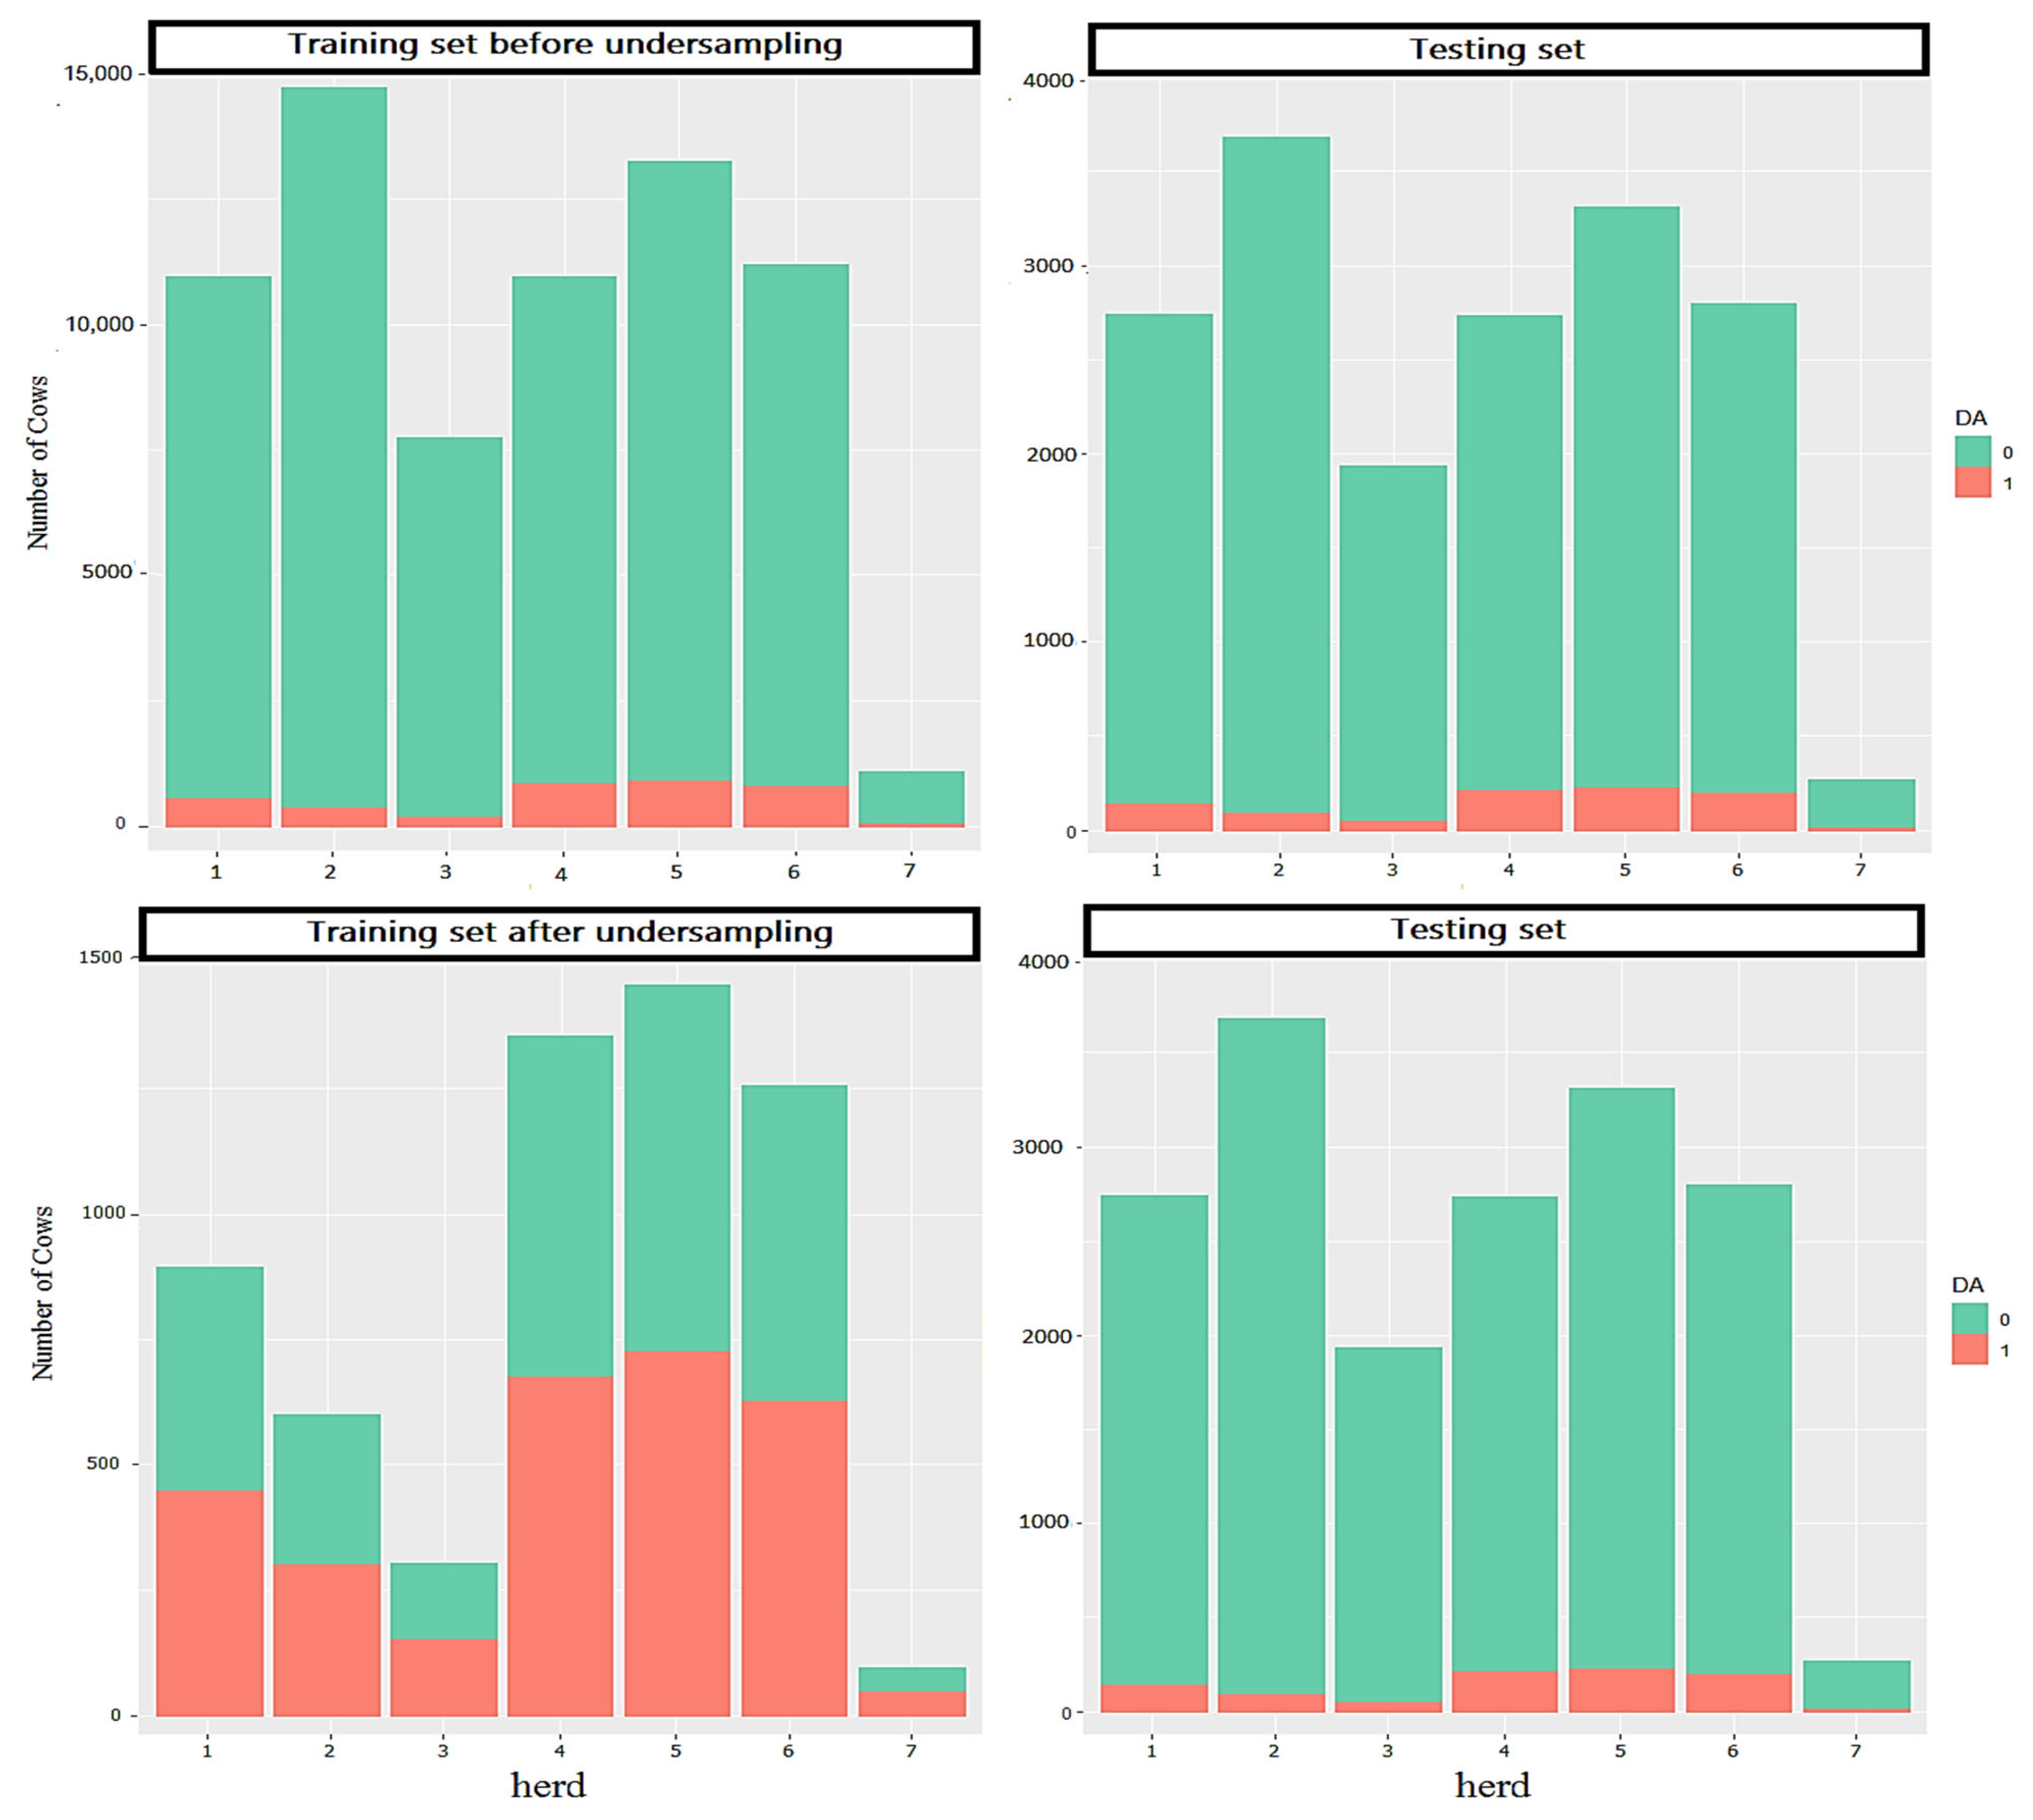
2.2.3. Analysis
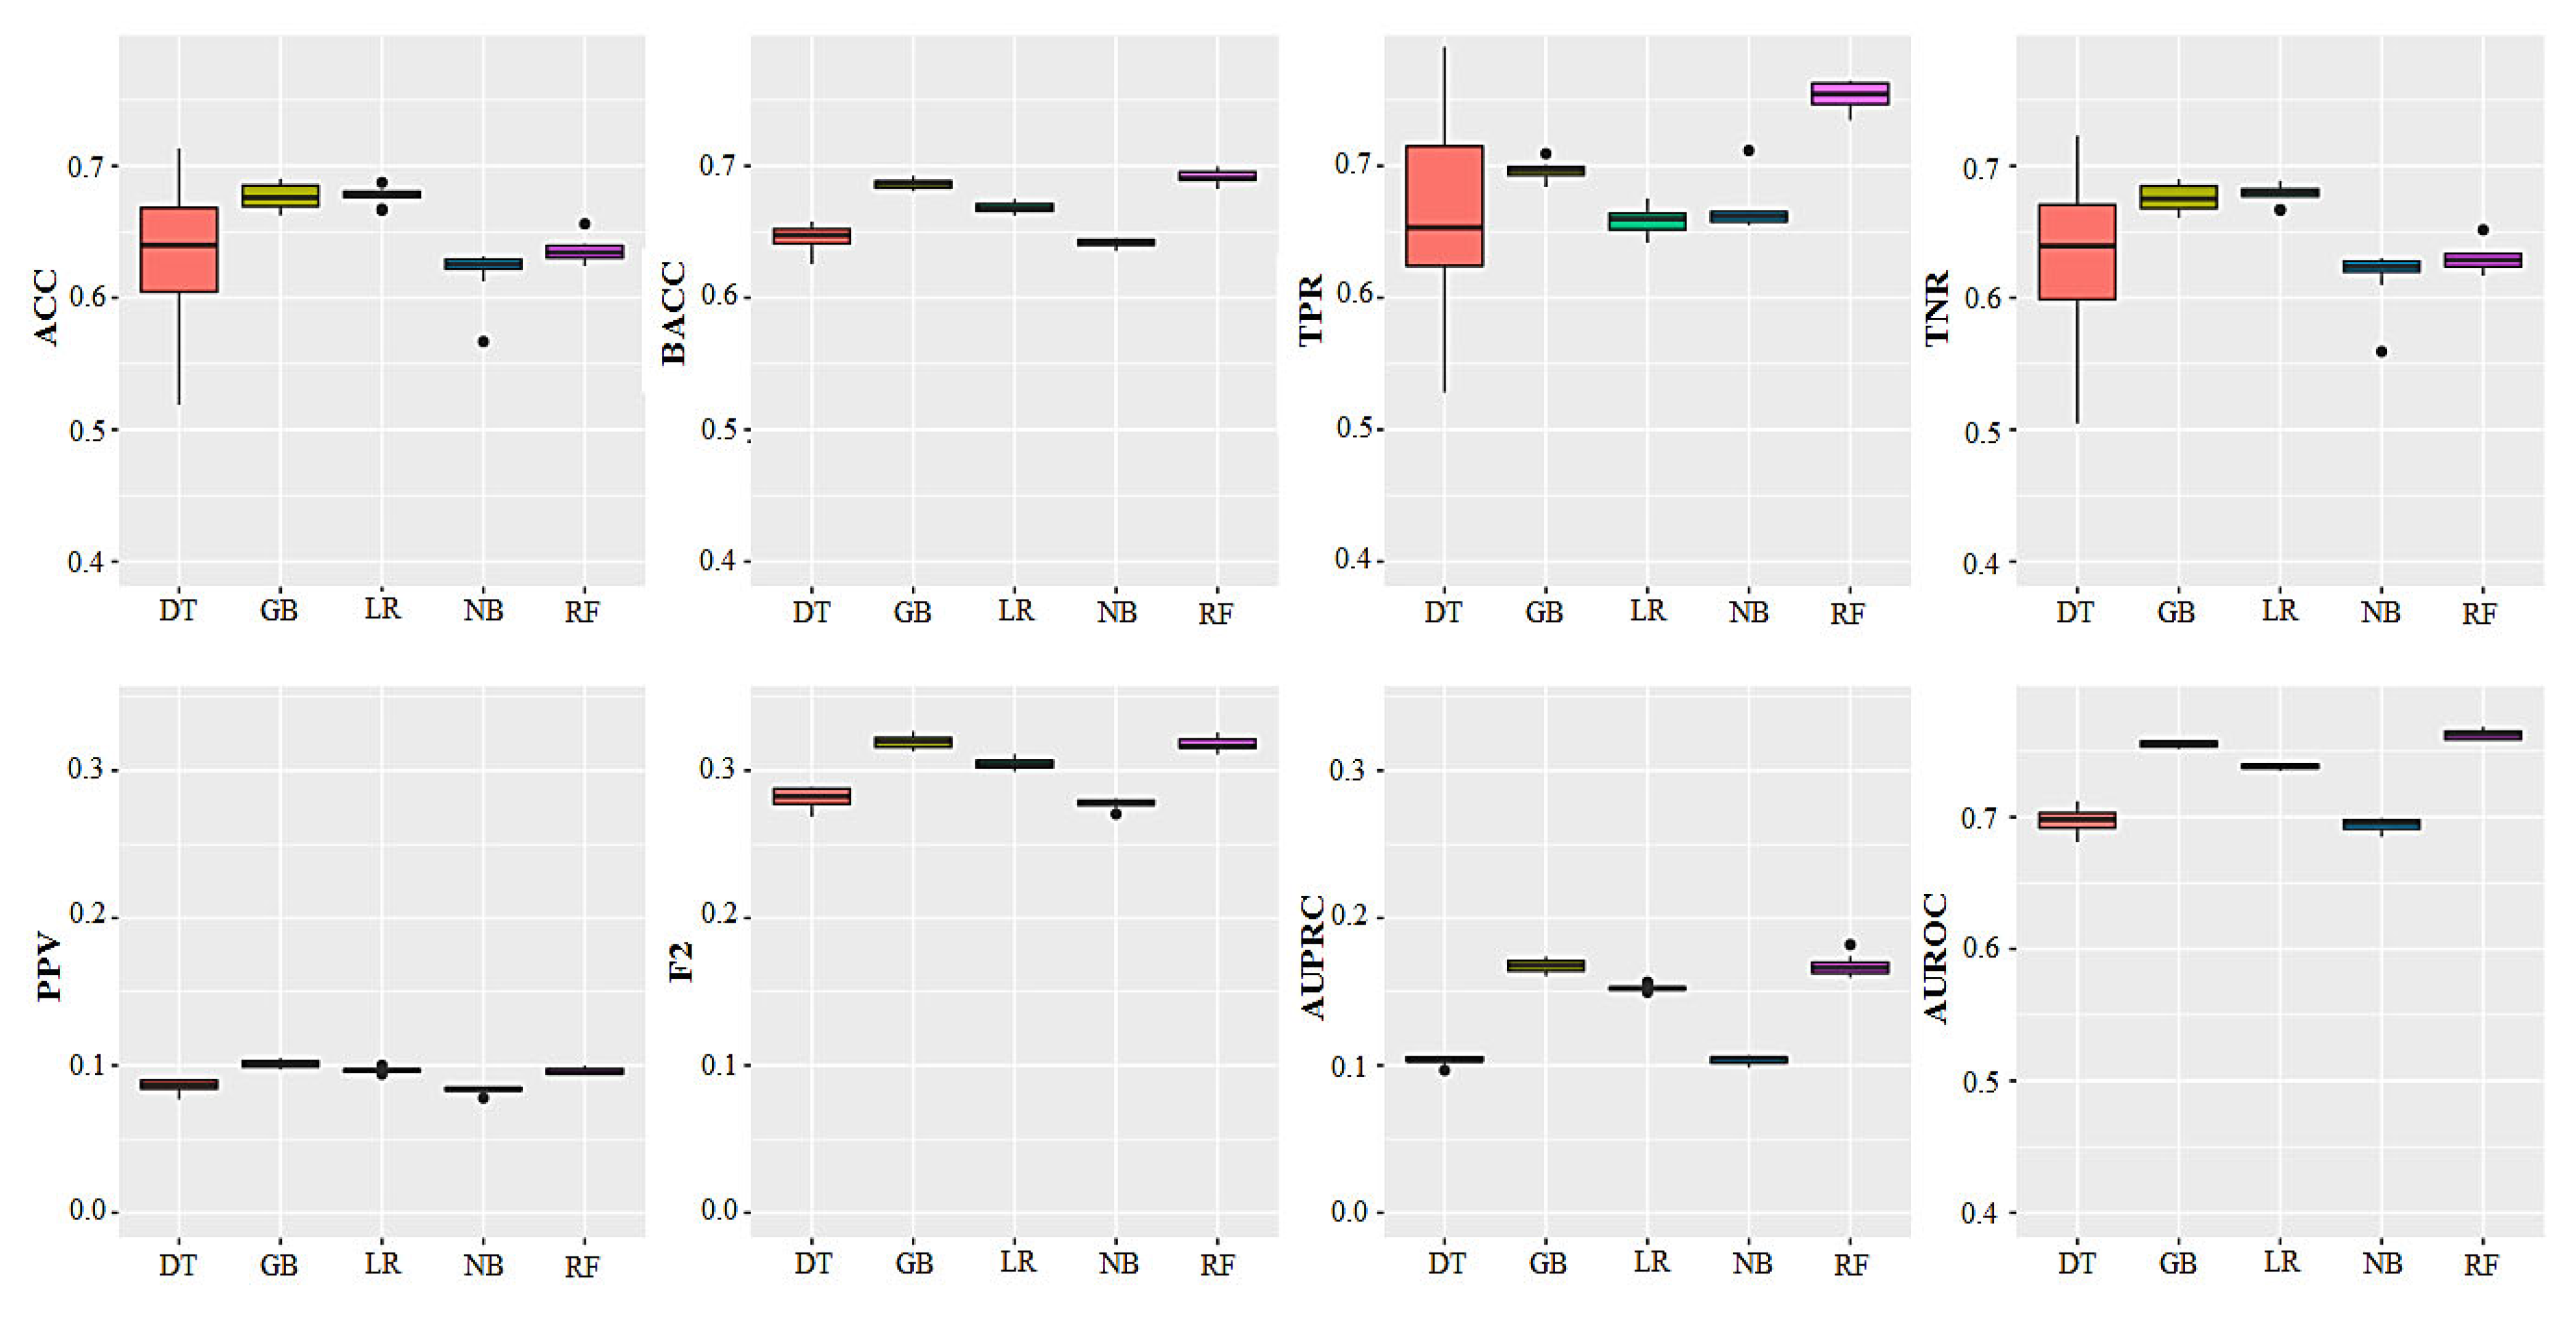
3. Results
4. Discussion
5. Conclusions
Author Contributions
Funding
Institutional Review Board Statement
Informed Consent Statement
Data Availability Statement
Acknowledgments
Conflicts of Interest
References
- Caixeta, L.S.; Herman, J.A.; Johnson, G.W.; McArt, J.A. Herd-level monitoring and prevention of displaced abomasum in dairy cattle. Vet. Clin. N. Am. Food Anim. 2018, 34, 83–99. [Google Scholar] [CrossRef] [PubMed]
- González-Martín, J.V.; Revilla-Ruiz, Á.; Astiz, S. Abomasum Displacement in Bovine (Calves, Young Stock, and Cows). In Encyclopedia of Livestock Medicine for Large Animal and Poultry Production; Springer: Berlin/Heidelberg, Germany, 2025; pp. 1–9. [Google Scholar]
- LeBlanc, S. Monitoring metabolic health of dairy cattle in the transition period. J. Reprod. Dev. 2010, 56, 29–35. [Google Scholar] [CrossRef] [PubMed]
- Mueller, K. Diagnosis, treatment and control of left displaced abomasum in cattle. In Pract. 2011, 33, 470–481. [Google Scholar] [CrossRef]
- Basoglu, A.; Baspinar, N.; Tenori, L.; Licari, C.; Gulersoy, E. Nuclear magnetic resonance (NMR)-based metabolome profile evaluation in dairy cows with and without displaced abomasum. Vet. Q. 2020, 40, 1–15. [Google Scholar] [CrossRef]
- Temple, D.; Manteca, X. Animal welfare in extensive production systems is still an area of concern. Front. Sustain. Food Syst. 2020, 4, 545902. [Google Scholar] [CrossRef]
- Marzougui, A.; Mcconnel, C.S.; Adams-Progar, A.; Biggs, T.D.; Ficklin, S.P.; Sankaran, S. Machine learning-derived cumulative health measure for assessing disease impact in dairy cattle. Front. Anim. Sci. 2020, 6, 1532385. [Google Scholar] [CrossRef]
- McArt, J.; Nydam, D.; Overton, M. Hyperketonemia in early lactation dairy cattle: A deterministic estimate of component and total cost per case. J. Dairy Sci. 2015, 98, 2043–2054. [Google Scholar] [CrossRef]
- Asgari, Z.; Sadeghi-Sefidmazgi, A.; Pakdel, A.; Shahinfar, S. Effect of displaced abomasum on milk production, reproductive performance, and culling of Holstein dairy cattle in Iran. Can. J. Anim. Sci. 2024, 105, 1–9. [Google Scholar] [CrossRef]
- Raizman, E.; Santos, J. The effect of left displacement of abomasum corrected by toggle-pin suture on lactation, reproduction, and health of Holstein dairy cows. J. Dairy Sci. 2002, 85, 1157–1164. [Google Scholar] [CrossRef]
- Leblanc, S.; Duffield, T.; Leslie, K.; Bateman, K.; Keefe, G.P.; Walton, J.; Johnson, W. Defining and diagnosing postpartum clinical endometritis and its impact on reproductive performance in dairy cows. J. Dairy Sci. 2002, 85, 2223–2236. [Google Scholar] [CrossRef]
- Mcart, J.A.; Nydam, D.V.; Oetzel, G.R.; Overton, T.R.; Ospina, P.A. Elevated non-esterified fatty acids and β-hydroxybutyrate and their association with transition dairy cow performance. Vet. J. 2013, 198, 560–570. [Google Scholar] [CrossRef] [PubMed]
- Shaver, R.D. Prevention of displaced abomasum. In Proceedings of the Tri-State Dairy Nutrition Conference, Fort Wayne, IN, USA, 17–18 April 2001. [Google Scholar]
- Credille, B.C.; Fubini, S. Left Displacement of the Abomasum. In Comparative Veterinary Anatomy; Academic Press: New York, NY, USA, 2022; pp. 1063–1068. ISBN 9780323910156. [Google Scholar] [CrossRef]
- Martin, W. Left abomasal displacement: An epidemiological study. Can. Vet. J. 1972, 13, 61. [Google Scholar] [PubMed]
- Coppock, C. Displaced abomasum in dairy cattle: Etiological factors. J. Dairy Sci. 1974, 57, 926–933. [Google Scholar] [CrossRef] [PubMed]
- Asgari, Z.; Pakdel, A.; Sadeghi-Sefidmazgi, A. Risk factors and population attributable fractions for displaced abomasum in Iranian dairy cattle: A retrospective analysis of field data. Trop. Anim. Health Prod. 2024, 56, 283. [Google Scholar] [CrossRef]
- Behluli, B.; Musliu, A.; Youngs, C.; Sherifi, K.; Rexhepi, A. Risk factors for occurrence of displaced abomasum and their relation to nutritional management of Holstein dairy cattle. Vet. Arh. 2017, 87, 419–430. [Google Scholar] [CrossRef]
- Sen, I.; Wittek, T.; Guzelbektes, H. Metabolic indicators and risk factors of left displaced abomasum in dairy cattle. Eurasian J. Vet. Sci. 2015, 31, 63–69. [Google Scholar] [CrossRef]
- Constable, P.; Miller, G.; Hoffsis, G.; Hull, B.; Rings, D. Risk factors for abomasal volvulus and left abomasal displacement in cattle. Am. J. Vet. Res. 1992, 53, 1184–1192. [Google Scholar] [CrossRef]
- Cameron, R.; Dyk, P.; Herdt, T.; Kaneene, J.; Miller, R.; Bucholtz, H.; Liesman, J.; Vandehaar, M.; Emery, R. Dry cow diet, management, and energy balance as risk factors for displaced abomasum in high producing dairy herds. J. Dairy Sci. 1998, 81, 132–139. [Google Scholar] [CrossRef]
- Simões, J.; Teixeira, V.; Silva, S.; Gomes, A.; Ventura, A. Relationship between dietary particle size and the incidence of displaced abomasum on Holstein-Friesian dairy farms that feed diets high in maize silage. Livest. Sci. 2013, 157, 478–481. [Google Scholar] [CrossRef]
- Gaddis, K.P.; Cole, J.; Clay, J.; Maltecca, C. Genomic selection for producer-recorded health event data in US dairy cattle. J. Dairy Sci. 2014, 97, 3190–3199. [Google Scholar] [CrossRef]
- Zerbin, I.; Lehner, S.; Distl, O. Genetics of bovine abomasal displacement. Vet. J. 2015, 204, 17–22. [Google Scholar] [CrossRef] [PubMed]
- Zwald, N.; Weigel, K.; Chang, Y.; Welper, R.; Clay, J. Genetic selection for health traits using producer-recorded data. II. Genetic correlations, disease probabilities, and relationships with existing traits. J. Dairy Sci. 2004, 87, 4295–4302. [Google Scholar] [CrossRef] [PubMed]
- Xu, W.; van Knegsel, A.T.; Vervoort, J.J.; Bruckmaier, R.M.; van Hoeij, R.J.; Kemp, B.; Saccenti, E. Prediction of metabolic status of dairy cows in early lactation with on-farm cow data and machine learning algorithms. J. Dairy Sci. 2019, 102, 10186–10201. [Google Scholar] [CrossRef] [PubMed]
- Matzhold, C.; Schodl, K.; Klimek, P.; Steininger, F.; Egger-Danner, C. A key-feature-based clustering approach to assess the impact of technology integration on cow health in Austrian dairy farms. Front. Anim. Sci. 2024, 5, 1421299. [Google Scholar] [CrossRef]
- Shahinfar, S.; Khansefid, M.; Haile-Mariam, M.; Pryce, J. Machine learning approaches for the prediction of lameness in dairy cows. Animal 2021, 15, 100391. [Google Scholar] [CrossRef]
- Ballesteros-Ricaurte, J.A.; Fabregat, R.; Carrillo-Ramos, A.; Parra, C.; Moreno, A. Artificial neural networks to predict the presence of Neosporosis in cattle. MBE 2025, 22, 1140–1158. [Google Scholar] [CrossRef]
- Ushikubo, S.; Kubota, C.; Ohwada, H. The early detection of subclinical ketosis in dairy cows using machine learning methods. In Proceedings of the 9th International Conference on Machine Learning and Computing, Singapore, 24–26 February 2017. [Google Scholar]
- Hosseinabadi, M.R.; Mahdavi, A.H.; Mahnani, A.; Asgari, Z.; Shahinfar, S. Machine learning approaches for the prediction of retained placenta in dairy cows. Theriogenology 2025, 244, 117484. [Google Scholar] [CrossRef]
- Dormann, C.F.; Elith, J.; Bacher, S.; Buchmann, C.; Carl, G.; Carré, G.; Marquéz, J.R.G.; Gruber, B.; Lafourcade, B.; Leitão, P.J. Collinearity: A review of methods to deal with it and a simulation study evaluating their performance. Ecography 2013, 36, 27–46. [Google Scholar] [CrossRef]
- Patrício, D.I.; Rieder, R. Computer vision and artificial intelligence in precision agriculture for grain crops: A systematic review. Comput. Electron. Agric. 2018, 153, 69–81. [Google Scholar] [CrossRef]
- R Core Team. R: A Language and Environment for Statistical Computing; R Foundation for Statistical Computing: Vienna, Austria, 2021. [Google Scholar]
- Shahinfar, S.; Kelman, K.; Kahn, L. Prediction of Sheep Carcass Traits from Early-life Records Using Machine Learning. Comput. Electron. Agric. 2019, 156, 159–177. [Google Scholar] [CrossRef]
- Hempstalk, K.; McParland, S.; Berry, D.P. Machine learning algorithms for the prediction of conception success to a given insemination in lactating dairy cows. J. Dairy Sci. 2015, 98, 5262–5273. [Google Scholar] [CrossRef] [PubMed]
- Valletta, J.J.; Torney, C.; Kings, M.; Thornton, A.; Madden, J. Applications of machine learning in animal behaviour studies. Anim. Behav. 2017, 124, 203–220. [Google Scholar] [CrossRef]
- Chen, C.; Liaw, A.; Breiman, L. Using random forest to learn imbalanced data. Cal. UCB 2004, 110, 24. [Google Scholar]
- Devarriya, D.; Gulati, C.; Mansharamani, V.; Sakalle, A.; Bhardwaj, A. Unbalanced breast cancer data classification using novel fitness functions in genetic programming. Expert Syst. Appl. 2020, 140, 112866. [Google Scholar] [CrossRef]
- Johnson, J.M.; Khoshgoftaar, T.M. Survey on deep learning with class imbalance. J. Big Data 2019, 6, 27. [Google Scholar] [CrossRef]
- Tharwat, A. Classification assessment methods. Appl. Comput. Inform. 2020, 17, 168–192. [Google Scholar] [CrossRef]
- Fawcett, T. An introduction to ROC analysis. Pattern Recognit. Lett. 2006, 27, 861–874. [Google Scholar] [CrossRef]
- He, H.; Garcia, E.A. Learning from imbalanced data. IEEE Trans. Knowl. Data Eng. 2009, 21, 1263–1284. [Google Scholar] [CrossRef]
- Hamel, L. Model Assessment with ROC Curves. In Encyclopedia of Data Warehousing and Mining, 2nd ed.; IGI Global: Hershey, PA, USA, 2009; pp. 1316–1323. [Google Scholar]
- Dascalu, A.; David, E. Skin cancer detection by deep learning and sound analysis algorithms: A prospective clinical study of an elementary dermoscope. eBioMedicine 2019, 43, 107–113. [Google Scholar] [CrossRef]
- Cox, C.R.; Moscardini, E.H.; Cohen, A.S.; Tucker, R.P. Machine learning for suicidology: A practical review of exploratory and hypothesis-driven approaches. Clin. Psychol. Rev. 2020, 82, 101940. [Google Scholar] [CrossRef]
- Miekley, B.; Traulsen, I.; Krieter, J. Detection of mastitis and lameness in dairy cows using wavelet analysis. Livest. Sci. 2012, 148, 227–236. [Google Scholar] [CrossRef]
- Steeneveld, W.; van der Gaag, L.C.; Ouweltjes, W.; Mollenhorst, H.; Hogeveen, H. Discriminating between true-positive and false-positive clinical mastitis alerts from automatic milking systems. J. Dairy Sci. 2010, 93, 2559–2568. [Google Scholar] [CrossRef] [PubMed]
- Post, C.; Rietz, C.; Büscher, W.; Müller, U. The importance of low daily risk for the prediction of treatment events of individual dairy cows with sensor systems. Sensors 2021, 21, 1389. [Google Scholar] [CrossRef] [PubMed]
- Bekkar, M.; Djemaa, H.K.; Alitouche, T.A. Evaluation measures for models assessment over imbalanced data sets. J. Inf. Sci. Eng. 2013, 3, 27–38. [Google Scholar]
- Powers, R.; Goldszmidt, M.; Cohen, I. Short term performance forecasting in enterprise systems. In Proceedings of the Eleventh ACM SIGKDD International Conference on Knowledge Discovery in Data Mining, Chicago, IL, USA, 21–24 August 2005. [Google Scholar]
- Akosa, J.S. Predictive Accuracy: A Misleading Performance Measure for Highly Imbalanced Data. In Proceedings of the SAS Global Forum, Cary, NC, USA, 2–5 April 2017. [Google Scholar]
- Satoła, A.; Bauer, E.A. Predicting subclinical ketosis in dairy cows using machine learning techniques. Animals 2021, 11, 2131. [Google Scholar] [CrossRef]
- Zecconi, A.; Zaghen, F.; Meroni, G.; Sommariva, F.; Ferrari, S.; Sora, V. Machine Learning Approach for Early Lactation Mastitis Diagnosis Using Total and Differential Somatic Cell Counts. Animals 2025, 15, 1125. [Google Scholar] [CrossRef]
- Contla Hernández, B.; Lopez-Villalobos, N.; Vignes, M. Identifying health status in grazing dairy cows from milk mid-infrared spectroscopy by using machine learning methods. Animals 2021, 11, 2154. [Google Scholar] [CrossRef]
- Ebrahimi, M.; Mohammadi-Dehcheshmeh, M.; Ebrahimie, E.; Petrovski, K.R. Comprehensive analysis of machine learning models for prediction of sub-clinical mastitis: Deep Learning and Gradient-Boosted Trees outperform other models. Comput. Biol. Med. 2019, 114, 103456. [Google Scholar] [CrossRef]
- Shahinfar, S.; Kelman, K.; Kahn, L. Machine Learning approach for early prediction of adult wool growth and quality in Australian Merion sheep. Comput. Electron. Agric. 2018, 148, 72–81. [Google Scholar] [CrossRef]
- Ding, C.; Wang, D.; Ma, X.; Li, H. Predicting short-term subway ridership and prioritizing its influential factors using gradient boosting decision trees. Sustainability 2016, 8, 1100. [Google Scholar] [CrossRef]
- Matsuki, K.; Kuperman, V.; Van Dyke, J.A. The Random Forests statistical technique: An examination of its value for the study of reading. Sci. Stud. Read. 2016, 20, 20–33. [Google Scholar] [CrossRef] [PubMed]
- Breiman, L. Random forests. Mach. Learn. 2001, 45, 5–32. [Google Scholar] [CrossRef]
- Van Winden, S.; Kuiper, R. Left displacement of the abomasum in dairy cattle: Recent developments in epidemiological and etiological aspects. Vet. Res. 2003, 34, 47–56. [Google Scholar] [CrossRef] [PubMed]
- Niederberger, M.D.; Hirsbrunner, G.; Steiner, A.; Brechbühl, M.; Meylan, M. In vitro effects of bethanechol on abomasal and duodenal smooth muscle preparations from dairy cows with left displacement of the abomasum and from healthy dairy cows. Vet. J. 2010, 184, 88–94. [Google Scholar] [CrossRef]
- Jacobsen, K.L. Displaced abomasa and thin cows in a component-fed dairy herd. Compendium. Food Anim. 1995, 17, 21–27. [Google Scholar]
- Shaver, R. Nutritional risk factors in the etiology of left displaced abomasum in dairy cows: A review. J. Dairy Sci. 1997, 80, 2449–2453. [Google Scholar] [CrossRef]
- Song, Y.; Loor, J.J.; Zhao, C.; Huang, D.; Du, X.; Li, X.; Wang, Z.; Liu, G.; Li, X. Potential hemo-biological identification markers to the left displaced abomasum in dairy cows. BMC Vet. Res. 2020, 16, 470. [Google Scholar] [CrossRef]
- Rutten, C.; Velthuis, A.; Steeneveld, W.; Hogeveen, H. Invited review: Sensors to support health management on dairy farms. J. Dairy Sci. 2013, 96, 1928–1952. [Google Scholar] [CrossRef]
- Grummer, R.R. Etiology of lipid-related metabolic disorders in periparturient dairy cows. J. Dairy Sci. 1993, 76, 3882–3896. [Google Scholar] [CrossRef]
- Dewhurst, R.J.; Moorby, J.; Dhanoa, M.; Evans, R.T.; Fisher, W.J. Effects of altering energy and protein supply to dairy cows during the dry period. 1. Intake, body condition, and milk production. J. Dairy Sci. 2000, 83, 1782–1794. [Google Scholar] [CrossRef]
- Liang, D.; Arnold, L.; Stowe, C.; Harmon, R.; Bewleys, J. Estimating US dairy clinical disease costs with a stochastic simulation model. J. Dairy Sci. 2017, 100, 1472–1486. [Google Scholar] [CrossRef]
- Patelli, T.H.C.; Souza, F.A.A.; Rosa, F.; Barreiros, T.R.R.; Marques, L.C. Economic impact of displaced abomasum on a dairy farm in Carambeí, Paraná. Ars Vet. 2012, 29, 8–12. [Google Scholar] [CrossRef]

| Service Sire PTAs 1 | Parity > 6 | AFC | PL | Milk | Protein | Fat | DPL | Calf Weight | No Milk Record 2 |
|---|---|---|---|---|---|---|---|---|---|
| 1978 | 2055 | 244 | 117 | 124 | 1290 | 503 | 533 | 816 | 582 |
| No. | Features | Type | Level | Minimum (%) 3 | Maximum (%) 4 | Mean | SD |
|---|---|---|---|---|---|---|---|
| Herd and cow information 1 | |||||||
| 1 | Herd | Nominal | 7 | 1 (15%) | 7 (7%) | - | - |
| 2 | Calving years | Nominal | 11 | 2010 (3%) | 2020 (16%) | - | - |
| 3 | Parity | Nominal | 6 | 1 (34%) | 6 (5%) | - | - |
| 4 | month of the milk record | Nominal | 12 | 1 (8.6%) | 12 (9.4%) | - | - |
| 5 | Calving season | Nominal | 4 | 1 (22%) | 4 (24%) | - | - |
| 6 | Milk yield | Numeric | - | 3.0 | 78.0 | 40.9 | 12.3 |
| 7 | Milk fat yield | Numeric | - | 0.29 | 7.2 | 3.7 | 1.1 |
| 8 | Milk protein yield | Numeric | - | 1.1 | 5.1 | 3.0 | 0.4 |
| 9 | Age at first calving | Numeric | - | 578 | 1153 | 720 | 55 |
| 10 | Pregnancy | Numeric | - | 240.0 | 298.0 | 275.0 | 5.1 |
| 11 | Calf weight at birth | Numeric | - | 20 | 53 | 40.0 | 6.2 |
| 12 | Dry period length | Numeric | - | 0 | 160 | 41.1 | 33.2 |
| 13 | Ketosis | Binary | 2 | 0 (98%) | 1 (2%) | - | - |
| 14 | Mastitis | Binary | 2 | 0 (83%) | 1 (17%) | - | - |
| 15 | Metritis | Binary | 2 | 0 (86%) | 1 (14%) | - | - |
| 16 | Retained placenta | Binary | 2 | 0 (92%) | 1 (8%) | - | - |
| 17 | Milk fever | Binary | 2 | 0 (98%) | 1 (2%) | - | - |
| 18 | Dystocia | Binary | 2 | 1 (96%) | 2 (4%) | - | - |
| 19 | Twinning | Binary | 2 | 1 (97%) | 2 (3%) | - | - |
| 20 | Calf sex | Binary | 2 | 1 (51%) | 2 (49%) | - | - |
| Service Sire PTAs 2 | |||||||
| 21 | PTA-DA | Numeric | - | −2.9 | 1.4 | −0.02 | 0.5 |
| 22 | PTA-SSB | Numeric | - | 3.8 | 10.2 | 6.1 | 0.8 |
| 23 | PTA-DSB | Numeric | - | 2.6 | 16.7 | 6.5 | 1.7 |
| 24 | PTA-SCE | Numeric | - | 1.0 | 6.6 | 2.2 | 0.5 |
| 25 | PTA-DCE | Numeric | - | 1.0 | 5.5 | 2.6 | 0.6 |
| 26 | PTA-DPR | Numeric | - | −7.5 | 6.9 | −0.7 | 2.1 |
| 27 | PTA-PL | Numeric | - | −7.6 | 6.3 | −0.2 | 0.2 |
| 28 | PTA-Ket | Numeric | - | −3.7 | 3.0 | −0.1 | 2.4 |
| 29 | PTA-fat% | Numeric | - | −0.3 | 0.4 | −0.07 | 0.1 |
| 30 | PTA-SCS | Numeric | - | 2.4 | 3.6 | 3.0 | 1.0 |
| 31 | PTA-protein% | Numeric | - | −0.2 | 0.2 | −0.3 | 0.04 |
| Level | 1 | 2 | 3 | 4 | 5 | 6 | 7 | 8 | 9 | 10 | 11 | 12 | |
|---|---|---|---|---|---|---|---|---|---|---|---|---|---|
| Features | |||||||||||||
| Herd | 15% | 20% | 10% | 15% | 18% | 15% | 7% | - | - | - | - | - | |
| Calving year | 3% | 2% | 3% | 4% | 5% | 7% | 12% | 14% | 15% | 17% | 16% | - | |
| month of the milk record | 8.6% | 7.3% | 7.7% | 7.5% | 7.5% | 7.0% | 8.0% | 10.0% | 9.0% | 9.0% | 8.0% | 9.4% | |
| Calving season | 22% | 27% | 27% | 24% | - | - | - | - | - | - | - | - | |
| Parity | 34% | 26% | 18% | 11% | 6% | 5% | - | - | - | - | - | - | |
| Algorithm 1 | ACC 2 | Balanced ACC | PPV 3 | TPR 4 | TNR 5 | F2 | AUPRC | AUROC |
|---|---|---|---|---|---|---|---|---|
| Testing dataset | ||||||||
| LR | 0.68 (±0.00) a | 0.66 (±0.00) b | 0.09 (±0.00) b | 0.65 (±0.01) b | 0.68 (±0.00) b | 0.30 (±0.00) b | 0.15 (±0.00) b | 0.73 (±0.00) c |
| NB | 0.62 (±0.02) b | 0.64 (±0.00) c | 0.07 (±0.00) c | 0.66 (±0.01) b | 0.62 (±0.02) b | 0.27 (±0.00) c | 0.10 (±0.00) c | 0.69 (±0.00) d |
| DT | 0.63 (±0.05) b | 0.64 (±0.00) c | 0.08 (±0.00) c | 0.66 (±0.07) b | 0.63 (±0.06) b | 0.28 (±0.00) c | 0.10 (±0.00) c | 0.70 (±0.00) d |
| RF | 0.64 (±0.01) b | 0.69 (±0.00) a | 0.09 (±0.00) b | 0.75 (±0.01) a | 0.63 (±0.01) a | 0.32 (±0.00) a | 0.17 (±0.00) a | 0.76 (±0.00) a |
| GBM | 0.69 (±0.01) a | 0.68 (±0.00) b | 0.10 (±0.00) a | 0.70 (±0.00) b | 0.67 (±0.01) a | 0.32 (±0.00) a | 0.17 (±0.00) a | 0.75 (±0.00) b |
| Training dataset | ||||||||
| LR | 0.67 (±0.00) | 0.67 (±0.00) | 0.68 (±0.00) | 0.67 (±0.00) | 0.68 (±0.00) | 0.67 (±0.00) | 0.73 (±0.00) | 0.74 (±0.00) |
| NB | 0.64 (±0.00) | 0.64 (±0.00) | 0.63 (±0.01) | 0.67 (±0.01) | 0.61 (±0.02) | 0.66 (±0.01) | 0.67 (±0.00) | 0.69 (±0.00) |
| DT | 0.68 (±0.01) | 0.68 (±0.01) | 0.67 (±0.01) | 0.70 (±0.06) | 0.66 (±0.05) | 0.69 (±0.05) | 0.72 (±0.03) | 0.74 (±0.01) |
| RF | 0.68 (±0.00) | 0.68 (±0.00) | 0.66 (±0.00) | 0.74 (±0.01) | 0.62 (±0.01) | 0.72 (±0.01) | 0.73 (±0.00) | 0.75 (±0.00) |
| GBM | 0.72 (±0.01) | 0.72 (±0.01) | 0.72 (±0.00) | 0.74 (±0.00) | 0.71 (±0.01) | 0.73 (±0.00) | 0.80 (±0.00) | 0.80 (±0.01) |
| Number of Cows | Predicted Trait | Accuracy | Algorithm with Best Performance | Country | Year |
|---|---|---|---|---|---|
| 2535 | Lameness | 0.83 | Naïve Bayes | Australia | 2021 [28] |
| 1000 | Neosporosis | 0.82 | Neural Network | Colombia | 2025 [29] |
| 882 | Ketosis | 0.72 | Logistic Regression | Poland | 2021 [53] |
| 363,945 | Retained Placenta | 0.78 | XGBoost and Random Forest | Iran | 2025 [31] |
| 14,755 | Udder Health Status | ≥0.75 | Neural Network and Random Forest | Italy | 2021 [54] |
| 1909 | Health Status | 0.95 | Neural Network | New Zealand | 2021 [55] |
| 297,004 | Subclinical Mastitis | ≥0.83 | GBM and Deep Learning | New Zealand | 2019 [56] |
Disclaimer/Publisher’s Note: The statements, opinions and data contained in all publications are solely those of the individual author(s) and contributor(s) and not of MDPI and/or the editor(s). MDPI and/or the editor(s) disclaim responsibility for any injury to people or property resulting from any ideas, methods, instructions or products referred to in the content. |
© 2025 by the authors. Licensee MDPI, Basel, Switzerland. This article is an open access article distributed under the terms and conditions of the Creative Commons Attribution (CC BY) license (https://creativecommons.org/licenses/by/4.0/).
Share and Cite
Asgari, Z.; Sadeghi-Sefidmazgi, A.; Pakdel, A.; Shahinfar, S. Machine Learning Approaches for the Prediction of Displaced Abomasum in Dairy Cows Using a Highly Imbalanced Dataset. Animals 2025, 15, 1833. https://doi.org/10.3390/ani15131833
Asgari Z, Sadeghi-Sefidmazgi A, Pakdel A, Shahinfar S. Machine Learning Approaches for the Prediction of Displaced Abomasum in Dairy Cows Using a Highly Imbalanced Dataset. Animals. 2025; 15(13):1833. https://doi.org/10.3390/ani15131833
Chicago/Turabian StyleAsgari, Zeinab, Ali Sadeghi-Sefidmazgi, Abbas Pakdel, and Saleh Shahinfar. 2025. "Machine Learning Approaches for the Prediction of Displaced Abomasum in Dairy Cows Using a Highly Imbalanced Dataset" Animals 15, no. 13: 1833. https://doi.org/10.3390/ani15131833
APA StyleAsgari, Z., Sadeghi-Sefidmazgi, A., Pakdel, A., & Shahinfar, S. (2025). Machine Learning Approaches for the Prediction of Displaced Abomasum in Dairy Cows Using a Highly Imbalanced Dataset. Animals, 15(13), 1833. https://doi.org/10.3390/ani15131833