
Canonical Discriminant Mapping of Origins in Andalusian Black Cattle: Inbreeding and Coancestry Decomposition via Mendelian Sampling Variances and Nodal Ancestor Contributions

 , , , and
Simple Summary
Abstract
1. Introduction
2. Materials and Methods
2.1. Genetic Analyses
2.1.1. Pedigree Database and Software Tool
2.1.2. Individual Rate of Coancestry (), and Assortative Mating Degree (α)
2.1.3. Path-Counting and Upward-Exploration Methods
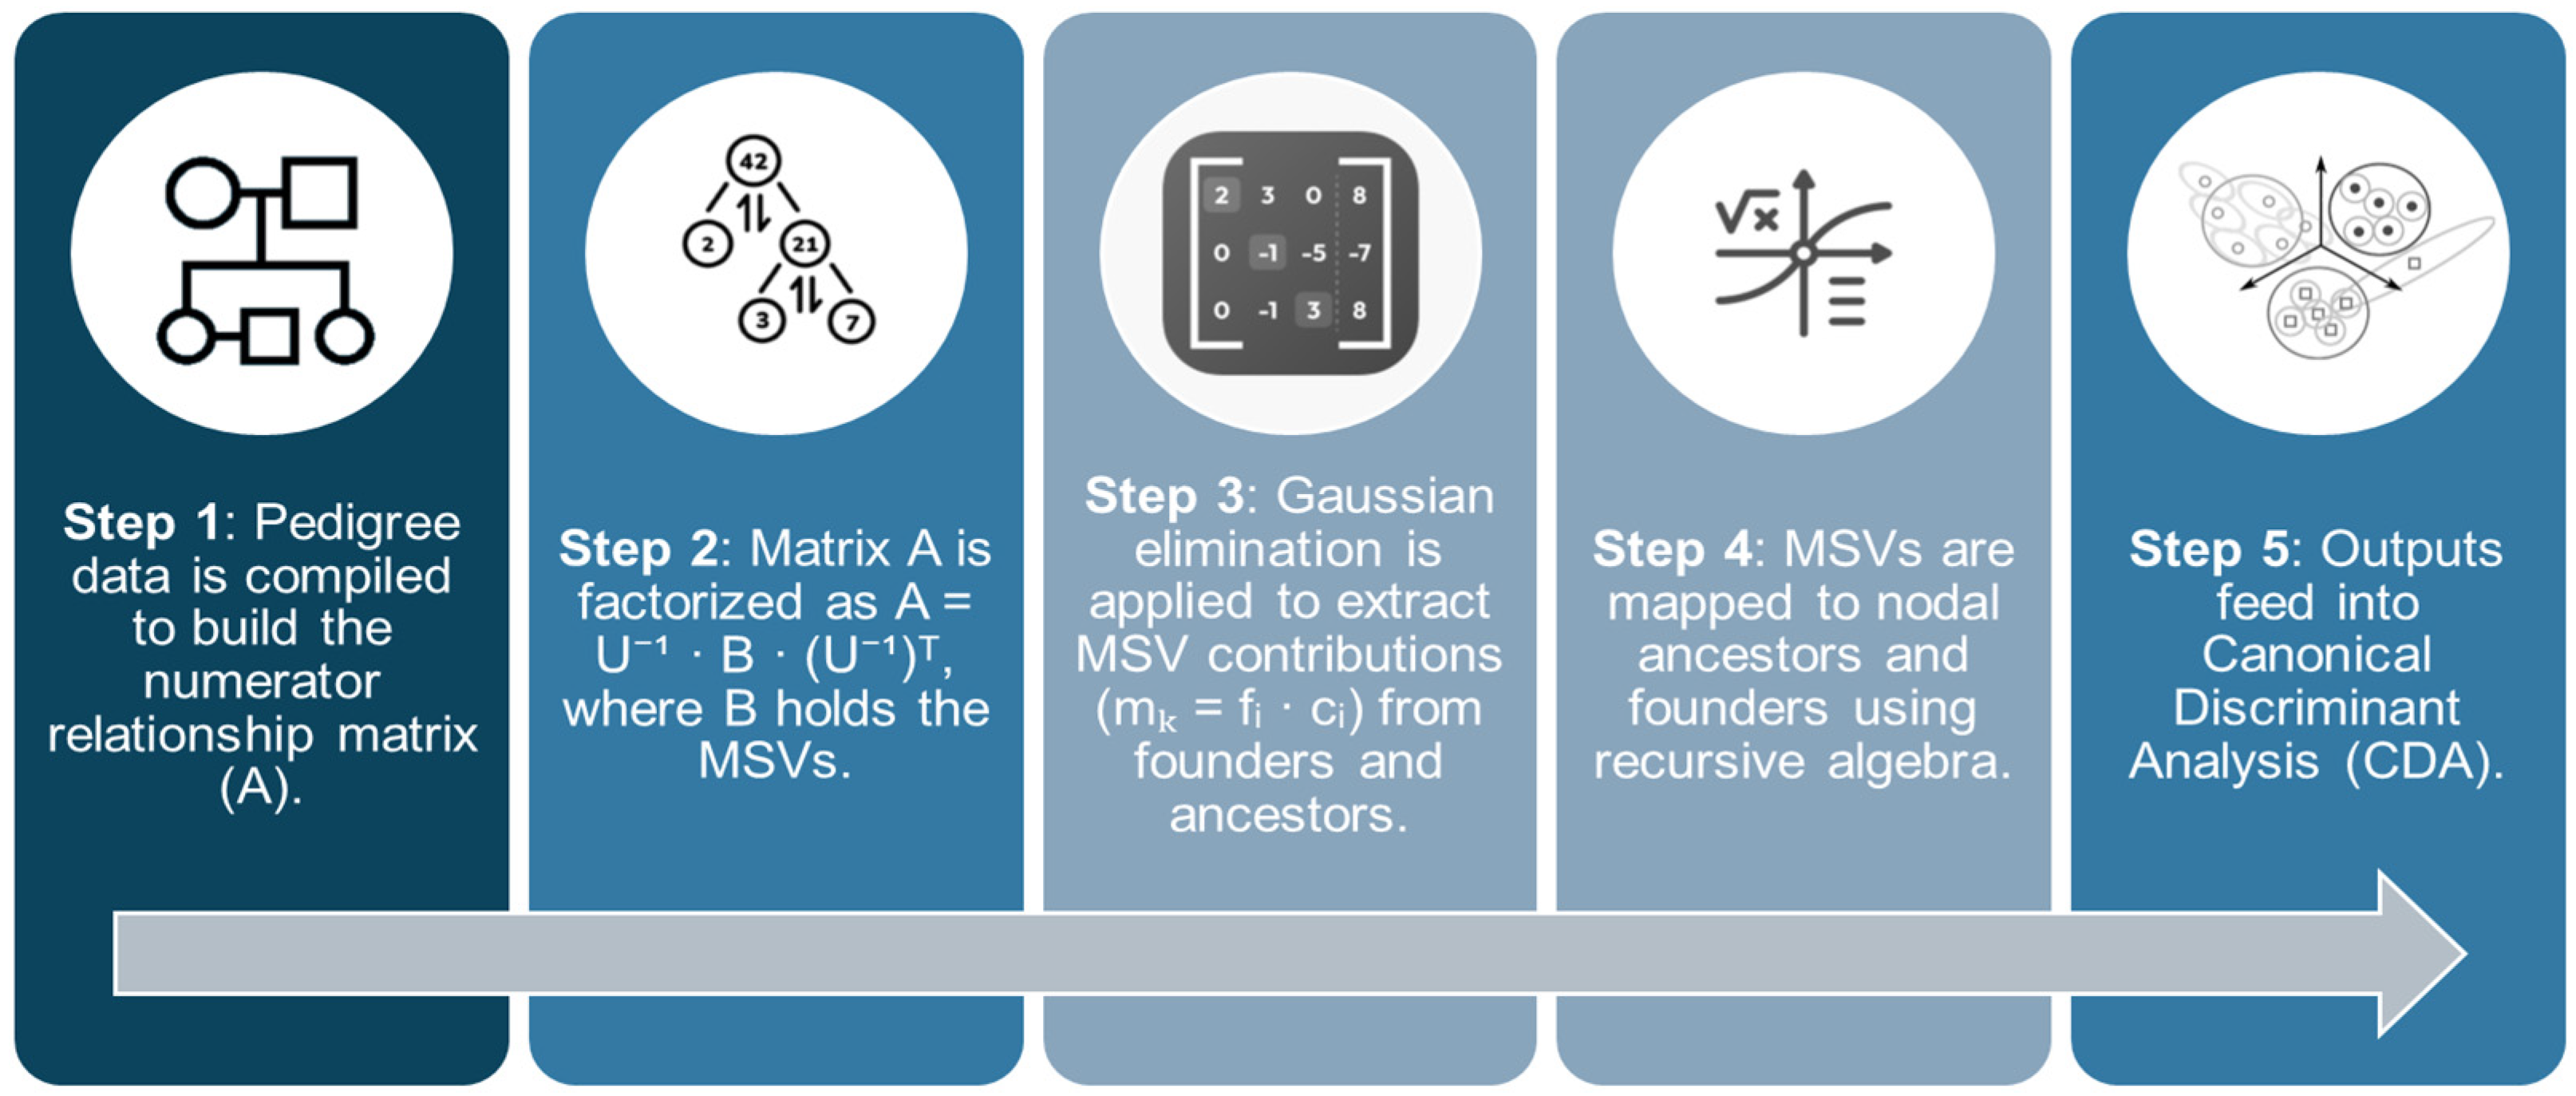
2.1.4. Decomposing F, and into Contributions of MSVs
2.1.5. Linking Contributions of NCAs and MSVs
2.2. Statistical Analysis
2.2.1. Canonical Discriminant Analysis (CDA)
CDA Methodology

| Independent Variable | Definition | Source |
|---|---|---|
| Contribution of nodal ancestors through inbreeding loops | The proportion of an individual’s inbreeding coefficient that is attributable to nodal ancestors via closed inbreeding paths (inbreeding loops). | [17] |
| Contributions of genes of founders to the average inbreeding coefficient | The percentage of the population’s average inbreeding coefficient is derived from the genetic input of the original founders. | [17] |
| Contributions of genes of founders to the average coancestry | The percentage of average coancestry between individuals in the population that can be traced back to the genetic contributions of the founders. | [17] |
| Coancestry (C) | The probability that two alleles, one from each of two individuals, are identical by descent (IBD). | [16] |
| Non-Random Mating (α) | A mating pattern where individuals do not pair randomly, often based on relatedness, phenotype, or genotype, which affects genetic structure and inbreeding in a population. | [16] |
| Dependent Variables | Definition | Source |
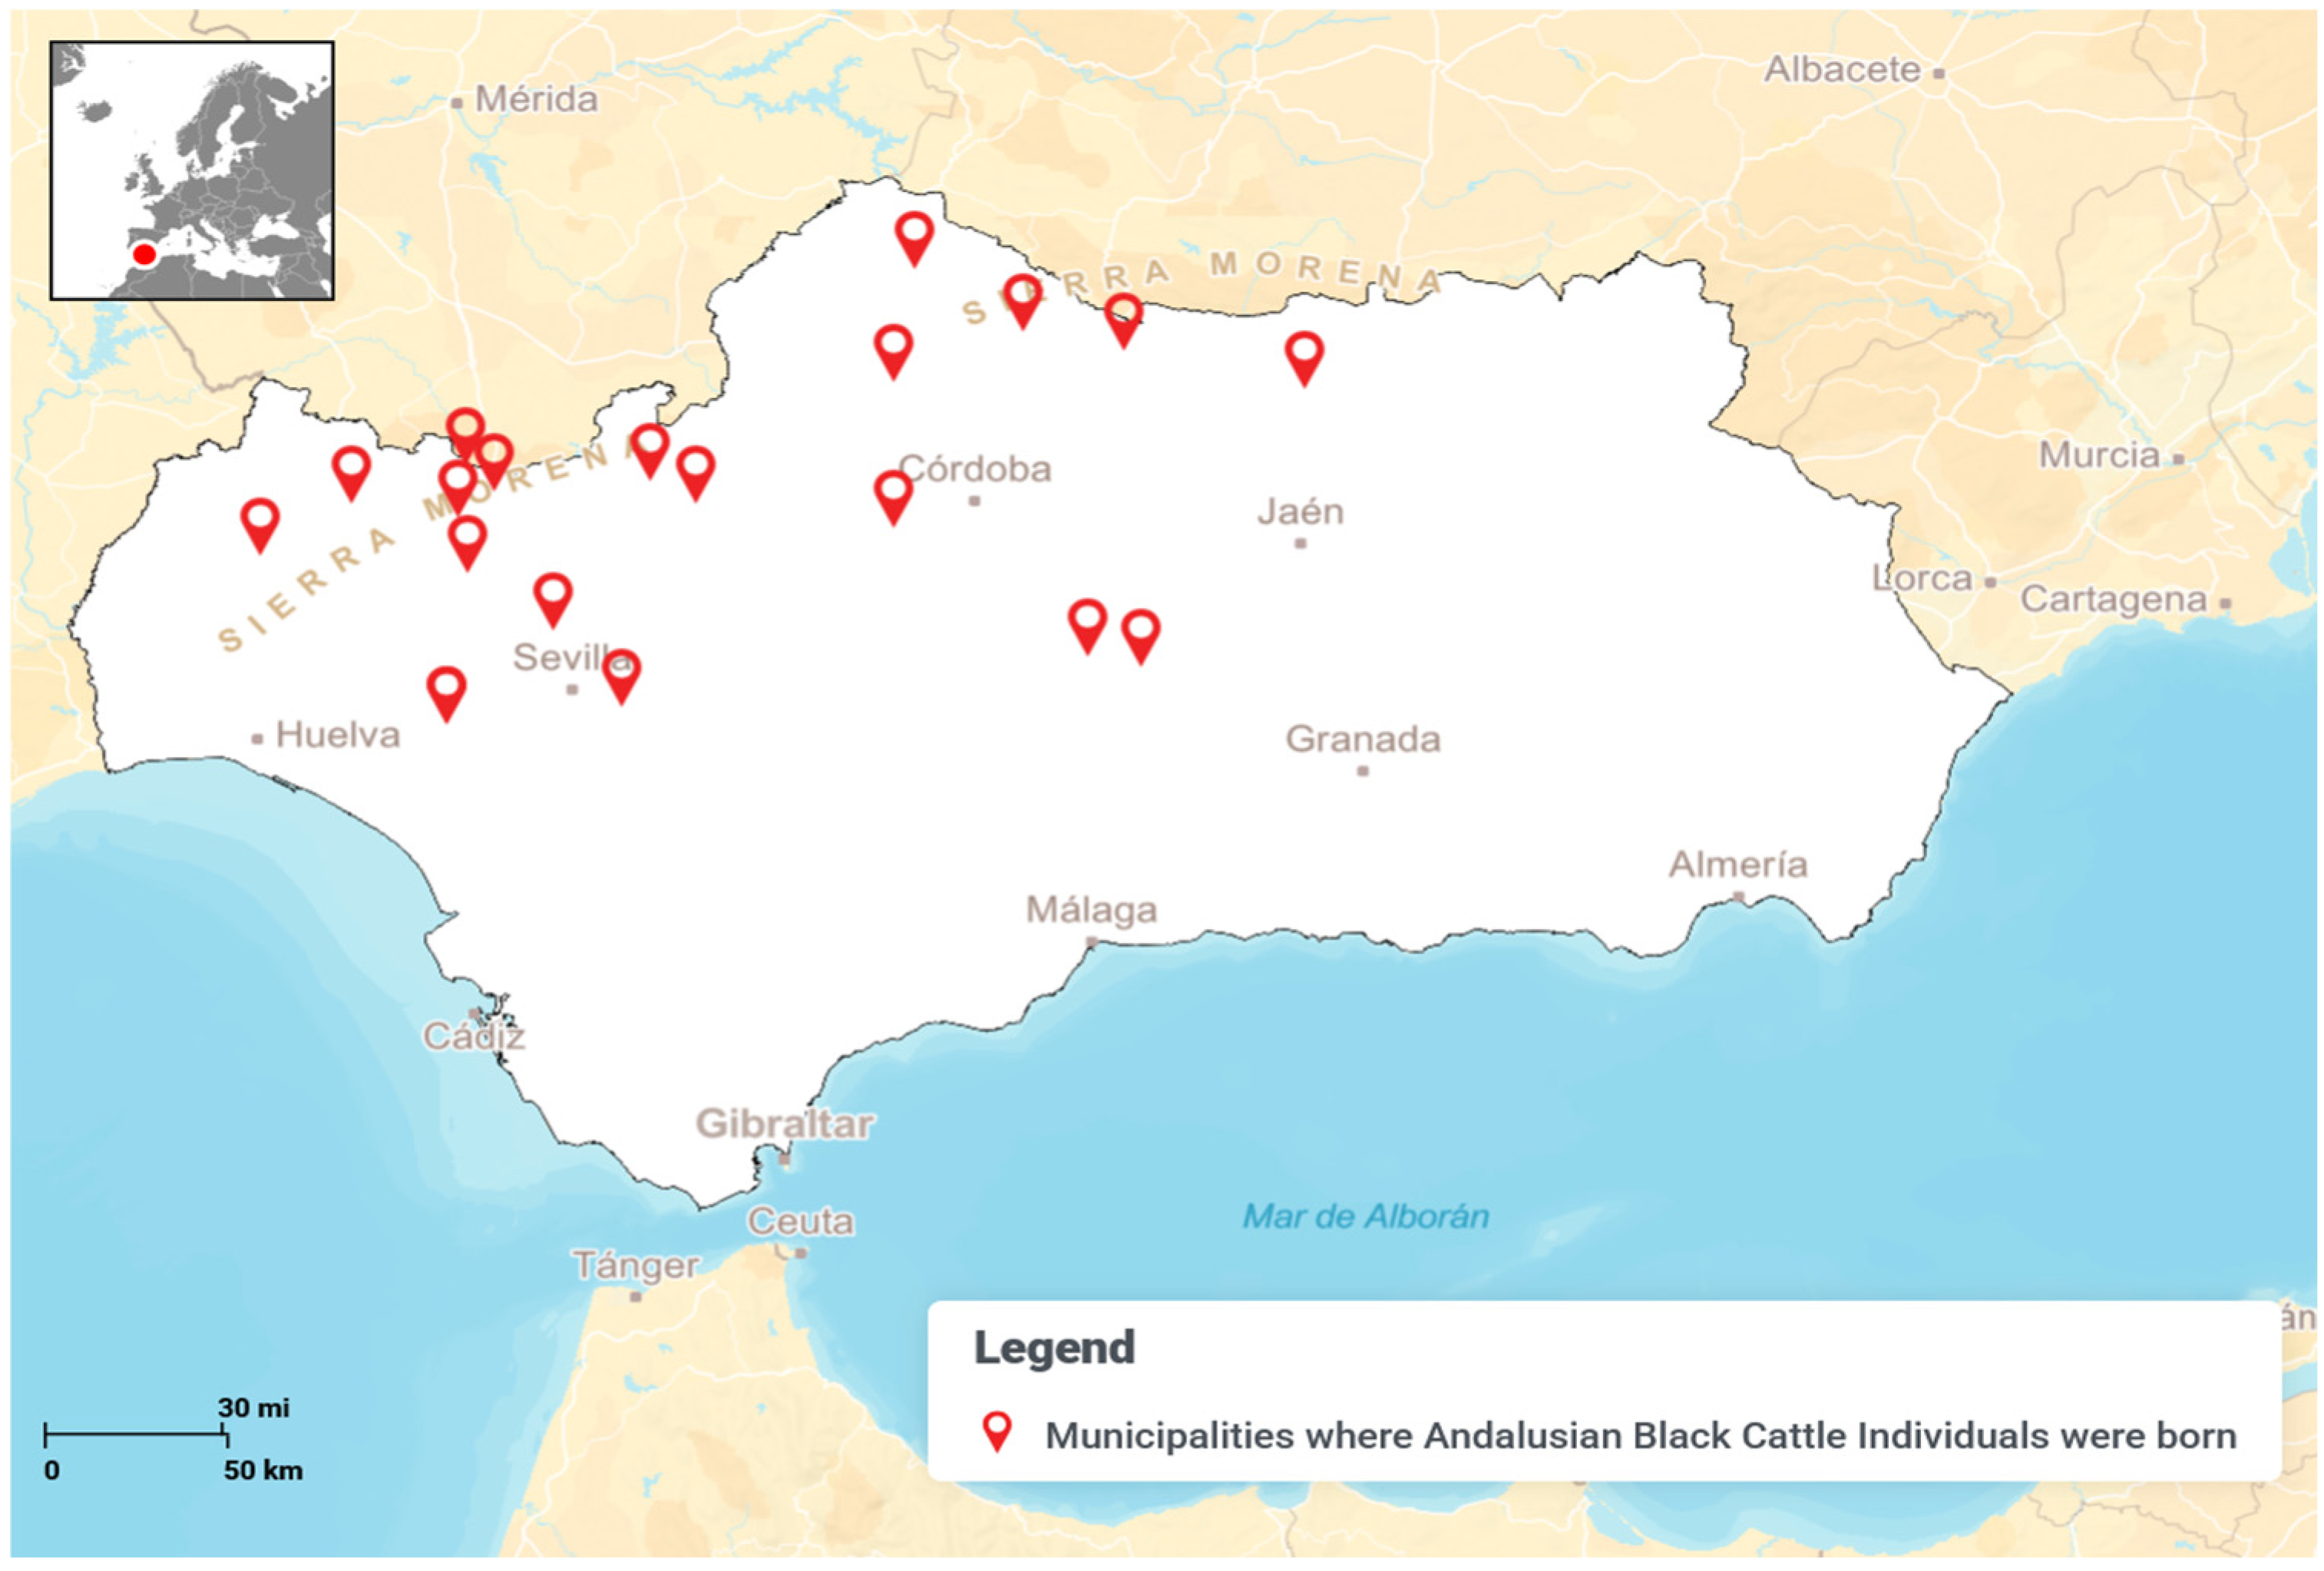
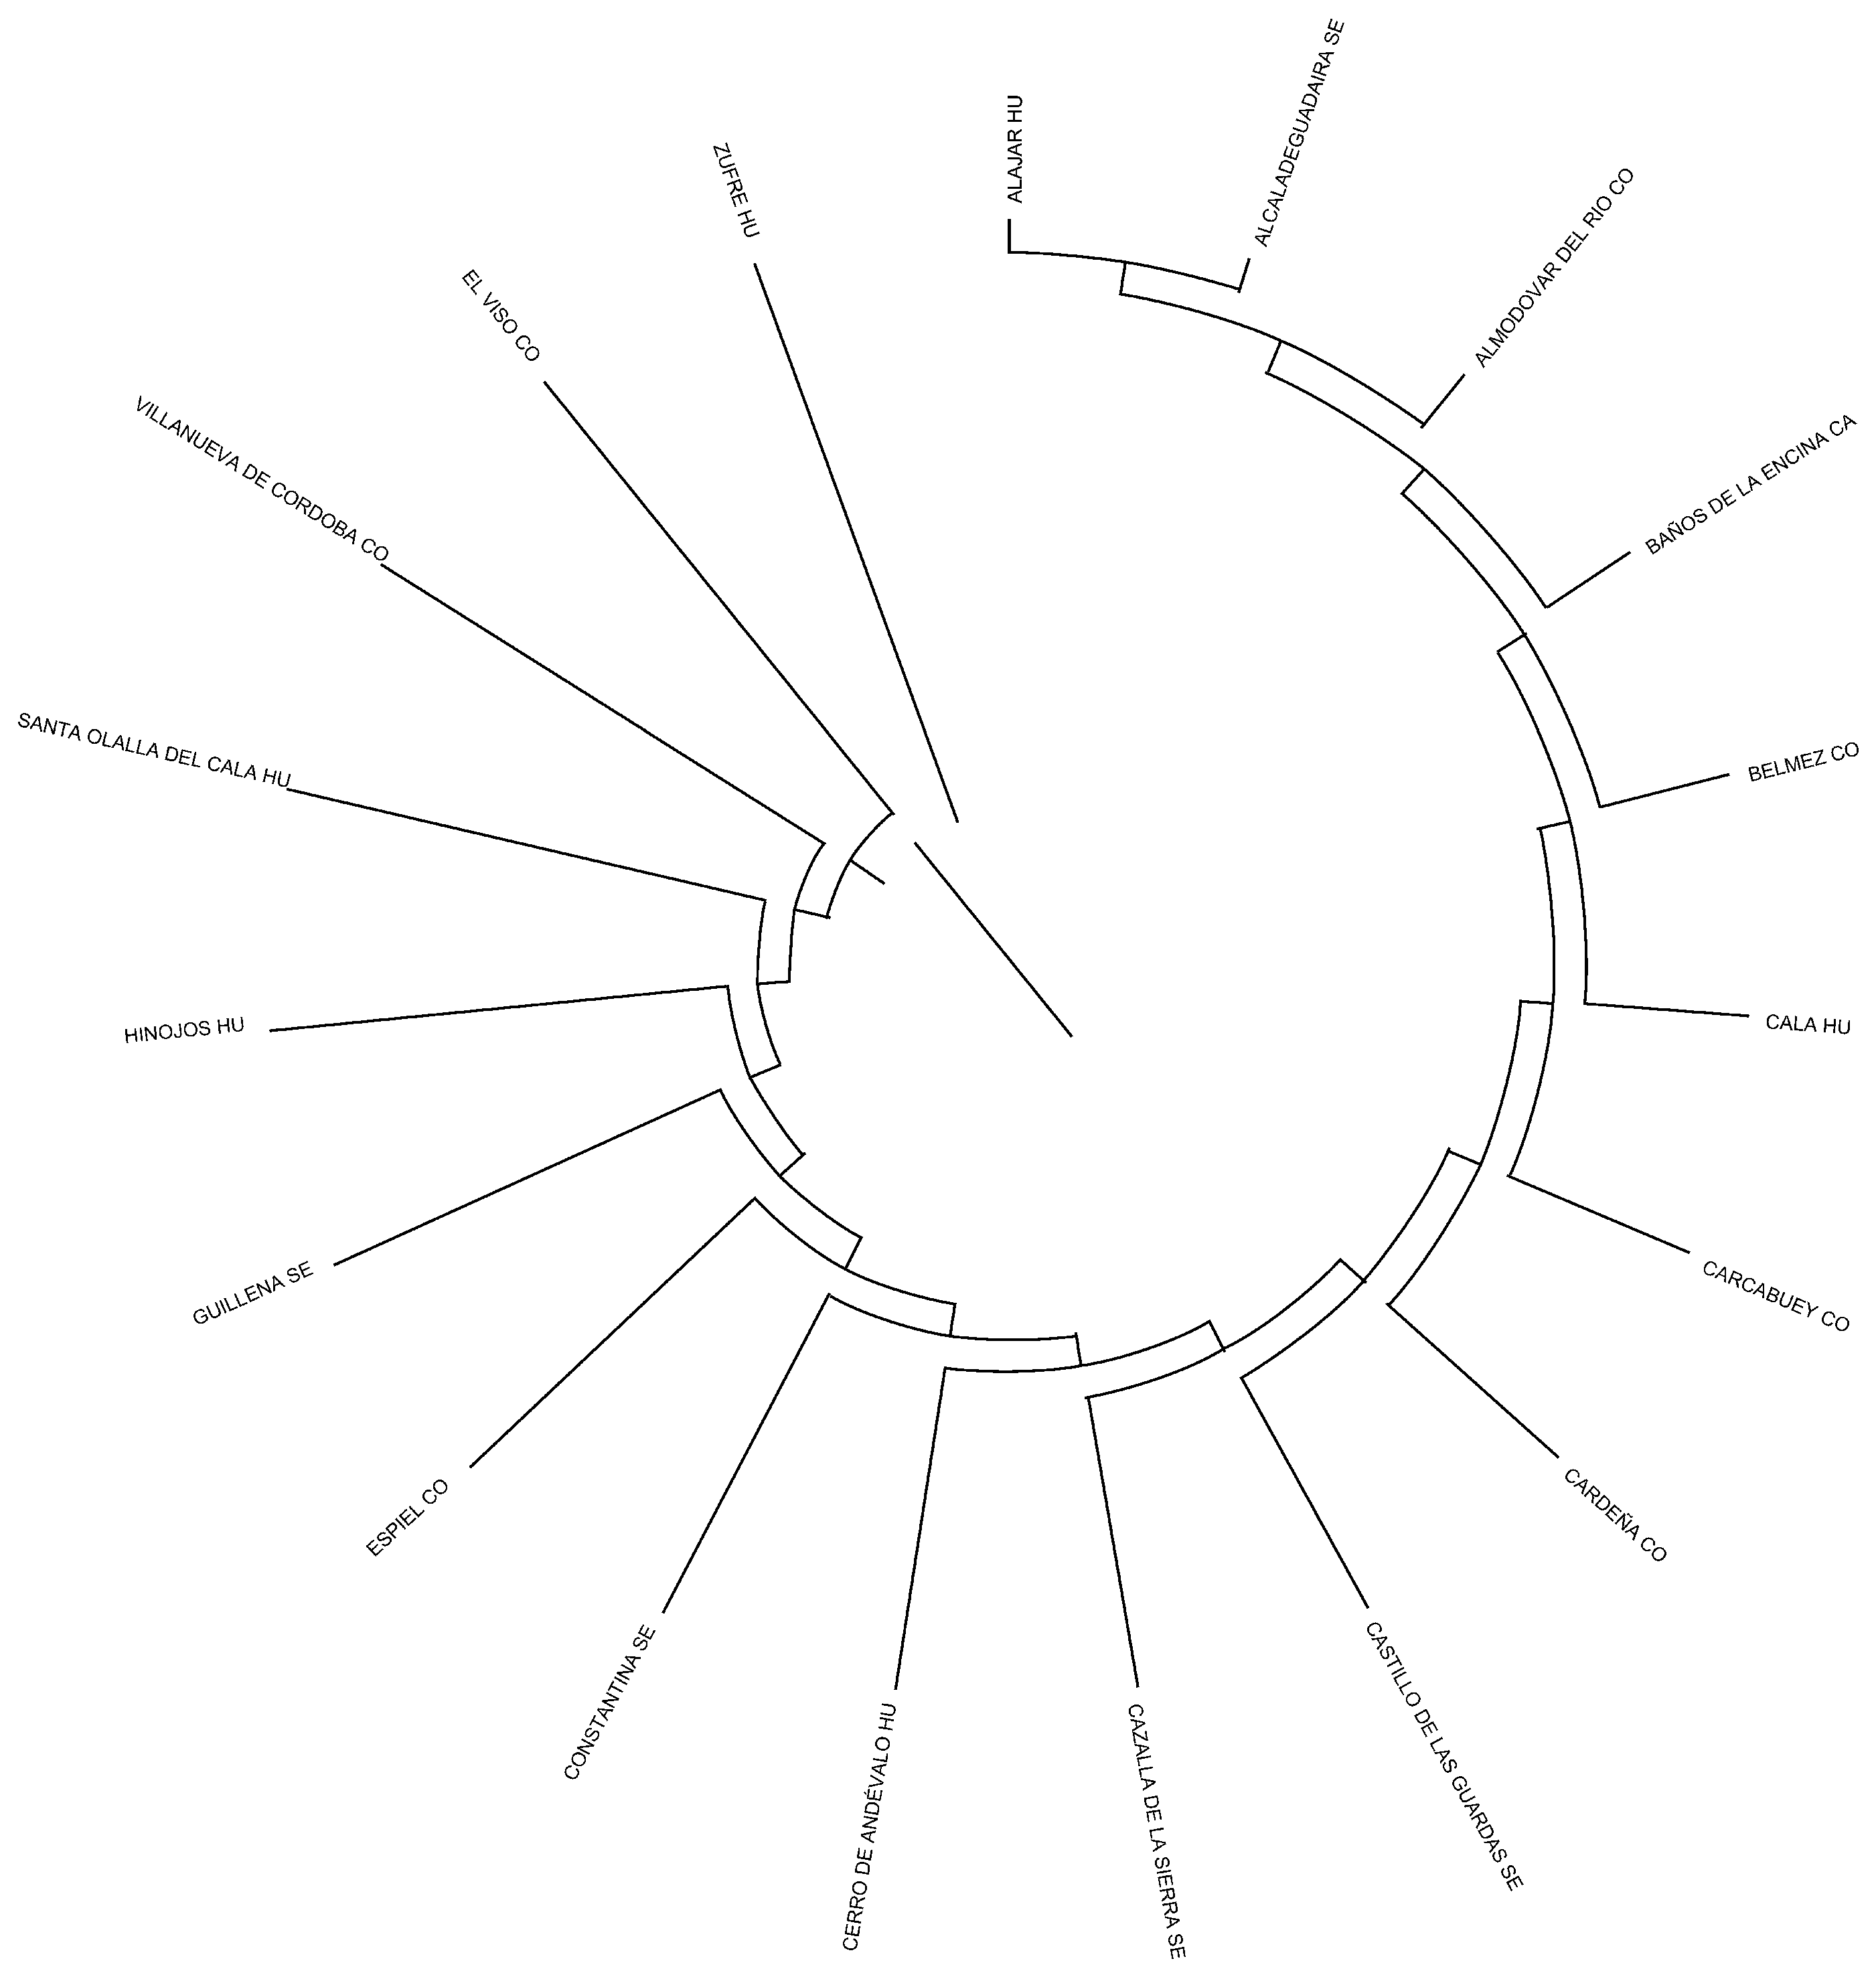
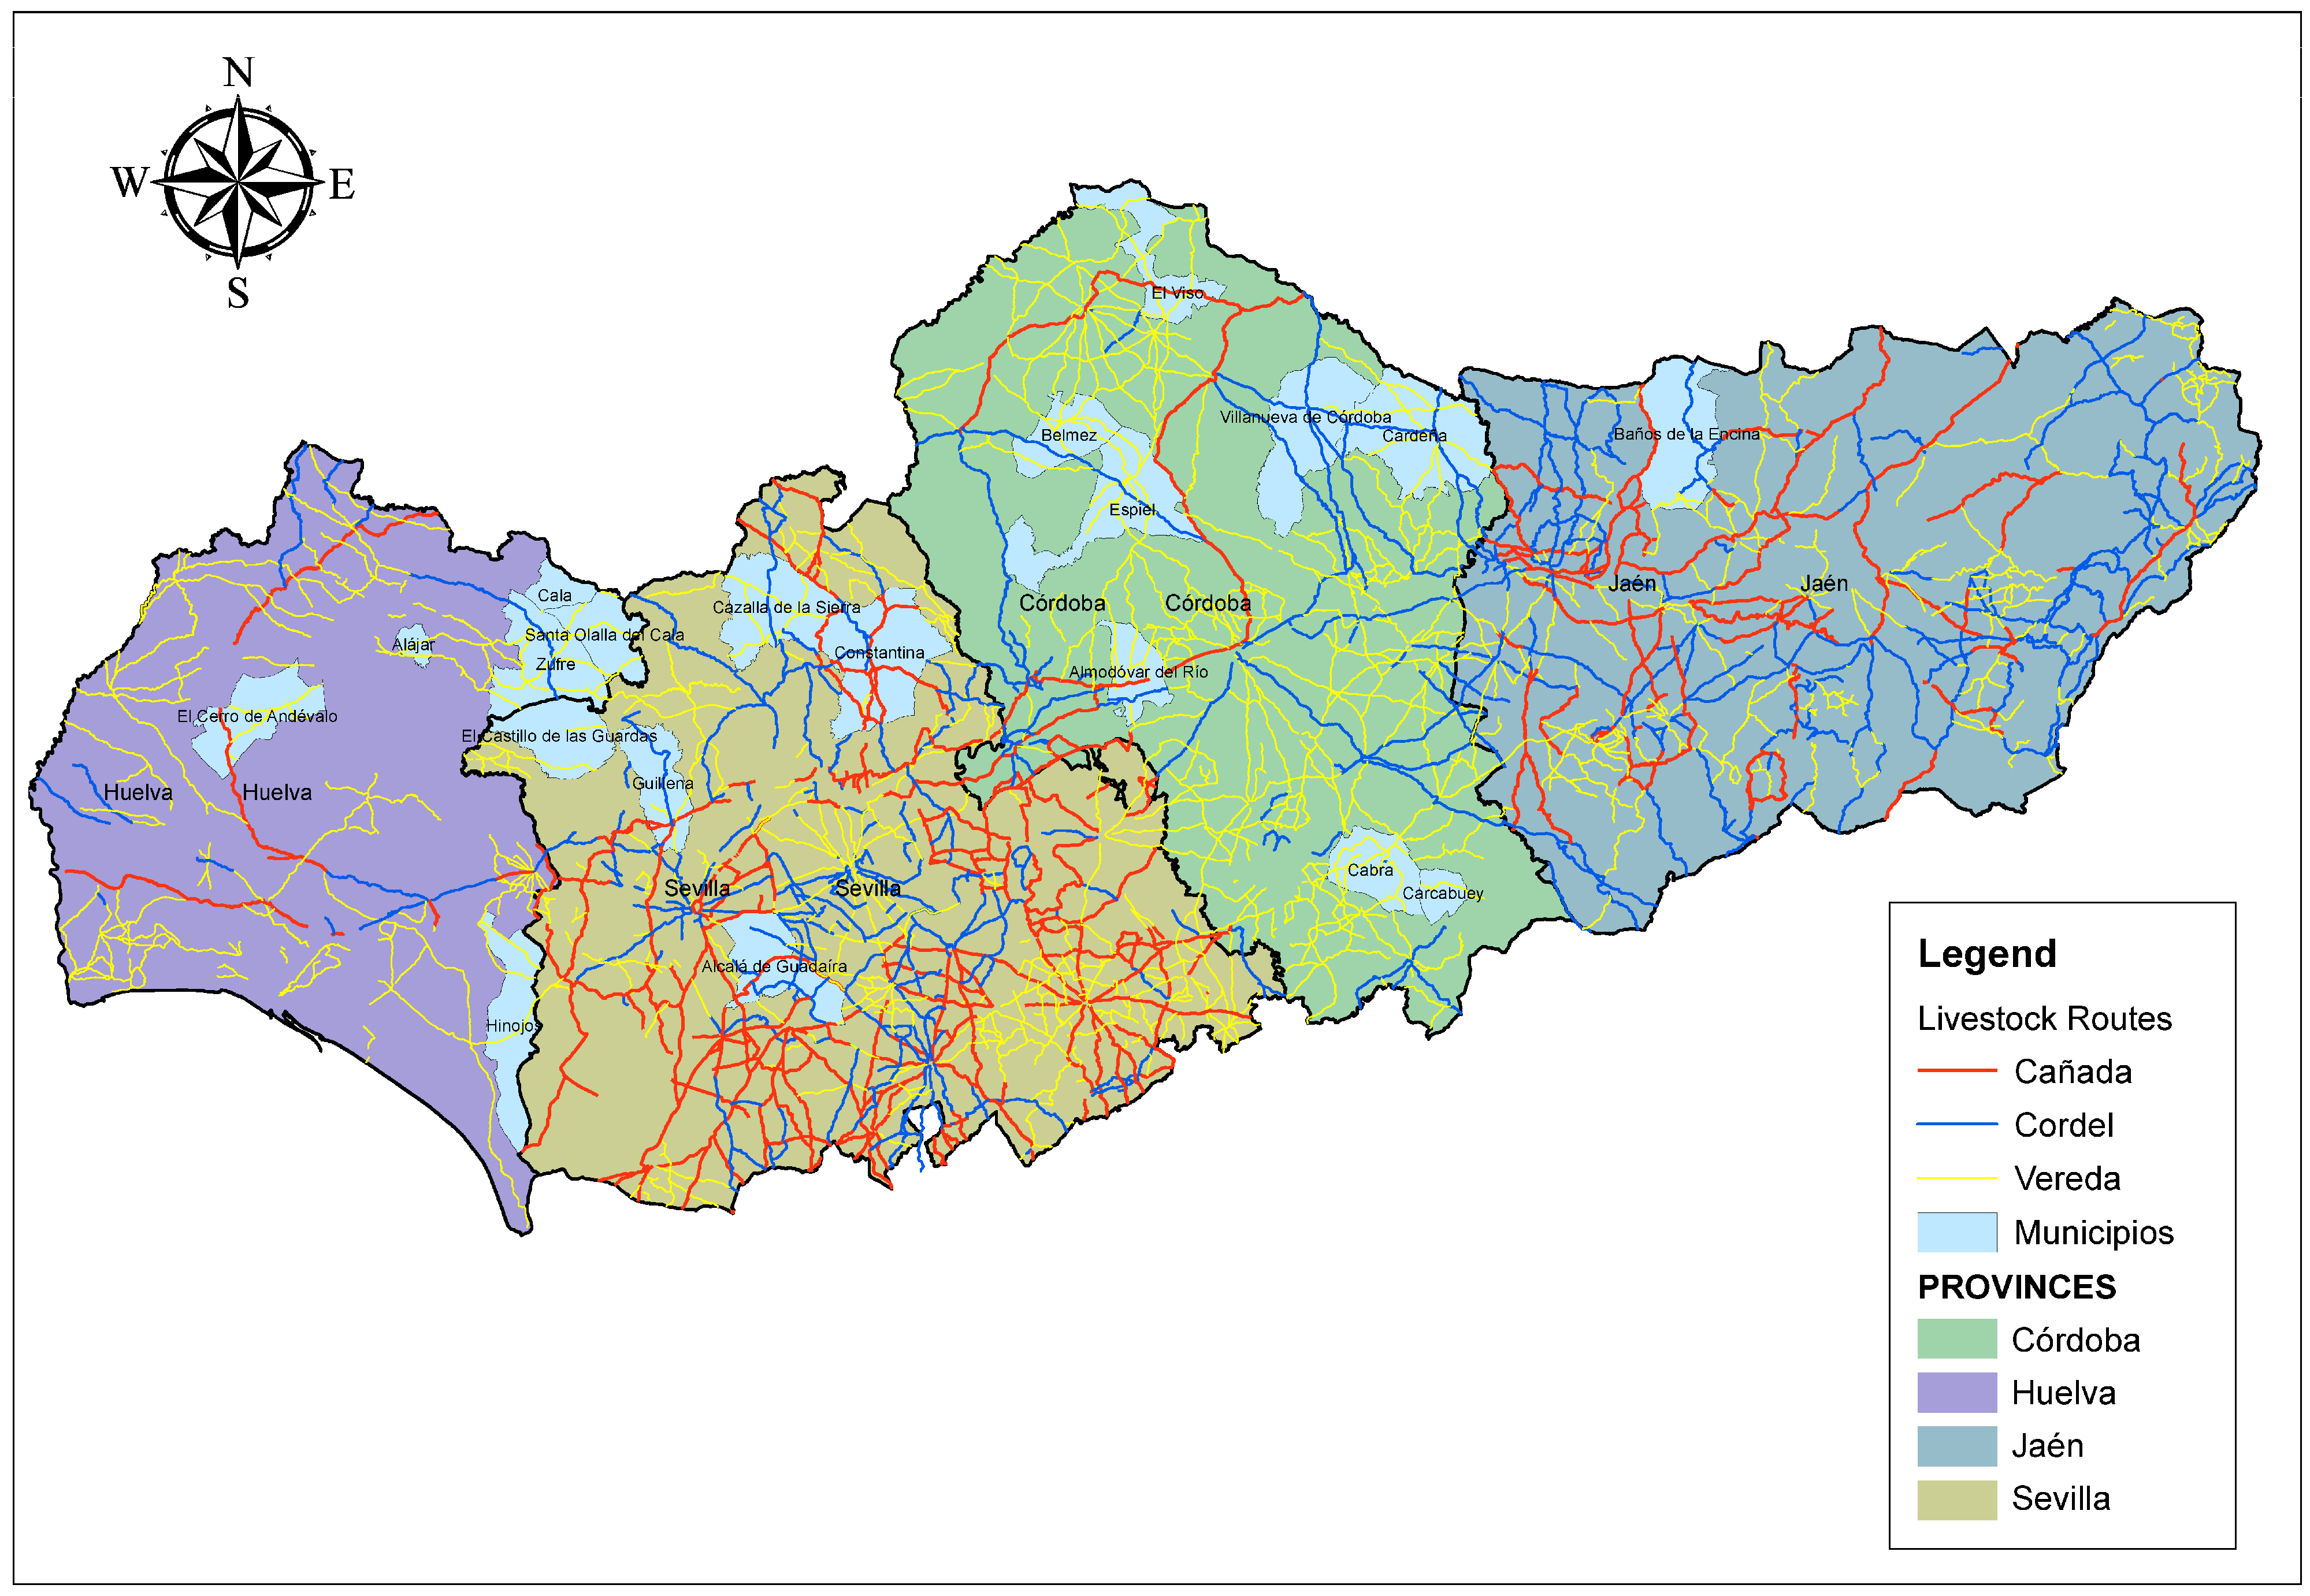
| Birth Municipality | Municipalities where Andalusian Black Cattle individuals were born (Figure 2 and Supplementary Table S1) | [22] |
- Canonical Relationship Plotting
- 2.
- Sample Size Consideration
- 3.
- Multicollinearity Analysis
- 4.
- Canonical Correlation Dimension
- 5.
- Discriminant Analysis Efficiency
- 6.
- Discriminant Model Reliability
- 7.
- Canonical Coefficients and Loading Interpretation
- 8.
- Discriminant Function Validation and Cross-Validation
- 9.
- Mahalanobis Distances
3. Results
3.1. Descriptive Statistics and Frequency Analysis
3.2. Canonical Discriminant Analysis
3.2.1. Multicollinearity Analysis
3.2.2. Model Reliability and Explanatory Potential
3.2.3. Analysis Efficiency
3.2.4. Discriminant Potential
3.2.5. Pillai’s Trace Test
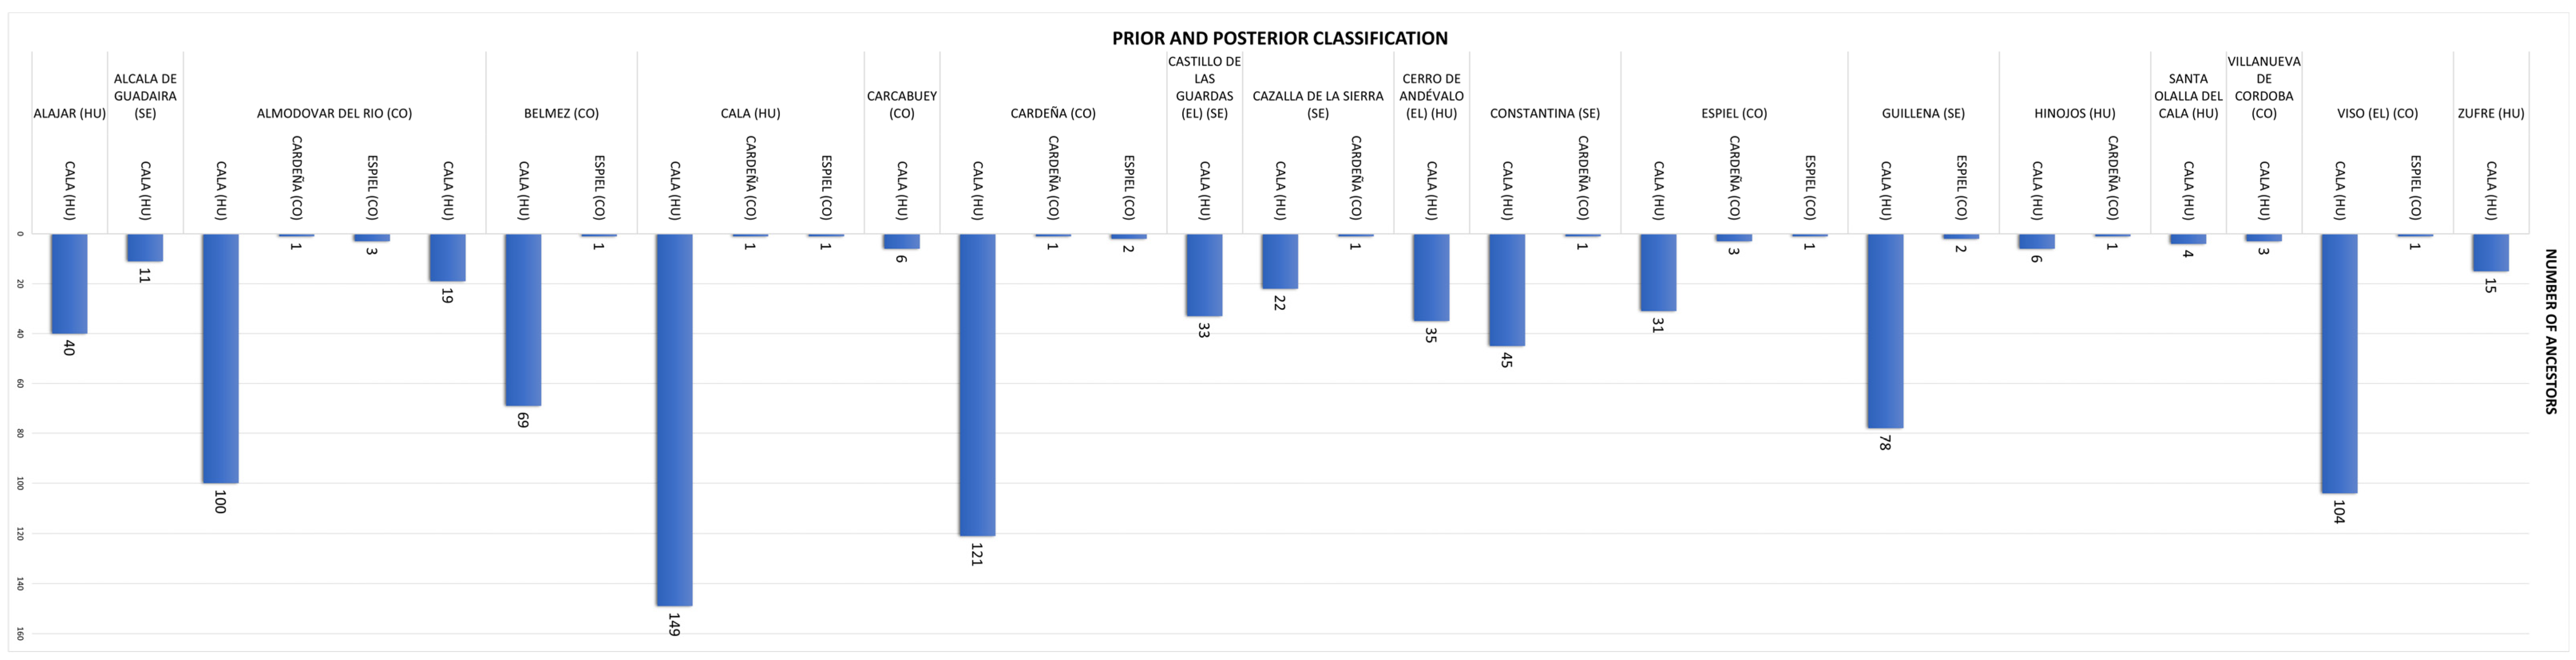
3.2.6. Discriminant Coefficients and Classification Patterns
3.2.7. Discriminant Function Validation and Cross-Validation
3.2.8. Mahalanobis Distances
4. Discussion
5. Conclusions
Supplementary Materials
Author Contributions
Funding
Institutional Review Board Statement
Informed Consent Statement
Data Availability Statement
Acknowledgments
Conflicts of Interest
Abbreviations
| CDA | Canonical Discriminant Analysis |
| F | Inbreeding Coefficient |
| C | Coancestry |
| MSV | Mendelian Sampling Variance |
| NCA | Nodal Common Ancestor |
| LOOCV | Leave-One-Out Cross-Validation |
| SEM | Standard Error of the Mean |
| α | Non-Random Mating Coefficient |
| VIF | Variance Inflation Factor |
| DF | Degrees of Freedom |
| Χ2 | Chi-Square |
| CO | Córdoba |
| HU | Huelva |
| SE | Sevilla/Seville |
References
- Cartuche Macas, L.F.; Camacho Vallejo, M.E.; González Ariza, A.; León Jurado, J.M.; Delgado Bermejo, J.V.; Marín Navas, C.; Navas González, F.J. Analysis of Endangered Andalusian Black Cattle (Negra Andaluza) Reveals Genetic Reservoir for Bovine Black Trunk. Animals 2024, 14, 1131. [Google Scholar] [CrossRef] [PubMed]
- Martín-Burriel, I.; Rodellar, C.; Cañón, J.; Cortés, O.; Dunner, S.; Landi, V.; Martínez-Martínez, A.; Gama, L.; Ginja, C.; Penedo, M. Genetic diversity, structure, and breed relationships in Iberian cattle. J. Anim. Sci. 2011, 89, 893–906. [Google Scholar] [CrossRef] [PubMed]
- Star, B.; Spencer, H.G. Effects of Genetic Drift and Gene Flow on the Selective Maintenance of Genetic Variation. Genetics 2013, 194, 235–244. [Google Scholar] [CrossRef] [PubMed]
- Wright, S. Coefficients of inbreeding and relationship. Am. Nat. 1922, 56, 330–338. [Google Scholar] [CrossRef]
- Malécot, G. The Mathematics of Heredity; Masson et Cie: Paris, France, 1948. [Google Scholar]
- Wright, S. Statistical methods in biology. J. Am. Stat. Assoc. 1931, 26, 155–163. [Google Scholar]
- Lacy, R.C. Analysis of founder representation in pedigrees: Founder equivalents and founder genome equivalents. Zoo Biol. 1989, 8, 111–123. [Google Scholar] [CrossRef]
- Boichard, D.; Maignel, L.; Verrier, E. The value of using probabilities of gene origin to measure genetic variability in a population. Genet. Sel. Evol. 1997, 29, 5–23. [Google Scholar] [CrossRef]
- Caballero, A.; Toro, M.A. Interrelations between effective population size and other pedigree tools for the management of conserved populations. Genet. Res. 2000, 75, 331–343. [Google Scholar] [CrossRef]
- Ballou, J.D. Population Management for Survival and Recovery: Analytical Methods and Strategies in Small Population Conservation; Columbia University Press: New York, NY, USA, 1995. [Google Scholar]
- Lacy, R.C. Importance of genetic variation to the viability of mammalian populations. J. Mammal. 1997, 78, 320–335. [Google Scholar] [CrossRef]
- Sargolzaei, M.; Colleau, J.J. Decomposing inbreeding and coancestry into ancestral components. In Proceedings of the 8th World Congress on Genetics Applied to Livestock Production, Belo Horizonte, Brasil, 13–18 August 2006. [Google Scholar]
- Directorate for Sustainable Rural Development. La Transhumancia en España: Libro Blanco; Ministerio de Agricultura, Alimentación y Medio Ambiente: Madrid, Spain, 2012. [Google Scholar]
- Arias, D.C.; Jurado, J.M.L.; Asensio, L.A.B.; González, F.J.N.; Navas, C.M.; Capote, C.J.B. Genetic diversity evolution of a sheep breed reintroduced after extinction: Tracing back Christopher Columbus’ first imported sheep. Res. Vet. Sci. 2020, 132, 207–216. [Google Scholar] [CrossRef]
- Navas, F.; Jordana, J.; León, J.; Barba, C.; Delgado, J. A model to infer the demographic structure evolution of endangered donkey populations. Animals 2017, 11, 2129–2138. [Google Scholar] [CrossRef] [PubMed]
- Gutiérrez, J.P.; Marmi, J.; Goyache, F.; Jordana, J. Pedigree information reveals moderate to high levels of inbreeding and a weak population structure in the endangered Catalonian donkey breed. J. Anim. Breed. Genet. 2005, 122, 378–386. [Google Scholar] [CrossRef] [PubMed]
- Sargolzaei, M.; Iwaisaki, H.; Colleau, J.J. CFC: A tool for monitoring genetic diversity. In Proceedings of the 8th World Congress on Genetics Applied to Livestock Production, Belo Horizonte, Brasil, 13–18 August 2006. [Google Scholar]
- Colleau, J.J.; Sargolzaei, M. A proximal decomposition of inbreeding, coancestry and contributions. Genet. Res. 2008, 90, 191–198. [Google Scholar] [CrossRef] [PubMed]
- Cervantes, I.; Goyache, F.; Molina, A.; Valera, M.; Gutierrez, J.P. Estimation of effective population size from the rate of coancestry in pedigreed populations. J. Anim. Breed. Genet. 2011, 128, 56–63. [Google Scholar] [CrossRef]
- Colleau, J.-J. An indirect approach to the extensive calculation of relationship coefficients. Genet. Sel. Evol. 2002, 34, 409. [Google Scholar] [CrossRef]
- James, J.; McBride, G. The spread of genes by natural and artificial selection in closed poultry flock. J. Genet. 1958, 56, 55–62. [Google Scholar] [CrossRef]
- González, A.R.M.; Navas González, F.J.; Crudeli, G.Á.; Delgado Bermejo, J.V.; Camacho Vallejo, M.E.; Quirino, C.R. Process of introduction of australian braford cattle to south america: Configuration of population structure and genetic diversity evolution. Animals 2022, 12, 275. [Google Scholar] [CrossRef]
- Goderie, R.; Lenstra, J.A.; Upadhyay, M.; Crooijmans, R.; Linnartz, L. Aurochs genetics, a cornerstone of European biodiversity. Rewilding Eur. 2015, 1, 1–33. [Google Scholar]
- Tavares, J.C.d.; Almeida, A.M.d. The Portuguese mertolenga cattle breed: A review. Trop. Anim. Health Prod. 2024, 56, 129. [Google Scholar] [CrossRef]
- Jiménez, A. Ganadería Hermanos Jiménez Sierpes. Available online: https://ganaderiahermanosjimenezsierpes.blogspot.com/2011/11/almoradux-y-albero.html (accessed on 1 April 2025).
- Butzer, K.W. Cattle and sheep from Old to New Spain: Historical antecedents. Ann. Assoc. Am. Geogr. 1988, 78, 29–56. [Google Scholar] [CrossRef]
- Bunting, S.C.; Rego, F.C. Human impact on Portugal’s vegetation. Rangel. Arch. 1988, 10, 251–255. [Google Scholar]
- Rodero, E.; González, A.; Avilés, C.; Luque, M. Conservation of endangered Spanish cattle breeds using markers of candidate genes for meat quality. Anim. Biotechnol. 2013, 24, 15–24. [Google Scholar] [CrossRef] [PubMed]
- Pitt, D. Unravelling Local Adaptation in the Genome of Livestock; Cardiff University: Cardiff, UK, 2021. [Google Scholar]
- González, A.; Herrera, M.; Villafuerte, J.; Peña Blanco, F.; Rodero, E. Caracterización etnológica de la raza bovina negra andaluza. In Proceedings of the IV Jornadas Ibéricas de Razas Autóctonas y Sus Productos Tradicionales: Innovación, Seguridad y Cultura Alimentaria, Seville, Spain, 30 November–1 December 2007; pp. 14–16. [Google Scholar]
- Serrano, E.R.; González, A.; Luque, A. Las razas bovinas andaluzas de protección especial: Berrendo en Negro, Berrendo en Colorado, Cárdena Andaluza, Negra andaluza de las Campiñas, Pajuna y Marismeña. In Patrimonio Ganadero Andaluz: Las Razas Ganaderas de Andalucía; Consejería de Agricultura y Pesca: Madrid, Spain, 2004; Volumen II, pp. 53–120. [Google Scholar]
- González, J.F.C. Ritos del toro en los confines de Andalucía. Rev. De Estud. Taur. 2021, 47, 133–151. [Google Scholar]
- Columela, R. Las razas de ganados de Andalucía. In Andalucía Ganadera y Agricola; Tipografía artística Juanito: Córdoba, Spain, 1927; p. 8. [Google Scholar]
- Ajmone-Marsan, P.; Garcia, J.F.; Lenstra, J.A. On the origin of cattle: How aurochs became cattle and colonized the world. Evol. Anthropol. Issues News Rev. 2010, 19, 148–157. [Google Scholar] [CrossRef]
- Jiménez-Castillo, P.; García, J.L.S.; Moreno-Narganes, J.M. From Flocks to Fields: Pastoralism in Eastern al-Andalus During the 11th Century. Humans 2025, 5, 4. [Google Scholar] [CrossRef]
- Jordan, T.G. An Iberian lowland/highland model for Latin American cattle ranching. J. Hist. Geogr. 1989, 15, 111–125. [Google Scholar] [CrossRef]
- Martínez, A.M.; Gama, L.T.; Cañón, J.; Ginja, C.; Delgado, J.V.; Dunner, S.; Landi, V.; Martín-Burriel, I.; Penedo, M.C.T.; Rodellar, C. Genetic footprints of Iberian cattle in America 500 years after the arrival of Columbus. PLoS ONE 2012, 7, e49066. [Google Scholar] [CrossRef]
- Serrano, E.R.; Franganillo, A.R.; Bermejo, J.V.D. Primitive andalusian livestock and their implications in the discovery of America. Arch. De Zootec. 1992, 41, 10. [Google Scholar]
- Sluyter, A. Black Ranching Frontiers: African Cattle Herders of the Atlantic World, 1500–1900; Yale University Press: New Haven, CT, USA, 2012. [Google Scholar]
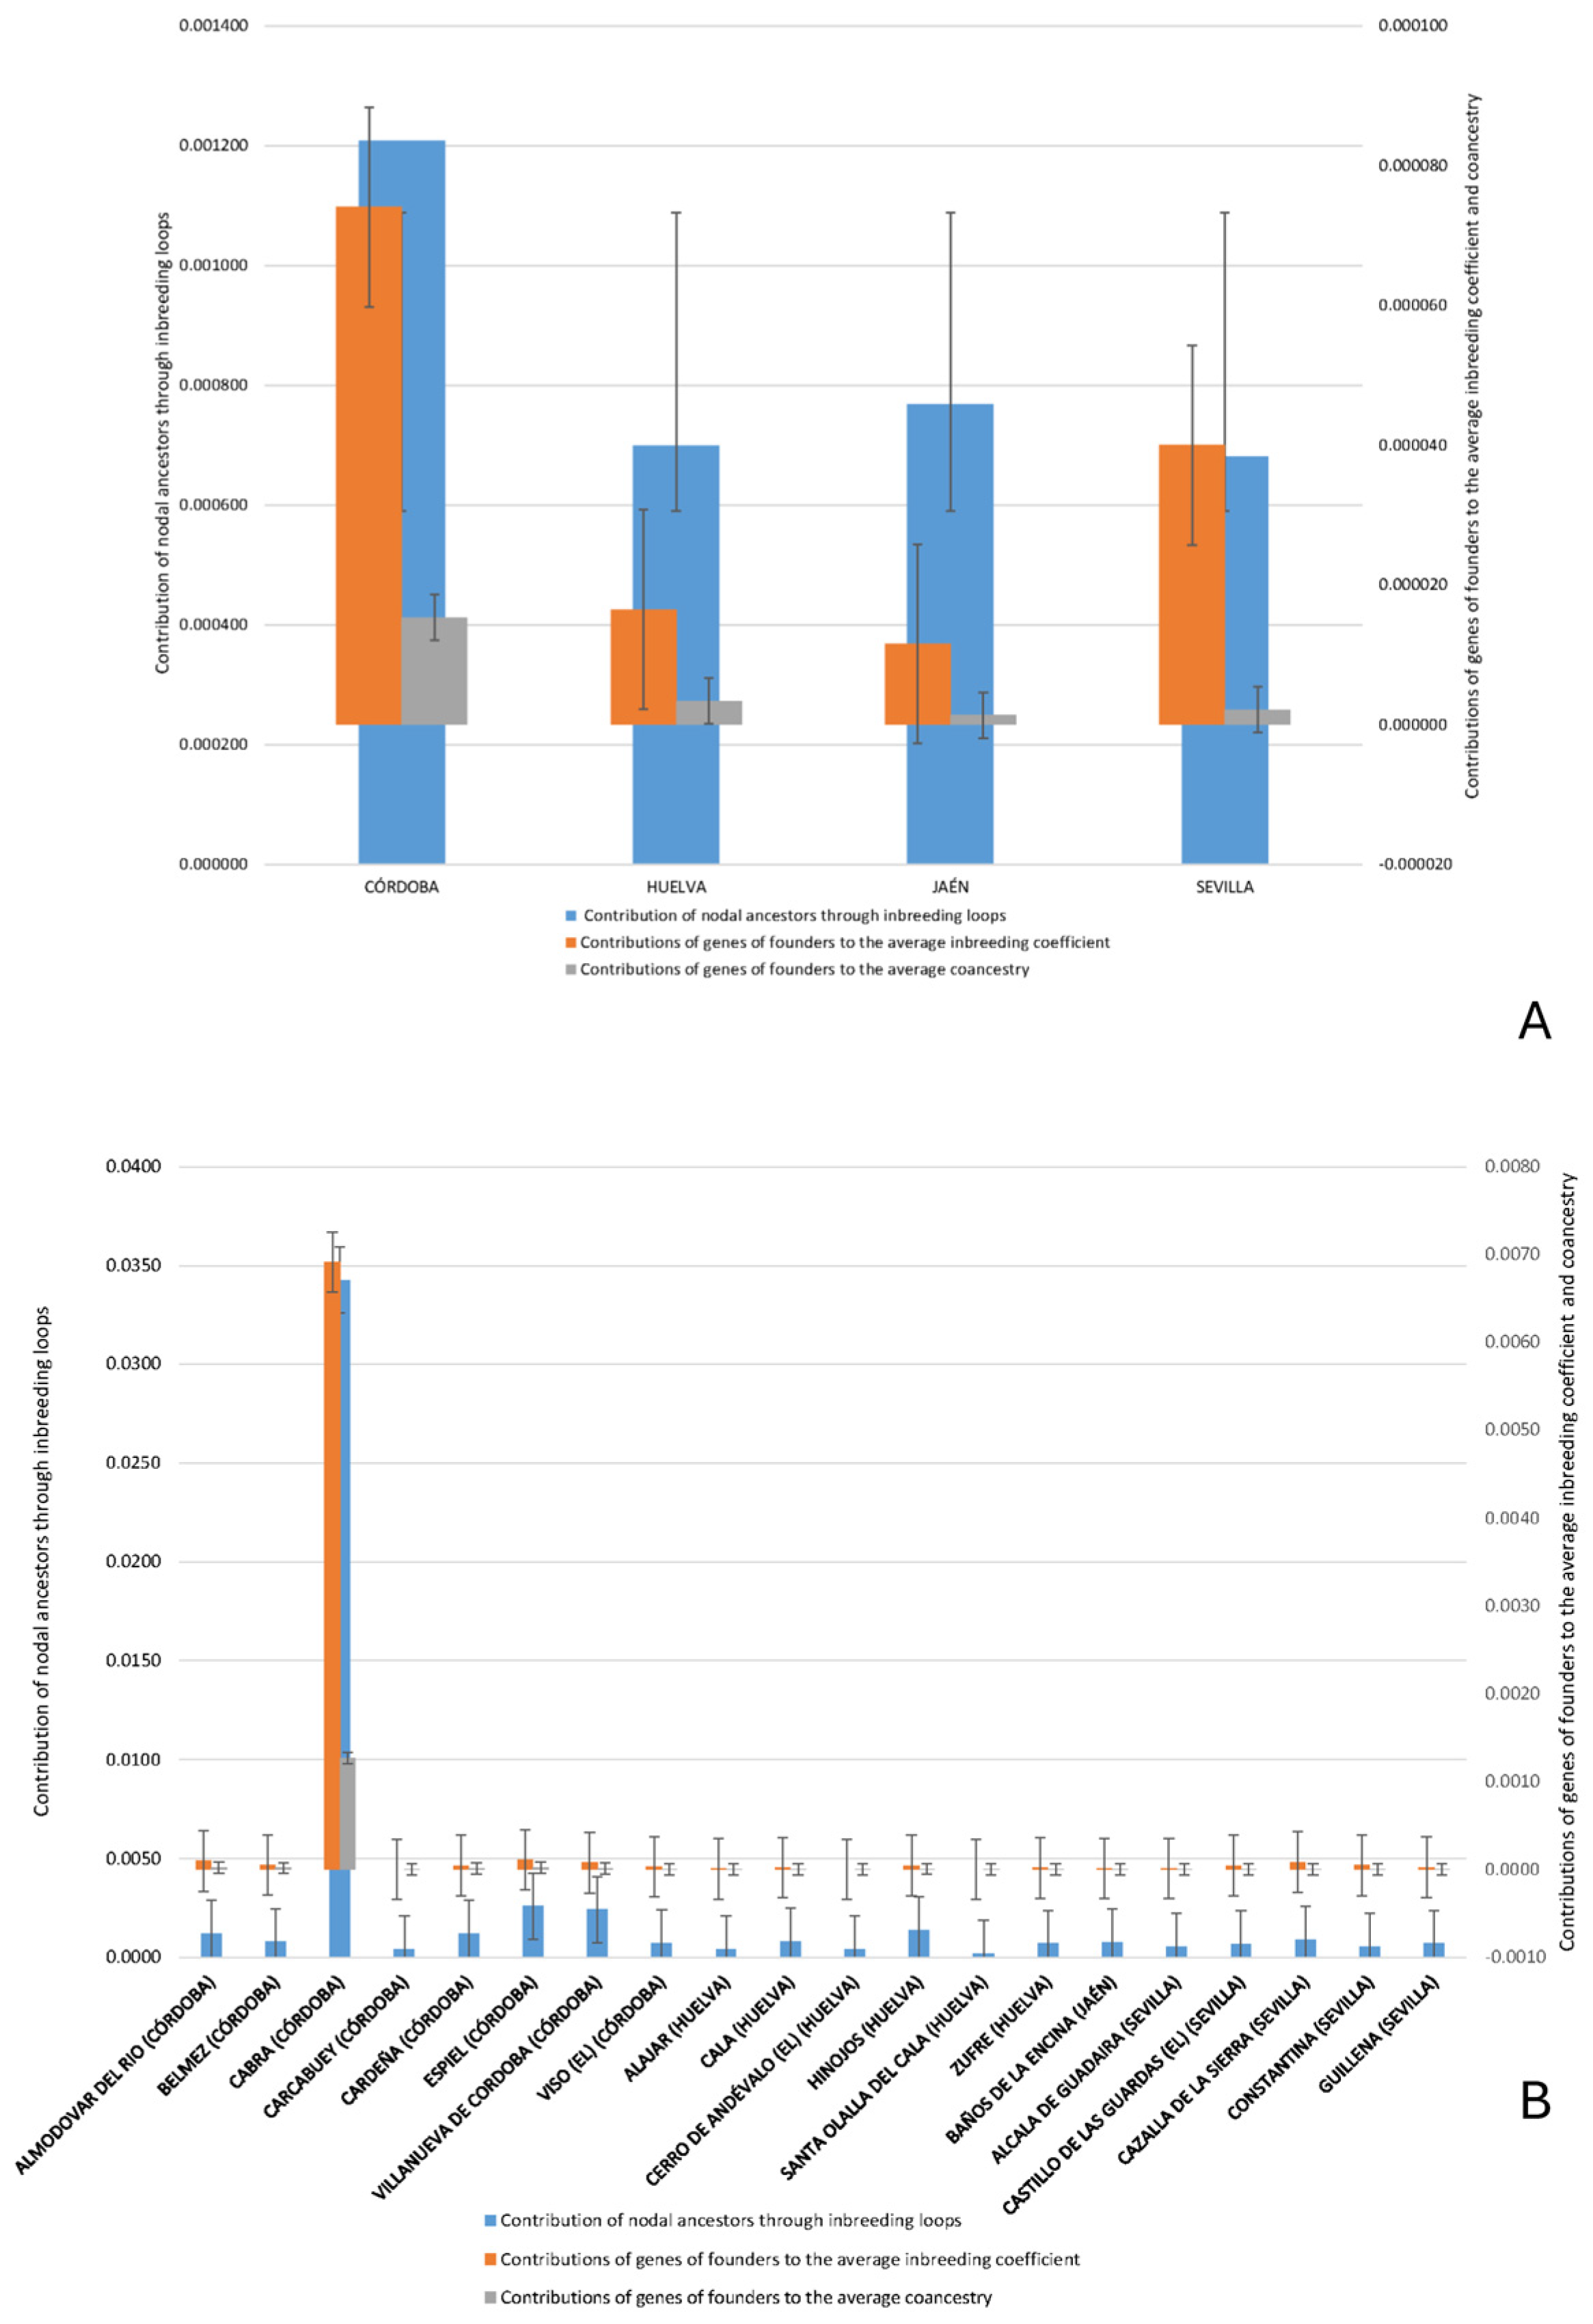


| Variable | Mean | Min | Max | Standard Deviation |
|---|---|---|---|---|
| Contribution of nodal ancestors through inbreeding loops | 0.000949 | 0.000117 | 0.044711 | 0.003338 |
| Contributions of genes of founders to the average inbreeding coefficient | 0.000049 | 0.000000 | 0.006913 | 0.000396 |
| Contributions of genes of founders to the average coancestry | 0.000009 | 0.000000007 | 0.001270 | 0.000082 |
| Coancestry (C) | 0.000475 | 0.000058 | 0.022355 | 0.001669 |
| Non-Random Mating (α) | −0.000478 | −0.022867 | −0.000058 | 0.001697 |
Disclaimer/Publisher’s Note: The statements, opinions and data contained in all publications are solely those of the individual author(s) and contributor(s) and not of MDPI and/or the editor(s). MDPI and/or the editor(s) disclaim responsibility for any injury to people or property resulting from any ideas, methods, instructions or products referred to in the content. |
© 2025 by the authors. Licensee MDPI, Basel, Switzerland. This article is an open access article distributed under the terms and conditions of the Creative Commons Attribution (CC BY) license (https://creativecommons.org/licenses/by/4.0/).
Share and Cite
Cartuche Macas, L.F.; Camacho Vallejo, M.E.; González Ariza, A.; León Jurado, J.M.; Delgado Bermejo, J.V.; Marín Navas, C.; Navas González, F.J. Canonical Discriminant Mapping of Origins in Andalusian Black Cattle: Inbreeding and Coancestry Decomposition via Mendelian Sampling Variances and Nodal Ancestor Contributions. Animals 2025, 15, 1781. https://doi.org/10.3390/ani15121781
Cartuche Macas LF, Camacho Vallejo ME, González Ariza A, León Jurado JM, Delgado Bermejo JV, Marín Navas C, Navas González FJ. Canonical Discriminant Mapping of Origins in Andalusian Black Cattle: Inbreeding and Coancestry Decomposition via Mendelian Sampling Variances and Nodal Ancestor Contributions. Animals. 2025; 15(12):1781. https://doi.org/10.3390/ani15121781
Chicago/Turabian StyleCartuche Macas, Luis Favian, María Esperanza Camacho Vallejo, Antonio González Ariza, José Manuel León Jurado, Juan Vicente Delgado Bermejo, Carmen Marín Navas, and Francisco Javier Navas González. 2025. "Canonical Discriminant Mapping of Origins in Andalusian Black Cattle: Inbreeding and Coancestry Decomposition via Mendelian Sampling Variances and Nodal Ancestor Contributions" Animals 15, no. 12: 1781. https://doi.org/10.3390/ani15121781
APA StyleCartuche Macas, L. F., Camacho Vallejo, M. E., González Ariza, A., León Jurado, J. M., Delgado Bermejo, J. V., Marín Navas, C., & Navas González, F. J. (2025). Canonical Discriminant Mapping of Origins in Andalusian Black Cattle: Inbreeding and Coancestry Decomposition via Mendelian Sampling Variances and Nodal Ancestor Contributions. Animals, 15(12), 1781. https://doi.org/10.3390/ani15121781