Article

Integrative QTL Mapping and Transcriptomic Profiling to Identify Growth-Associated QTL and Candidate Genes in Hong Kong Catfish (Clarias fuscus)

1
Guangdong Research Center on Reproductive Control and Breeding Technology of Indigenous Valuable Fish Species, Guangdong Provincial Engineering Laboratory for Mariculture Organism Breeding, Guangdong Provincial Key Laboratory of Aquatic Animal Disease Control and Healthy Culture, Fisheries College, Guangdong Ocean University, Zhanjiang 524088, China
2
Guangxi Introduction and Breeding Center of Aquaculture, Nanning 530001, China
*
Author to whom correspondence should be addressed.
These authors contributed equally to this work.
Animals 2025, 15(12), 1707; https://doi.org/10.3390/ani15121707 (registering DOI)
Submission received: 5 May 2025 / Revised: 27 May 2025 / Accepted: 6 June 2025 / Published: 9 June 2025
(This article belongs to the Section Animal Welfare)

Simple Summary

The Hong Kong catfish (Clarias fuscus) is a freshwater species commonly cultured in southern China for its high nutritional value. Despite its economic importance, research on the genes associated with growth traits in C. fuscus is limited, hindering the development of effective breeding strategies. In this study, quantitative trait loci (QTL) mapping and RNA-seq were performed to investigate the growth traits of C. fuscus. By combining these two approaches, 27 growth-related candidate genes were identified within 17 QTL intervals, which play important roles in the growth activities of fish. The identification of these QTL regions and candidate genes not only fills the gap in research on growth-related genes in C. fuscus, but also provides valuable data to further elucidate the genetic mechanisms underlying growth traits in this species.

Abstract

Growth traits are critical economic characteristics in aquaculture. This study aimed to identify the candidate genes associated with the growth of C. fuscus by integrating QTL mapping for growth traits and the RNA-seq analysis of differentially expressed genes (DEGs) between two extreme body size groups (big-sized group and small-sized group). QTL mapping was performed on eight growth traits—body weight, body height, body length, body width, orbital diameter, caudal peduncle length, caudal peduncle height, and pre-dorsal length—using 200 individuals from a full-sibling line. Seventeen growth-related QTL were identified across eight linkage groups, explaining phenotypic variance ranging from 8.00% to 11.90%. A total of 162 functional genes were annotated within these QTL intervals. RNA-seq analysis identified 3824 DEGs between the big-sized and small-sized groups, with 2252 genes upregulated and 1572 downregulated in the big group. By integrating QTL mapping and RNA-seq data, 27 candidate genes were identified, including myostatin (mstnb), epidermal growth factor receptor (egfr), and sarcoplasmic/endoplasmic reticulum calcium ATPase 1 (serca1). These findings provide crucial insights into the genetic regulation of growth in C. fuscus and lay a foundation for future genetic selection strategies.

1. Introduction

Growth traits are among the most critical economic features in aquaculture species. Enterprises focusing on fish with superior growth performance can benefit from reduced rearing cycles, lower production costs, and significant increases in yield and economic returns. Consequently, selecting and breeding fish species with exceptional growth potential has become a central goal for the sustainable development of the aquaculture industry [1]. Growth traits are regulated by numerous small-effect polygenes, known as quantitative trait loci (QTL). While most of these loci have minor effects, a few key genes exert a substantial influence on growth [2]. Several genes involved in growth regulation have been identified in fish. Genes within the growth hormone/insulin-like growth factor (GH/IGF) axis, such as growth hormone (gh), growth hormone receptor (ghr), insulin-like growth factor 1 (igf-I), insulin-like growth factor 2 (igf-II), and insulin-like growth factor binding proteins (igfbps), play critical roles in regulating metabolic processes and cell growth [3]. Additionally, members of the myogenic regulatory factors (MRFs) gene family, including myogenin (myog), myogenic differentiation 1 (myod), and myogenic factor 5 (myf-5), are primarily expressed in vertebrate skeletal muscle and are crucial for muscle development through the regulation of cell proliferation and the activation of muscle-specific genes [4]. Other genes, such as melanocortin receptor-4 (mc4r), influence growth by regulating energy metabolism, while gastric hunger hormone (ghrelin) plays a role in growth regulation by enhancing feeding and digestive efficiency [5,6]. These genes interact through a complex signaling network that collectively influences growth-related phenotypic variation in fish. Given the species-specific nature of growth regulation, screening growth-related genes across different species is essential for gaining a comprehensive understanding of the genetic mechanisms behind growth regulation in fish.
QTL mapping is a crucial tool for investigating the genetic basis of economic traits in aquaculture species, playing a key role in guiding the identification of candidate genes [7]. Traditional breeding methods rely on the careful selection of individuals with desirable characteristics followed by successive generations of breeding to produce seedlings with superior economic traits. However, this process is time-consuming, costly, and highly susceptible to external factors such as environmental influences, limiting its practical application in production [8]. In contrast, QTL mapping enables the identification of complex traits by pinpointing specific genomic regions, facilitating the early selection of superior individuals. This approach not only significantly shortens the breeding cycle but also improves breeding efficiency and enhances economic returns. Currently, QTL mapping is widely applied in breeding studies of aquaculture species, addressing key economic traits such as sex determination [9,10], hypoxia tolerance [11,12], and body color [13,14]. For growth traits, QTL mapping studies have been conducted in various aquaculture species, including common carp (Cyprinus carpio) [15] and mirror carp (Cyprinus carpiovar. specularis) [16]. These studies have enriched the genetic resources for fish breeding and provided valuable insights into the genetic basis of growth traits in fish.
While QTL mapping is valuable for identifying chromosomal regions linked to growth traits by analyzing the genetic structure of economic traits, it primarily locates broader chromosomal regions where candidate genes are mapped. Without further fine-mapping, its ability to provide detailed candidate gene information is limited [17]. On the other hand, RNA-seq offers insights into gene expression dynamics, revealing how gene expression varies across individuals of different sizes [18,19]. In recent years, transcriptomics analysis has been widely used to identify the differentially expressed genes (DEGs) associated with growth traits in aquaculture species, for example, rainbow trout (Oncorhynchus mykiss) [20], mandarin fish (Siniperca chuatsi) [21], and fine flounder (Paralichthys adspersus) [22]. Combining QTL mapping with RNA-seq allows for the narrowing of the candidate gene range through co-mapping strategies like eQTL analysis, leading to more accurate gene mapping. For instance, a co-analysis in giant grouper (Epinephelus Lanceolatus) identified 34 candidate genes related to growth and six growth-related QTL [23]. Similarly, in Pacific whiteleg shrimp (Litopenaeus vannamei), four candidate genes were identified from nine growth-related QTLs using conjoint analysis [24]. This integrated approach improves the identification of growth-related candidate genes and enhances our understanding of the genetic mechanisms underlying growth traits in aquaculture species.
The Hong Kong catfish (Clarias fuscus) is the only native species of the Clariidae family in China [25]. This species is highly valued for its desirable traits, including strong adaptability, tender meat, and a high content of essential amino acids with a lowly fat content [26]. It has become one of the most important economic aquaculture species in southern China [27]. However, the development of the aquaculture industry for this species is hindered by the lack of targeted selective breeding programs. Therefore, there is an urgent need to enhance key economic traits, particularly growth, and to select seedlings with superior growth potential. Currently, the whole-genome sequences and high-density genetic linkage maps of C. fuscus have been constructed [25,26,28]. The acquisition of these whole-genome sequences and high-density genetic maps has laid the groundwork for identifying economic traits in this species. However, the genes related to the growth traits remain poorly understood. In this study, we performed QTL mapping for eight growth traits of C. fuscus using the established genetic map [28] and integrated muscle RNA-seq data to identify growth-related candidate genes. The findings will provide a scientific foundation for understanding the genetic basis of growth traits in C. fuscus and contribute to the development of C. fuscus lines with improved growth performance.

2. Materials and Methods

2.1. Ethics Statement

All experimental protocols in this study were conducted in accordance with the standards of the Guangdong Ocean University Animal Research and Ethics Committee (NIH Pub. No.85-23, revised in 1996). The subjects of this study were not endangered or protected species.

2.2. Sample Preparation and Phenotyping

To efficiently identify the genomic regions associated with target quantitative traits, genetic correlations within a full-sib F1 family of C. fuscus were utilized for QTL mapping. The family used for the QTL mapping of growth traits in this study originated from the same group previously employed for constructing the genetic linkage map [28]. This mapping family of C. fuscus was provided by the Guangxi Hongtai Aquatic Product Farm, Guangxi Province, China. A full-sib F1 family was generated via artificial fertilization with one dam and one sire. The F1 family was cultured in ponds and fed pellet feed three times daily. From this family, 200 F1 individuals were randomly selected for genetic linkage map construction [28], and these individuals were subsequently used for the QTL mapping of growth traits. In this study, eight growth-related traits were measured: body weight (BW), body height (BH), body length (BL), body width (BWI), orbital diameter (OD), caudal peduncle length (CPL), caudal peduncle height (CPH), and pre-dorsal length (PDL). The raw data for these traits were preprocessed using Microsoft Excel, followed by statistical analysis, including descriptive statistics, correlation analysis, and analysis of variance (ANOVA), conducted using SPSS 26.0.
For transcriptomic analysis, a mixed family of C. fuscus was selected. This mixed family, also provided by the Guangxi Hongtai Aquatic Product Farm, was reared at the freshwater aquaculture facility of Guangdong Ocean University. One-month-old fish of a similar size were transferred to the facility and cultured in a single pond under identical conditions, with pellet feed provided three times daily and water changed three times a week. At 6 months of age, 254 individuals were randomly selected for body weight measurement. Based on weight, nine individuals with the highest and nine with the lowest values were chosen to form three large-sized groups (B1, B2, B3) and three small-sized groups (S1, S2, S3). The average body weight of the large-sized groups was 100.13 ± 12.96 g, while that of the small-sized groups was 32.29 ± 7.48 g. The fish were fasted for 24 h before sample collection. Before dissection, the fish were anesthetized with eugenol (Shandong Keyuan Biochemical Co., Ltd., Heze, China). Muscle tissues were harvested, rapidly frozen in liquid nitrogen, and stored at −80 °C. For each group, muscle tissues from three individuals were mixed to a single sample for subsequent sequencing and analysis.

2.3. QTL Mapping for Growth Traits

QTL mapping for growth traits was conducted using the genetic linkage map of C. fuscus [28]. Eight growth traits were analyzed using the Permutation Test (PT) in MapQTL 6.0. The PT was performed with 1000 permutations to determine the LOD threshold for each trait at a 95% confidence level. The results from the PT were combined with the actual QTL significance levels obtained from the analysis to establish uniform thresholds for the eight growth traits. Interval mapping (IM) in MapQTL 6.0 was then used to analyze these traits, and the corresponding QTL segments were identified based on the established thresholds [29].

2.4. Screening of Candidate Genes for Growth Traits QTL and Functional Enrichment Analysis

Candidate genes and functional annotations within the QTL intervals for growth traits were identified using the reference genome of C. fuscus (https://www.ncbi.nlm.nih.gov/datasets/genome/GCA_030347435.1/, accessed on 23 June 2024). Functional genes within the QTL intervals identified through linkage analysis were selected based on this reference genome. The corresponding sequences within each QTL region were extracted and annotated by BLASTN (v2.7.1 +) analysis. Subsequently, Gene Ontology (GO) and Kyoto Encyclopedia of Genes and Genomes (KEGG) enrichment analyses were performed on the annotated genes using TBtools software (v2.210). The resulting visualizations were generated using the R package clusterProfiler (v3.8.1) [30].

2.5. Transcriptome Library Creation and Raw Data Processing

Total RNA was extracted from muscle tissues using TRIzol® Reagent (Invitrogen, Carlsbad, CA, USA) following the manufacturer’ s protocol. Genomic DNA was removed using RNase-Free DNase I (Thermo Fisher Scientific, Waltham, MA, USA). RNA concentration and purity were assessed using a NanoDrop ΙΙΙ 2000 spectrophotometer (Thermo Fisher Scientific, Waltham, MA, USA), and RNA integrity was confirmed using an Agilent 2100 Bioanalyzer (Agilent Technologies, Santa Clara, CA, USA). Only RNA samples with RIN > 7.0 were used for library construction. mRNA was randomly fragmented using NEB Fragmentation Buffer (New England Biolabs Co., Ltd, Beijing, China). The first strand of cDNA was synthesized using random oligonucleotides as primers in the M-MuLV reverse transcriptase system (New England Biolabs Co., Ltd, Beijing, China). The RNA strand was then degraded with RNaseH, and the second strand of cDNA was synthesized with dNTPs in the DNA polymerase I system. The purified double-stranded cDNA underwent end repair, A-tail addition, and ligation of sequencing junctions. cDNAs of approximately 250–300 bp were selected using AMPure XP beads (Shanghai Via-geneprobio Technologies Co., Ltd., Shanghai, China), followed by PCR amplification, and the PCR products were purified again. The libraries were then constructed [30]. Real-time PCR was performed for quality testing on the purified products. After passing the quality control, sequencing was conducted on an Illumina NovaSeq 6000 platform (Illumina, San Diego, CA, USA), generating 150 bp paired-end reads. The sequencing method was based on the ‘Sequencing by Synthesis’ principle. Raw sequencing data were processed using fastp (version 0.23.4) to filter out low-quality reads, reads containing adapters, and reads with poly-N sequences, resulting in clean reads for further analysis. [31]. These high-quality reads were aligned to the reference genome using HISAT2 software (v2.0.5), ensuring fast and accurate alignment to obtain the localization information of the reads on the reference genome (https://www.ncbi.nlm.nih.gov/datasets/genome/GCA_046453815.1/, accessed on 2 February 2025) [32]. Finally, new transcripts were assembled using StringTie software (v1.3.3b) [33].

2.6. Screening of DEGs and Functional Enrichment Analysis

The big-sized-individual group was used as the experimental group, while the small-sized-individual group served as the control group. Differential expression analysis between the two groups was conducted using the DESeq2 R package (version 1.6.3), identifying differentially expressed genes (DEGs) with a p-value < 0.05 and |fold change| ≥ 1. Gene Ontology (GO) and Kyoto Encyclopedia of Genes and Genomes (KEGG) enrichment analyses of the DEGs were performed using TBtools software (v2.210), and the results were visualized using the R package clusterProfiler (v3.8.1).

2.7. QTL and Transcriptome Association Analysis

By integrating the results from the QTL mapping analysis of significant regions and transcriptome differential gene analysis, a set of common genes between the two datasets was identified for further quantitative analysis and expression profiling. For gene expression analysis, expression levels were log2-transformed, and heatmaps were generated using the R package pheatmap (v3.5.0). The heatmaps were constructed using a fully interlocked clustering method and the Euclidean distance measurement metric.

2.8. Real-Time Fluorescence Quantitative PCR (qRT-PCR) Validation

The expression of candidate genes in the muscle of C. fuscus was quantified using qRT-PCR. The RNA used for transcriptome sequencing was reverse transcribed into complementary DNA (cDNA) using HiScript III All-in-One RT SuperMix (Vazyme Biotech Co., Ltd, Nanjing, China), optimized for quantitative PCR (qPCR). qRT-PCR was performed using PerfectStart Green qPCR SuperMix (Code#TG-AQ601-02) on a LightCycler® 480 detection system (Roche, Basel, Switzerland), with each sample analyzed in triplicate. Primers for qPCR were designed using the Primer Premier 6.0, with the β-actin gene serving as the internal reference gene. The reaction mixture was prepared at a total volume of 10 μL, consisting of 5.0 μL of 2× PerfectStart Green qPCR SuperMix, 1.0 μL of cDNA, 3.4 μL ddH2O, 0.3 μL of the forward primer, and 0.3 μL of the reverse primer. The reaction procedure was as follows: (1) Preincubation: 94 °C for 300 s; (2) amplification: (95 °C for 20 s, 60 °C for 20 s, 72 °C for 20 s) × 40 cycles; (3) melting: 95 °C for 10 s, 65 °C for 60 s, 97 °C for 1 s; and (4) cooling: 37 °C for 300 s. The comparative CT (2−ΔΔCT) method was used to assess relative gene expression levels. The primers for candidate genes and the internal control gene (β-actin) are shown in Table S1.

3. Results

3.1. Morphological Statistics

In this study, eight morphological traits (BW, BL, BH, BWI, OD, CPL, CPH, and PDL) were measured in 200 F1 individuals of C. fuscus. The morphological analyses showed that the frequency distribution of these traits conformed to a normal distribution (Figure S1). The coefficients of variation (CV) for the eight traits ranged from 8.00% to 11.90% (Table S2), indicating substantial variability, which made these traits suitable candidates for QTL analysis.

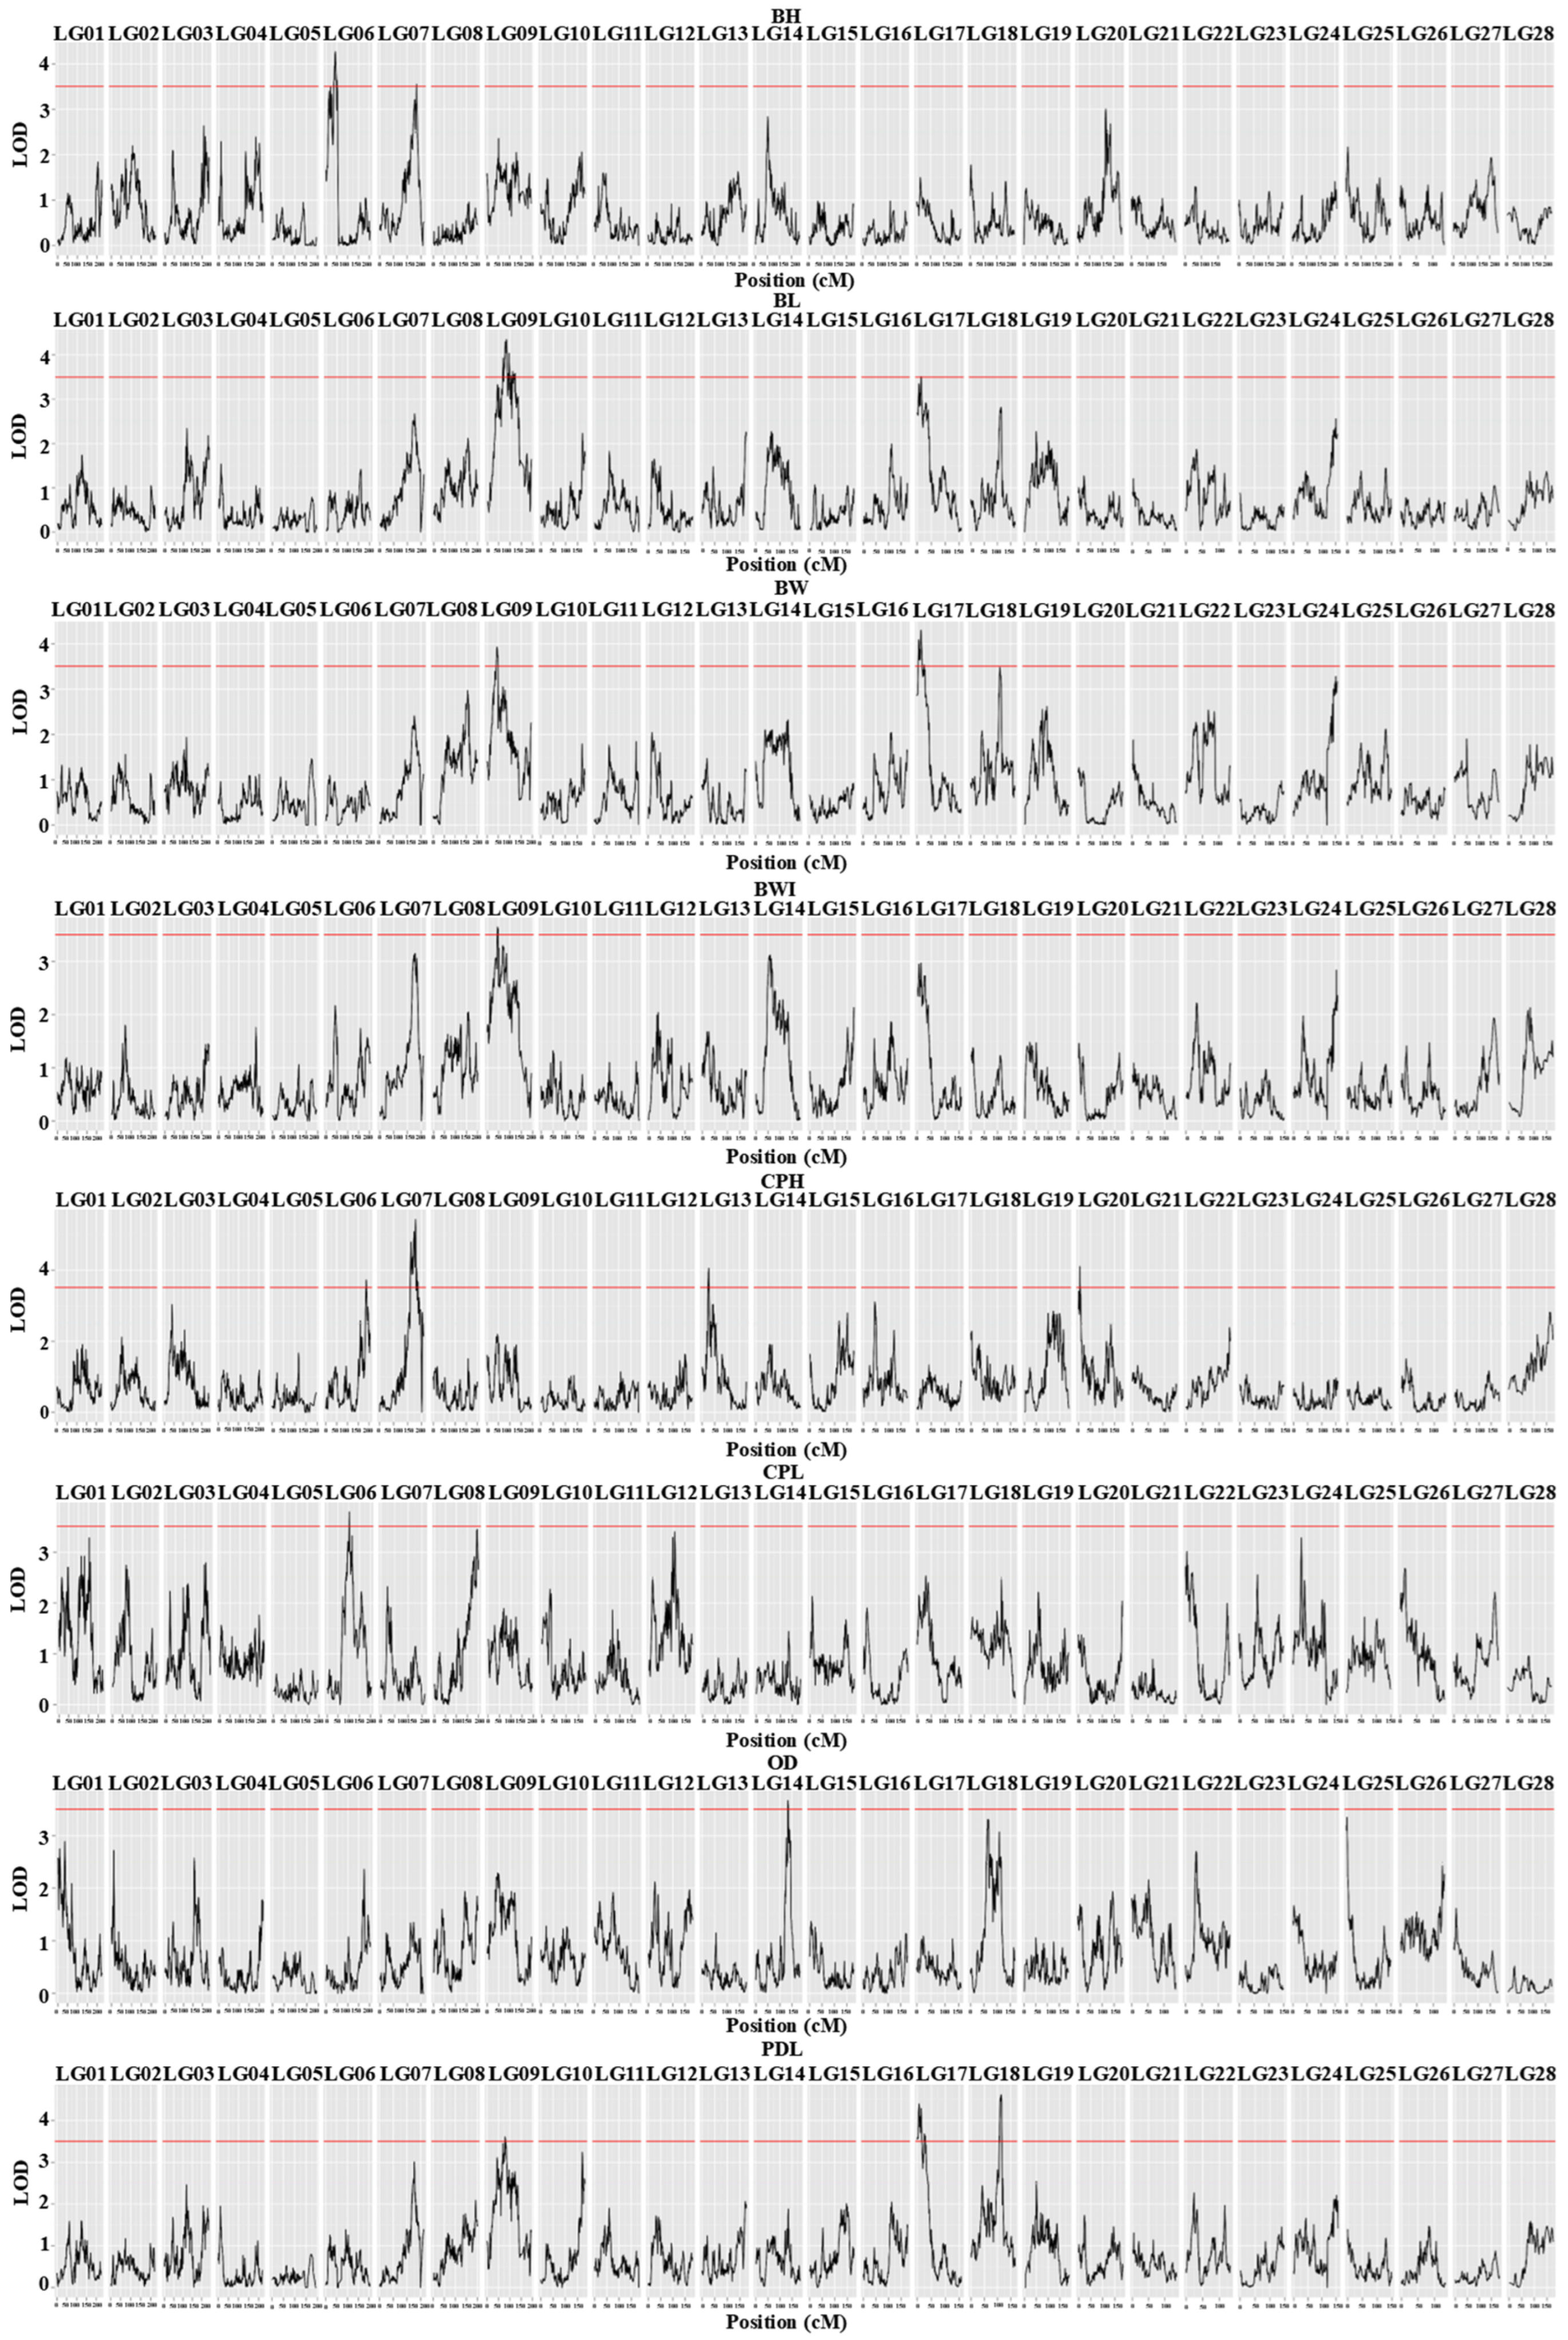
3.2. QTL Analysis and Candidate Gene Identification

Using QTL composite interval mapping with the MapQTL 6.0 software, we analyzed eight growth traits of C. fuscus. The analysis identified 17 QTLs (LOD > 3.5) distributed across eight linkage groups, including LG06, LG07, LG09, LG13, LG14, LG17, LG18, and LG20 (Figure 1). The peak positions of these QTLs ranged from 5.62 cM (qCPH-8) to 186.52 cM (qCPH-5). The phenotypic variance explained (PVE) by these QTLs ranged from 8.00% (qBL-4) to 11.90% (qCPH-6), with an average PVE of 9.04% (Table 1). Multiple growth trait QTLs were clustered on LG06, LG09, and LG17. Specifically, three QTLs for CPH, CPL, and BH were identified on LG06. On LG09, four QTLs were identified for BW, BL, PDL, and BWI, with a notable overlap between the significant regions for BW (41.931–45.835 cM) and BWI. Similarly, QTLs for BW, BWI, and PDL were on LG17, with the significant region for BW (13.520–17.098 cM) overlapping with that for BWI. A total of 162 candidate genes were identified within these 17 QTL intervals (Table S3).

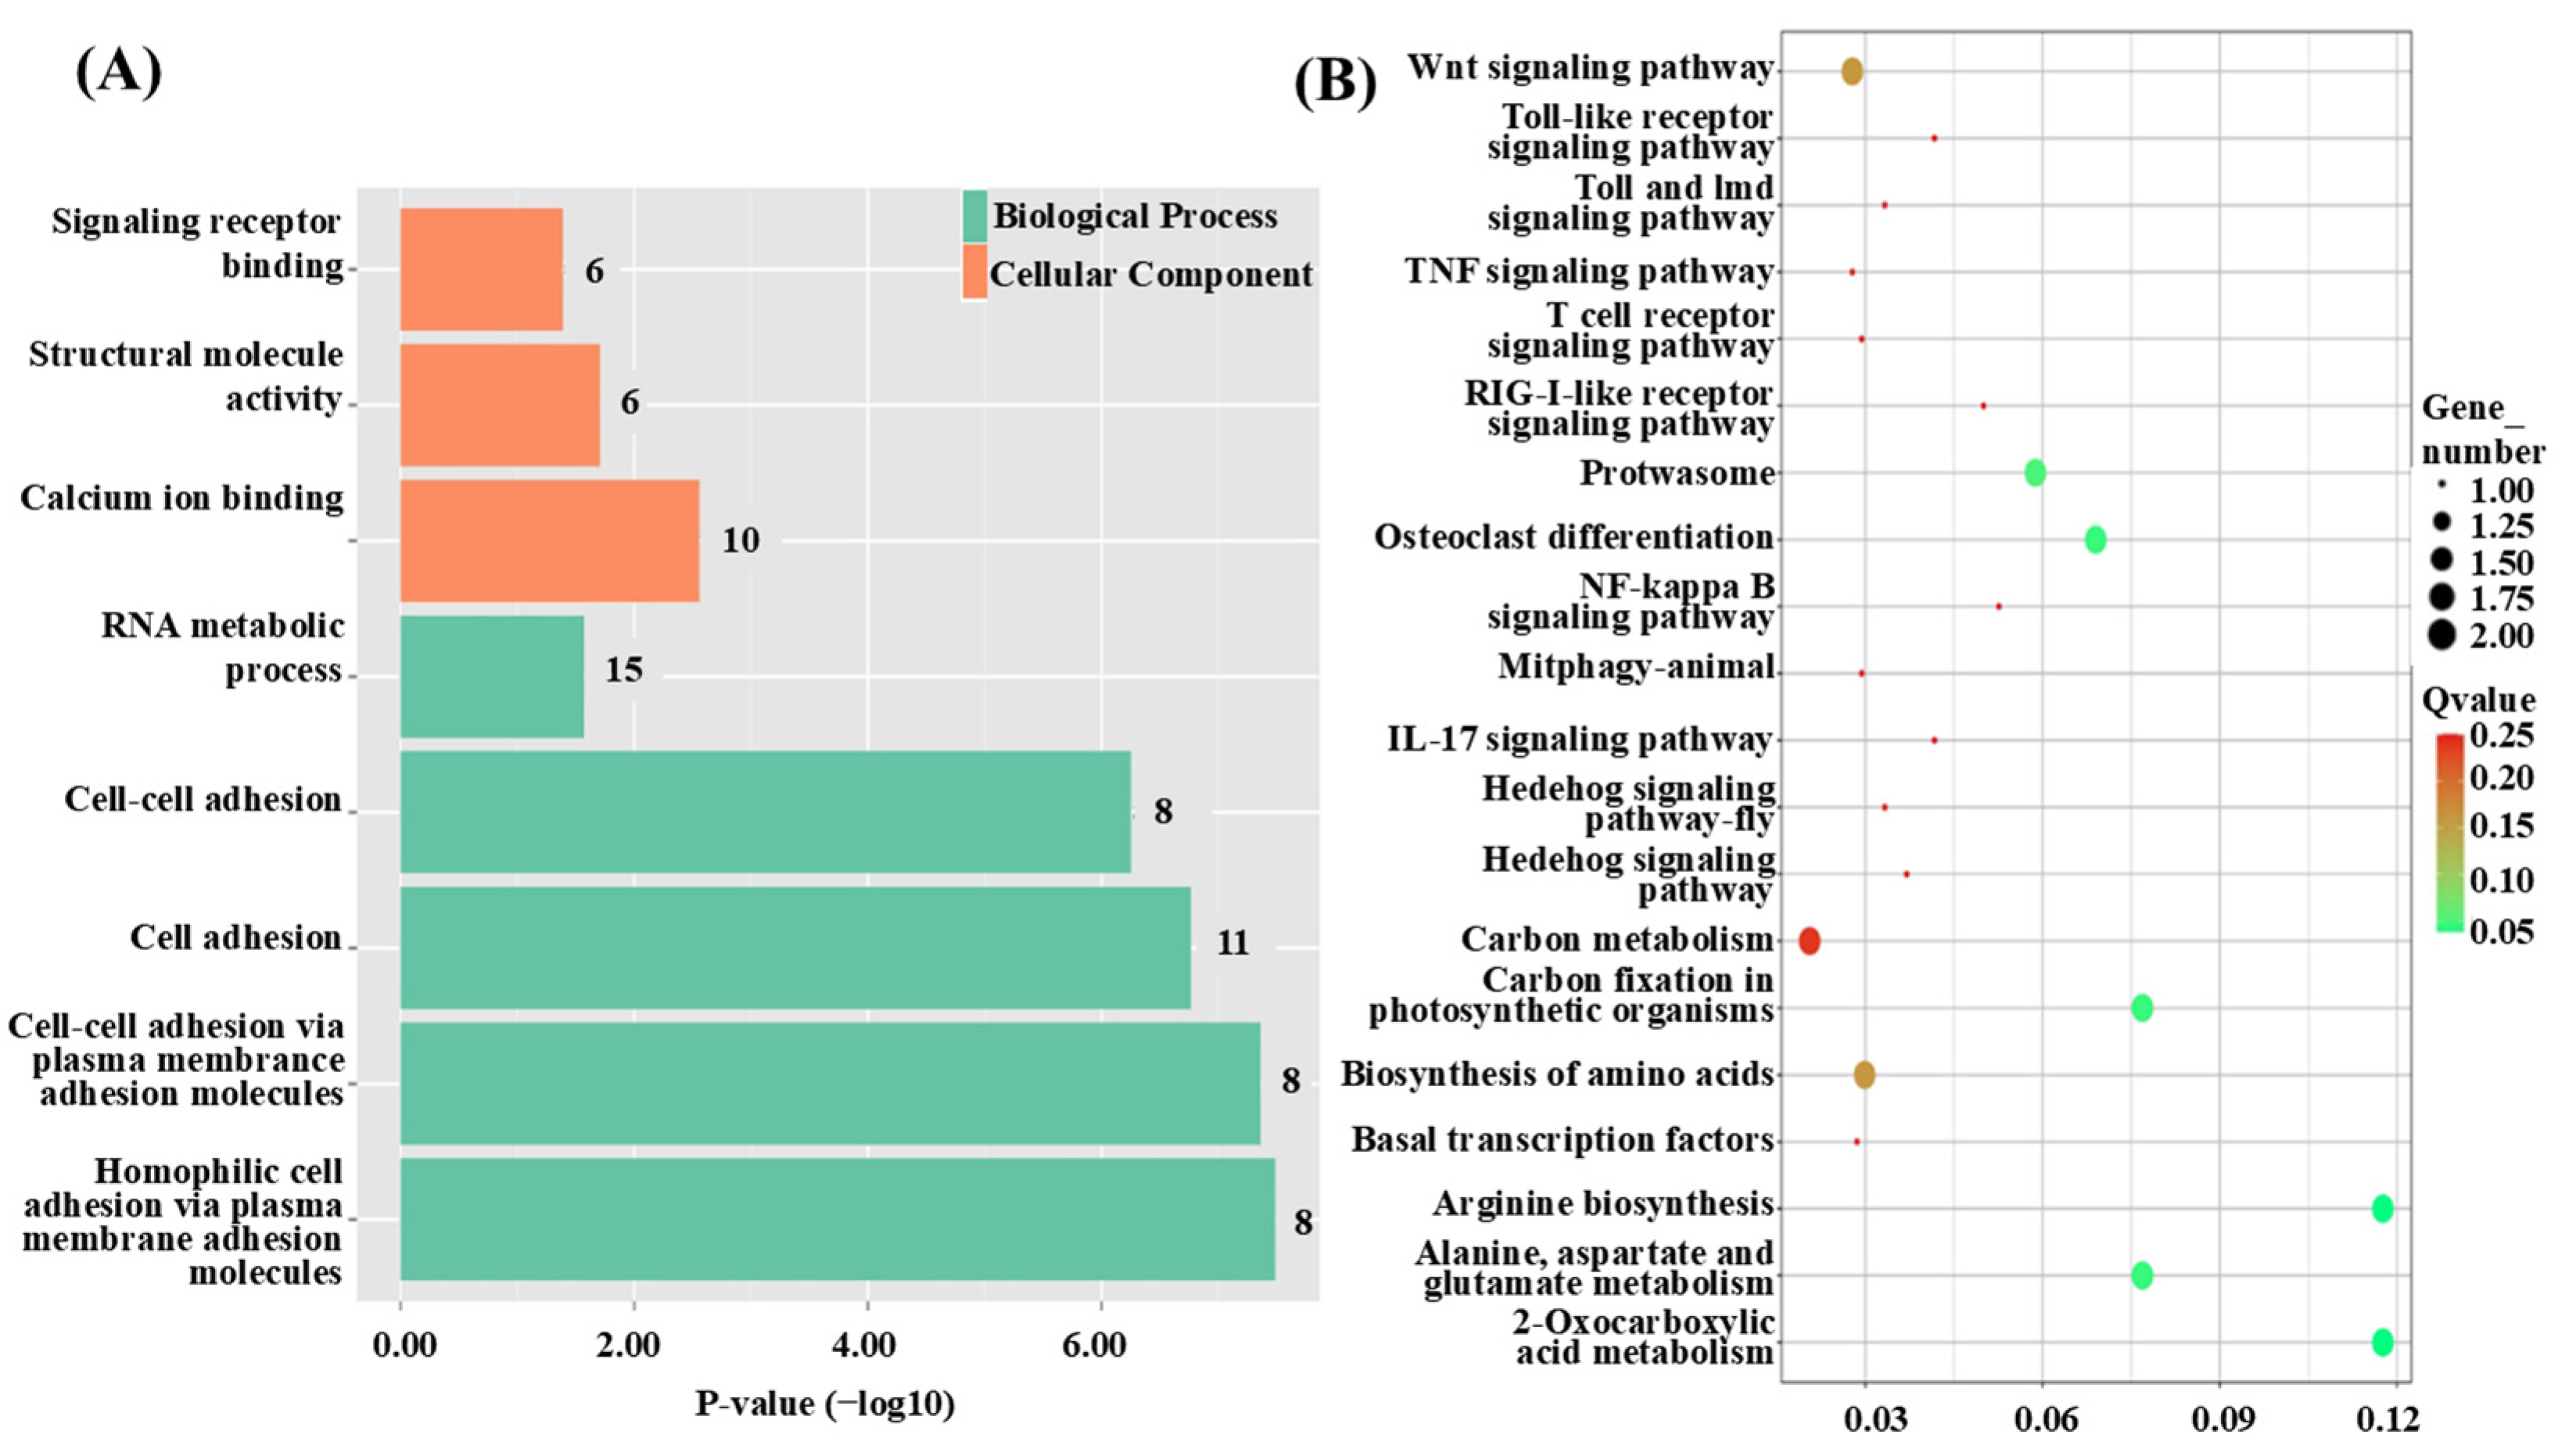
3.3. Functional Annotation of QTL Candidate Genes

To explore the functions and associated pathways of the QTL candidate genes, GO and KEGG enrichment analyses were performed. The GO analysis revealed five significantly enriched terms within the biological process (BP) category, including cell adhesion (GO:0007155) and RNA metabolic process (GO:0016070). In the molecular function (MF) category, three terms were significantly enriched, such as calcium ion binding (GO:0005509) and structural molecule activity (GO:0005198). No significant enrichment was observed in the cellular component (CC) category (Figure 2A). KEGG pathway analysis identified nine significantly enriched pathways, including Brite Hierarchies, Propanoate metabolism, and Transcription machinery (Figure 2B).

3.4. Quality Control of Transcriptome Sequencing Data

Following quality control procedures, low-quality reads from the raw sequencing data were removed, resulting in an average of 50,513,416 (98.25%) clean reads for the big-sized group and 44,737,262 (95.63%) clean reads for the small-sized group. The average Q20 and Q30 values for the big-sized individuals were 98.69% and 96.20%, respectively, while for the small-sized individuals, these values were 98.10% and 95.03%, respectively. After quality control, the clean reads from both groups were mapped to the reference genome of the C. fuscus. On average, 90.47% of the clean reads from the big-sized group and 83.57% from the small-sized group were successfully mapped to the reference genome (Table 2). These results indicate that the sequencing results are of high quality and suitable for subsequent analyses.

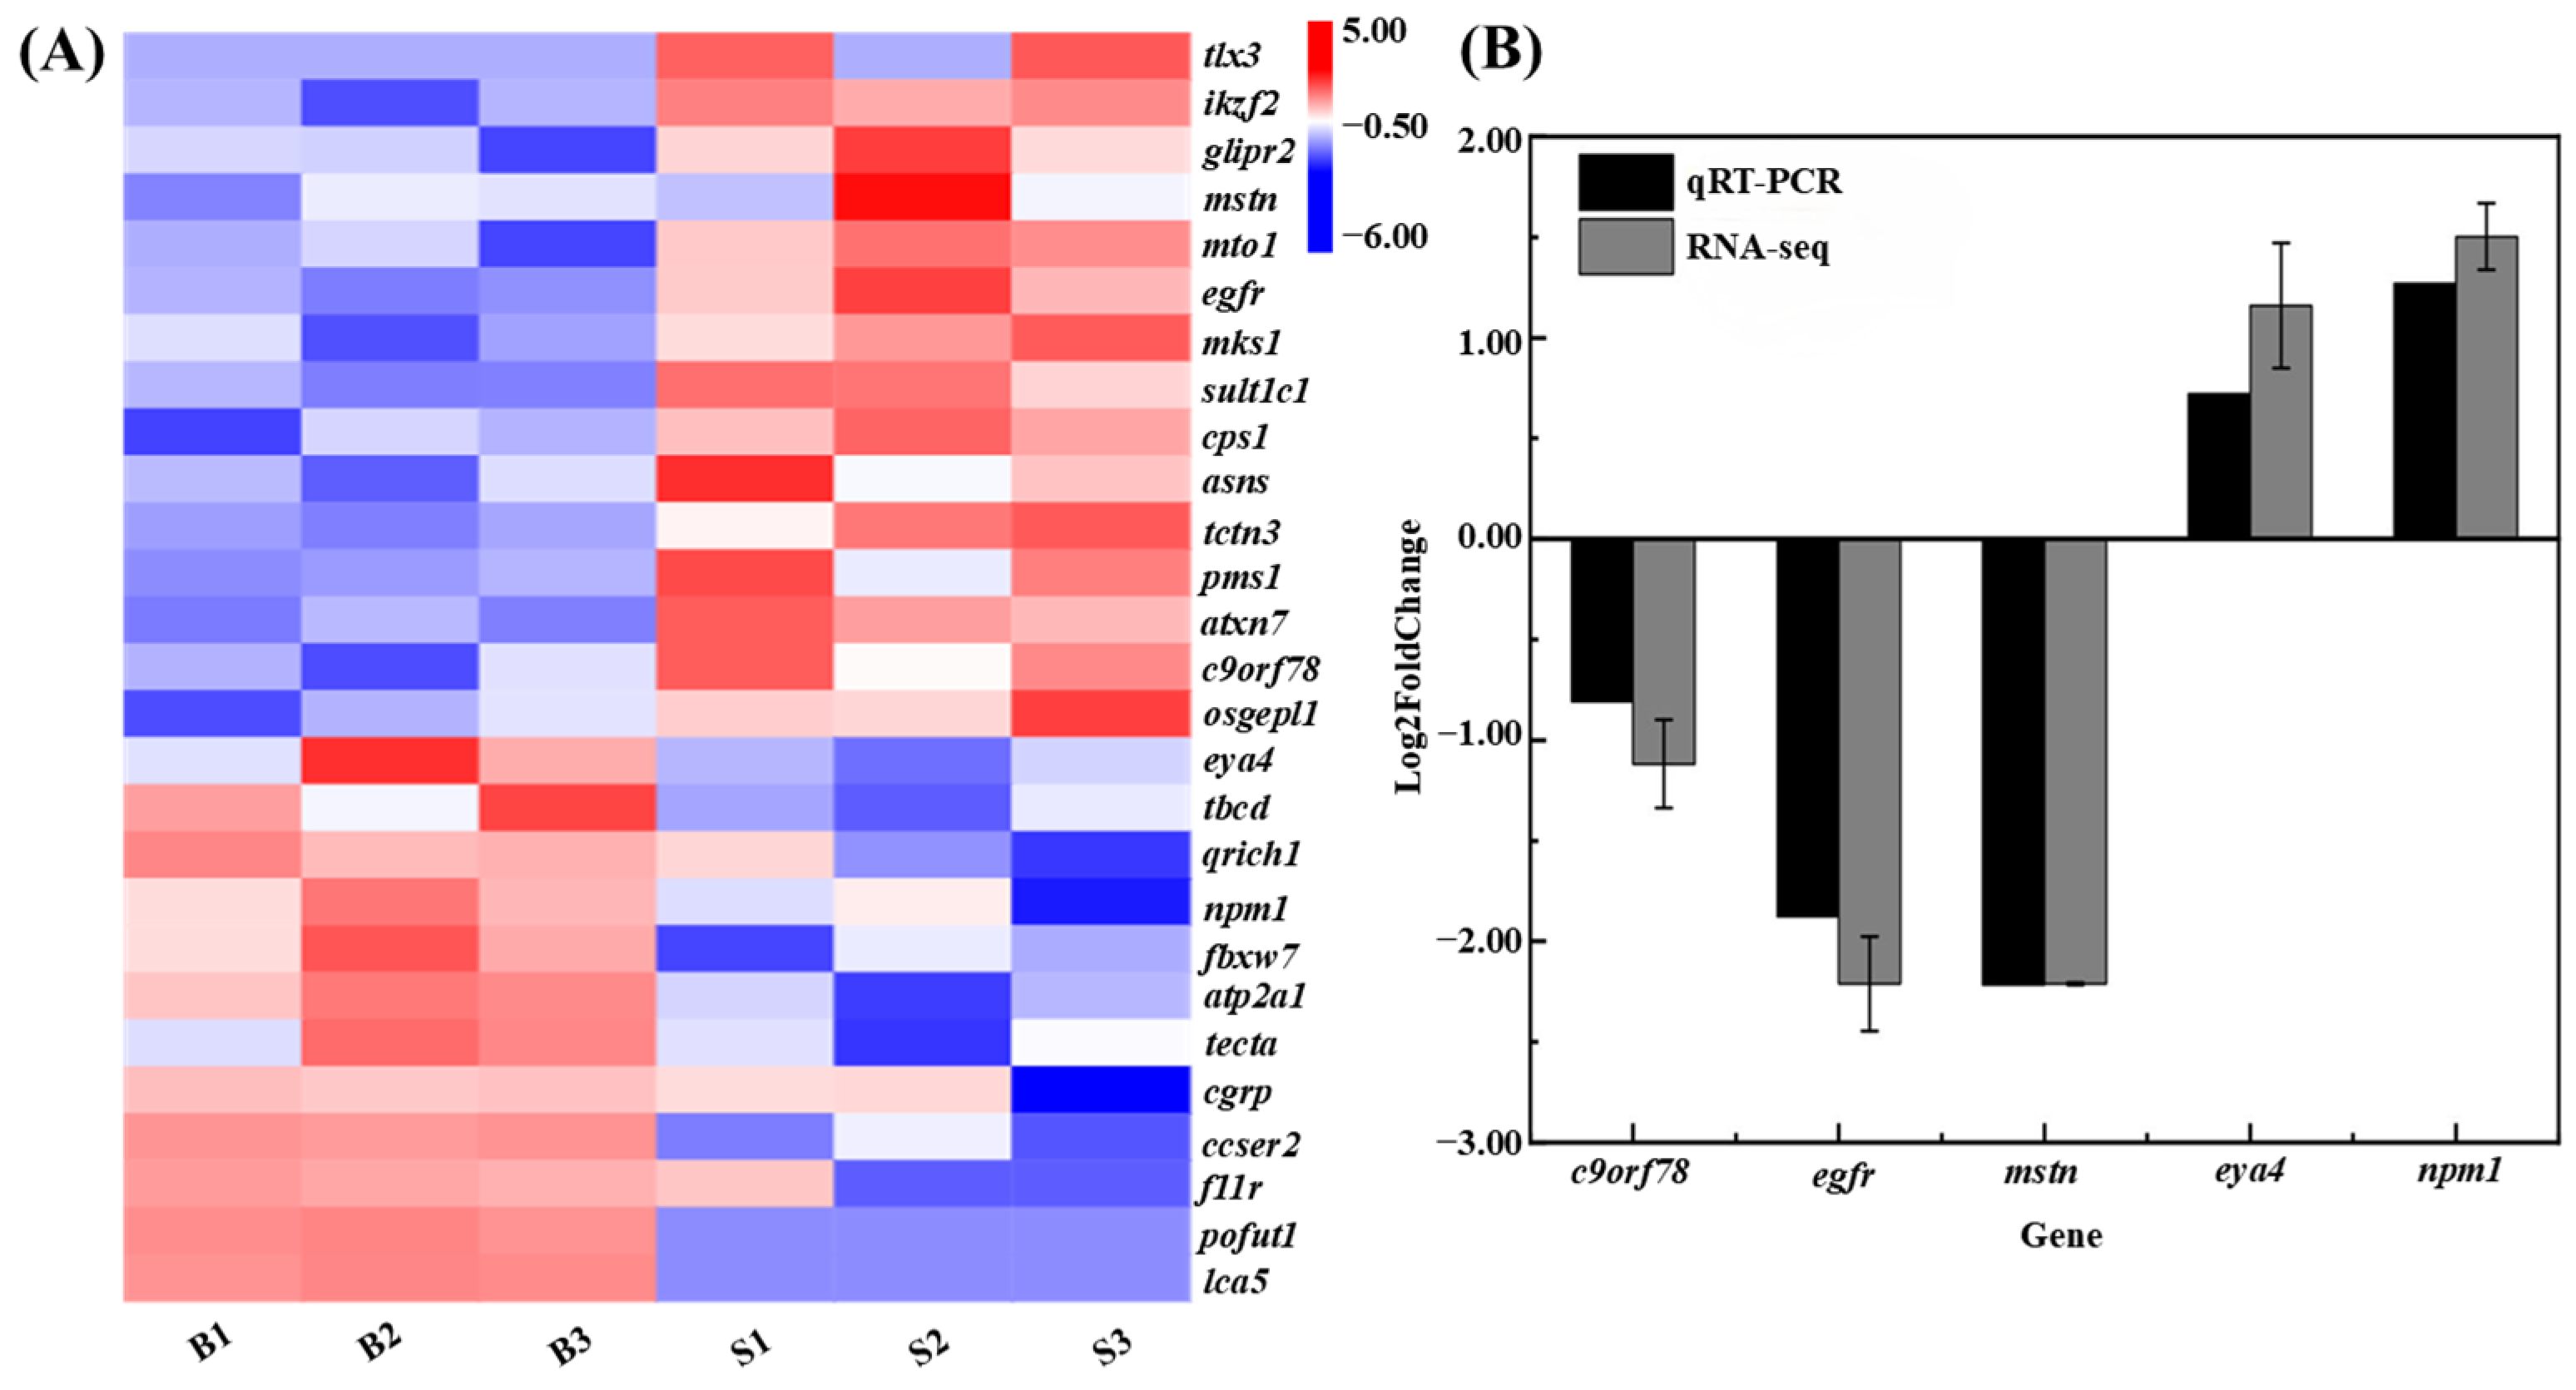
3.5. Differential Gene Expression Analysis Related to Body Size

Gene expression changes in muscle tissue samples from big-sized and small-sized individuals were compared, identifying a total of 3824 differentially expressed genes (DEGs) associated with individual size in C. fuscus. Of these, 2252 genes were upregulated, and 1572 genes were downregulated (p < 0.05 and |log2(fold change) | ≥ 1, Figure 3A). Table 3 presents the top 20 genes ranked by fold change between the big-sized- and small-sized-individual groups.

3.6. Functional Classification of DEGs

To further explore the biological significance of the DEGs, GO and KEGG enrichment analyses were conducted. The GO enrichment analysis revealed the significant enrichment of DEGs in two functional categories, with 94 subcategories identified within the biological process (BP) category and 16 subcategories within the cellular component (CC) category. No significant enrichment was observed in the MF category. The DEGs were significantly enriched in terms such as Envelope (GO:0031975), Mitochondrion (GO:0005739), ATP metabolic process (GO:0046034), and Translation (GO:0006412) (Figure 3B). KEGG pathway analysis indicated that DEGs were significantly enriched in nine pathways, including Carbon Metabolism, 2-Oxocarboxylic Acid Metabolism, and Glycolysis/Gluconeogenesis. Among these pathways, the Biosynthesis of Amino Acids pathway was the most significantly enriched, while the Insulin Signaling pathway had the highest number of enriched DEGs (Figure 3C).

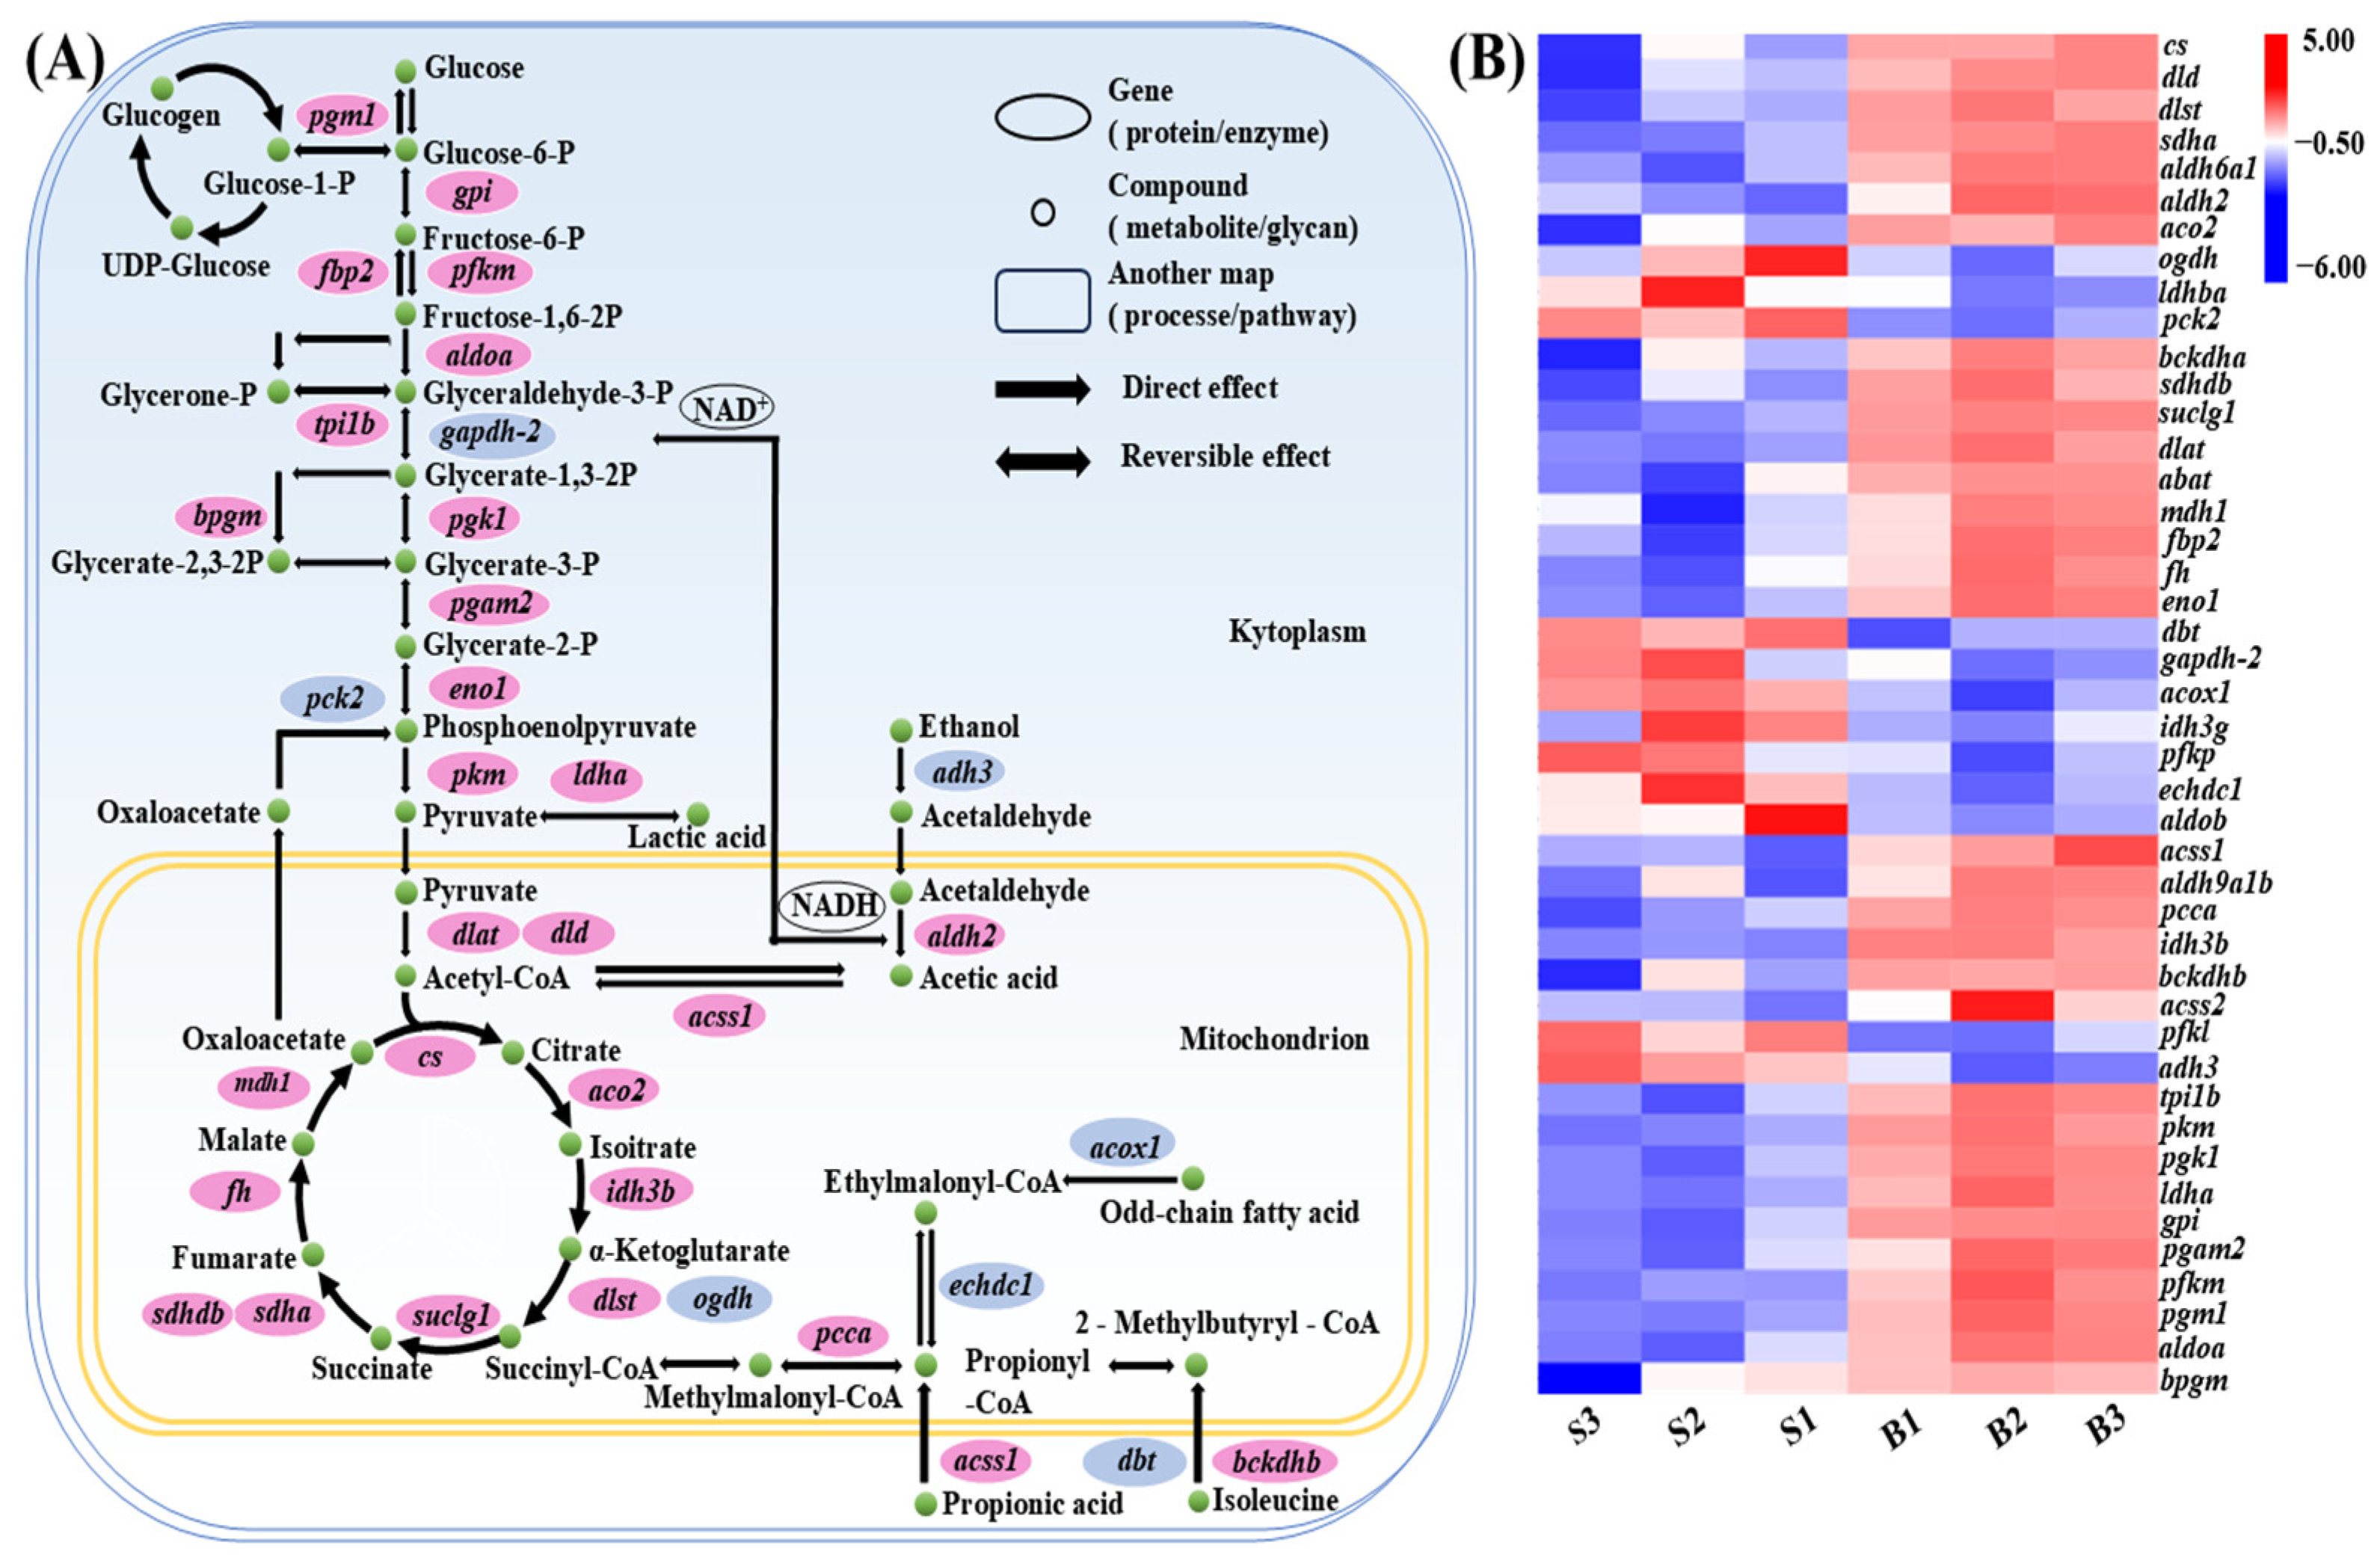
3.7. Carbohydrate Metabolism Pathway Analysis

To investigate the molecular mechanisms underlying size variation in C. fuscus, we examined the expression patterns of key DEGs in major carbohydrate metabolism pathways across the two groups (Figure 4). The analysis revealed that genes involved in glycolysis and the tricarboxylic acid (TCA) cycle, such as glucose-6-phosphate isomerase (gpi), ATP-dependent 6-phosphofructokinase (pfkm), and fructose-1,6-bisphosphatase isozyme 2 (fbp2), were upregulated in the large-sized individuals. Conversely, genes associated with odd-chain fatty acid catabolism, isoleucine catabolism, and ethanol metabolism, including alcohol dehydrogenase class-3 (adh3) and peroxisomal acyl-coenzyme A oxidase 1 (acox1), exhibited higher expression levels in the small-sized individuals.

3.8. Integration of QTL Mapping and Transcriptome Data

By integrating the results of QTL mapping and transcriptome differential expression analysis, we identified 27 candidate genes associated with growth, including epidermal growth factor receptor (egfr), ataxin-7protein 3 (atxn7), glutamine-rich protein 1 (qrich1), and nucleophosmin (npm1) (Table 4). The expression analysis of the 27 growth candidate genes is shown in Figure 5A. To validate the expression patterns of these growth-related candidate genes, we performed qRT-PCR analysis on five randomly selected genes in muscle tissues from both big-sized and small-sized C. fuscus individuals. The expression patterns observed through qRT-PCR were consistent with those from the transcriptome data, confirming the accuracy and reliability of the transcriptome results (Figure 5B).

4. Discussion

Growth traits are critical economic traits in aquaculture species and have garnered considerable attention [34]. While existing studies have offered valuable insights into the regulatory mechanisms of growth genes in fish, the complexity of growth regulation has limited the identification of related genes. Combining transcriptome analysis with QTL mapping offers a promising approach for identifying genes associated with growth traits. Conjoint analyses have already been conducted on the growth traits of various fish species. For instance, in black porgy (Acanthopagrus schlegelii), 42 candidate genes for growth traits were identified through QTL mapping, and two key genes, Magi1 and Tp53inp2, were further pinpointed via transcriptome analysis [35]. Similarly, transcriptome analysis of the muscles and liver of turbot (Scophthalmus maximus) identified 174 growth-related genes, which were subsequently narrowed down to 45 through joint QTL analysis [36]. These studies demonstrate that, unlike standalone QTL mapping, combining it with transcriptome analysis to identify DEGs allows for a more precise selection of candidate genes related to superior growth traits in fish. In this study, we identified QTLs associated with growth in C. fuscus by integrating transcriptome data related to body size, and pinpointed candidate genes and relevant pathways. This work provides a foundation for further investigation into the growth regulatory mechanisms in C. fuscus and offers key data for developing fast-growing strains.

4.1. QTL Mapping of Growth Traits in C. fuscus

Numerous studies have demonstrated that QTL mapping is a primary method for identifying quantitative trait loci and understanding the underlying mechanisms of quantitative traits [37]. One critical metric in QTL mapping is the proportion of variance explained (PVE), which quantifies the extent to which a QTL contributes to phenotypic trait variation. A higher PVE value indicates a greater influence of the QTL on the trait, while a lower PVE suggests a lesser effect, implying that other genetic or environmental factors may also significantly shape the trait [38]. In fish, growth traits are classic quantitative traits, with associated QTLs typically exhibiting relatively low PVE values. For example, mirror carp (9.6–24.2%) [16], crucian carp (Carassius auratus) (PVE, 10.1–13.2%) [39], ussuri catfish (Pseudobagrus ussuriensis) (11.9–20.5%) [40], and dusky kob (Argyrosomus japonicus) (9.3–29.5%) [41] all demonstrate this pattern.
Based on the available genetic map of C. fuscus, this study analyzed eight growth traits using QTL mapping. Except for OD, CPL, and BWI, all other traits were mapped to two or more significant QTL intervals, resulting in the identification of 17 growth-related QTLs. The PVE of these 17 QTLs ranged from 8.00 to 11.90%. These results suggest that growth traits in C. fuscus are complex and influenced by multiple genes. Compared to the major QTLs identified in other fish species, the individual QTLs identified in this study have a relatively smaller impact on growth traits. This could be due to the sample size used in this experiment. Previous studies have observed that as the sample size increases, the PVE values of QTLs tend to decrease [2]. This trend also seems to apply to the growth traits of fish. For instance, in crucian carp and black carp (Mylopharyngodon piceus), QTL mapping was performed using 102 and 128 individuals, respectively, yielding average PVE values of 11.30% and 12.56% [1,39]. In contrast, for studies of red-tail catfish (Hemibagrus wyckioides) and giant grouper, which used 167 and 216 individuals, respectively, the average PVE values were 9.43% and 7.28% [23,42]. This phenomenon may explain the generally lower PVE values observed for QTL in this study. Additionally, the relatively low PVE values may suggest that the growth traits of C. fuscus are influenced by a larger number of small-effect genes. Although the additive effects of a single gene are modest, the cumulative impact of multiple small-effect genes, along with potential non-additive effects such as dominance and epistasis, may significantly affect the phenotype [43,44,45]. Future studies could focus on quantifying the additive and non-additive effects of various QTLs, providing theoretical insights and practical guidance for marker-assisted selection (MAS). Moreover, the QTL intervals for a single growth trait in C. fuscus are more concentrated compared to other fish species. For example, two BW-related QTLs in this study were mapped to LG09 and LG17, while in red-tail catfish, twelve BW-related QTLs were distributed across eight LGs [40], and in crucian carp, eight BW-related QTLs spanned five LGs [39]. Among these 17 growth QTLs, 11 growth QTLs were distributed on LG06, LG09, and LG17. Notably, two overlapping intervals were identified: BW and BWI on LG09 (44.543 cM–45.835 cM), and BW and BL on LG17 (13.520 cM-14.832 cM). These findings indicate that, although growth traits in C. fuscus are regulated by multiple genes, the regulatory genes are mapped to a few major chromosomes. Similar observations have been made in black carp [1] and pikeperch (Sander lucioperca) [46].

4.2. Transcriptome Enrichment Pathways Associated with Body Size in C. fuscus

To further explore the genes associated with the growth of C. fuscus, a comprehensive transcriptome analysis was conducted, identifying 3824 DEGs. Among these, 2252 genes were highly expressed, while 1572 had low expression. The functional roles and biological pathways of these DEGs were examined using GO and KEGG enrichment analyses.
In the GO enrichment analysis, the majority of DEGs were found to be enriched in biological processes (94 out of 110 pathways, 85%), a trend observed in other species as well, such as grass carp (Ctenopharyngodon idella) (42%), black porgy (52%), and Zig-Zag eel (Mastacembelus armatus) (60%) [47,48,49]. These results suggest that DEGs related to biological processes are likely central to the growth rate differences observed among individuals. The most significantly enriched pathways were related to organic metabolism, particularly “pyruvate metabolism” and “ATP metabolism”, consistent with the known biological roles of these genes. Pathways related to ATP precursor synthesis, including “ribonucleoside triphosphate biosynthetic process” and “ATP biosynthesis”, were predominantly enriched in small-sized individuals. In contrast, big-sized individuals exhibited greater enrichment in metabolic pathways for the synthesis of various organic compounds, such as “pyruvate metabolic process” and “regulation of cellular component biosynthesis”. The upregulation of the tricarboxylic acid cycle (TCA cycle) in bigger C. fuscus suggests an enhanced capacity to utilize TCA intermediates for biosynthetic pathways, thus supporting cellular function and homeostasis [50]. Conversely, smaller individuals relied on oxidative phosphorylation to rapidly generate large amounts of ATP, which is crucial for cell proliferation and tissue growth.
KEGG analysis of carbohydrate metabolism pathways revealed that genes related to glycolysis, the TCA cycle, and propionate metabolism were upregulated in bigger individuals, supporting the maintenance of cellular functions and homeostasis [51]. In contrast, smaller individuals showed a greater tendency to convert odd-chain fatty acids and amino acids into TCA cycle intermediates. This observation, consistent with previous studies [52], was supported by the increased expression of key enzymes involved in the catabolism of isoleucine and the β-oxidation of odd-chain fatty acids. These enzymes include acyl-coA oxidase 1 (acox1) [53], the lipoamide acyltransferase component of branched-chain alpha-keto acid dehydrogenase (dbt) [54], and ethylmalonyl-CoA decarboxylase (echdc1) [55], which facilitate the conversion of succinyl-CoA to succinate, releasing GTP [56,57]. This observation highlights the need for rapid energy generation in smaller individuals to support growth and proliferation.

4.3. Identification and Characterization of Growth-Associated Genes in C. fuscus

In this study, we conducted a comprehensive analysis integrating QTL mapping and transcriptome data to identify growth-associated candidate genes in C. fuscus. A total of 27 candidate genes were successfully identified across 17 QTL regions linked to growth traits. Notably, compared to small-sized individuals, several genes including eya4, serca1, f11r, npm1, and tecta were significantly upregulated in big-sized individuals. The eya4 gene, part of the EYA gene family, has been implicated in various biological processes such as organogenesis and cell differentiation [58]. Previous studies have shown that eya4 can influence the development of the zebrafish sensory system by modulating Na+/K ATPase (atp1b2b) activity [59]. Additionally, eya4 has been found to dephosphorylate polo-like kinase 1 (plk1), thereby promoting mitotic progression and enhancing cell differentiation [60]. Similarly, serca1, a key subtype in the SERCA family, is primarily expressed in fast-twitch skeletal muscle and plays a crucial role in transporting Ca2+ from the cytoplasm to the sarcoplasmic reticulum (SR) cavity following muscle contraction, thereby promoting muscle relaxation. Recent studies have shown that serca1 is regulated by Sarcolipin (sln), with this regulation being particularly significant in fast-twitch skeletal muscle [61]. Additionally, serca1 is involved in regulating intracellular calcium ion (Ca2⁺) concentrations during zebrafish embryonic development, influencing left–right asymmetry during embryogenesis. However, the specific downstream effector molecules of serca1 remain unclear, and it is hypothesized that calmodulin (cam) or calmodulin-dependent protein kinase II (camkii) may be involved [62,63]. Other genes such as f11r [64], npm1 [65], and tecta [66] have also been linked to cellular differentiation and organ development. The upregulation of these genes in big-sized individuals suggests their pivotal role in the growth and development of C. fuscus.
In contrast, small-sized individuals exhibited higher expression levels of genes such as mstn, egfr, mto1, ikzf2, and mks1. Mstn, a member of the transforming growth factor-β (TGF-β) superfamily, inhibits muscle growth by targeting myogenic regulatory factors such as myog, myod, and myf5 [67,68]. Additionally, it can influence vertebrate growth by reducing the activity of cyclin-dependent kinase 2 (cdk2) and upregulating p21, a cdk inhibitor, thereby arresting myoblasts in the G1 phase of the cell cycle [69]. Gene knockout studies in comparative olive fish have shown that the disruption of mstn expression can stimulate myoblast proliferation and increase muscle mass, leading to greater fish weight [70,71]. Additionally, egfr plays a critical role during early development in species such as Japanese medaka (Oryzias latipes), where it is involved in cleavage, protocol formation, and organogenesis [72]. Other studies have shown that egfr is also associated with the maturation of zebrafish ovaries. In ovarian tissue, the pi3k/akt pathway mediates the regulation of igf-I on egfr, enhancing egfr expression and phosphorylation. This inhibition of receptor-type tyrosine protein phosphatase kappa (ptprk) activates the egf/egfr signaling pathway, promoting oocyte maturation [73]. The genes mto1 [74], ikzf2 [75], and mks1 [76] are associated with embryonic development and organogenesis.
Previous studies indicate that these genes play key roles in embryonic development, cell differentiation, and proliferation, consistent with enrichment analyses showing a strong association with biological process-related pathways. Notably, a significant distinction was observed: genes upregulated in larger individuals predominantly supported sensory system development, while those upregulated in smaller individuals favored the development of various tissues and organs. This suggests that energy allocation differences, driven by divergent cellular differentiation processes, may underlie the growth and developmental variations observed between C. fuscus individuals [77]. However, further molecular validation, such as gene knockout or knockdown approaches, is needed to clarify the functional roles of candidate genes within the QTL intervals linked to growth traits in C. fuscus. QTL mapping will also be essential for MAS [78]. SNP molecular markers identified in candidate genes will be statistically analyzed and prioritized for population validation. By selecting markers with significant effects on growth and optimizing marker combinations, we aim to enhance the growth performance of C. fuscus across diverse environments.

5. Conclusions

In this study, we conducted QTL mapping for eight growth traits in C. fuscus, identifying 17 growth-related QTLs across eight intervals, which encompassed 162 functional genes. RNA-seq analysis of individuals with different sizes revealed 3824 differentially expressed genes, with the big-sized group showing 2252 highly expressed and 1572 low-expressed genes compared to the small-sized group. By integrating QTL mapping and RNA-seq data, we identified 27 candidate genes, including eya4, serca1, f11r, and npm1. This combined approach offered a more precise list of candidate genes for growth traits in C. fuscus, providing valuable genetic insights to enhance growth performance in this species.

Supplementary Materials

The following supporting information can be downloaded at: https://www.mdpi.com/article/10.3390/ani15121707/s1, Figure S1: Frequency distribution of growth traits in the F1 full-sibling population (N = 200): (A) body weight, (B) body height, (C) body length, (D) body width, (E) orbital diameter, (F) caudal peduncle length, (G) caudal peduncle height, and (H) pre-dorsal length. The vertical axis represents the percentage of individuals within each interval relative to the total population; Table S1: Quantitative real-time PCR (qRT-PCR) primer sequences data; Table S2: Phenotypic data on eight growth trait-related phenotypes from 200 offspring of C. fuscus; Table S3: 162 functional genes identified in the QTL interval for the growth of C. fuscus.

Author Contributions

Conceptualization, methodology, software, visualization, data curation, writing—original draft preparation, Y.Z. (Yian Zhu) and D.Z.; validation, formal analysis, investigation, Y.S. and C.P.; resources, data curation, Y.C., B.Y. and Y.Z. (Yulei Zhang); writing—review and editing, G.L., H.C. and C.T.; supervision, project administration, funding acquisition, C.T. All authors have read and agreed to the published version of the manuscript.

Funding

This research was funded by Guangdong Basic and Applied Basic Research Foundation (2025A1515012346), the Department of Education of Guangdong Province (2023KTSCX042), the Self-financing Project of Guangxi Agricultural Science and Technology (Z2019123), the National College Students Innovation and Entrepreneurship Training Program (202310566002, 202410566002), the Undergraduate Innovation Team Project of Guangdong Ocean University (CXTD2023003), the Youth Science and Technology Innovation Talent of Guangdong TeZhi plan talent (2023TQ07A888), and the Guangdong Provincial Special Fund for Modern Agriculture Industry Technology Innovation Teams (2024CXTD26).

Institutional Review Board Statement

All experimental protocols in this study were conducted in accordance with the standards of the Guangdong Ocean University Animal Research and Ethics Committee (NIH Pub. No.85-23, revised in 1996), approval code: 201903003, approval date: 3 March 2019.

Informed Consent Statement

Informed consent was obtained from all subjects involved in the study.

Data Availability Statement

RNA-Seq data have been deposited in the NCBI database under the project accession number PRJNA1258690.

Acknowledgments

We wish to thank the anonymous reviewers and the editor of the journal for their valuable comments.

Conflicts of Interest

The authors declare no conflicts of interest.

References

  1. Guo, J.; Wang, A.; Mao, S.; Xu, X.; Li, J.; Shen, Y. Construction of High-Density Genetic Linkage Map and QTL Mapping for Growth Performance in Black Carp (Mylopharyngodon piceus). Aquaculture 2022, 549, 737799. [Google Scholar] [CrossRef]
  2. Ashton, D.T.; Ritchie, P.A.; Wellenreuther, M. Fifteen Years of Quantitative Trait Loci Studies in Fish: Challenges and Future Directions. Mol. Ecol. 2017, 26, 1465–1476. [Google Scholar] [CrossRef] [PubMed]
  3. Ndandala, C.B.; Dai, M.; Mustapha, U.F.; Li, X.; Liu, J.; Huang, H.; Li, G.; Chen, H. Current Research and Future Perspectives of GH and IGFs Family Genes in Somatic Growth and Reproduction of Teleost Fish. Aquac. Rep. 2022, 26, 101289. [Google Scholar] [CrossRef]
  4. Hernández-Hernández, J.M.; García-González, E.G.; Brun, C.E.; Rudnicki, M.A. The Myogenic Regulatory Factors, Determinants of Muscle Development, Cell Identity and Regeneration. Semin. Cell Dev. Biol. 2017, 72, 10–18. [Google Scholar] [CrossRef]
  5. Liu, T.; Deng, Y.; Zhang, Z.; Cao, B.; Li, J.; Sun, C.; Hu, Z.; Zhang, J.; Li, J.; Wang, Y. Melanocortin Receptor 4 (MC4R) Signaling System in Nile Tilapia. Int. J. Mol. Sci. 2020, 21, 7036. [Google Scholar] [CrossRef]
  6. Blanco, A.M.; Bertucci, J.I.; Sánchez-Bretaño, A.; Delgado, M.J.; Valenciano, A.I.; Unniappan, S. Ghrelin Modulates Gene and Protein Expression of Digestive Enzymes in the Intestine and Hepatopancreas of Goldfish (Carassius auratus) via the GHS-R1a: Possible Roles of PLC/PKC and AC/PKA Intracellular Signaling Pathways. Mol. Cell. Endocrinol. 2017, 442, 165–181. [Google Scholar] [CrossRef] [PubMed]
  7. Tong, J.; Sun, X. Genetic and Genomic Analyses for Economically Important Traits and Their Applications in Molecular Breeding of Cultured Fish. Sci. China Life Sci. 2015, 58, 178–186. [Google Scholar] [CrossRef]
  8. Rhode, C.; Jackson, T.K.; Le Cordeur, N.S.; Jenkins, S.F.; Sampson, J.E.; Vervalle, J. Performance, Heritability, and Candidate Genes for Growth in Dusky Kob (Argyrosomus japonicus): Implications for Genetic Improvement during Early Phase Domestication. Aquaculture 2023, 577, 739971. [Google Scholar] [CrossRef]
  9. Wei, J.; Chen, Y.; Wang, W. A High-Density Genetic Linkage Map and QTL Mapping for Sex and Growth-Related Traits of Large-Scale Loach (Paramisgurnus dabryanus). Front. Genet. 2019, 10, 1023. [Google Scholar] [CrossRef]
  10. Palaiokostas, C.; Bekaert, M.; Khan, M.G.; Taggart, J.B.; Gharbi, K.; McAndrew, B.J.; Penman, D.J. A Novel Sex-Determining QTL in Nile Tilapia (Oreochromis niloticus). BMC Genom. 2015, 16, 171. [Google Scholar] [CrossRef]
  11. Li, H.L.; Gu, X.H.; Li, B.J.; Chen, C.H.; Lin, H.R.; Xia, J.H. Genome-Wide QTL Analysis Identified Significant Associations Between Hypoxia Tolerance and Mutations in the GPR132 and ABCG4 Genes in Nile Tilapia. Mar. Biotechnol. 2017, 19, 441–453. [Google Scholar] [CrossRef] [PubMed]
  12. Wang, X.; Liu, S.; Jiang, C.; Geng, X.; Zhou, T.; Li, N.; Bao, L.; Li, Y.; Yao, J.; Yang, Y.; et al. Multiple Across-Strain and within-Strain QTLs Suggest Highly Complex Genetic Architecture for Hypoxia Tolerance in Channel Catfish. Mol. Genet. Genom. 2017, 292, 63–76. [Google Scholar] [CrossRef] [PubMed]
  13. Li, B.J.; Zhu, Z.X.; Gu, X.H.; Lin, H.R.; Xia, J.H. QTL Mapping for Red Blotches in Malaysia Red Tilapia (Oreochromis spp.). Mar. Biotechnol. 2019, 21, 384–395. [Google Scholar] [CrossRef] [PubMed]
  14. O’Quin, C.T.; Drilea, A.C.; Conte, M.A.; Kocher, T.D. Mapping of Pigmentation QTL on an Anchored Genome Assembly of the Cichlid Fish, Metriaclima zebra. BMC Genom. 2013, 14, 287. [Google Scholar] [CrossRef]
  15. Lv, W.; Zheng, X.; Kuang, Y.; Cao, D.; Yan, Y.; Sun, X. QTL Variations for Growth-Related Traits in Eight Distinct Families of Common Carp (Cyprinus carpio). BMC Genet. 2016, 17, 65. [Google Scholar] [CrossRef]
  16. Zhang, X.; Li, P.; Hu, G.; Li, C.; Lu, C.; Chao, D. QTL Analysis of Body Weight, Body Length, Body Depth and Body Thickness in Mirror Carp Cyprinus Carpio. Chin. J. Fish. 2023, 36, 1–9. [Google Scholar] [CrossRef]
  17. Rockman, M.V. The Qtn Program and the Alleles that Matter for Evolution: All That’s Gold Does not Glitter. Evolution 2012, 66, 1–17. [Google Scholar] [CrossRef] [PubMed]
  18. Cai, C.; Yang, P.; Shi, Y.; Wang, X.; Chen, G.; Zhang, Q.; Cheng, G.; Kong, W.; Xu, Z. Transcriptomic and Metabolomic Analysis Revealed Potential Mechanisms of Growth and Disease Resistance Dimorphism in Male and Female Common Carp (Cyprinus carpio). Fish Shellfish Immunol. 2025, 158, 110150. [Google Scholar] [CrossRef]
  19. Chen, F.; Ouyang, X.; Liao, Z.; Huang, T.; Tong, G.; Tan, H.; Zhou, M.; Lu, X.; Wei, X.; Yang, X.; et al. Comprehensive Transcriptomic, Proteomic, and Intestinal Microbiota Analyses of Largemouth Bass (Micropterus salmoides) Intestines Reveal New Insights into Immune Responses to Aeromonas Hydrophila Infection. Fish Shellfish Immunol. 2025, 156, 110057. [Google Scholar] [CrossRef]
  20. Salem, M.; Vallejo, R.L.; Leeds, T.D.; Palti, Y.; Liu, S.; Sabbagh, A.; Rexroad, C.E.; Yao, J. RNA-Seq Identifies SNP Markers for Growth Traits in Rainbow Trout. PLoS ONE 2012, 7, e36264. [Google Scholar] [CrossRef]
  21. Ding, W.; Cao, L.; Cao, Z.; Bing, X. Characterization of the Growth-Related Transcriptome in the Liver and Brain of Mandarin Fish (Siniperca chuatsi) through RNA-Seq Analysis. J. Appl. Anim. Res. 2024, 52, 2440045. [Google Scholar] [CrossRef]
  22. Mendez, K.N.; Zuloaga, R.; Valenzuela, C.A.; Bastias-Molina, M.; Meneses, C.; Vizoso, P.; Valdés, J.A.; Molina, A. RNA-Seq Analysis of Compensatory Growth in the Skeletal Muscle of Fine Flounder (Paralichthys adspersus). Aquaculture 2018, 490, 270–280. [Google Scholar] [CrossRef]
  23. Wu, L.; Yang, Y.; Wang, X.; Weng, Z.; Hua, S.; Li, D.; Xia, J.; Liu, X.; Meng, Z. Genome-Wide QTL Mapping and RNA-Seq Reveal the Genetic Variation Influencing Growth Traits in Giant Grouper (Epinephelus lanceolatus). Aquaculture 2023, 563, 738944. [Google Scholar] [CrossRef]
  24. Ma, B.; Liu, Y.; Zhang, X.; Chen, T.; Zhang, L.; Hu, C.; Yu, S.; Chen, G.; Liu, L.; Zhu, J.; et al. Genome-Wide QTL Mapping and RNA-Seq Reveal Genetic Mechanisms behind Discrepant Growth Traits in Pacific Whiteleg Shrimp, Litopenaeus vannamei. Aquaculture 2025, 599, 742084. [Google Scholar] [CrossRef]
  25. Tian, C.; Lin, X.; Zhou, D.; Chen, Y.; Shen, Y.; Ye, M.; Duan, C.; Zhang, Y.; Yang, B.; Deng, S.; et al. A Chromosome-Level Genome Assembly of Hong Kong Catfish (Clarias fuscus) Uncovers a Sex-Determining Region. BMC Genom. 2023, 24, 291. [Google Scholar] [CrossRef]
  26. Chen, Y.; Lin, X.; Zhu, Y.; Zhou, D.; Zhang, Y.; Huang, Y.; Chen, H.; Li, G.; Tian, C. A Time-Course Transcriptome Analysis of Gonads from HongKong Catfish (Clarias fuscus) Reveals Genes and Pathways Associated with Gonadal Development. Aquac. Rep. 2024, 37, 102247. [Google Scholar] [CrossRef]
  27. Anderson, M.J.; Fast, A.W. Temperature and Feed Rate Effects on Chinese Catfish, Clarias Fuscus (Lacepède), Growth. Aquac. Res. 1991, 22, 435–442. [Google Scholar] [CrossRef]
  28. Lin, X.; Tan, J.; Shen, Y.; Yang, B.; Zhang, Y.; Liao, Y.; Wang, P.; Zhou, D.; Li, G.; Tian, C. A High-Density Genetic Linkage Map and QTL Mapping for Sex in Clarias Fuscus. Aquaculture 2022, 561, 738723. [Google Scholar] [CrossRef]
  29. Van, O. MapQTL6, Software for the Mapping of Quantitative Trait Loci in Experimental Population of Diploid Species; Kyazma B.V.: Wageningen, The Netherlands, 2009. [Google Scholar]
  30. Parkhomchuk, D.; Borodina, T.; Amstislavskiy, V.; Banaru, M.; Hallen, L.; Krobitsch, S.; Lehrach, H.; Soldatov, A. Transcriptome Analysis by Strand-Specific Sequencing of Complementary DNA. Nucleic Acids Res. 2009, 37, e123. [Google Scholar] [CrossRef]
  31. Yan, L.; Yang, M.; Guo, H.; Yang, L.; Wu, J.; Li, R.; Liu, P.; Lian, Y.; Zheng, X.; Yan, J.; et al. Single-Cell RNA-Seq Profiling of Human Preimplantation Embryos and Embryonic Stem Cells. Nat. Struct. Mol. Biol. 2013, 20, 1131–1139. [Google Scholar] [CrossRef]
  32. Mortazavi, A.; Williams, B.A.; McCue, K.; Schaeffer, L.; Wold, B. Mapping and Quantifying Mammalian Transcriptomes by RNA-Seq. Nat. Methods 2008, 5, 621–628. [Google Scholar] [CrossRef] [PubMed]
  33. Pertea, M.; Pertea, G.M.; Antonescu, C.M.; Chang, T.-C.; Mendell, J.T.; Salzberg, S.L. StringTie Enables Improved Reconstruction of a Transcriptome from RNA-Seq Reads. Nat. Biotechnol 2015, 33, 290–295. [Google Scholar] [CrossRef] [PubMed]
  34. Valente, L.M.P.; Moutou, K.A.; Conceição, L.E.C.; Engrola, S.; Fernandes, J.M.O.; Johnston, I.A. What Determines Growth Potential and Juvenile Quality of Farmed Fish Species? Rev. Aquac. 2013, 5, S168–S193. [Google Scholar] [CrossRef]
  35. Jia, C.; Meng, Q.; Chen, S.; Sun, R.; Xu, D.; Zhu, F.; Gao, B.; Zhao, J.; Shen, H. Construction of the First High-Density Genetic Linkage Map and QTL Mapping for Growth Traits in Black Seabream (Acanthopagrus schlegelii). Aquaculture 2025, 595, 741588. [Google Scholar] [CrossRef]
  36. Robledo, D.; Fernández, C.; Hermida, M.; Sciara, A.; Álvarez-Dios, J.; Cabaleiro, S.; Caamaño, R.; Martínez, P.; Bouza, C. Integrative Transcriptome, Genome and Quantitative Trait Loci Resources Identify Single Nucleotide Polymorphisms in Candidate Genes for Growth Traits in Turbot. Int. J. Mol. Sci. 2016, 17, 243. [Google Scholar] [CrossRef]
  37. Laghari, M.Y.; Lashari, P.; Zhang, Y.; Sun, X. Identification of Quantitative Trait Loci (QTLs) in Aquaculture Species. Rev. Fish. Sci. Aquac. 2014, 22, 221–238. [Google Scholar] [CrossRef]
  38. Mackay, T.F.C. The Genetic Architecture of Quantitative Traits. Annu. Rev. Genet. 2001, 35, 303–339. [Google Scholar] [CrossRef]
  39. Liu, H.; Fu, B.; Pang, M.; Feng, X.; Yu, X.; Tong, J. A High-Density Genetic Linkage Map and QTL Fine Mapping for Body Weight in Crucian Carp (Carassius auratus) Using 2b-RAD Sequencing. G3 Genes|Genomes|Genet. 2017, 7, 2473–2487. [Google Scholar] [CrossRef]
  40. Zhu, C.; Liu, H.; Pan, Z.; Chang, G.; Wang, H.; Wu, N.; Ding, H.; Yu, X. Construction of a High-Density Genetic Linkage Map and QTL Mapping for Growth Traits in Pseudobagrus ussuriensis. Aquaculture 2019, 511, 734213. [Google Scholar] [CrossRef]
  41. Jackson, T.K.; Rhode, C. A High-Density Genetic Linkage Map and QTL Identification for Growth Traits in Dusky Kob (Argyrosomus japonicus). Aquaculture 2024, 586, 740786. [Google Scholar] [CrossRef]
  42. Zhou, Y.-L.; Wang, Z.-W.; Guo, X.-F.; Wu, J.-J.; Lu, W.-J.; Zhou, L.; Gui, J.-F. Construction of a High-Density Genetic Linkage Map and Fine Mapping of QTLs for Growth and Sex-Related Traits in Red-Tail Catfish (Hemibagrus wyckioides). Aquaculture 2021, 531, 735892. [Google Scholar] [CrossRef]
  43. Barton, N.H.; Keightley, P.D. Understanding Quantitative Genetic Variation. Nat. Rev. Genet. 2002, 3, 11–21. [Google Scholar] [CrossRef] [PubMed]
  44. Besnier, F.; Solberg, M.F.; Harvey, A.C.; Carvalho, G.R.; Bekkevold, D.; Taylor, M.I.; Creer, S.; Nielsen, E.E.; Skaala, Ø.; Ayllon, F.; et al. Epistatic Regulation of Growth in Atlantic Salmon Revealed: A QTL Study Performed on the Domesticated-Wild Interface. BMC Genet. 2020, 21, 13. [Google Scholar] [CrossRef] [PubMed]
  45. Tadmor-Levi, R.; Hulata, G.; David, L. Multiple Interacting QTLs Affect Disease Challenge Survival in Common Carp (Cyprinus carpio). Heredity 2019, 123, 565–578. [Google Scholar] [CrossRef]
  46. Guo, J.; Li, C.; Teng, T.; Shen, F.; Chen, Y.; Wang, Y.; Pan, C.; Ling, Q. Construction of the First High-Density Genetic Linkage Map of Pikeperch (Sander lucioperca) Using Specific Length Amplified Fragment (SLAF) Sequencing and QTL Analysis of Growth-Related Traits. Aquaculture 2018, 497, 299–305. [Google Scholar] [CrossRef]
  47. Lu, X.; Chen, H.; Qian, X.; Gui, J. Transcriptome Analysis of Grass Carp (Ctenopharyngodon idella) between Fast- and Slow-Growing Fish. Comp. Biochem. Physiol. Part D Genom. Proteom. 2020, 35, 100688. [Google Scholar] [CrossRef]
  48. Lin, Z.; Zhang, Z.; Solberg, M.F.; Chen, Z.; Wei, M.; Zhu, F.; Jia, C.; Meng, Q.; Zhang, Z. Comparative Transcriptome Analysis of Mixed Tissues of Black Porgy (Acanthopagrus schlegelii) with Differing Growth Rates. Aquac. Res. 2021, 52, 5800–5813. [Google Scholar] [CrossRef]
  49. Yang, J.; Lu, B.; Yu, Z.; Zhang, L.; Chen, Y.; Chen, Z.; Han, C.; Shu, H. Multiple Tissues Transcriptome of Zig-Zag Eel (Mastacembelus armatus) with Different Growth Rates. Animals 2024, 14, 248. [Google Scholar] [CrossRef]
  50. Wellen, K.E.; Hatzivassiliou, G.; Sachdeva, U.M.; Bui, T.V.; Cross, J.R.; Thompson, C.B. ATP-Citrate Lyase Links Cellular Metabolism to Histone Acetylation. Science 2009, 324, 1076–1080. [Google Scholar] [CrossRef]
  51. Kleiber, M. Body Size and Metabolic Rate. Physiol. Rev. 1947, 27, 511–541. [Google Scholar] [CrossRef]
  52. Tocher, D.R. Metabolism and Functions of Lipids and Fatty Acids in Teleost Fish. Rev. Fish. Sci. 2003, 11, 107–184. [Google Scholar] [CrossRef]
  53. Varanasi, U.; Chu, R.; Chu, S.; Espinosa, R.; LeBeau, M.M.; Reddy, J.K. Isolation of the Human Peroxisomal Acyl-CoA Oxidase Gene: Organization, Promoter Analysis, and Chromosomal Localization. Proc. Natl. Acad. Sci. USA 1994, 91, 3107–3111. [Google Scholar] [CrossRef] [PubMed]
  54. Patel, M.S.; Roche, T.E. Molecular Biology and Biochemistry of Pyruvate Dehydrogenase Complexes. FASEB J. 1990, 4, 3224–3233. [Google Scholar] [CrossRef]
  55. Linster, C.L.; Noël, G.; Stroobant, V.; Vertommen, D.; Vincent, M.-F.; Bommer, G.T.; Veiga-da-Cunha, M.; Van Schaftingen, E. Ethylmalonyl-CoA Decarboxylase, a New Enzyme Involved in Metabolite Proofreading. J. Biol. Chem. 2011, 286, 42992–43003. [Google Scholar] [CrossRef] [PubMed]
  56. Panov, A.V.; Mayorov, V.I.; Dikalov, S.I. Role of Fatty Acids β-Oxidation in the Metabolic Interactions Between Organs. Int. J. Mol. Sci. 2024, 25, 12740. [Google Scholar] [CrossRef] [PubMed]
  57. Trefely, S.; Lovell, C.D.; Snyder, N.W.; Wellen, K.E. Compartmentalised Acyl-CoA Metabolism and Roles in Chromatin Regulation. Mol. Metab. 2020, 38, 100941. [Google Scholar] [CrossRef]
  58. Modrell, M.S.; Baker, C.V.H. Evolution of Electrosensory Ampullary Organs: Conservation of Eya4 Expression during Lateral Line Development in Jawed Vertebrates. Evol. Dev. 2012, 14, 277–285. [Google Scholar] [CrossRef]
  59. Wang, L.; Sewell, W.F.; Kim, S.D.; Shin, J.T.; MacRae, C.A.; Zon, L.I.; Seidman, J.G.; Seidman, C.E. Eya4 Regulation of Na+/K+-ATPase Is Required for Sensory System Development in Zebrafish. Development 2008, 135, 3425–3434. [Google Scholar] [CrossRef]
  60. Nelson, C.B.; Rogers, S.; Roychoudhury, K.; Tan, Y.S.; Atkinson, C.J.; Sobinoff, A.P.; Tomlinson, C.G.; Hsu, A.; Lu, R.; Dray, E.; et al. The Eyes Absent Family Members EYA4 and EYA1 Promote PLK1 Activation and Successful Mitosis through Tyrosine Dephosphorylation. Nat. Commun. 2024, 15, 1385. [Google Scholar] [CrossRef]
  61. Stammers, A.N.; Susser, S.E.; Hamm, N.C.; Hlynsky, M.W.; Kimber, D.E.; Kehler, D.S.; Duhamel, T.A. The Regulation of Sarco (Endo)Plasmic Reticulum Calcium-ATPases (SERCA). Can. J. Physiol. Pharmacol. 2015, 93, 843–854. [Google Scholar] [CrossRef]
  62. Abdel-Razek, O.; Marzouk, A.; MacKinnon, M.; Guy, E.T.; Pohar, S.A.; Zhushma, E.; Liu, J.; Sia, I.; Gokey, J.J.; Tay, H.G.; et al. Calcium Signaling Mediates Proliferation of the Precursor Cells That Give Rise to the Ciliated Left-Right Organizer in the Zebrafish Embryo. Front. Mol. Biosci. 2023, 10, 1292076. [Google Scholar] [CrossRef] [PubMed]
  63. Nakamura, T.; Hamada, H. Left-Right Patterning: Conserved and Divergent Mechanisms. Development 2012, 139, 3257–3262. [Google Scholar] [CrossRef]
  64. Ebnet, K. Junctional Adhesion Molecules (JAMs): Cell Adhesion Receptors with Pleiotropic Functions in Cell Physiology and Development. Physiol. Rev. 2017, 97, 1529–1554. [Google Scholar] [CrossRef]
  65. Wu, N.; Li, C.; Gui, J. Molecular Characterization and Functional Commonality of Nucleophosmin/Nucleoplasmin in Two Cyprinid Fish. Biochem. Genet. 2009, 47, 749–762. [Google Scholar] [CrossRef] [PubMed]
  66. Stooke-Vaughan, G.A.; Obholzer, N.D.; Baxendale, S.; Megason, S.G.; Whitfield, T.T. Otolith Tethering in the Zebrafish Otic Vesicle Requires Otogelin and α-Tectorin. Development 2015, 142, 1137–1145. [Google Scholar] [CrossRef]
  67. Fuentes, E.N.; Valdés, J.A.; Molina, A.; Björnsson, B.T. Regulation of Skeletal Muscle Growth in Fish by the Growth Hormone—Insulin-like Growth Factor System. Gen. Comp. Endocrinol. 2013, 192, 136–148. [Google Scholar] [CrossRef] [PubMed]
  68. Joulia, D.; Bernardi, H.; Garandel, V.; Rabenoelina, F.; Vernus, B.; Cabello, G. Mechanisms Involved in the Inhibition of Myoblast Proliferation and Differentiation by Myostatin. Exp. Cell Res. 2003, 286, 263–275. [Google Scholar] [CrossRef]
  69. Thomas, M.; Langley, B.; Berry, C.; Sharma, M.; Kirk, S.; Bass, J.; Kambadur, R. Myostatin, a Negative Regulator of Muscle Growth, Functions by Inhibiting Myoblast Proliferation. J. Biol. Chem. 2000, 275, 40235–40243. [Google Scholar] [CrossRef]
  70. Coogan, M.; Alston, V.; Su, B.; Khalil, K.; Elaswad, A.; Khan, M.; Simora, R.M.C.; Johnson, A.; Xing, D.; Li, S.; et al. CRISPR/Cas-9 Induced Knockout of Myostatin Gene Improves Growth and Disease Resistance in Channel Catfish (Ictalurus punctatus). Aquaculture 2022, 557, 738290. [Google Scholar] [CrossRef]
  71. Zhong, Z.; Niu, P.; Wang, M.; Huang, G.; Xu, S.; Sun, Y.; Xu, X.; Hou, Y.; Sun, X.; Yan, Y.; et al. Targeted Disruption of Sp7 and Myostatin with CRISPR-Cas9 Results in Severe Bone Defects and More Muscular Cells in Common Carp. Sci. Rep. 2016, 6, 22953. [Google Scholar] [CrossRef]
  72. Boomsma, R.A.; Scott, H.; Walters, K. Immunocytochemical Localization of Epidermal Growth Factor Receptor in Early Embryos of the Japanese Medaka Fish (Oryzias latipes). Histochem. J. 2001, 33, 37–42. [Google Scholar] [CrossRef] [PubMed]
  73. Xie, L.; Tang, Q.; Yang, L.; Chen, L. Insulin-like Growth Factor I Promotes Oocyte Maturation through Increasing the Expression and Phosphorylation of Epidermal Growth Factor Receptor in the Zebrafish Ovary. Mol. Cell. Endocrinol. 2016, 419, 198–207. [Google Scholar] [CrossRef] [PubMed]
  74. Zhang, Q.; He, X.; Yao, S.; Lin, T.; Zhang, L.; Chen, D.; Chen, C.; Yang, Q.; Li, F.; Zhu, Y.-M.; et al. Ablation of Mto1 in Zebrafish Exhibited Hypertrophic Cardiomyopathy Manifested by Mitochondrion RNA Maturation Deficiency. Nucleic Acids Res. 2021, 49, 4689–4704. [Google Scholar] [CrossRef] [PubMed]
  75. Fan, Y.; Lu, D. The Ikaros Family of Zinc-Finger Proteins. Acta Pharm. Sin. B 2016, 6, 513–521. [Google Scholar] [CrossRef]
  76. Weatherbee, S.D.; Niswander, L.A.; Anderson, K.V. A Mouse Model for Meckel Syndrome Reveals Mks1 Is Required for Ciliogenesis and Hedgehog Signaling. Hum. Mol. Genet. 2009, 18, 4565–4575. [Google Scholar] [CrossRef]
  77. Kozłowski, J.; Konarzewski, M.; Czarnoleski, M. Coevolution of Body Size and Metabolic Rate in Vertebrates: A Life-history Perspective. Biol. Rev. 2020, 95, 1393–1417. [Google Scholar] [CrossRef]
  78. Eze, F. Marker-Assisted Selection in Fish: A Review. Asian J. Fish. Aquat. Res. 2019, 3, 1–11. [Google Scholar] [CrossRef]
Figure 1. LOD scores along the 28 linkage groups for the variations in eight growth-related traits in C. fuscus. The horizontal axis represents the positions of the linkage groups, while the vertical axis shows the corresponding LOD values. The red dashed horizontal line indicates the LOD significance threshold of 3.5 for the linkage population.
Animals 15 01707 g001
Figure 2. Functional enrichment analysis of QTL intervals for growth traits in C. fuscus. (A) Cluster diagram of GO enrichment analysis for QTL intervals associated with growth traits. The color of the bars indicates the gene enrichment category, while the bar length represents the significance level of gene expression. (B) Bubble plot of KEGG enrichment analysis for QTL intervals related to growth traits. The size of the circles reflects the number of genes, and the color of the circles indicates the significance level of gene expression.
Animals 15 01707 g002
Figure 3. Transcriptional profiles of big-sized and small-sized groups for growth traits in C. fuscus. (A) Differentially expressed genes between big-sized and small-sized groups. (B) Analysis of the top 20 enriched GO terms in “Biological Processes” and “Cellular Components” based on adjusted p-values. The color of the bars indicates the gene enrichment category, and the bar length represents the significance level of gene expression. (C) KEGG pathway enrichment analysis of the top 20 adjusted p-values. The size of the circles represents the number of genes, and the color indicates the significance level of gene expression.
Animals 15 01707 g003
Figure 4. (A) Carbohydrate metabolism pathways in muscle tissue of C. fuscus (partial). Red indicates upregulated gene expression in big-sized individuals, while blue indicates upregulated gene expression in small-sized individuals. (B) Hierarchical clustering analysis of differentially expressed genes (DEGs) in carbohydrate metabolism pathways between big-sized and small-sized groups.
Animals 15 01707 g004
Figure 5. (A) Hierarchical clustering analysis of growth candidate genes jointly analyzed by QTL and RNA-seq. Red indicates upregulated gene expression, while blue indicates downregulated gene expression. (B) Comparative analysis of qRT-PCR results and RNA-seq data.
Animals 15 01707 g005
Table 1. QTL mapping results for growth traits in C. fuscus using the composite interval mapping method.
TraitQTLLinkage GroupMarking Interval (cM)Peak Marker (cM)LODPVE (%)LOD Peak (cM)Corresponding Markers for LOD PeaksCandidate Gene
BWqBW-1LG0941.931–45.835np273.9108.7044.543LG9 6545823
qBW-2LG1713.52–17.098np12404.2809.5014.832LG17 28458728slc4a1
BLqBL-3LG0982.998–85.093lm554.3509.8083.615LG9 13097329
qBL-4LG1711.779–14.832lm11443.5108.0013.520LG17 28458720slc4a1
CPHqCPH-5LG06184.207–186.967lm32443.7308.30186.516LG6 4577776pgap1
qCPH-6LG07128.571–129.622lm34345.44011.90128.590LG7 8175232
qCPH-7LG1324.138–31.262np6714.0609.0026.118LG13 30699773ltk
qCPH-8LG205.037–6.976lm16394.1109.105.619LG20 1586316
CPLqCPL-9LG06102.507–103.569np33593.7909.50102.644LG6 22085749pdk1
ODqOD-10LG14132.742–134.846hk2573.5808.00134.365LG14 25875874qrich1
PDLqPDL-11LG0977.872–80.447lm523.6108.1079.160LG9 12492904pp2a
qPDL-12LG172.533–6.695np12434.4009.805.627LG17 29429338mto1
qPDL-13LG18112.055–115.500lm12304.58010.20112.554LG18 25096181
BWIqBWI-14LG0944.543–46.478np283.6308.1045.835LG9 6720412
BHqBH-15LG0621.046–22.095np34103.5008.0021.431LG6 36044360cps
qBH-16LG0641.649–44.768np33964.2209.6041.702LG6 34731920
qBH-17LG07134.41–134.773lm34283.5508.10134.410LG7 7360877
Table 2. Summary of transcriptome data generated from C. fuscus samples.
SampleRaw ReadsClean ReadsClean Read Rate (%)Total MapTotal Map Rate (%)Q20Q30
S149,640,72047,460,18895.6141,564,09687.5898.1695.10
S246,547,23444,737,26296.1135,866,63480.1798.1295.23
S342,787,64440,724,20695.1833,787,63182.9798.0194.76
B151,865,13250,973,77098.3846,109,51190.4698.6195.99
B250,052,99049,099,29898.0943,891,23289.3998.7696.40
B352,370,04851,467,18098.2847,125,92891.5798.7196.22
Table 3. The top 20 genes in the transcriptome associated with body size in C. fuscus.
Gene IDGene NameGene Annotationlog2 (FC)
cfu_9G0006470trim32E3 ubiquitin-protein ligase TRIM329.534
cfu_15G0008560bloc-1Biogenesis of lysosome-related organelles complex 19.487
cfu_16G0005300wwtr1WW domain-containing transcription regulator protein 18.941
cfu_26G0005640scfd2Sec1 family domain-containing protein 28.833
cfu_1G0009900nipsnap3aProtein NipSnap homolog 3A8.720
cfu_27G0004410camlgGuided entry of tail-anchored protein factor8.636
cfu_10G0006000slc16a4Monocarboxylate transporter 58.621
cfu_26G0004610atraidAll-trans retinoic acid-induced differentiation factor8.559
cfu_27G0003260efemp2EGF-containing fibulin-like extracellular matrix protein 28.472
cfu_5G0009050aadacArylacetamide deacetylase8.306
cfu_3G0006820rims4Regulating synaptic membrane exocytosis protein 4−6.820
cfu_9G0008290shc3SHC-transforming protein 3−6.933
cfu_6G0004030lpa1High-affinity lysophosphatidic acid receptor−6.988
cfu_15G0007480nos2Nitric oxide synthase−7.002
cfu_3G0009150tcf23Transcription factor 23−7.015
cfu_14G0005780hrh1Histamine H1 receptor−7.032
cfu_4G0003010apoc-1Apolipoprotein C-I−7.104
cfu_14G0006580chiaAcidic mammalian chitinase−7.329
cfu_11G0001850fgfbp2Fibroblast growth factor-binding protein 2−7.474
cfu_22G0000210itlnIntelectin−7.841
Table 4. Candidate genes associated with growth in C. fuscus identified based on QTL mapping and transcriptome analysis.
Gene IDGene NameGene Annotationlog2 (FC)
cfu_6G0008310calcrlacalcitonin gene-related peptide type 1 receptor isoform X12.397
cfu_6G0008340wdr75WD repeat-containing protein 751.554
cfu_6G0008350asnsd1asparagine synthetase domain-containing protein 1−1.380
cfu_6G0008380osgepl1probable tRNA N6-adenosine threonylcarbamoyltransferase−1.102
cfu_6G0008410pms1PMS1 protein homolog 1−1.197
cfu_6G0008420mstnbmyostatin−2.353
cfu_6G0008440pofut2GDP-fucose protein O-fucosyltransferase 26.582
cfu_6G0008510ikzf2IKAROS Family Zinc Finger 2−2.744
cfu_6G0008520egfrepidermal growth factor receptor−2.210
cfu_6G0008530cps1carbamoyl-phosphate synthase−1.581
cfu_9G0003920c9orf78telomere length and silencing protein 1 homolog−1.118
cfu_9G0003990tectaalpha-tectorin2.098
cfu_9G0004000tbceltubulin-specific chaperone cofactor E-like protein1.174
cfu_9G0004050f11rjunctional adhesion molecule A4.879
cfu_9G0003810glipr2Golgi-associated plant pathogenesis-related protein 1−2.428
cfu_9G0002330mks1Meckel syndrome type 1 protein−1.804
cfu_14G0007230qrich1glutamine-rich protein 11.404
cfu_17G0007930atxn7l3ataxin-7protein 3−1.171
cfu_17G0008220mto1protein MTO1 homolog−2.294
cfu_17G0008240tctn3tectonic-3−1.298
cfu_17G0008260sult1c1sulfotransferase family cytosolic 1B member 1−1.707
cfu_17G0008270atp2a1sarcoplasmic/endoplasmic reticulum calcium ATPase 11.895
cfu_17G0008530ccser2serine-rich coiled-coil domain-containing protein 22.420
cfu_18G0007570lca5lebercilin7.172
cfu_18G0007610eya4eyes absent homolog 4 isoform X21.161
cfu_20G0000670tlx3T-cell leukemia homeobox protein 3−6.172
cfu_20G0000680npm1nucleophosmin1.503
Disclaimer/Publisher’s Note: The statements, opinions and data contained in all publications are solely those of the individual author(s) and contributor(s) and not of MDPI and/or the editor(s). MDPI and/or the editor(s) disclaim responsibility for any injury to people or property resulting from any ideas, methods, instructions or products referred to in the content.

