Simple Summary
In this study, bioinformatics approaches were used to better understand the genetic architecture of internal organ weights in three-way crossbred commercial pigs and to map genetic markers and genes. For this purpose, we used single-trait and multi-trait genome-wide association studies (GWASs) followed by a haplotype block analysis. We explored the key genetic markers and genes from the internal organ weight genome-wide association study results of three-way crossbred commercial pigs. In this manner, five genes, TPK1, POU6F2, PBX3, UNC5C, and BMPR1B, were defined as central in affecting internal organ weight in pigs. Moreover, APK1, ANO6, and UNC5C were identified to be pleiotropic in multi-trait GWASs. These results can be applied to various types of genomic studies of pigs.
Abstract
Internal organ weight is an essential indicator of growth status as it reflects the level of growth and development in pigs. However, the associated genetic architecture has not been well explored because phenotypes are difficult to obtain. Herein, we performed single-trait and multi-trait genome-wide association studies (GWASs) to map the genetic markers and genes associated with six internal organ weight traits (including heart weight, liver weight, spleen weight, lung weight, kidney weight, and stomach weight) in 1518 three-way crossbred commercial pigs. In summation, single-trait GWASs identified a total of 24 significant single- nucleotide polymorphisms (SNPs) and 5 promising candidate genes, namely, TPK1, POU6F2, PBX3, UNC5C, and BMPR1B, as being associated with the six internal organ weight traits analyzed. Multi-trait GWAS identified four SNPs with polymorphisms localized on the APK1, ANO6, and UNC5C genes and improved the statistical efficacy of single-trait GWASs. Furthermore, our study was the first to use GWASs to identify SNPs associated with stomach weight in pigs. In conclusion, our exploration of the genetic architecture of internal organ weights helps us better understand growth traits, and the key SNPs identified could play a potential role in animal breeding programs.
1. Introduction
Body weight, which can reflect growth performance and thus affect economic efficiency, has attracted a lot of attention in animal breeding programs. The body weight of cattle is the sum of various elements, including fat weight, internal organ weight, muscle weight, and bone weight, among others. Of these components, internal organ weight constitutes 14% of the total body weight of cattle [1]. The weight and size of an organ are salient features that serve as dependable predictors of its developmental progression, wherein an augmented organ mass typically alludes to a heightened degree of maturation. Accelerated organ development leads to a smoother coordination of internal organs during vital biological processes such as oxygen transport, blood circulation, lipid metabolism, and digestion. This refinement of these processes can positively impact growth and economic traits. Previous studies have shown that the internal organ weights of crossbred steer calves are strongly correlated with carcass growth rate [2]. Moreover, in humans, internal organ weights have been shown to be positively correlated with body weight and height in normal Zambian adults [3]. Thus, comprehending the genetic architecture of heart weight (Heart WT), liver weight (Liver WT), spleen weight (Spleen WT), lung weight (Lung WT), kidney weight (Kidney WT), and stomach weight (Stomach WT) will propel genetic progress and facilitate the successful implementation of breeding programs.
Genome-wide association studies (GWASs) are widely used to identify quantitative trait loci (QTL) and candidate genes associated with complex traits in animals and plants. To date, the number of QTL associated with Heart WT, Liver WT, Spleen WT, Lung WT, and Kidney WT are 29, 31, 19, 5 and 8, respectively, and no QTL have been reported to be associated with Stomach WT in the pig QTL database [4] (accessed on 15 November 2022). Previous studies reported 39 QTL to be associated with internal organ weight in four local pig populations and one commercial population [5]. For instance, Zhang et al. [6] showed that a 2 cM QTL on Sus scrofa chromosome 2 (SSC2) was significantly associated with Heart WT, and three QTL were associated with Liver WT, Lung WT, and Spleen WT. Although several studies have identified QTL to be associated with internal organ weight [7,8], the process of genetic improvement remains slow.
The difficulty (and high cost) of obtaining phenotypes for internal organ weight studies has led to fewer studies on its genetic architecture. Moreover, previous studies conducted single-trait GWASs for internal organ weight to map the genetic markers and genes; however, internal organ development is mutually coordinated by each different organ, and the single-nucleotide polymorphisms (SNPs) in the genome may act on multiple organs at the same time. Therefore, it is difficult to identify SNPs and candidate genes that affect multiple internal organs simultaneously using single-trait GWASs. Therefore, herein, we performed multi-trait GWASs to identify polymorphic SNPs and improve statistical efficiency, which mainly depends on the genetic correlation between traits [9,10]. In this manner, it was observed that the statistical efficiency was improved in the case of low trait correlations [11,12].
Previous studies demonstrated the superiority of conducting multi-trait GWASs in terms of uncovering the genetic architecture of complex traits in animals. For instance, Zhou et al. [13] performed multi-trait GWASs to identify 21 pleiotropic SNPs that were not detected via single-trait GWASs in three body size traits. In Simmental beef cattle, An et al. [14] detected 29 pleiotropic SNPs that were functional in all three growth periods using multi-trait GWASs. To date, there are no studies that use multi-trait GWASs to analyze the genetic architecture of visceral weight. Herein, we performed multi-trait GWASs to compensate for the deficiencies associated with single-trait GWASs and to provide new insights into the genetic mechanisms of multi-organ co-development.
The aim of this study was to map the genetic markers and candidate genes associated with internal organ weight in pigs. To this end, we conducted single-trait and multi-trait GWASs for six internal organ weight traits in 1518 crossbred commercial Duroc × (Landrace × Yorkshire) DLY pigs. The results from the current study advanced our understanding of the genetic basis for internal organ weight and further revealed the complexity of the genetic architecture of internal organ weight in pigs. Integrating SNP results from GWASs as a source of prior biological information in the improvement program enhances the selection process by assigning higher weight to key SNPs that are critical for improving internal organ weight traits.
2. Materials and Methods
2.1. Ethical Statement
All animals used in this study were treated in accordance with the guidelines for the use of laboratory animals of the Ministry of Agriculture of China and with the approval of South China Agricultural University (Guangzhou, China), No. 2018F089.
2.2. Animal Samples and Phenotype Collection
Experimental animals were selected from a DLY three-way crossbred commercial line with no overlapping blood relations, through random selection based on genealogy, in which 89 Duroc boars were mated with 397 Landrace × Yorkshire sows to produce a large number of offspring. All pigs were raised in four farms of the Guangdong Wens Food Group Co., Ltd. (Guangzhou, China). In brief, a total of 1518 individuals (757 boars and 764 sows) were reared with free access to water and feed and were fattened to 115 kg. They were euthanized in 13 batches with a 24 h interval between each batch and had an average slaughter age of about 7 months. After the pigs were euthanized, their phenotypes were recorded, and their internal organs were excised, emptied, flushed, blotted dry, and weighed immediately using an electronic scale with a range of 0.0 kg to 300 kg and accuracy of ±100 g. The scale was calibrated using the linear calibration method with 20% MAX or 60% MAX weight. The organ distribution is shown in Figure 1. R 4.2.1 software was used to test the normal distribution of the descriptive statistics of the internal organ traits.
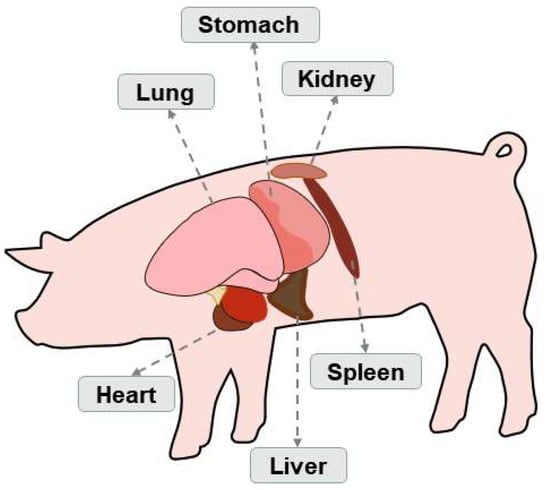
Figure 1.
Distribution of heart, liver, spleen, lung, kidney, and stomach in the pig.
2.3. Genotyping and Quality Control
Ear samples were collected from all 1518 individuals, and genomic DNA was extracted from the ear tissue of each pig using a standard phenol–chloroform method and subsequently diluted to 50 ng/μL for the genotyping procedure, controlling the quality OD260/280 between 1.8 and 2.0. The 1518 DLY pigs were genotyped using the GeneSeek Porcine 50K SNP BeadChip (Neogen, Lincoln, NE, USA), which contained 50,703 SNPs. After genotyping, to ensure the accuracy and validity of the GWAS results, we performed a quality control (QC) procedure using the PLINK v1.07 software [15] with the following parameters: individual call rate > 95%; SNP call rate > 99%; minor allele frequency > 1%; and p > 10−6 for the Hardy–Weinberg equilibrium test. Moreover, SNPs in sex chromosomes and unmapped regions were excluded. After QC, a final set of 31,941 eligible SNPs remained for subsequent single-trait and multi-trait GWASs.
2.4. Population Structure and Linkage Disequilibrium (LD) Estimation
PCA was conducted using the GCTA software [16] to assess the population structure, and PLINK v1.07 was used to calculate the LD decay distance, which was evaluated as the squared correlation of alleles (r2) with a window size of 1000.
2.5. Single-Trait and Multi-Trait Genome-Wide Association Studies
The GEMMA software [17] was used to implement the linear mixed model (LMM) for the single-trait GWAS of each internal organ weight trait, including heart weight, liver weight, spleen weight, lung weight, kidney weight, and stomach weight. GEMMA calculated the genomic relatedness matrix (GRM) between individuals to account for the population structure. The mixed linear model was as follows:
where y is a vector of phenotypic values for each internal organ weight; W is the correlation matrix of covariates (fixed effects), including the top five eigenvectors of PCA, farm, sex, and slaughter lot; α is a vector of corresponding coefficients including the intercept; X is the genotypic vector of the SNP markers; β denotes the effect size of the SNP markers; u is a random effects vector, u~MVNn (0, λτ−1K); ε is the residual vector, ε~MVNn (0, τ−1In); λ is the ratio of the specified variance components; τ−1 is the variance of the residuals; K denotes the kinship matrix; I is the unit matrix; n is the number of individuals in the DLY population; MVNn denotes the multi-dimensional normal distribution.
Moreover, the GEMMA software [17] was used to implement the multivariate linear mixed models (mvLMMs) [18] for multi-trait GWASs to assess pleiotropic SNPs. The mvLMMs and LMMs were both implemented as described in previous studies [19]. In the current study, the LMMs and mvLMMs in the single-trait GWAS and the multi-trait GWAS utilized the same covariates. The multivariate linear mixed models were as follows:
where is a matrix of six internal organs for 1518 individuals; is a covariable matrix (fixed effects); is a matrix of the corresponding coefficients; is a vector that marks the genotypes; is a vector of marker effect sizes for six internal organs’ weights. U denotes the random effects; E is a matrix of errors; denotes the kinship matrix; denotes symmetric matrix of genetic variance component; I is an identity matrix; denotes a symmetric matrix of the environmental variance component; denotes the n×d matrix normal distribution with mean 0; denotes row covariance matrix; denotes column covariance matrix.
Furthermore, the Bonferroni correction can lead to an overcorrection and can be too conservative, this can result in a limited number of labeled association p-values that meet the standard across the genome. This can lead to a high false-negative rate. To address this issue, the false-discovery rate (FDR) was employed as a correction to the threshold [20]. Thus, the threshold p-value was calculated as the was set to 0.01, N is the number of SNPs with p-value less than 0.01, and M refers to the total number of SNPs after quality control. Moreover, quantile–quantile (Q–Q) plots were constructed for the six internal organ weight traits to further assess the population structure.
In addition, the PLINK v1.07 and Haploview v4.2 software [21] were implemented to perform the haplotype block analysis in chromosomal regions with multiple significant SNPs. The default parameters of Haploview 4.2 [22] (MAF > 0.05, Mendelian error < 2, and p-value < 10−3 for the HWE test) were used to define the linkage disequilibrium (LD) blocks of SNPs.
2.6. Estimation of Heritability and Phenotypic Variation
In the present study, the restricted maximum likelihood (REML) method was used to assess the SNP-based heritability of each internal organ weight trait, and the percentage of phenotypic variation that could be explained by significant SNPs was calculated using GCTA software. SNP-based heritability and the percentage of phenotypic variation explained by significant SNPs were calculated as follows [23]:
where y is the phenotypic value of each internal organ weight trait; β is the vector of fixed effects, including the top five eigenvectors of PCA, farm, sex, and slaughter lot; X is an association matrix; g is the vector of total genetic effect of all the qualified SNPs for the 1518 DLY pigs; is the genomic association matrix between different individuals; is the additive genetic variance captured by either the genome-wide SNPs or the selected SNPs; refers to residual variance.
2.7. Candidate Gene Search and Function Analysis
Our previous studies on this population showed that the average r2 of 0.2 is about 200 kb apart [24]; the range for searching for the functional gene closest to the position of the significant SNP is determined based on the LD decay distance (r2 = 0.2) of the populations [25]. We used the “biomaRt” package [26] in R, based on the Sus scrofa 11.1 genome version database (http://ensemble.org/Sus_scrofa/Info/Index, accessed 20 September 2022). Genes nearest the significant SNPs are list in Tables. We conducted a search of both PubMed and the relevant literature to examine the correlation between the nearest peak SNPs of all the candidate genes and the internal organ weight traits being analyzed.
3. Results and Discussion
3.1. Phenotype Statistics and Heritability Estimation
The descriptive phenotypic statistics and estimated heritabilities (h2) for analysis of the internal organ weights are listed in Table 1. The weight of internal organs is a crucial indicator of internal organ development and has a significant impact on organ function. In the current study, the average Heart WT, Liver WT, Spleen WT, Lung WT, Kidney WT, and Stomach WT in DLY pigs were 455.57 g, 1763.61 g, 212.54 g, 1020.54 g, 0.41 kg, and 727.68 g, respectively. The estimated heritabilities of Heart WT and Lung WT were the lowest at 0.21 ± 0.04 and 0.28 ± 0.04, respectively, and all other organ weights had had moderate to high estimated heritabilities, ranging from 0.36 ± 0.04 to 0.49 ± 0.04. Similar to the results of a previous study, the estimated heritabilities of Heart WT, Liver WT, Spleen WT, and Kidney WT were between 0.35 and 0.54, which were moderate to high estimations [5], indicating that the estimated heritabilities of the weight of an internal organ is generally high in pigs and there is considerable room for improving the genetic contribution through breeding. Furthermore, the coefficients of variation were the lowest for Lung WT and all other traits were relatively high, indicating individual heterogeneity, low trait selection intensity, and high breeding potential.

Table 1.
Phenotypic statistics and heritability estimates for Heart WT, Liver WT, Spleen WT, Lung WT, Kidney WT, and Stomach WT.
Moreover, the genetic and phenotypic correlation coefficients among Heart WT, Liver WT, Spleen WT, Lung WT, Kidney WT, and Stomach WT are listed in Table 2. The results revealed moderate to low genetic correlations among the six internal organ weight traits. Heart WT had moderate genetic correlations with Liver WT, Lung WT, and Kidney WT, suggesting that these traits could be improved together in pig breeding programs. On the other hand, Stomach WT showed close to 0 genetic correlations with most of the other traits, indicating Stomach WT traits are less influenced by other traits when they are inherited. Therefore, reasonable breeding strategies need to be designed to improve internal organ weight traits. The phenotypic correlation results showed that the correlation coefficients between the phenotypes were at moderate to high levels, excluding the low phenotypic correlation coefficients between Lung WT and Liver WT, and Spleen WT and Kidney WT, especially the phenotypic correlation coefficients of Liver WT and Kidney WT were as high as 0.62. When selecting for a certain phenotype in pig breeding, it is advantageous to also consider other related traits.
Table 2.
Phenotypic correlations (above the diagonal) and genetic correlations (below the diagonal) among organ weight traits within the DLY population.
3.2. Population Structure and LD decay
Population stratification is known to lead to false-positive results in GWASs. To detect potential population stratification, we performed PCA and added the first five principal components to the covariates of the GWAS model to correct for the population structure. Moreover, our previous study showed that the LD decay coefficient of the analyzed DLY pig population with r2 decayed to 0.2 at a physical distance of 200 kb [24], indicating that the DLY population is diverse with a weak linkage between loci, which facilitates the detection of key SNPs for internal organ weight traits. In addition, Q–Q plots were generated for Heart WT, Liver WT, Spleen WT, Lung WT, Kidney WT, and Stomach WT to further assess population stratification (together with the Manhattan plots: Figure 2). The expansion coefficients (lambda) of the Q–Q plots for all six internal organ weight traits were close to 1, and no overall systematic bias was observed, signifying a negligible effect of the DLY pig group structure on GWASs.
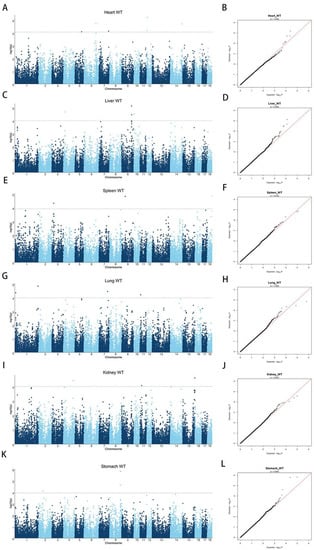
Figure 2.
Manhattan and Q–Q plots of internal organ weight traits in the single-trait GWAS. (A) GWAS for Heart WT; (B) Q–Q plot for Heart WT; (C) GWAS for Liver WT; (D) Q–Q plot for Liver WT; (E) GWAS for Spleen WT; (F) Q–Q plot for Spleen WT; (G) GWAS for Lung WT; (H) Q–Q plot for Lung WT; (I) GWAS for Kidney WT; (J) Q–Q plot for Heart WT; (K) GWAS for Stomach WT; (L) Q–Q plot for Stomach WT. The x-axis represents the chromosome, and the y-axis represents the −log10 (p-value) value in the Manhattan plot of the GWAS. The Q–Q plot is plotted with the x-axis representing the actual measured value of −log10 (p-value) and the y-axis representing the observed value of −log10 (p-value) and labeled with the expansion factor lambda (λ).
3.3. Single-Trait GWASs
Single-trait GWASs were performed for the weight of the heart, liver, spleen, lung, kidney, and stomach. The results showed that 6, 4, 3, 4, 3, and 4 SNPs were significantly associated with the weight of each organ, respectively. The results of these single-trait GWASs are presented in Figure 2 and Table 3. Notably, it is the first time that significant SNPs associated with Stomach WT have been identified in pigs. Furthermore, on the basis of the LD decay map, a region of 200 kb before and after the key SNPs was defined as a region to screen for candidate genes [24]. For heart weight, six significant SNPs were identified, located on SSC5, 6, 7, 12, and 14. These six SNPs surpassed the significance threshold of 1.01 × 10⁻⁴. Figure 2B shows an expansion coefficient lambda (λ) of 1.006. Details of the significant SNPs are listed in Table 3. The most significant SNP, WU_10.2_12_6703865 on SSC12, explains 1.70% of the phenotypic variation and is about 44 kb downstream of the CD300LB gene. The CD300LB gene is a triggering receptor expressed on bone marrow cells that regulates the cytosolic process of bone marrow cells [27], and the CD300LB protein stimulated by T cells regulates DNMT3A mutation and alters immune cells in heart failure [28].
Table 3.
Significant SNPs and candidate genes for Heart WT, Liver WT, Spleen WT, Lung WT, Kidney WT, and Stomach WT in single-trait GWASs.
For liver weight, four significant SNPs were detected on SSC4, SSC9, and SSC10 with a λ of 0.999 (Figure 2C,D and Table 3). These four SNPs surpassed the significance threshold of 1.04 × 10⁻⁴. The top SNP, H3GA0028070, accounted for 2.10% of the phenotypic variance and is located within the TPK1 gene. A significant SNP, named ASGA0044340, 12 kb upstream of H3GA0028070, also located on TPK1, explained 0.82% of the phenotypic variation. According to reports, TPK1 is a cofactor of certain enzymes associated with the glycolysis and energy production pathways. It is involved in the metabolism of water-soluble vitamins and cofactors and the thiamine metabolic pathway, and mutations in TPK1 can cause thiamine metabolic dysfunction syndrome [29]. In addition, knockdown of this gene can lead to glycogen storage dysfunction [30]. However, no studies have shown TPK1 to be directly associated with liver development and weight in pigs.
The GWAS results of Spleen WT identified three significant SNPs, located on SSC3, SSC9, and SSC18, with a λ of 0.972 (Figure 2E,F and Table 3). All three SNPs surpassed the threshold of significance (p < 1.20 × 10⁻⁴). The top SNP, ALGA0098928, explained 2.22% of the phenotypic variation and is located within POU6F2. POU6F2 is a suppressor associated with nephroblastoma (WT) that regulates cell proliferation and specific differentiation [31]. According to the RT-qPCR results, the expression of POU6F2 is associated with renal morphogenesis [32], suggesting that POU6F2 may be closely associated with spleen weight traits.
For lung weight, four significant SNPs were detected on SSC1, SSC7, and SSC11 with a λ of 1.008 (Figure 2G,H and Table 3). These four SNPs surpassed the significance threshold of 1.04 × 10⁻⁴. An SNP named ALGA0110225 explained 1.81% of the phenotypic variance and is located 97 kb downstream of PBX3, indicating that PBX3 and ALGA0110225 may both play a role in Lung WT. A literature review revealed that PBX3 is directly regulated by targeting NBPF10, miR-144, and miR-224, which are directly associated with lung cancer cell proliferation [33]. In addition, overexpression of PBX3 promotes the proliferation of A549 cells (lung cancer histiocytes) [34]. Therefore, we believe PBX3 to be a promising candidate gene for influencing Lung WT, and the regulatory mechanism needs further investigation.
We performed GWASs with the Kidney WT trait in DLY pigs and detected three SNPs that were above the significance threshold (p < 1.03 × 10⁻⁴) (Figure 2I and Table 3). Figure 2J shows that the lambda is 0.987. WU_10.2_15_153747936 on SSC15 explains 1.97% of the phenotypic variation and is located 341 kb downstream of the HDAC4 gene. Because the LD decay distance is 200 kb, it follows that HDAC4 may not have a significant effect on Kidney WT traits.
QTL and significant SNPs have not been previously reported in relation to Stomach WT. Thus, this study is the first GWAS on pig Stomach WT. Herein, four significant SNPs were identified for the DLY pigs that were above the significance threshold of p < 1.17 × 10⁻⁴ (Figure 2K and Table 3). Of the four significant SNPs, three SNPs were simultaneously located on SSC8 and both MARC0052872 and ALGA0106192 were located within the UNC5C gene. Furthermore, the distance between MARC0052872 and ALGA0106192 was only 21 kb, explaining 2.53% and 2.62% of the phenotypic variation, respectively. ASGA0101191 was 100 kb away from the aforementioned SNPs with a phenotypic variation value of 2.14% and was located within BMPR1B. A literature review revealed that UNC5C plays a dominant role in netrin-1/UNC5C-mediated axonal rejection [35] and that its promoter region sequence binds to p53 and acts as a target of p53 to regulate apoptosis [36]. As regards the BMPR1B gene, it has been shown that the BMP family is expressed in the early organ and tissue formation during mouse embryonic development [37]. However, neither the BMPR1B nor the UNC5C gene is directly associated with internal organ weight traits.
The above GWAS results show that none of the SNPs associated with internal organ weight overlapped with those previously reported QTL documented in the pig QTL database [1]. This may have been due to the fact that most studies focused on the breeding of native Chinese pigs, and fewer studies were conducted on DLY three-way crossbred commercial populations with significant breed differences. Moreover, the significant SNPs did not overlap in the six traits, i.e., none of the SNPs were polymorphic, which may be related to the low genetic and phenotypic correlation between traits and the low density of genetic markers, which was further verified by multi-trait GWASs.
3.4. Haplotype Block Analysis
Figure 3 shows the LD pattern of significant SNPs associated with Stomach WT. In this study, multiple SNPs associated with Stomach WT were in close proximity to each other, with two significant SNPs on SSC8, which is located in a 21 kb region within the UNC5C and BMPR1B genes (the gene function is described above). The insufficient density of 50K microarray markers resulted in a low number of SNPs with linkage disequilibrium, which limited the resolution of the genetic architecture of key SNPs for the trait to some extent.
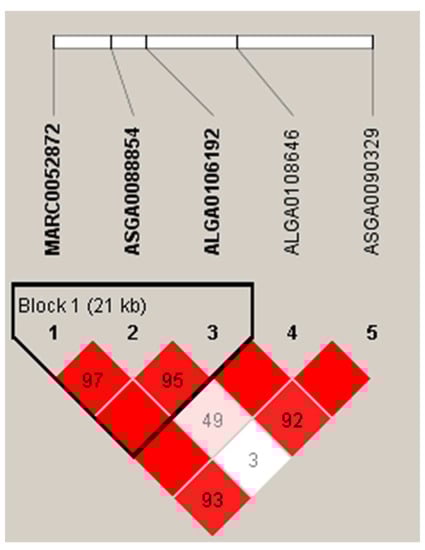
Figure 3.
Linkage disequilibrium blocks of important SNPs on SSC8 in DLY pigs. The value in the box is the degree of linkage disequilibrium between SNPs (r2).
3.5. Multi-Trait GWASs
In order to improve the statistical effect, multi-trait GWASs were individually performed for each SNP by combining the joint analysis of six internal organ weight traits. This revealed the genetic factors with significant interactions among different traits in the same individual under the same environment. Manhattan plots of the multi-trait GWASs are shown in Figure 4.
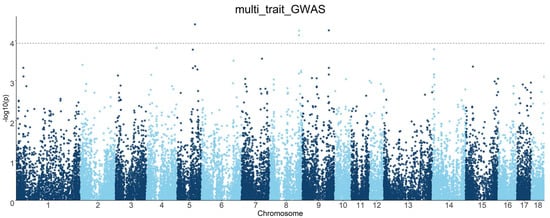
Figure 4.
Manhattan plots of multi-trait GWAS results for six internal organ weight traits in the DLY population. The x-axis represents the chromosome, and the y-axis represents the −log10 (p-value) value in the Manhattan plot of the GWAS. The dashed line indicates the FDR-corrected threshold.
The multi-trait GWASs combining six internal organ weight traits identified four significant SNPs with polymorphisms affecting the phenotypes, ALGA0032998, H3GA0028070, MARC0052872, and ALGA0106192 (Figure 5 and Table 4). SNP ALGA0032998 explained 1.36% of the phenotypic variation and is located within the ANO6 gene. The overexpression of CCR7 was observed to enhance the migration of BxPC-3 cells under the induction of the ANO6 gene, which is a potential mediator of ANO6 expression through the ERK signaling pathway. This promotion of migration was also seen in pancreatic ductal adenocarcinoma cells [38]. The single-trait GWAS described the effects of three SNPs (H3GA0028070, MARC0052872, and ALGA0106192) located on TPK1 and UNC5C genes on the weight of the liver and stomach. These SNPs were not only significant in the single-trait GWAS but were also found to be simultaneously associated with the weight of all six internal organs, suggesting that these four SNPs have pleiotropic effects. Furthermore, no additional SNPs, independent of the single-trait GWAS results, were found. Similar results were previously reported by Guo et al. [39], in which no additional SNPs, independent of the single-trait GWAS results, were detected in the multi-trait GWASs for backfat thickness, carcass weight, and body weight in the DLY and Duroc populations. The reasons for this situation are manifold. For example, the complexity of the genetic architecture of the internal organ weight trait and the low marker density result in a low number of SNPs reaching significant levels. This renders LD detection insufficient and increases the difficulty of screening for co-dominant SNP or QTL regions. Thus, a larger sample population and a higher marker density are required to screen for loci associated with internal organ weight.
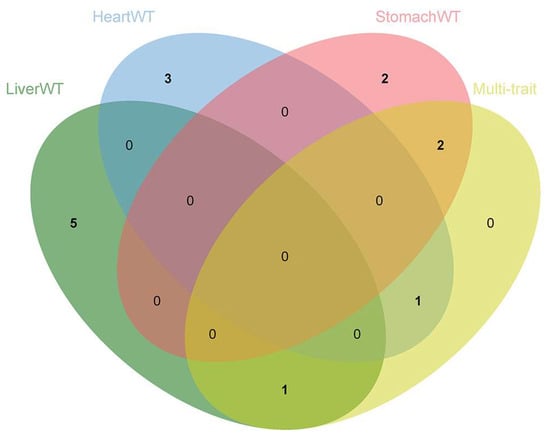
Figure 5.
Venn diagram showing the distribution of SNPs in the single-trait GWASs and multi-trait GWASs, highlighting the role of pleiotropic SNPs in multiple traits.
Table 4.
Significant SNPs and candidate genes for Heart WT, Liver WT, Spleen WT, Lung WT, Kidney WT, and Stomach WT in multi-trait GWASs.
4. Conclusions
In this study, we conducted single-trait and multi-trait GWASs on the internal organ weights of 1518 DLY pigs. A total of 24 significant SNPs were detected in the single-trait GWAS results for six internal organ weight traits. The four significant pleiotropic SNPs identified via multi-trait GWASs were associated with six internal organ weight traits, confirming the results of the single-trait GWASs and improving our ability to reveal the genetic architecture of organ weight traits. TPK1, POU6F2, PBX3, UNC5C, and BMPR1B were highlighted as potential genes responsible for differences in Liver WT, Spleen WT, Lung WT, and Stomach WT among individuals according to their gene functions. In summary, the results of this study contribute to our understanding of the genetics of internal organ weight traits in DLY pigs by assigning higher weights to relevant SNPs and key genes in the genome.
Author Contributions
Conceptualization, E.Z. and G.C.; resources, E.Z., G.C. and Z.W.; investigation, Y.Y., S.Z., D.R., Y.Q., S.W. and J.W.; software and validation, X.L., Z.Z. and J.W.; formal analysis, X.L., J.W. and Z.Z.; data curation, Z.Z., S.W., J.W. and Y.Y.; writing—original draft preparation, X.L. and J.W.; writing—review and editing, E.Z., G.C., Z.W. and J.Y.; visualization, J.Y. and Y.Y. All authors have read and agreed to the published version of the manuscript.
Funding
This research was supported by the Key Technologies R&D Program of Guangdong Province project (2022B0202090002) and the Project of Swine Innovation Team in Guangdong Modern Agricultural Research System (2022KJ126).
Institutional Review Board Statement
All animals used in this study were treated in accordance with the guidelines for the use of laboratory animals of the Ministry of Agriculture of China and with the approval of South China Agricultural University (Guangzhou, China), No. 2018F089.
Informed Consent Statement
Not applicable.
Data Availability Statement
Data are contained within the article.
Conflicts of Interest
The authors declare no conflict of interest.
References
- An, B.; Xia, J.; Chang, T.; Wang, X.; Miao, J.; Xu, L.; Zhang, L.; Gao, X.; Chen, Y.; Li, J.; et al. Genome-wide association study identifies loci and candidate genes for internal organ weights in Simmental beef cattle. Physiol. Genom. 2018, 50, 523–531. [Google Scholar] [CrossRef] [PubMed]
- Mader, C.J.; Montanholi, Y.R.; Wang, Y.J.; Miller, S.P.; Mandell, I.B.; McBride, B.W.; Swanson, K.C. Relationships among measures of growth performance and efficiency with carcass traits, visceral organ mass, and pancreatic digestive enzymes in feedlot cattle. J. Anim. Sci. 2009, 87, 1548–1557. [Google Scholar] [CrossRef]
- Mubbunu, L.; Bowa, K.; Petrenko, V.; Silitongo, M. Correlation of Internal Organ Weights with Body Weight and Body Height in Normal Adult Zambians: A Case Study of Ndola Teaching Hospital. Anat. Res. Int. 2018, 2018, 4687538. [Google Scholar] [CrossRef]
- Hu, Z.L.; Park, C.A.; Reecy, J.M. Bringing the Animal QTLdb and CorrDB into the future: Meeting new challenges and providing updated services. Nucleic Acids Res. 2022, 50, D956–D961. [Google Scholar] [CrossRef] [PubMed]
- He, Y.; Li, X.; Zhang, F.; Su, Y.; Hou, L.; Chen, H.; Zhang, Z.; Huang, L. Multi-breed genome-wide association study reveals novel loci associated with the weight of internal organs. Genet. Sel. Evol. 2015, 47, 87. [Google Scholar] [CrossRef] [PubMed]
- Zhang, J.; Xiong, Y.; Zuo, B.; Lei, M.; Jiang, S.; Li, F.; Zheng, R.; Li, J.; Xu, D. Detection of quantitative trait loci associated with several internal organ traits and teat number trait in a pig population. J. Genet. Genom. 2007, 34, 307–314. [Google Scholar] [CrossRef] [PubMed]
- Liu, X.; Wang, L.; Liang, J. Genome-Wide Association Study for Certain Carcass Traits and Organ Weights in a Large White×Minzhu Intercross Porcine Population. J. Integr. Agric. 2014, 13, 2721–2730. [Google Scholar] [CrossRef]
- Wei, W.H.; Duan, Y.; Haley, C.S.; Ren, J.; de Koning, D.J.; Huang, L.S. High throughput analyses of epistasis for swine body dimensions and organ weights. Anim. Genet. 2011, 42, 15–21. [Google Scholar] [CrossRef]
- Casale, F.P.; Rakitsch, B.; Lippert, C.; Stegle, O. Efficient set tests for the genetic analysis of correlated traits. Nat. Methods 2015, 12, 755–758. [Google Scholar] [CrossRef]
- Porter, H.F.; O’Reilly, P.F. Multivariate simulation framework reveals performance of multi-trait GWAS methods. Sci. Rep. 2017, 7, 38837. [Google Scholar] [CrossRef]
- Broadaway, K.A.; Cutler, D.J.; Duncan, R.; Moore, J.L.; Ware, E.B.; Jhun, M.A.; Bielak, L.F.; Zhao, W.; Smith, J.A.; Peyser, P.A.; et al. A Statistical Approach for Testing Cross-Phenotype Effects of Rare Variants. Am. J. Hum. Genet. 2016, 98, 525–540. [Google Scholar] [CrossRef] [PubMed]
- Hackinger, S.; Zeggini, E. Statistical methods to detect pleiotropy in human complex traits. Open Biol. 2017, 7, 170125. [Google Scholar] [CrossRef] [PubMed]
- Zhou, S.; Ding, R.; Zhuang, Z.; Zeng, H.; Wen, S.; Ruan, D.; Wu, J.; Qiu, Y.; Zheng, E.; Cai, G.; et al. Genome-Wide Association Analysis Reveals Genetic Loci and Candidate Genes for Chest, Abdominal, and Waist Circumferences in Two Duroc Pig Populations. Front. Vet. Sci. 2021, 8, 807003. [Google Scholar] [CrossRef] [PubMed]
- An, B.; Xu, L.; Xia, J.; Wang, X.; Miao, J.; Chang, T.; Song, M.; Ni, J.; Xu, L.; Zhang, L.; et al. Multiple association analysis of loci and candidate genes that regulate body size at three growth stages in Simmental beef cattle. BMC Genet. 2020, 21, 32. [Google Scholar] [CrossRef]
- Purcell, S.; Neale, B.; Todd-Brown, K.; Thomas, L.; Ferreira, M.A.; Bender, D.; Maller, J.; Sklar, P.; de Bakker, P.I.; Daly, M.J.; et al. PLINK: A tool set for whole-genome association and population-based linkage analyses. Am. J. Hum. Genet. 2007, 81, 559–575. [Google Scholar] [CrossRef]
- Yang, J.; Lee, S.H.; Goddard, M.E.; Visscher, P.M. GCTA: A tool for genome-wide complex trait analysis. Am. J. Hum. Genet. 2011, 88, 76–82. [Google Scholar] [CrossRef]
- Zhou, X.; Stephens, M. Genome-wide efficient mixed-model analysis for association studies. Nat. Genet. 2012, 44, 821–824. [Google Scholar] [CrossRef]
- Zhou, X.; Stephens, M. Efficient multivariate linear mixed model algorithms for genome-wide association studies. Nat. Methods 2014, 11, 407–409. [Google Scholar] [CrossRef]
- Yan, G.; Guo, T.; Xiao, S.; Zhang, F.; Xin, W.; Huang, T.; Xu, W.; Li, Y.; Zhang, Z.; Huang, L. Imputation-Based Whole-Genome Sequence Association Study Reveals Constant and Novel Loci for Hematological Traits in a Large-Scale Swine F(2) Resource Population. Front. Genet. 2018, 9, 401. [Google Scholar] [CrossRef]
- Glickman, M.E.; Rao, S.R.; Schultz, M.R. False discovery rate control is a recommended alternative to Bonferroni-type adjustments in health studies. J. Clin. Epidemiol. 2014, 67, 850–857. [Google Scholar] [CrossRef]
- Barrett, J.C.; Fry, B.; Maller, J.; Daly, M.J. Haploview: Analysis and visualization of LD and haplotype maps. Bioinformatics 2005, 21, 263–265. [Google Scholar] [CrossRef] [PubMed]
- Ding, R.; Quan, J.; Yang, M.; Wang, X.; Zheng, E.; Yang, H.; Fu, D.; Yang, Y.; Yang, L.; Li, Z.; et al. Genome-wide association analysis reveals genetic loci and candidate genes for feeding behavior and eating efficiency in Duroc boars. PLoS ONE 2017, 12, e0183244. [Google Scholar] [CrossRef] [PubMed]
- Zaitlen, N.; Kraft, P. Heritability in the genome-wide association era. Hum. Genet. 2012, 131, 1655–1664. [Google Scholar] [CrossRef] [PubMed]
- Zhuang, Z.; Wu, J.; Xu, C.; Ruan, D.; Qiu, Y.; Zhou, S.; Ding, R.; Quan, J.; Yang, M.; Zheng, E.; et al. The Genetic Architecture of Meat Quality Traits in a Crossbred Commercial Pig Population. Foods 2022, 11, 3143. [Google Scholar] [CrossRef]
- Zhuang, Z.; Ding, R.; Peng, L.; Wu, J.; Ye, Y.; Zhou, S.; Wang, X.; Quan, J.; Zheng, E.; Cai, G.; et al. Genome-wide association analyses identify known and novel loci for teat number in Duroc pigs using single-locus and multi-locus models. BMC Genom. 2020, 21, 344. [Google Scholar] [CrossRef]
- Durinck, S.; Spellman, P.T.; Birney, E.; Huber, W. Mapping identifiers for the integration of genomic datasets with the R/Bioconductor package biomaRt. Nat. Protoc. 2009, 4, 1184–1191. [Google Scholar] [CrossRef]
- Voss, O.H.; Tian, L.; Murakami, Y.; Coligan, J.E.; Krzewski, K. Emerging role of CD300 receptors in regulating myeloid cell efferocytosis. Mol. Cell. Oncol. 2015, 2, e964625. [Google Scholar] [CrossRef]
- Abplanalp, W.T.; Cremer, S.; John, D.; Hoffmann, J.; Schuhmacher, B.; Merten, M.; Rieger, M.A.; Vasa-Nicotera, M.; Zeiher, A.M.; Dimmeler, S. Clonal Hematopoiesis-Driver DNMT3A Mutations Alter Immune Cells in Heart Failure. Circ. Res. 2021, 128, 216–228. [Google Scholar] [CrossRef]
- Li, X.; Huang, Z.; Chen, Y.; Sun, X.; Yi, Z.; Xie, J.; Yu, X.; Chen, H.; Zhong, J. Case report of two affected siblings in a family with thiamine metabolism dysfunction syndrome 5: A rare, but treatable neurodegenerative disease. BMC Neurol. 2022, 22, 373. [Google Scholar] [CrossRef]
- Giacometti, R.; Kronberg, F.; Biondi, R.M.; Passeron, S. Catalytic isoforms Tpk1 and Tpk2 of Candida albicans PKA have non-redundant roles in stress response and glycogen storage. Yeast 2009, 26, 273–285. [Google Scholar] [CrossRef]
- Di Renzo, F.; Doneda, L.; Menegola, E.; Sardella, M.; De Vecchi, G.; Collini, P.; Spreafico, F.; Fossati-Bellani, F.; Giavini, E.; Radice, P.; et al. The murine Pou6f2 gene is temporally and spatially regulated during kidney embryogenesis and its human homolog is overexpressed in a subset of Wilms tumors. J. Pediatr. Hematol. Oncol. 2006, 28, 791–797. [Google Scholar] [CrossRef] [PubMed]
- Xu, G.; Zhu, H.; Xu, J.; Wang, Y.; Zhang, Y.; Zhang, M.; Zhu, D. Long non-coding RNA POU6F2-AS2 promotes cell proliferation and drug resistance in colon cancer by regulating miR-377/BRD4. J. Cell. Mol. Med. 2020, 24, 4136–4149. [Google Scholar] [CrossRef] [PubMed]
- Zhao, X.; Song, X.; Zhao, Y. circNBPF10/miR-224 Axis Regulates PBX3 to Promote the Malignant Progression of Lung Cancer. J. Oncol. 2022, 2022, 2832920. [Google Scholar] [CrossRef] [PubMed]
- Li, D.; Li, H.; Yang, Y.; Kang, L. Long Noncoding RNA Urothelial Carcinoma-Associated 1 Promotes the Proliferation and Metastasis of Human Lung Tumor Cells by Regulating MicroRNA-144. Oncol. Res. 2018, 26, 537–546. [Google Scholar] [CrossRef] [PubMed]
- Shao, Q.; Yang, T.; Huang, H.; Alarmanazi, F.; Liu, G. Uncoupling of UNC5C with Polymerized TUBB3 in Microtubules Mediates Netrin-1 Repulsion. J. Neurosci. 2017, 37, 5620–5633. [Google Scholar] [CrossRef] [PubMed]
- Miyamoto, Y.; Futamura, M.; Kitamura, N.; Nakamura, Y.; Baba, H.; Arakawa, H. Identification of UNC5A as a novel transcriptional target of tumor suppressor p53 and a regulator of apoptosis. Int. J. Oncol. 2010, 36, 1253–1260. [Google Scholar] [CrossRef]
- Danesh, S.M.; Villasenor, A.; Chong, D.; Soukup, C.; Cleaver, O. BMP and BMP receptor expression during murine organogenesis. Gene Expr. Patterns 2009, 9, 255–265. [Google Scholar] [CrossRef]
- Wang, L.; Zhao, X.Y.; Zhu, J.S.; Chen, N.W.; Fan, H.N.; Yang, W.; Guo, J.H. CCR7 regulates ANO6 to promote migration of pancreatic ductal adenocarcinoma cells via the ERK signaling pathway. Oncol. Lett. 2018, 16, 2599–2605. [Google Scholar] [CrossRef]
- Guo, Y.; Qiu, H.; Xiao, S.; Wu, Z.; Yang, M.; Yang, J.; Ren, J.; Huang, L. A genome-wide association study identifies genomic loci associated with backfat thickness, carcass weight, and body weight in two commercial pig populations. J. Appl. Genet. 2017, 58, 499–508. [Google Scholar] [CrossRef]
Disclaimer/Publisher’s Note: The statements, opinions and data contained in all publications are solely those of the individual author(s) and contributor(s) and not of MDPI and/or the editor(s). MDPI and/or the editor(s) disclaim responsibility for any injury to people or property resulting from any ideas, methods, instructions or products referred to in the content. |
© 2023 by the authors. Licensee MDPI, Basel, Switzerland. This article is an open access article distributed under the terms and conditions of the Creative Commons Attribution (CC BY) license (https://creativecommons.org/licenses/by/4.0/).