Article

Laterality in the Damaraland Mole-Rat: Insights from a Eusocial Mammal

by
Paul J. Jacobs
1,2,* and
Maria K. Oosthuizen
1,2
1
Department of Zoology & Entomology, University of Pretoria, Private Bag X20, Pretoria 0028, South Africa
2
Mammal Research Institute, University of Pretoria, Pretoria 0002, South Africa
*
Author to whom correspondence should be addressed.
Animals 2023, 13(4), 627; https://doi.org/10.3390/ani13040627
Submission received: 6 January 2023 / Revised: 7 February 2023 / Accepted: 8 February 2023 / Published: 10 February 2023
(This article belongs to the Special Issue Physiology and Behaviour of African Mole-Rats)

Abstract

:

Simple Summary

Side biases observed in behavior are thought to reflect underlying asymmetric brain function or hemispheric specialization. These asymmetries occur at the individual and population level, although population-level laterality normally is only evident in social species. In a previous study, we found both individual- and population-level laterality in a solitary mole rat species. Here, we assessed laterality in a eusocial mole rat species, the Damaraland mole rat, Fukomys damarensis, using turning biases. All individuals combined demonstrated left-turning biases, which was also significant at the population level. Wild-caught animals were more strongly lateralized, but lacked the population-level left-turning bias that was observed in captive mole rats. This emphasizes the importance of context and animal handling when measuring and interpreting behavioral asymmetries.

Abstract

Lateralization is the functional control of certain behaviors in the brain being processed by either the left or right hemisphere. Behavioral asymmetries can occur at an individual and population level, although population-level lateralization is less common amongst solitary species, whereas social species can benefit more from aligning and coordinating their activities. We assessed laterality (individual and population) through turning biases in the eusocial Damaraland mole rat, Fukomys damarensis. We considered factors such as breeding status (queen or subordinate), environment (wild-caught or captive), sex (male or female), colony and body mass. All individuals together demonstrated significant left-turning biases, which was also significant at the population level. Wild-caught animals were more strongly lateralized, had a wider spread over a laterality index and lacked the population-level left-turning bias as compared to captive mole rats. Subordinate animals were more lateralized than queens, demonstrating social status differences in turning biases for social mole rats. This emphasizes the importance of animal handling and context when measuring and interpreting behavioral asymmetries.

1. Introduction

It is now well accepted that most vertebrates have strong left–right asymmetries in their brains and in their behaviors [1,2,3,4,5]. These asymmetries cause biases in the processing of specific stimuli [6,7,8]. Lateralization can be observed as specific behavioral inclinations such as motor biases, including turning or “handedness” [8,9,10,11], or sensory biases such as nostril use in horses [12] or eye use in chicks [13]. Each hemisphere controls specific behaviors, where the left hemisphere controls sustained responses to targets, whereas the right hemisphere is used for the control of potent releasers of innate responses [14]. The differential use of one hemisphere over the other can indicate preferential cognitive and emotional processes, revealing specific information about animal behavior [7,15,16,17]—for example, aggressiveness and fearfulness in right-hemisphere-dominant animals [10,16] and boldness in left-hemisphere-dominant animals [18]. It is therefore beneficial to avoid the duplication of function in the hemispheres, and this is supported in a variety vertebrates and invertebrates [14,19,20,21]. The laterality of an organism is likely the result of the interaction between genetic and environmental drivers [21,22], where factors such as light, hormones, rearing environment, pollution and stress have been determined to influence the development of the lateralized brain [4].
Interestingly, behavioral asymmetries can arise at an individual and a population level [19,23]. Individual laterality refers to the number of left- and right-biased individuals in a population where most individual are lateralized, which can often occur roughly half in one direction and the other half in the other direction [14,17]. These biases can vary in strength among individuals of the same species, or different species, and also depends on the task considered [14,24]. Lateralized behavior at the individual level is predicted to have positive and negative effects [10,14,19]. For instance, in terms of cognitive abilities, lateralized individuals have demonstrated increased numerical competence [6,25], stronger discrimination performance [26] and even predator detection [27]. However, there are cases where unlateralized function of the brain can be beneficial—for example, more lateralized individuals presented greater stress responses in Port Jackson sharks (Heterodontus portusjacksoni) [28] and lambs [29], and lateralized individuals are more likely to attack conspecifics in fish [11], all factors that are beneficial for animals kept in captivity. Overall, laterality is believed to provide a net fitness benefit to an individual, but it does not explain population-level laterality [19,30].
Population-level laterality refers to the condition where most individuals from a population have the same lateralized one directional bias—for example, human handedness [14,19,24]. It has been proposed that when individually asymmetric organisms must interact with conspecifics and coordinate their activities, asymmetry aligns in the majority of individuals in a population [17,20,30]. This suggests that social species are more likely to show population-level asymmetries, as social species are more likely to interact and coordinate socially [24,31,32]. In turn, members within a social group may experience greater fitness benefits when performing the same behavioral stratagem [17]. Currently, the evolution of individual lateralization does not predict any population-level lateralization [20]. It is possible that processes involving individual laterality do not influence population-level laterality if not relevant in a social context. In addition, if population-level asymmetries are present in solitary species, they should be less strongly lateralized or absent as opposed to species that interact socially [20,30].
Comparisons of solitary and social lateralized behavior have been made in bees. The solitary mason bee (Osmia cornuta) displays population-level asymmetries when involved in social agonistic encounters [33]. However, during an olfactory memory experiment, population-level asymmetries were absent in the solitary bee, but not in the eusocial honeybee (Apis meliffera) [34]. These results suggest that population-level asymmetries only manifest under social conditions. Nevertheless, in the solitary Cape mole rat (Georychus capensis), a significant left-turning population bias was observed when the laterality index (LI) scores of all individuals were compared [35]. This is one of the few studies demonstrating a population-level asymmetry in a solitary species in a non-social context and contradicts the current notion that population-level asymmetry is only present in social contexts [17,20,30].
African mole rats exhibit a wide social spectrum, ranging from solitary to eusocial [36,37], where eusociality is the most extreme case of social behavior [38]. Social mole rats display a reproductive division of labor and cooperative care of the young, which extend over at least two generations [38,39,40]. Inclusive fitness of this reproductive structure results in minimal internal competition and highly cooperative behavior [41,42,43,44] and therefore the alignment of population laterality in cooperative behavior is expected to be high [17]. To date, eusociality has only been described in two mammals, namely the naked mole rat (Heterocephalus glaber) and the Damaraland mole rat (Fukomys damarensis) [37,45,46]. These two mole rat species display all facets of eusociality, in addition to Michener’s [47] definition of sociality, which includes overlapping generations, cooperative brood care and reproductive division of labor. They also have a high reproductive skew where the maximum lifetime fecundity of breeders versus non-breeders (helpers) is far greater than that of female breeders versus helpers in other cooperatively breeding, vertebrate societies, as outlined by Sherman et al. [48].
The Damaraland mole rat, being a eusocial species, is therefore an ideal model species to investigate behavioral asymmetry. Firstly, it allows for eusocial to solitary lateralized comparison, as done in bees [33,34], but also allows us to investigate eusocial and solitary lateralized comparisons in mammals. In this study, we investigated individual- and population-level laterality in the Damaraland mole rat, under the same experimental conditions as was performed for the Cape mole rat [35]. It is important to note that turning biases were used, which is considered to be an individual-level laterality trait [9]. We predict that population-level asymmetry should be present in the Damaraland mole rat, and that the strength of the directional bias should be higher than in the Cape mole rat, as suggested by the evolutionary stable strategy (ESS) for social and non-social species hypothesis [17,20,30]. Environmental conditions (captive or free-living) may be important as predator responses are absent in captivity, and could further promote a left-hemisphere-dominant process if exposure to stressful situations persists [10]. Additionally, the study by Jacobs and Oosthuizen [35] on a solitary mole rat revealed that wild-caught and captive individuals differed in the strength of laterality. Thus, we anticipate that wild-caught Damaraland mole rats will demonstrate higher directional strength in laterality to be overall more lateralized in a particular direction compared to captive animals. Lastly, we expect that a left-turning bias will be observed in the Damaraland mole rats, similar to what was seen in the Cape mole rat by Jacobs and Oosthuizen [35].

2. Material and Methods

2.1. Data Acquisition

The current study utilized data obtained from recorded videos from another project that investigated the learning and memory of Damaraland mole rats [49]; thus, the experimental design was determined by that experiment.

2.2. Animal Capture and Husbandry

In order to determine whether queens differed from subordinates in laterality and to test for the effect of the colony, only groups consisting of at least one queen and one subordinate were used. Thus, sample sizes differed between this study and the study by Oosthuizen [49]. The experimental animals originated from laboratory colonies at the University of Pretoria, and all were born in captivity. Although Damaraland mole rats can live in captivity for up to 16 years (Oosthuizen, pers. obs.), animals in the study were less than 10 years old and considered healthy adults. Queens are generally the older individuals in the colony, but the ages of the different colonies may vary [46,50]. The experimental group consisted of 15 animals (5 queens and 10 subordinates (3F and 7M). Animals from the field group were captured near Blackrock (27°7′ S, 22°52′ E) in the Northern Cape, South Africa, using Hickman live traps [51]. This group was supplemented with animals from Tswalu Kalahari Reserve (27°31′ S, 22°19′ E), Northern Cape; these animals were subsequently released again. The field group consisted of 25 animals (6 queens and 19 subordinates (10F; 9M)). All animals were housed in plastic crates within their respective colonies. Crates were lined with wood shavings and animals were provided with tissue paper for nesting material. Animals were fed ad libitum on chopped sweet potatoes, apples and carrots, and they retrieved their water from the food. Trapping permits were obtained from the Northern Cape Nature Conservation Authority (ODB 2023/2010) and experimental procedures were approved by the Animal Use and Care Committee at the University of Pretoria (EC013-09).

2.3. Experimental Design

A Perspex Y-maze (arms 50 cm × 10 cm × 20 cm) was used as a testing apparatus. Two of the arms of the Y-maze were blocked on the distal ends, while the third one was attached to a nest box. Animals were released in one of the blocked arms, facing away from the center, and the direction of the first turn that the animals made towards the middle of the maze was recorded to determine the laterality of the animals (Figure 1). The experiment was filmed with an overhead video camera and analyzed upon completion of the experiment. The video footage of the animals was used to log the direction in which the animals turned. The turn at the Y-section of the maze was not used and did not contribute to turning bias determination. Each animal was subjected to 10 trials per day for four consecutive days. The time between trials varied between 45 and 60 min.

2.4. Determination of Turning Biases, Laterality Index and Absolute Laterality

If an initial turn could not be determined due to complications of placing a mole rat into the maze, then the turn was discarded, and the total number of turns was reduced. The minimum number of turns was 35, and demonstrated individual turning biases (Table 1). The laterality index (LI) was determined for each mole rat by computing the total number of left turns across all trials. We used the following formula: (number of left turns–number of right turns)/(total number of turns (40 in this case) × 100). This provides a measure of the population-level asymmetry [21,52,53]. Absolute laterality (AL) is the absolute value of the LI and represents the strength of the laterality irrespective of their preferences to turn left or right [21,53]. AL values were converted to a percentage, and thus the AL index ranges from 0 (an individual that turned in equal proportion to the right and to the left—no bias) to 100 (an individual that turned in the same direction in all trials).

2.5. Statistical Analysis

All statistical analyses were performed in R 4.2.1 [54]. Each individual mole rat was tested for laterality regarding their turning biases by comparing the number of left turns to right turns in a non-parametric two-tailed binomial test. The response variables, the LI and AL scores were tested for normality using the Shapiro–Wilk test. AL scores were not normally distributed. Homogeneity of response variables were confirmed with Levene’s test. To determine if there was an inherent turning bias or if turning bias was random in Damaraland mole rats, the LI scores of all individuals were compared in a one-tailed t-test, first pooled together and again separately for wild and captive individuals to make it comparable to the Cape mole rat [35]. In order to determine whether LI and AL were influenced by colony, body mass, sex (male or female), housing conditions (wild-caught or captive) and breeding status (queens or non-breeding subordinates), a linear model for LI and a general linear model using a gamma log-link function for AL were used. Data were analyzed using a linear model using the lme4 package [55]. Backwards elimination of linear models was performed using the step function of the lmerTest package in order to determine the best model for each response variable, determined through the AIC criterion [56]. Significant variables in the regression models were followed up with post hoc comparisons, conducted using Tukey’s HSD pairwise comparisons using the emmeans package [57] (Figures S1 and S2). Data are presented as mean ± standard error (s.e.m), and a p-value of ≤0.05 was defined as significant.

3. Results

For all analyses, we only report the results of the best model based on the AIC criterion. LI followed a normal distribution (W = 0.96, p = 0.19) and did not violate homogeneity (F = 0.42, p = 0.82). AL was not normally distributed (W = 0.85, p < 0.0001), but did not violate assumptions of homogeneity (F = 0.62, p = 0.68).

3.1. Individual Turning Biases

There was no difference in turning biases between the wild group (9/25: 36%) and the captive group (5/15: 33%) (Table 1).

3.2. Individual Laterality, Population-Level Laterality and Strength of Direction of Laterality

Overall, a population-level left-turning bias was observed when all mole rats were grouped together (LI for all mole rats: one-sample t-test = 2.2813, df = 39, p = 0.03). When investigating whether captivity influenced the overall turning bias, the captive population was found to have a significant left-turning bias (LI for captive mole rats: one-sample t-test = 2.6688, df = 14, p = 0.02), whereas the wild population did not (LI for wild-caught mole rats: one-sample t-test = 1.112, df = 24, p = 0.28).
The best linear model for LI (directional bias and population laterality) showed that only body mass, captivity and breeding status and breeding status × captivity influenced laterality, but no specific variable contributed significantly to the variation in LI (R2 = 0.05498, F = 1.567 (4,35), p = 0.20).
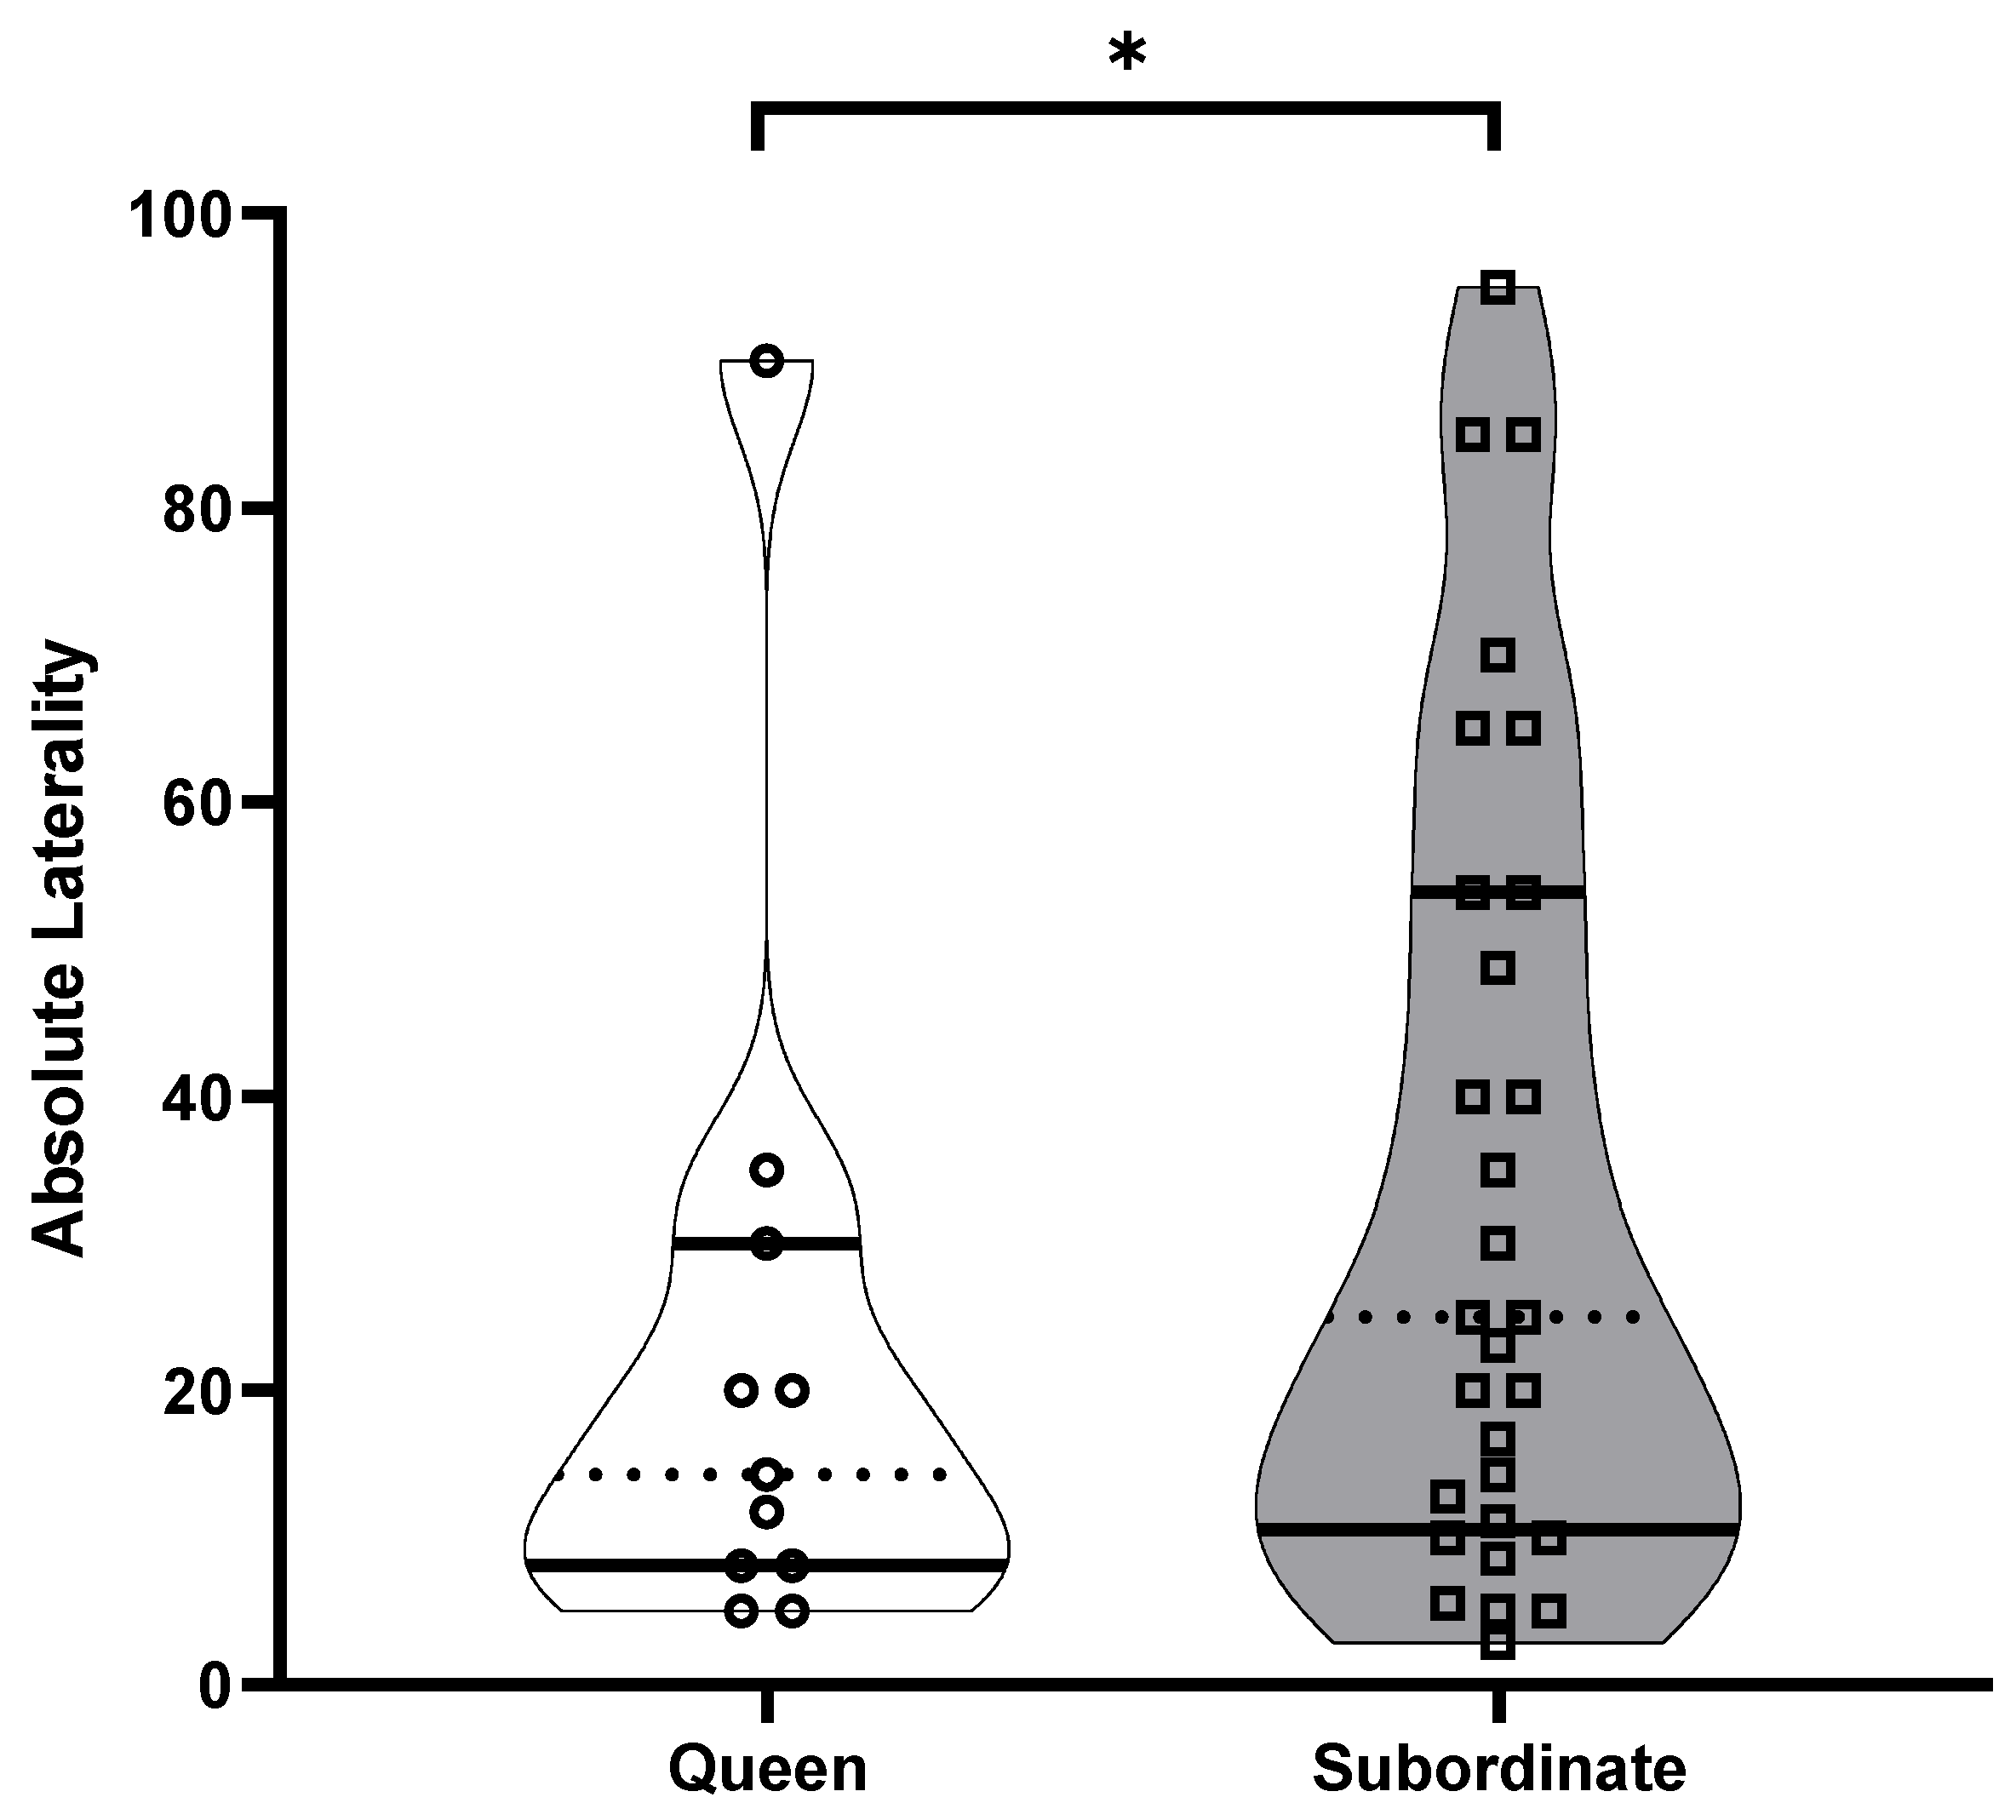
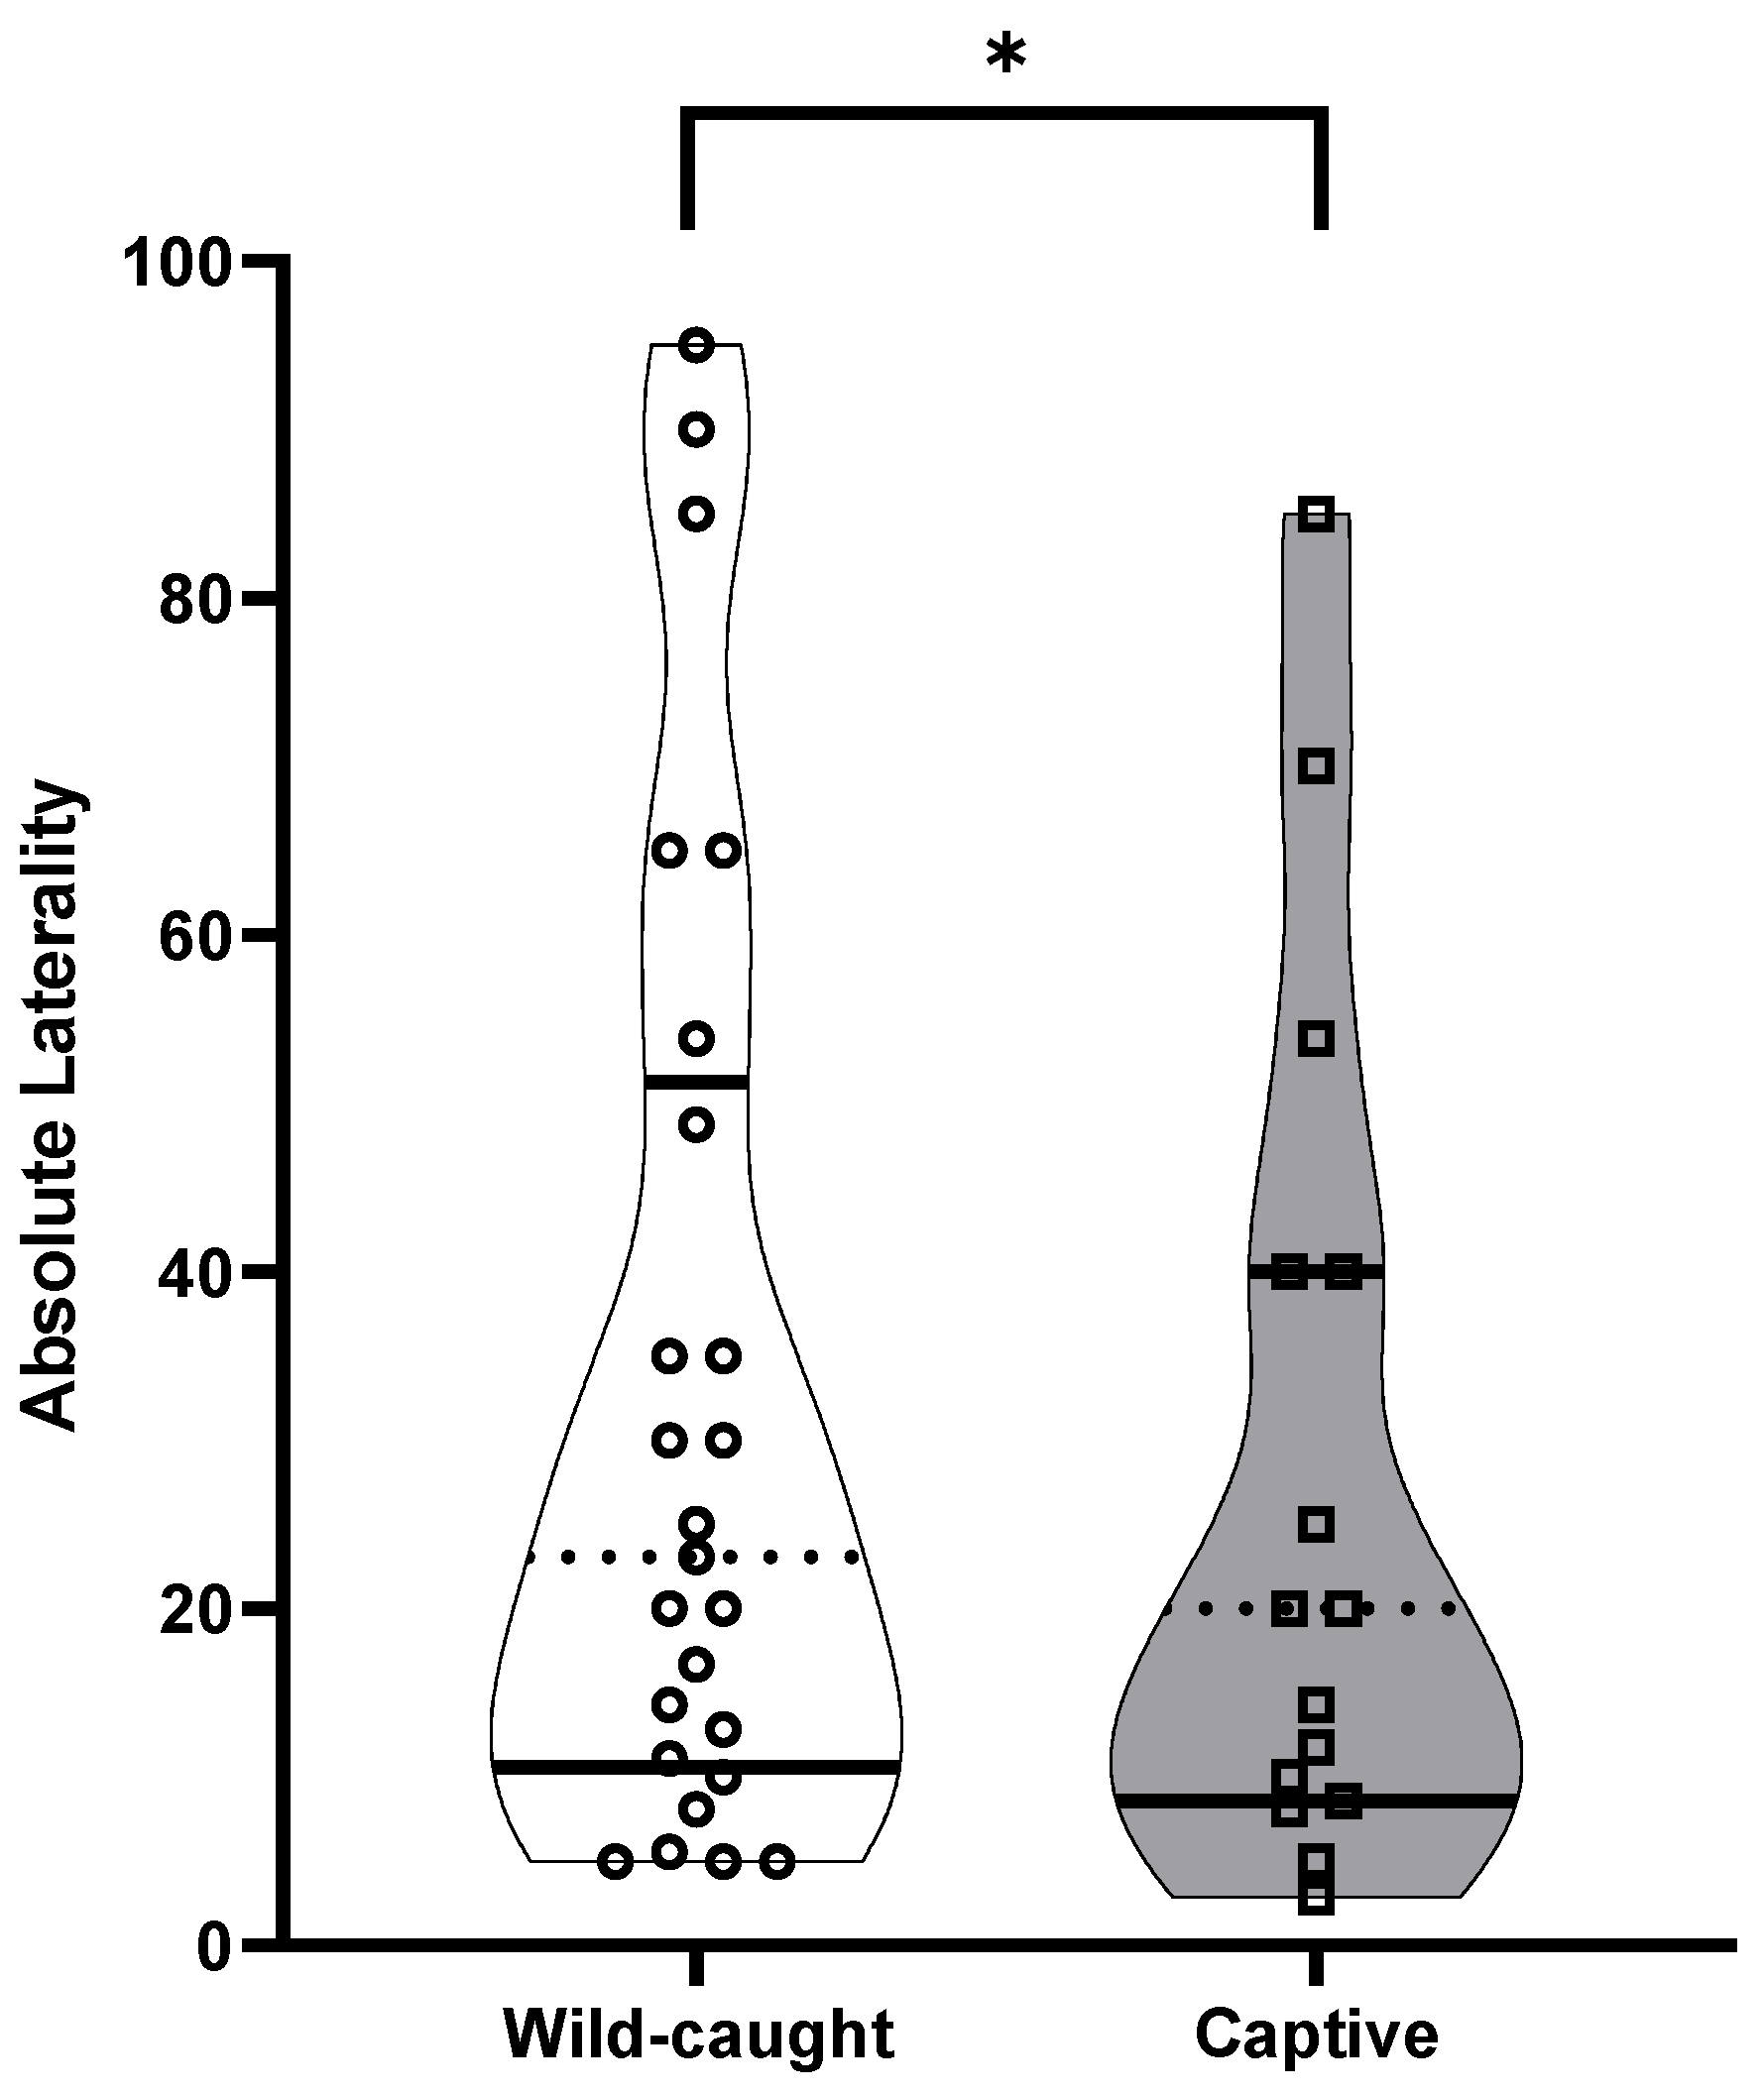
The best general linear model for AL (strength of the bias) showed that colony (t = −5.741, p < 0.001), breeding status (t = 2.241, p = 0.03) and captivity (t = −2.520, p = 0.02) each contributed significantly to the variation in AL. Post hoc analyses revealed that queens (AL: 22.48 ± 7.38) and subordinates (AL: 33.84 ± 5.06) significantly differed in the strength of the bias, where subordinates demonstrated stronger directional biases compared to queens (t = 2.241, p = 0.03) (Figure 2 and Figure 3). Post hoc analyses for captivity show that wild-caught individuals (AL: 32.58 ± 5.60) more often had a stronger directional bias compared to captive individuals (27.64 ± 6.48) (t = −2.520, p = 0.02) (Figure 4 and Figure 5).

4. Discussion

It has been proposed that population-level laterality likely arises only under the pretext of social selection pressures [17,20,24,30]. A study performed by Jacobs and Oosthuizen [35] found that a solitary mole rat species had a population-level left-turning bias. This contradicts the hypothesis of the social coordination of laterality (SCL). In this study, we used a eusocial mole rat, the Damaraland mole rat, to determine how a social mole rat may differ from a solitary mole rat. We expected some lateralized processes at a population level from the social species, as similar asymmetries may contribute to social interactions, cooperative behavior and colony function [16,58,59]. Similar to the solitary Cape mole rat, the social Damaraland mole rats demonstrated a population-level left-turning bias when all individuals were collectively analyzed. This reflects the dominance of the right hemisphere, and is congruent with our original prediction [35]. Interestingly, specific factors such as colony, body mass, sex and breeding status (queen or subordinate) were not associated with this population-level asymmetry. Furthermore, individual laterality differed when Damaraland mole rats were separated into captive and wild-caught populations. We found a significant difference in the strength of laterality between wild-caught and captive Damaraland mole rats, with a similar but not significant pattern observed in the solitary mole rat [35]. Only captive individuals retained their population-level left-turning bias, which was absent in the wild-caught population.
Colony affiliation, body mass, sex and breeding status did not significantly determine population-level laterality and may suggest that other factors that were not measured in the current study may preclude the observed population bias. The most likely cues used for turning biases may be sensory (olfactory [60], visual [61], tactile [62] or auditory [63]). However, some of these cues may not be relevant in this context due to their limited use in a subterranean environment. It is unlikely that Damaraland mole rats used these cues in a social sense in this current setting, as individuals were measured individually; however, this does not imply that inherent biases due to social factors are not present. One potential reason for the observed turning bias is a predator response, despite predation being more likely to occur during dispersal when animals are not protected by their subterranean niche [37,64]. Other confounding cues that were controlled for included the orientation of the maze, as mole rats may orientate themselves based on a magnetic compass [65]. Learning also would not affect turning biases, as the initial turn measured had no reward associated with it, eliminating confounding effects of dopamine on behavioral preferences [66]. Furthermore, the observed turning behavior was not influenced by thigmotaxis as individuals turned without touching the walls of the maze [67].
Captive and wild-caught mole rats are exposed to vastly different environmental conditions, and the differential exposure to atmospheric conditions (hyperoxia vs. hypoxia) could potentially affect their development [36,37]. Studies on fish and rats have demonstrated behavioral asymmetrical changes in animals exposed to changes in environmental conditions [68,69]; however, it is uncertain to what extent this type of phenomenon may affect mole rats. Due to the limited comparisons of individuals within the same group, and subordinates to queens, colonies should be investigated further as single subordinate to queen comparisons may have skewed the colony-level behavioral asymmetry. Future studies should strive for a larger sample size of individuals from the same colony and compare queens with the remainder of the colony, as well as comparing queens from different colonies. It is important to note that turning biases are motor skills in a non-social context; however, when considered for cooperative foraging, it may be relevant for the emergence of population-level laterality. This could suggest that although turning biases were used to determine population-level laterality in the social and solitary species, the mechanisms that underlie the biases may differ. It will be interesting to measure population-level laterality in the solitary and social mole rats together utilizing social cues, as was done in the mason bee and honey bee comparisons [34,59].
Rogers et al. [70] predicted that captive-bred and wild- caught populations may differ because they would be subjected to different genetic selection, as well as differing environmental influences on development. Several other comparisons between individuals from the wild and captive populations have been made, such as the manatee [71], parrots and cockatoos [21,72], chimpanzees [73], ayes-ayes [74] and rainbowfish [75], where no significant differences were found between wild and captive populations. This is in contrast to the current study, as a significant difference was observed between wild-caught and captive populations for the strength of laterality. One additional factor present in our study but absent in the others is the handling of animals while they were transferred during experimentation. Handling of the animals induces behaviors mediated by the right hemisphere, such as aggression [33,76,77,78,79,80] and stress [10,28,29,81,82], both of which can differ within wild-caught and captive individuals. Since the experimental design in the current study and the study by Jacobs and Oosthuizen [35] was identical, it is likely that the handling and the transferring of animals into the maze may have initiated a self-defense aggressive response from animals. Interestingly, agonistic interactions resulted in population-level asymmetries in a solitary species [59]. It is important to note that mole rats are generally very xenophobic and aggressive, but solitary species are more so [35,83,84]. This may suggest that aggression towards being handled, and not general aggression, may be relevant here and requires an experimental design to avoid handling and alternative means of determining behavioral asymmetry.
It has been proposed that captive individuals may benefit from being left-hemisphere-dominant due to their reduced aggression [8,10,17]. Captive Damaraland mole rats demonstrated reduced behavioral asymmetry in turning biases; however, it was still a right-hemisphere-dominant process, similar to what was observed in the Cape mole rat [35]. This suggests that despite the enrichment of a social lifestyle in captivity, negative emotional biases are still present for social mole rats in captivity [10]. Therefore, our study supports the notion that merely being social is not enough for the enrichment of animals to prevent negative emotional biases.
The relation of functional cerebral asymmetries and stress (measured as a glucocorticoid stress response) [85,86,87,88] has been investigated in several different species (reviewed by Ocklenburg et al. [81]). Stressed animals rely predominantly on the use of the right hemisphere [10,89,90,91]. Previous comparisons of glucocorticoids in Damaraland mole rats revealed similar glucocorticoid levels between subordinates and the queen in a colony; however, as a group, captive Damaraland mole rats have higher glucocorticoid levels than wild animals [92]. Stress differences are also apparent between solitary and social African mole rat species [93], where solitary mole rats have much higher stress cortisol levels as compared to social mole rats [93]. Differences in the behavioral and physiological responses of social and solitary mole rats to handling, and the resulting aggression and/or stress in response to an experimental handler, may be two critical factors that can predispose mole rats to negative emotional bias of the right hemisphere [10,14,28,81]. This may explain the population-level asymmetry that was observed in the current study, and in the Cape mole rat by Jacobs and Oosthuizen [35].
Damaraland mole rat queens were found to be less lateralized than subordinates, and since stress levels are similar between subordinates and queens, it does not explain why queens and subordinates differed in the strength of directional biases [10,28,81,92]. Several aspects of the Damaraland mole rat queen physiology, ecology and morphology may contribute to behavioral asymmetrical changes later in life [37,50,94,95,96,97]. Although most behavioral asymmetrical changes are a result of neonatal changes [31], it is not known to what extent changes associated with queen succession may affect behavioral asymmetry—for example, activational endocrine-related changes that may persist permanently [98,99]. Age-related changes may also be apparent in behavioral asymmetry. Age-related asymmetry reduction is predicted for older individuals [100,101,102,103,104] and could be relevant to our current findings, as queens are generally older than other colony members [37,105]. Importantly, social mole rats utilize reproductive suppression, which results in a reduced GnRH response in non-reproductive individuals [106,107,108] and queens having a different neuroendocrine phenotype [109]. These are some factors that separate queens from subordinates and may also result in the observed differences in behavioral asymmetry between them.

5. Conclusions

We found a population-level left-turning bias when all Damaraland mole rats were collectively analyzed, but this significance disappeared once captive and wild-captured Damaraland mole rats were analyzed separately. Captive mole rats had a lower directional strength in laterality compared to wild-caught individuals, but the population-level left-turning bias was maintained in the captive population, and was lost in the wild-caught individuals. We suggest that handling during experimentation can cause stress and aggression, resulting in agonistic interactions, and may have resulted in a left-turning bias regardless of captive or wild-caught status. We propose that experimental contexts, which may bias stress and aggression, are important factors that may give rise to population-level asymmetries even under non-social contexts. Our study considered only turning biases, but in order to determine whether the population-level asymmetries observed here were not due to stress and aggression, other social and non-social motor and/or sensory lateral processes that are devoid of agonistic and/or stressful situations should be investigated. One should also consider how captive and wild-caught populations may differ once handler-induced stress and/or aggression is absent.

Supplementary Materials

The following supporting information can be downloaded at: https://www.mdpi.com/article/10.3390/ani13040627/s1, Figure S1: The emmeans comparisons of absolute laterality (absolute value of the laterality index) between queens and subordinates (SUB), where arrows represent comparisons, and arrows which do not overlap represent significant comparisons; Figure S2: The emmeans comparisons of absolute laterality (absolute value of the laterality index) between wild-caught (W) and captive (C) individuals, where arrows represent comparisons, and arrows which do not overlap represent significant comparisons.

Author Contributions

Conceptualization, P.J.J.; Methodology, P.J.J. and M.K.O.; Formal analysis, P.J.J.; Investigation, P.J.J.; Data curation, M.K.O.; Writing—original draft, P.J.J.; Writing—review & editing, P.J.J. and M.K.O.; Funding acquisition, M.K.O. All authors have read and agreed to the published version of the manuscript.

Funding

This research was funded by the NRF grant number 91456.

Institutional Review Board Statement

This study was approved by the Animal Use and Care Committee at the University of Pretoria (EC013-09).

Informed Consent Statement

Not applicable.

Data Availability Statement

Data is contained within the article.

Conflicts of Interest

The authors declare no conflict of interest.

References

  1. Bonati, B.; Csermely, D.; Sovrano, V.A. Looking at a predator with the left or right eye: Asymmetry of response in lizards. Later. Asymmetries Body Brain Cogn. 2013, 18, 329–339. [Google Scholar] [CrossRef]
  2. George, I. Hemispheric asymmetry of songbirds. In The Two Halves of the Brain: Information Processing in the Cerebral Hemispheres; Boston Review: Boston, MA, USA, 2010; pp. 91–120. [Google Scholar]
  3. Bisazza, A.; Rogers, L.J.; Vallortigara, G. The origins of cerebral asymmetry: A review of evidence of behavioural and brain lateralization in fishes, reptiles and amphibians. Neurosci. Biobehav. Rev. 1998, 22, 411–426. [Google Scholar] [CrossRef]
  4. Petrazzini, M.E.M.; Sovrano, V.A.; Vallortigara, G.; Messina, A. Brain and behavioral asymmetry: A lesson from fish. Front. Neuroanat. 2020, 14, 11. [Google Scholar] [CrossRef]
  5. Frasnelli, E. Brain and behavioral lateralization in invertebrates. Front. Psychol. 2013, 4, 939. [Google Scholar] [CrossRef]
  6. Dadda, M.; Agrillo, C.; Bisazza, A.; Brown, C. Laterality enhances numerical skills in the guppy, Poecilia reticulata. Front. Behav. Neurosci. 2015, 9, 285. [Google Scholar] [CrossRef] [PubMed]
  7. Frasnelli, E.; Vallortigara, G.; Rogers, L.J. Left–right asymmetries of behaviour and nervous system in invertebrates. Neurosci. Biobehav. Rev. 2012, 36, 1273–1291. [Google Scholar] [CrossRef]
  8. Berlinghieri, F.; Panizzon, P.; Penry-Williams, I.L.; Brown, C. Laterality and fish welfare—A review. Appl. Anim. Behav. Sci. 2021, 236, 105239. [Google Scholar] [CrossRef]
  9. Versace, E.; Caffini, M.; Werkhoven, Z.; de Bivort, B.L. Individual, but not population asymmetries, are modulated by social environment and genotype in Drosophila melanogaster. Sci. Rep. 2020, 10, 4480. [Google Scholar] [CrossRef]
  10. Rogers, L.J. Relevance of brain and behavioural lateralization to animal welfare. Appl. Anim. Behav. Sci. 2010, 127, 1–11. [Google Scholar] [CrossRef]
  11. Chivers, D.P.; McCormick, M.I.; Allan, B.J.; Mitchell, M.D.; Gonçalves, E.J.; Bryshun, R.; Ferrari, M.C. At odds with the group: Changes in lateralization and escape performance reveal conformity and conflict in fish schools. Proc. R. Soc. B Biol. Sci. 2016, 283, 20161127. [Google Scholar] [CrossRef]
  12. McGreevy, P.; Rogers, L. Motor and sensory laterality in thoroughbred horses. Appl. Anim. Behav. Sci. 2005, 92, 337–352. [Google Scholar] [CrossRef]
  13. Rogers, L.J.; Andrew, R. Comparative Vertebrate Lateralization; Cambridge University Press: Cambridge, UK, 2002. [Google Scholar]
  14. Rogers, L.J. Brain lateralization and cognitive capacity. Animals 2021, 11, 1996. [Google Scholar] [CrossRef]
  15. Concha, M.L.; Bianco, I.H.; Wilson, S.W. Encoding asymmetry within neural circuits. Nat. Rev. Neurosci. 2012, 13, 832–843. [Google Scholar] [CrossRef]
  16. Rogers, L.J.; Vallortigara, G.; Andrew, R.J. Divided Brains: The Biology and Behaviour of Brain Asymmetries; Cambridge University Press: Cambridge, UK, 2013. [Google Scholar]
  17. Vallortigara, G.; Rogers, L. Survival with an asymmetrical brain: Advantages and disadvantages of cerebral lateralization. Behav. Brain Sci. 2005, 28, 595–596. [Google Scholar] [CrossRef]
  18. Cameron, R.; Rogers, L. Hand preference of the common marmoset (Callithrix jacchus): Problem solving and responses in a novel setting. J. Comp. Psychol. 1999, 113, 149. [Google Scholar] [CrossRef]
  19. Vallortigara, G. The evolutionary psychology of left and right: Costs and benefits of lateralization. Dev. Psychobiol. J. Int. Soc. Dev. Psychobiol. 2006, 48, 418–427. [Google Scholar] [CrossRef]
  20. Ghirlanda, S.; Vallortigara, G. The evolution of brain lateralization: A game-theoretical analysis of population structure. Proc. R. Soc. London. Ser. B Biol. Sci. 2004, 271, 853–857. [Google Scholar] [CrossRef]
  21. Wiper, M.L. Evolutionary and mechanistic drivers of laterality: A review and new synthesis. Lateral. Asymmetries Body Brain Cogn. 2017, 22, 740–770. [Google Scholar] [CrossRef] [PubMed]
  22. Cowell, P.E.; Denenberg, V.H. Development of laterality and the role of the corpus callosum in rodents and humans. In Comparative Vertebrate Lateralization; Cambridge University Press: Cambridge, UK, 2002; pp. 274–305. [Google Scholar]
  23. Byrne, R.A.; Kuba, M.J.; Meisel, D.V. Lateralized eye use in Octopus vulgaris shows antisymmetrical distribution. Anim. Behav. 2004, 68, 1107–1114. [Google Scholar] [CrossRef]
  24. Frasnelli, E.; Vallortigara, G. Individual-level and population-level lateralization: Two sides of the same coin. Symmetry 2018, 10, 739. [Google Scholar] [CrossRef]
  25. Gatto, E.; Agrillo, C.; Brown, C.; Dadda, M. Individual differences in numerical skills are influenced by brain lateralization in guppies (Poecilia reticulata). Intelligence 2019, 74, 12–17. [Google Scholar] [CrossRef]
  26. D’antonio-Bertagnolli, A.J.; Anderson, M.J. Lateral asymmetry in the freely occurring behaviour of budgerigars (Melopsittacus undulatus) and its relation to cognitive performance. Lateral. Asymmetries Body Brain Cogn. 2018, 23, 344–363. [Google Scholar] [CrossRef]
  27. Piddington, T.; Rogers, L. Strength of hand preference and dual task performance by common marmosets. Anim. Cogn. 2013, 16, 127–135. [Google Scholar] [CrossRef] [PubMed]
  28. Byrnes, E.E.; Pouca, C.V.; Brown, C. Laterality strength is linked to stress reactivity in Port Jackson sharks (Heterodontus portusjacksoni). Behav. Brain Res. 2016, 305, 239–246. [Google Scholar] [CrossRef]
  29. Barnard, S.; Matthews, L.; Messori, S.; Podaliri-Vulpiani, M.; Ferri, N. Laterality as an indicator of emotional stress in ewes and lambs during a separation test. Anim Cogn 2016, 19, 207–214. [Google Scholar] [CrossRef]
  30. Ghirlanda, S.; Frasnelli, E.; Vallortigara, G. Intraspecific competition and coordination in the evolution of lateralization. Philos. Trans. R. Soc. B Biol. Sci. 2009, 364, 861–866. [Google Scholar] [CrossRef]
  31. Denenberg, V.H. Hemispheric laterality in animals and the effects of early experience. Behav. Brain Sci. 1981, 4, 1–21. [Google Scholar] [CrossRef]
  32. Lehman, R.A. Lateralized asymmetry of behavior in animals at the population and individual level. Behav. Brain Sci. 1981, 4, 28. [Google Scholar] [CrossRef]
  33. Rogers, L.; Frasnelli, E.; Versace, E. Lateralized antennal control of aggression and sex differences in red mason bees, Osmia bicornis. Sci. Rep. 2016, 6, 29411. [Google Scholar] [CrossRef]
  34. Anfora, G.; Frasnelli, E.; Maccagnani, B.; Rogers, L.J.; Vallortigara, G. Behavioural and electrophysiological lateralization in a social (Apis mellifera) but not in a non-social (Osmia cornuta) species of bee. Behav. Brain Res. 2010, 206, 236–239. [Google Scholar] [CrossRef]
  35. Jacobs, P.J.; Oosthuizen, M.K. Laterality in the Cape mole-rat, Georychus capensis. Behav. Process. 2021, 185, 104346. [Google Scholar] [CrossRef] [PubMed]
  36. Faulkes, C.G.; Bennett, N.C. Social evolution in African mole-rats–a comparative overview. In Extraordinary Biology of the Naked Mole-Rat; Springer: Berlin/Heidelberg, Germany, 2021; pp. 1–33. [Google Scholar] [CrossRef]
  37. Bennett, N.C.; Faulkes, C.G. African Mole-Rats: Ecology and Eusociality; Cambridge University Press: Cambridge, UK, 2000. [Google Scholar]
  38. Nowak, M.A.; Tarnita, C.E.; Wilson, E.O. The evolution of eusociality. Nature 2010, 466, 1057–1062. [Google Scholar] [CrossRef] [PubMed]
  39. Crespi, B.J.; Yanega, D. The definition of eusociality. Behav. Ecol. 1995, 6, 109–115. [Google Scholar] [CrossRef]
  40. Wilson, E.O.; Hölldobler, B. Eusociality: Origin and consequences. Proc. Natl. Acad. Sci. USA 2005, 102, 13367–13371. [Google Scholar] [CrossRef]
  41. Hamilton, W.D. The evolution of altruistic behavior. Am. Nat. 1963, 97, 354–356. [Google Scholar] [CrossRef]
  42. Gardner, A.; Grafen, A. Capturing the superorganism: A formal theory of group adaptation. J. Evol. Biol. 2009, 22, 659–671. [Google Scholar] [CrossRef]
  43. Lovegrove, B. The evolution of eusociality in molerats (Bathyergidae): A question of risks, numbers, and costs. Behav. Ecol. Sociobiol. 1991, 28, 37–45. [Google Scholar] [CrossRef]
  44. Ratnieks, F.L.; Foster, K.R.; Wenseleers, T. Conflict resolution in insect societies. Annu. Rev. Entomol. 2006, 51, 581–608. [Google Scholar] [CrossRef]
  45. Burland, T.M.; Bennett, N.C.; Jarvis, J.U.; Faulkes, C.G. Eusociality in African mole-rats: New insights from patterns of genetic relatedness in the Damaraland mole-rat (Cryptomys damarensis). Proc. R. Soc. London Ser. B Biol. Sci. 2002, 269, 1025–1030. [Google Scholar] [CrossRef]
  46. Jarvis, J.U.; O’Riain, M.J.; Bennett, N.C.; Sherman, P.W. Mammalian eusociality: A family affair. Trends Ecol. Evol. 1994, 9, 47–51. [Google Scholar] [CrossRef]
  47. Michener, C.D. Comparative social behavior of bees. Annu. Rev. Entomol. 1969, 14, 299–342. [Google Scholar] [CrossRef]
  48. Sherman, P.W.; Lacey, E.A.; Reeve, H.K.; Keller, L. The eusociality continuum. Behav. Ecol. 1995, 6, 102–108. [Google Scholar] [CrossRef]
  49. Oosthuizen, M.K. Exploratory behaviour, memory and neurogenesis in the social Damaraland mole-rat (Fukomys damarensis). J. Exp. Biol. 2020, 223, jeb221093. [Google Scholar] [CrossRef] [PubMed]
  50. Francioli, Y.; Thorley, J.; Finn, K.; Clutton-Brock, T.; Zöttl, M. Breeders are less active foragers than non-breeders in wild Damaraland mole-rats. Biol. Lett. 2020, 16, 20200475. [Google Scholar] [CrossRef] [PubMed]
  51. Hickman, G. A live-trap and trapping technique for fossorial mammals. S. Afr. J. Zool. 1979, 14, 9–12. [Google Scholar] [CrossRef]
  52. Bisazza, A.; Cantalupo, C.; Capocchiano, M.; Vallortigara, G. Population lateralisation and social behaviour: A study with 16 species of fish. Lateral. Asymmetries Body Brain Cogn. 2000, 5, 269–284. [Google Scholar] [CrossRef] [PubMed]
  53. McLean, S.; Morrell, L.J. Consistency in the strength of laterality in male, but not female, guppies across different behavioural contexts. Biol. Lett. 2020, 16, 20190870. [Google Scholar] [CrossRef] [PubMed]
  54. Team, R. R Programming; R Development Core Team: Vienna, Austria, 2021. [Google Scholar]
  55. Bates, D.; Maechler, M.; Bolker, B.; Walker, S. Fitting linear mixed-effects models using lme4. J. Stat. Softw. 2015, 67, 1–48. [Google Scholar] [CrossRef]
  56. Kuznetsova, A.; Brockhoff, P.B.; Christensen, R.H.B. Package ‘lmertest’. R Package Version 2015, 2, 734. [Google Scholar]
  57. Lenth, R.; Singmann, H.; Love, J.; Buerkner, P.; Herve, M. Emmeans: Estimated marginal means, aka least-squares means. R Package Version 2018, 1, 3. [Google Scholar]
  58. O’Shea-Wheller, T.A. Honeybees show a context-dependent rightward bias. Biol. Lett. 2019, 15, 20180877. [Google Scholar] [CrossRef] [PubMed]
  59. Rogers, L.J.; Rigosi, E.; Frasnelli, E.; Vallortigara, G. A right antenna for social behaviour in honeybees. Sci. Rep. 2013, 3, 2045. [Google Scholar] [CrossRef] [PubMed]
  60. Leedale, A.E.; Thorley, J.; Clutton-Brock, T. Odour-based social recognition in Damaraland mole-rats, Fukomys damarensis. Anim. Behav. 2021, 179, 83–96. [Google Scholar] [CrossRef]
  61. Hetling, J.R.; Baig-Silva, M.S.; Comer, C.M.; Pardue, M.T.; Samaan, D.Y.; Qtaishat, N.M.; Pepperberg, D.R.; Park, T.J. Features of visual function in the naked mole-rat Heterocephalus glaber. J. Comp. Physiol. A 2005, 191, 317–330. [Google Scholar] [CrossRef]
  62. Costanzo, M.S. Aspects of Memory in the Damaraland Mole-Rat, Cryptomys damarensis: Spatial Learning and Kin Recognition. Ph.D. Thesis, University of Pretoria, Pretoria, South Africa, 2007. [Google Scholar]
  63. Pyott, S.J.; van Tuinen, M.; Screven, L.A.; Schrode, K.M.; Bai, J.-P.; Barone, C.M.; Price, S.D.; Lysakowski, A.; Sanderford, M.; Kumar, S. Functional, morphological, and evolutionary characterization of hearing in subterranean, eusocial African mole-rats. Curr. Biol. 2020, 30, 4329–4341.e4. [Google Scholar] [CrossRef] [PubMed]
  64. Rickard, C.; Bennett, N. Recrudescence of sexual activity in a reproductively quiescent colony of the Damaraland mole-rat (Cryptomys damarensis), by the introduction of an unfamiliar and genetically unrelated male—A case of incest avoidance in ‘queenless’ colonies. J. Zool. 1997, 241, 185–202. [Google Scholar] [CrossRef]
  65. Lovegrove, B.G.; Körtner, G.; Körtner, G. The magnetic compass orientation of the burrows of the Damara mole-rat Cryptomys damarensis (Bathyergidae). J. Zool. 1992, 226, 631–633. [Google Scholar] [CrossRef]
  66. Glick, S.D.; Ross, D.A. Right-sided population bias and lateralization of activity in normal rats. Brain Res. 1981, 205, 222–225. [Google Scholar] [CrossRef]
  67. Creed, R.; Miller, J. Interpreting animal wall-following behavior. Experientia 1990, 46, 758–761. [Google Scholar] [CrossRef]
  68. Lucon-Xiccato, T.; Nati, J.J.; Blasco, F.R.; Johansen, J.L.; Steffensen, J.F.; Domenici, P. Severe hypoxia impairs lateralization in a marine teleost fish. J. Exp. Biol. 2014, 217, 4115–4118. [Google Scholar]
  69. Arteni, N.; Pereira, L.; Rodrigues, A.; Lavinsky, D.; Achaval, M.; Netto, C. Lateralized and sex-dependent behavioral and morphological effects of unilateral neonatal cerebral hypoxia-ischemia in the rat. Behav. Brain Res. 2010, 210, 92–98. [Google Scholar] [CrossRef] [PubMed]
  70. Rogers, L.J. Lateralised brain function in anurans: Comparison to lateralisation in other vertebrates. Lateral. Asymmetries Body Brain Cogn. 2002, 7, 219–239. [Google Scholar] [CrossRef] [PubMed]
  71. Tyler-Julian, K.; Chapman, K.M.; Frances, C.; Bauer, G.B. Behavioral lateralization in the Florida manatee (Trichechus manatus latirostris). Int. J. Comp. Psychol. 2016, 29. [Google Scholar] [CrossRef]
  72. Brown, C.; Magat, M. The evolution of lateralized foot use in parrots: A phylogenetic approach. Behav. Ecol. 2011, 22, 1201–1208. [Google Scholar] [CrossRef]
  73. Hopkins, W.; Russell, J.; Schaeffer, J.; Gardner, M.; Schapiro, S. Handedness for tool use in captive chimpanzees (Pan troglodytes): Sex differences, performance, heritability and comparison to the wild. Behaviour 2009, 146, 1463–1483. [Google Scholar]
  74. Lhota, S.; Jůnek, T.; Bartoš, L. Patterns and laterality of hand use in free-ranging aye-ayes (Daubentonia madagascariensis) and a comparison with captive studies. J. Ethol. 2009, 27, 419–428. [Google Scholar] [CrossRef]
  75. Bibost, A.-L.; Brown, C. Laterality influences schooling position in rainbowfish, Melanotaenia spp. PLoS ONE 2013, 8, e80907. [Google Scholar] [CrossRef]
  76. Ariyomo, T.O.; Watt, P.J. Aggression and sex differences in lateralization in the zebrafish. Anim. Behav. 2013, 86, 617–622. [Google Scholar] [CrossRef]
  77. Austin, N.; Rogers, L. Limb preferences and lateralization of aggression, reactivity and vigilance in feral horses, Equus caballus. Anim. Behav. 2012, 83, 239–247. [Google Scholar] [CrossRef]
  78. Rohlfs, P.; Ramírez, J.M. Aggression and brain asymmetries: A theoretical review. Aggress. Violent Behav. 2006, 11, 283–297. [Google Scholar] [CrossRef]
  79. Hews, D.K.; Castellano, M.; Hara, E. Aggression in females is also lateralized: Left-eye bias during aggressive courtship rejection in lizards. Anim. Behav. 2004, 68, 1201–1207. [Google Scholar] [CrossRef]
  80. Bisazza, A.; de Santi, A. Lateralization of aggression in fish. Behav. Brain Res. 2003, 141, 131–136. [Google Scholar] [CrossRef] [PubMed]
  81. Ocklenburg, S.; Korte, S.M.; Peterburs, J.; Wolf, O.T.; Güntürkün, O. Stress and laterality–The comparative perspective. Physiol. Behav. 2016, 164, 321–329. [Google Scholar] [CrossRef]
  82. Santin, L.; Begega, A.; Rubio, S.; Arias, J. Behaviour laterality in male rats: Influence of practice and stress. Physiol. Behav. 1996, 60, 161–164. [Google Scholar] [CrossRef]
  83. Herbst, M.; Bennett, N. Burrow architecture and burrowing dynamics of the endangered Namaqua dune mole rat (Bathyergus janetta) (Rodentia: Bathyergidae). J. Zool. 2006, 270, 420–428. [Google Scholar] [CrossRef]
  84. Herbst, M.; Jarvis, J.; Bennett, N. A field assessment of reproductive seasonality in the threatened wild Namaqua dune mole-rat (Bathyergus janetta). J. Zool. 2004, 263, 259–268. [Google Scholar] [CrossRef]
  85. Cockrem, J.F. Individual variation in glucocorticoid stress responses in animals. Gen. Comp. Endocrinol. 2013, 181, 45–58. [Google Scholar] [CrossRef]
  86. Angelier, F.; Wingfield, J.C. Importance of the glucocorticoid stress response in a changing world: Theory, hypotheses and perspectives. Gen. Comp. Endocrinol. 2013, 190, 118–128. [Google Scholar] [CrossRef]
  87. Herman, J.P.; McKlveen, J.M.; Ghosal, S.; Kopp, B.; Wulsin, A.; Makinson, R.; Scheimann, J.; Myers, B. Regulation of the hypothalamic-pituitary-adrenocortical stress response. Compr. Physiol. 2016, 6, 603. [Google Scholar]
  88. Neveu, P.J.; Moya, S. In the mouse, the corticoid stress response depends on lateralization. Brain Res. 1997, 749, 344–346. [Google Scholar] [CrossRef] [PubMed]
  89. Da Costa, A.P.; Leigh, A.E.; Man, M.-S.; Kendrick, K.M. Face pictures reduce behavioural, autonomic, endocrine and neural indices of stress and fear in sheep. Proc. R. Soc. London. Ser. B Biol. Sci. 2004, 271, 2077–2084. [Google Scholar] [CrossRef] [PubMed]
  90. Perez-Cruz, C.; Simon, M.; Czéh, B.; Flügge, G.; Fuchs, E. Hemispheric differences in basilar dendrites and spines of pyramidal neurons in the rat prelimbic cortex: Activity-and stress-induced changes. Eur. J. Neurosci. 2009, 29, 738–747. [Google Scholar] [CrossRef] [PubMed]
  91. Sullivan, R. Hemispheric asymmetry in stress processing in rat prefrontal cortex and the role of mesocortical dopamine. Stress 2004, 7, 131–143. [Google Scholar] [CrossRef]
  92. Medger, K.; Bennett, N.C.; Lutermann, H.; Ganswindt, A. Non-invasive assessment of glucocorticoid and androgen metabolite levels in cooperatively breeding Damaraland mole-rats (Fukomys damarensis). Gen. Comp. Endocrinol. 2018, 266, 202–210. [Google Scholar] [CrossRef] [PubMed]
  93. Hart, D.W.; Bennett, N.C.; Best, C.; van Jaarsveld, B.; Cheng, H.; Ivy, C.M.; Kirby, A.M.; Munro, D.; Sprenger, R.J.; Storey, K.B.; et al. Acute hypoxia induces plasma cortisol increases in social, but not solitary subterranean African mole-rat species. Gen. Comp. Endocrinol. 2023; under revision. [Google Scholar]
  94. Johnston, R.A.; Vullioud, P.; Thorley, J.; Kirveslahti, H.; Shen, L.; Mukherjee, S.; Karner, C.M.; Clutton-Brock, T.; Tung, J. Morphological and genomic shifts in mole-rat ‘queens’ increase fecundity but reduce skeletal integrity. Elife 2021, 10, e65760. [Google Scholar] [CrossRef]
  95. Voigt, C.; Bennett, N.C. Reproductive status-dependent kisspeptin and RF amide-related peptide (Rfrp) gene expression in female Damaraland mole-rats. J. Neuroendocrinol. 2018, 30, e12571. [Google Scholar] [CrossRef]
  96. Young, A.J.; Oosthuizen, M.K.; Lutermann, H.; Bennett, N.C. Physiological suppression eases in Damaraland mole-rat societies when ecological constraints on dispersal are relaxed. Horm. Behav. 2010, 57, 177–183. [Google Scholar] [CrossRef]
  97. Young, A.J.; Bennett, N.C. Morphological divergence of breeders and helpers in wild damaraland mole-rat societies. Evol. Int. J. Org. Evol. 2010, 64, 3190–3197. [Google Scholar] [CrossRef]
  98. Pfannkuche, K.A.; Bouma, A.; Groothuis, T.G. Does testosterone affect lateralization of brain and behaviour? A meta-analysis in humans and other animal species. Philos. Trans. R. Soc. B Biol. Sci. 2009, 364, 929–942. [Google Scholar] [CrossRef]
  99. Beking, T.; Geuze, R.H.; Groothuis, T.G. Investigating effects of steroid hormones on lateralization of brain and behavior. In Lateralized Brain Functions; Springer: Berlin/Heidelberg, Germany, 2017; pp. 633–666. [Google Scholar]
  100. Hausmann, M.; GuÈntuÈrkuÈn, O.; Corballis, M. Age-related changes in hemispheric asymmetry depend on sex. Lateral. Asymmetries Body Brain Cogn. 2003, 8, 277–290. [Google Scholar] [CrossRef]
  101. Dolcos, F.; Rice, H.J.; Cabeza, R. Hemispheric asymmetry and aging: Right hemisphere decline or asymmetry reduction. Neurosci. Biobehav. Rev. 2002, 26, 819–825. [Google Scholar] [CrossRef] [PubMed]
  102. Cabeza, R. Hemispheric asymmetry reduction in older adults: The HAROLD model. Psychol. Aging 2002, 17, 85. [Google Scholar] [CrossRef] [PubMed]
  103. Daselaar, S.; Cabeza, R. Age-Related Changes in Hemispheric Organization. In Cognitive Neuroscience of Aging: Linking Cognitive and Cerebral Aging; Oxford University Press: Oxford, UK, 2005; p. 325. [Google Scholar]
  104. Przybyla, A.; Haaland, K.Y.; Bagesteiro, L.B.; Sainburg, R.L. Motor asymmetry reduction in older adults. Neurosci. Lett. 2011, 489, 99–104. [Google Scholar] [CrossRef] [PubMed]
  105. Schmidt, C.M.; Jarvis, J.U.; Bennett, N.C. The long-lived queen: Reproduction and longevity in female eusocial Damaraland mole-rats (Fukomys damarensis). Afr. Zool. 2013, 48, 193–196. [Google Scholar] [CrossRef]
  106. Bennett, N.C.; Faulkes, C.G.; Molteno, A.J. Reproductive suppression in subordinate, non-breeding female Damaraland mole-rats: Two components to a lifetime of socially induced infertility. Proc. Biol. Sci. 1996, 263, 1599–1603. [Google Scholar] [CrossRef]
  107. Bennett, N.; Jarvis, J.; Faulkes, C.; Millar, R. LH responses to single doses of exogenous GnRH by freshly captured Damaraland mole-rats, Cryptomys damarensis. Reproduction 1993, 99, 81–86. [Google Scholar] [CrossRef]
  108. Molteno, A.; Bennett, N. Anovulation in non-reproductive female Damaraland mole-rats (Cryptomys damarensis). J Reprod Fertil 2000, 119, 35–42. [Google Scholar] [CrossRef]
  109. Voigt, C.; Gahr, M.; Leitner, S.; Lutermann, H.; Bennett, N. Breeding status and social environment differentially affect the expression of sex steroid receptor and aromatase mRNA in the brain of female Damaraland mole-rats. Front. Zool. 2014, 11, 38. [Google Scholar] [CrossRef]
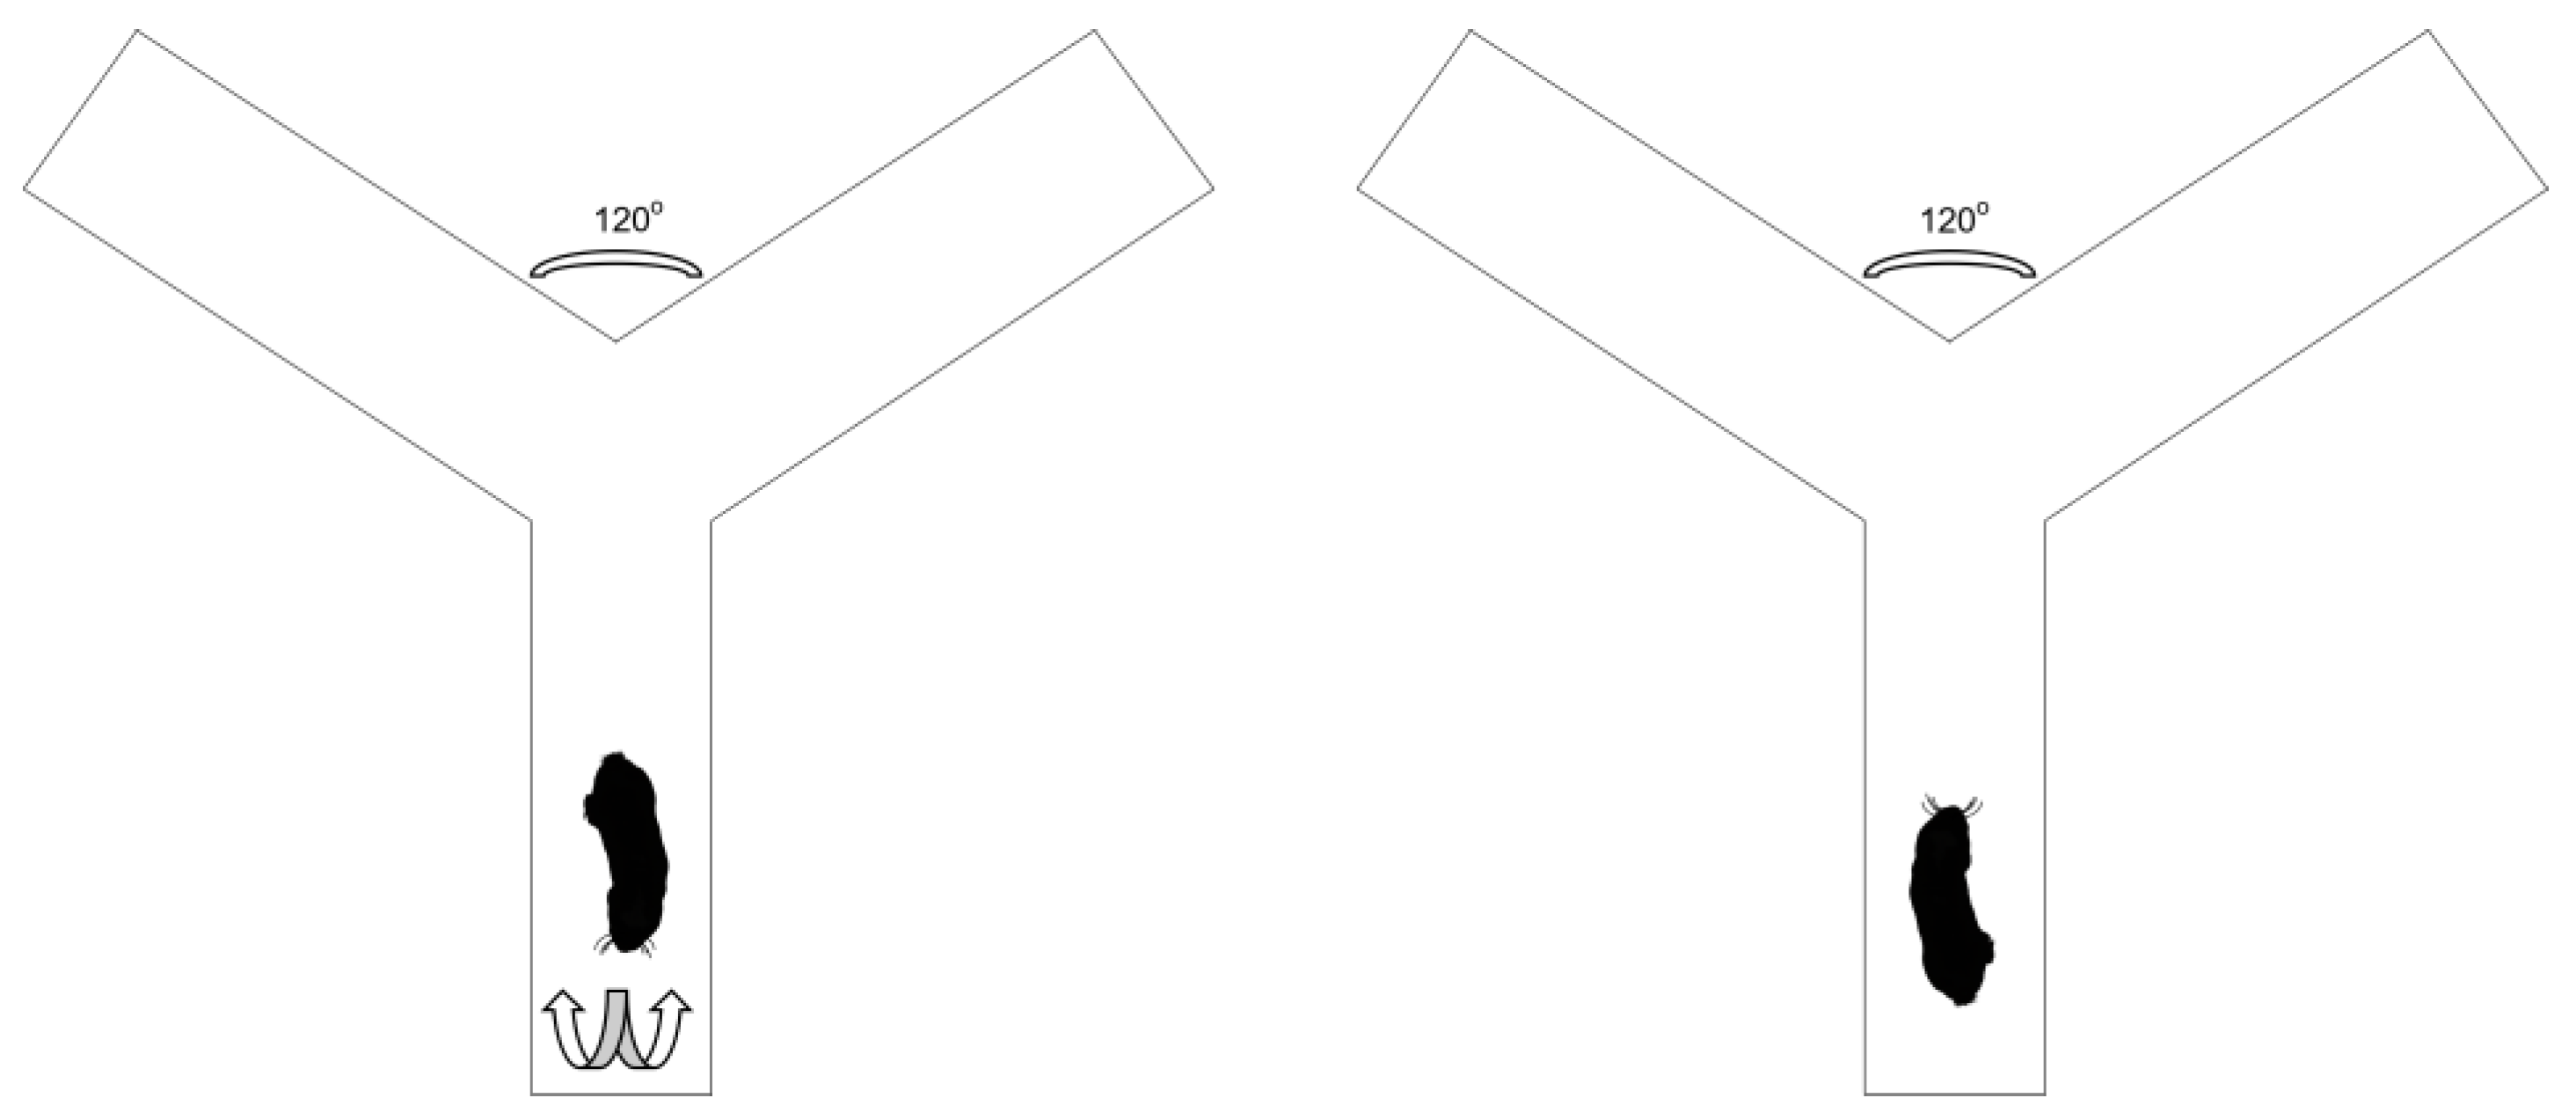
Figure 1. The setup of the Perspex Y-maze, and how individual Damaraland mole rats were placed into the Y-maze facing away from the center and had to make a directional turn in order to reach the middle of the maze. The direction of the turn to reach the middle of the maze was used as the turning bias.
Animals 13 00627 g001
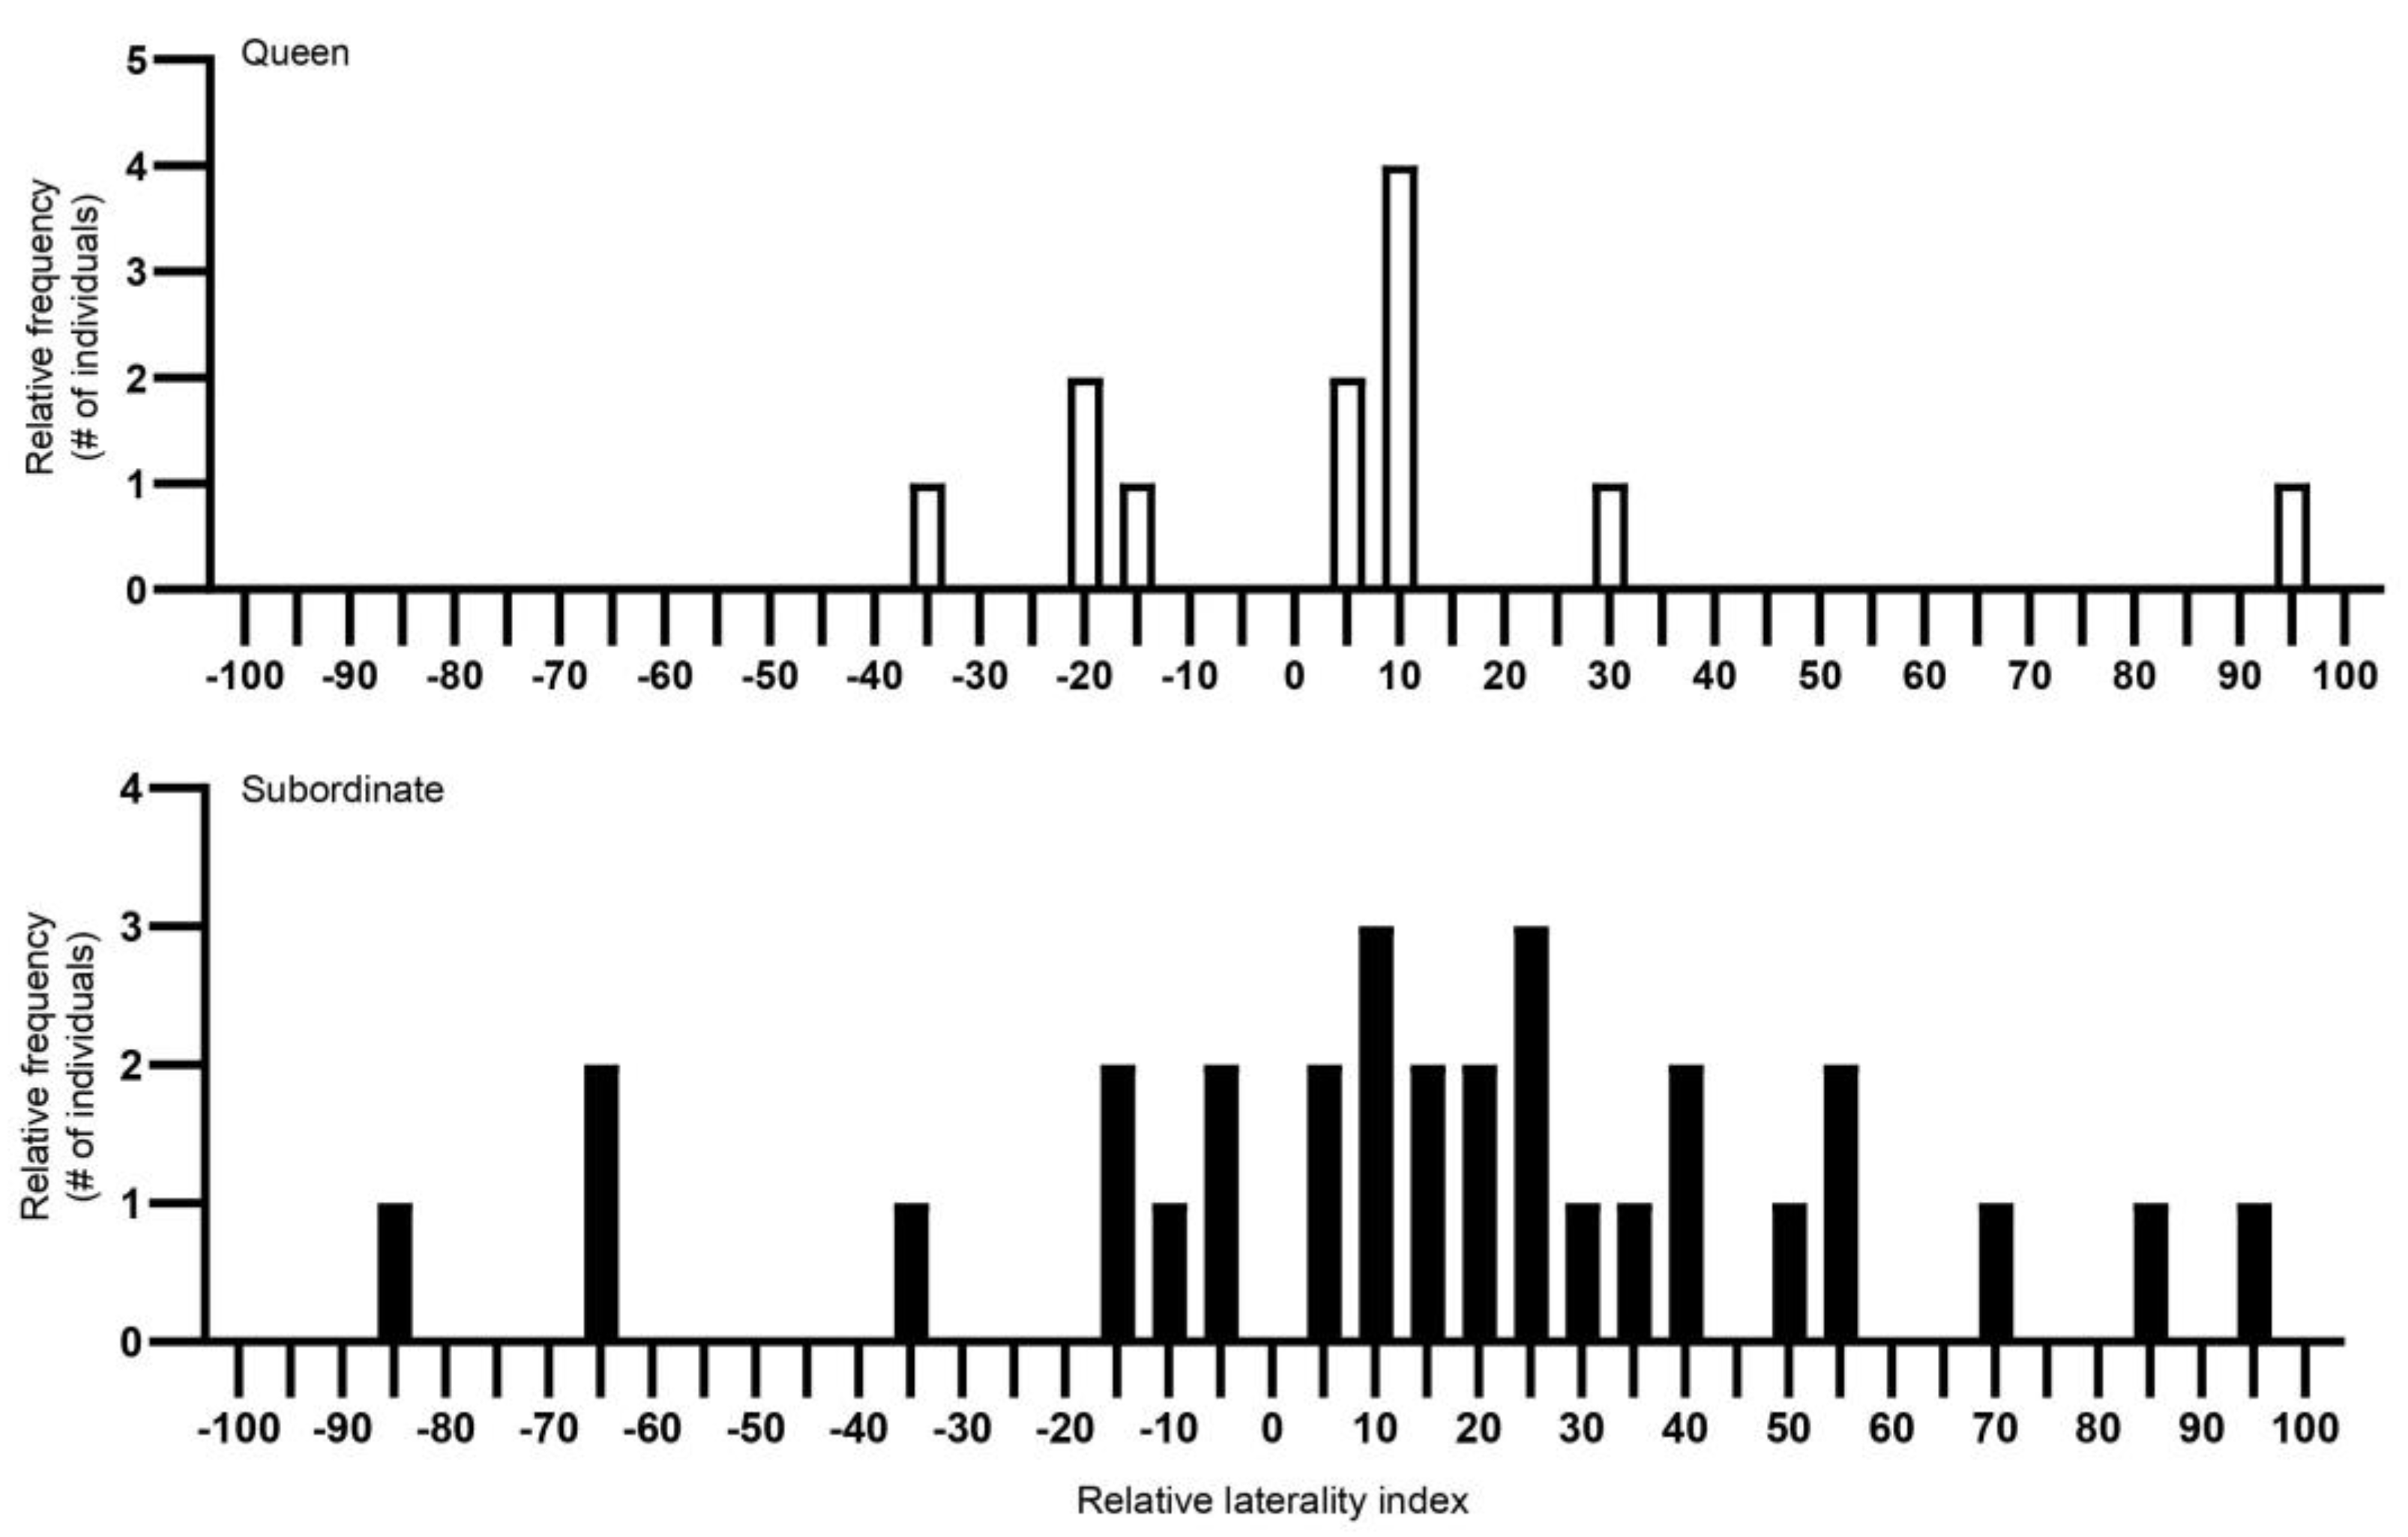
Figure 2. The relative frequency (Y-axis) of Damaraland mole rat (Fukomys damarensis) queens’ (n = 11) and non-reproductive subordinates’ (n = 29) individual laterality along a laterality index (X-axis). The Y-axis scale represents the frequency of individuals with the same lateral index. The X-axis scale from the left represents right turning, with increased turning to the left as the index increased from −100 to 100. A laterality index value of 0 means that an individual turned left and right in equal amounts, demonstrating no turning biases. White bars represent queens and black bars represent subordinates. #—number.
Animals 13 00627 g002
Figure 3. The absolute laterality (directional strength in laterality) in the Damaraland mole rat Fukomys damarensis between queens (open circles: n = 11) and non-reproductive subordinates (open squares: n = 29). The dashed line represents the median, with solid lines representing the upper and lower quartiles. * indicates significance at p < 0.05.
Animals 13 00627 g003
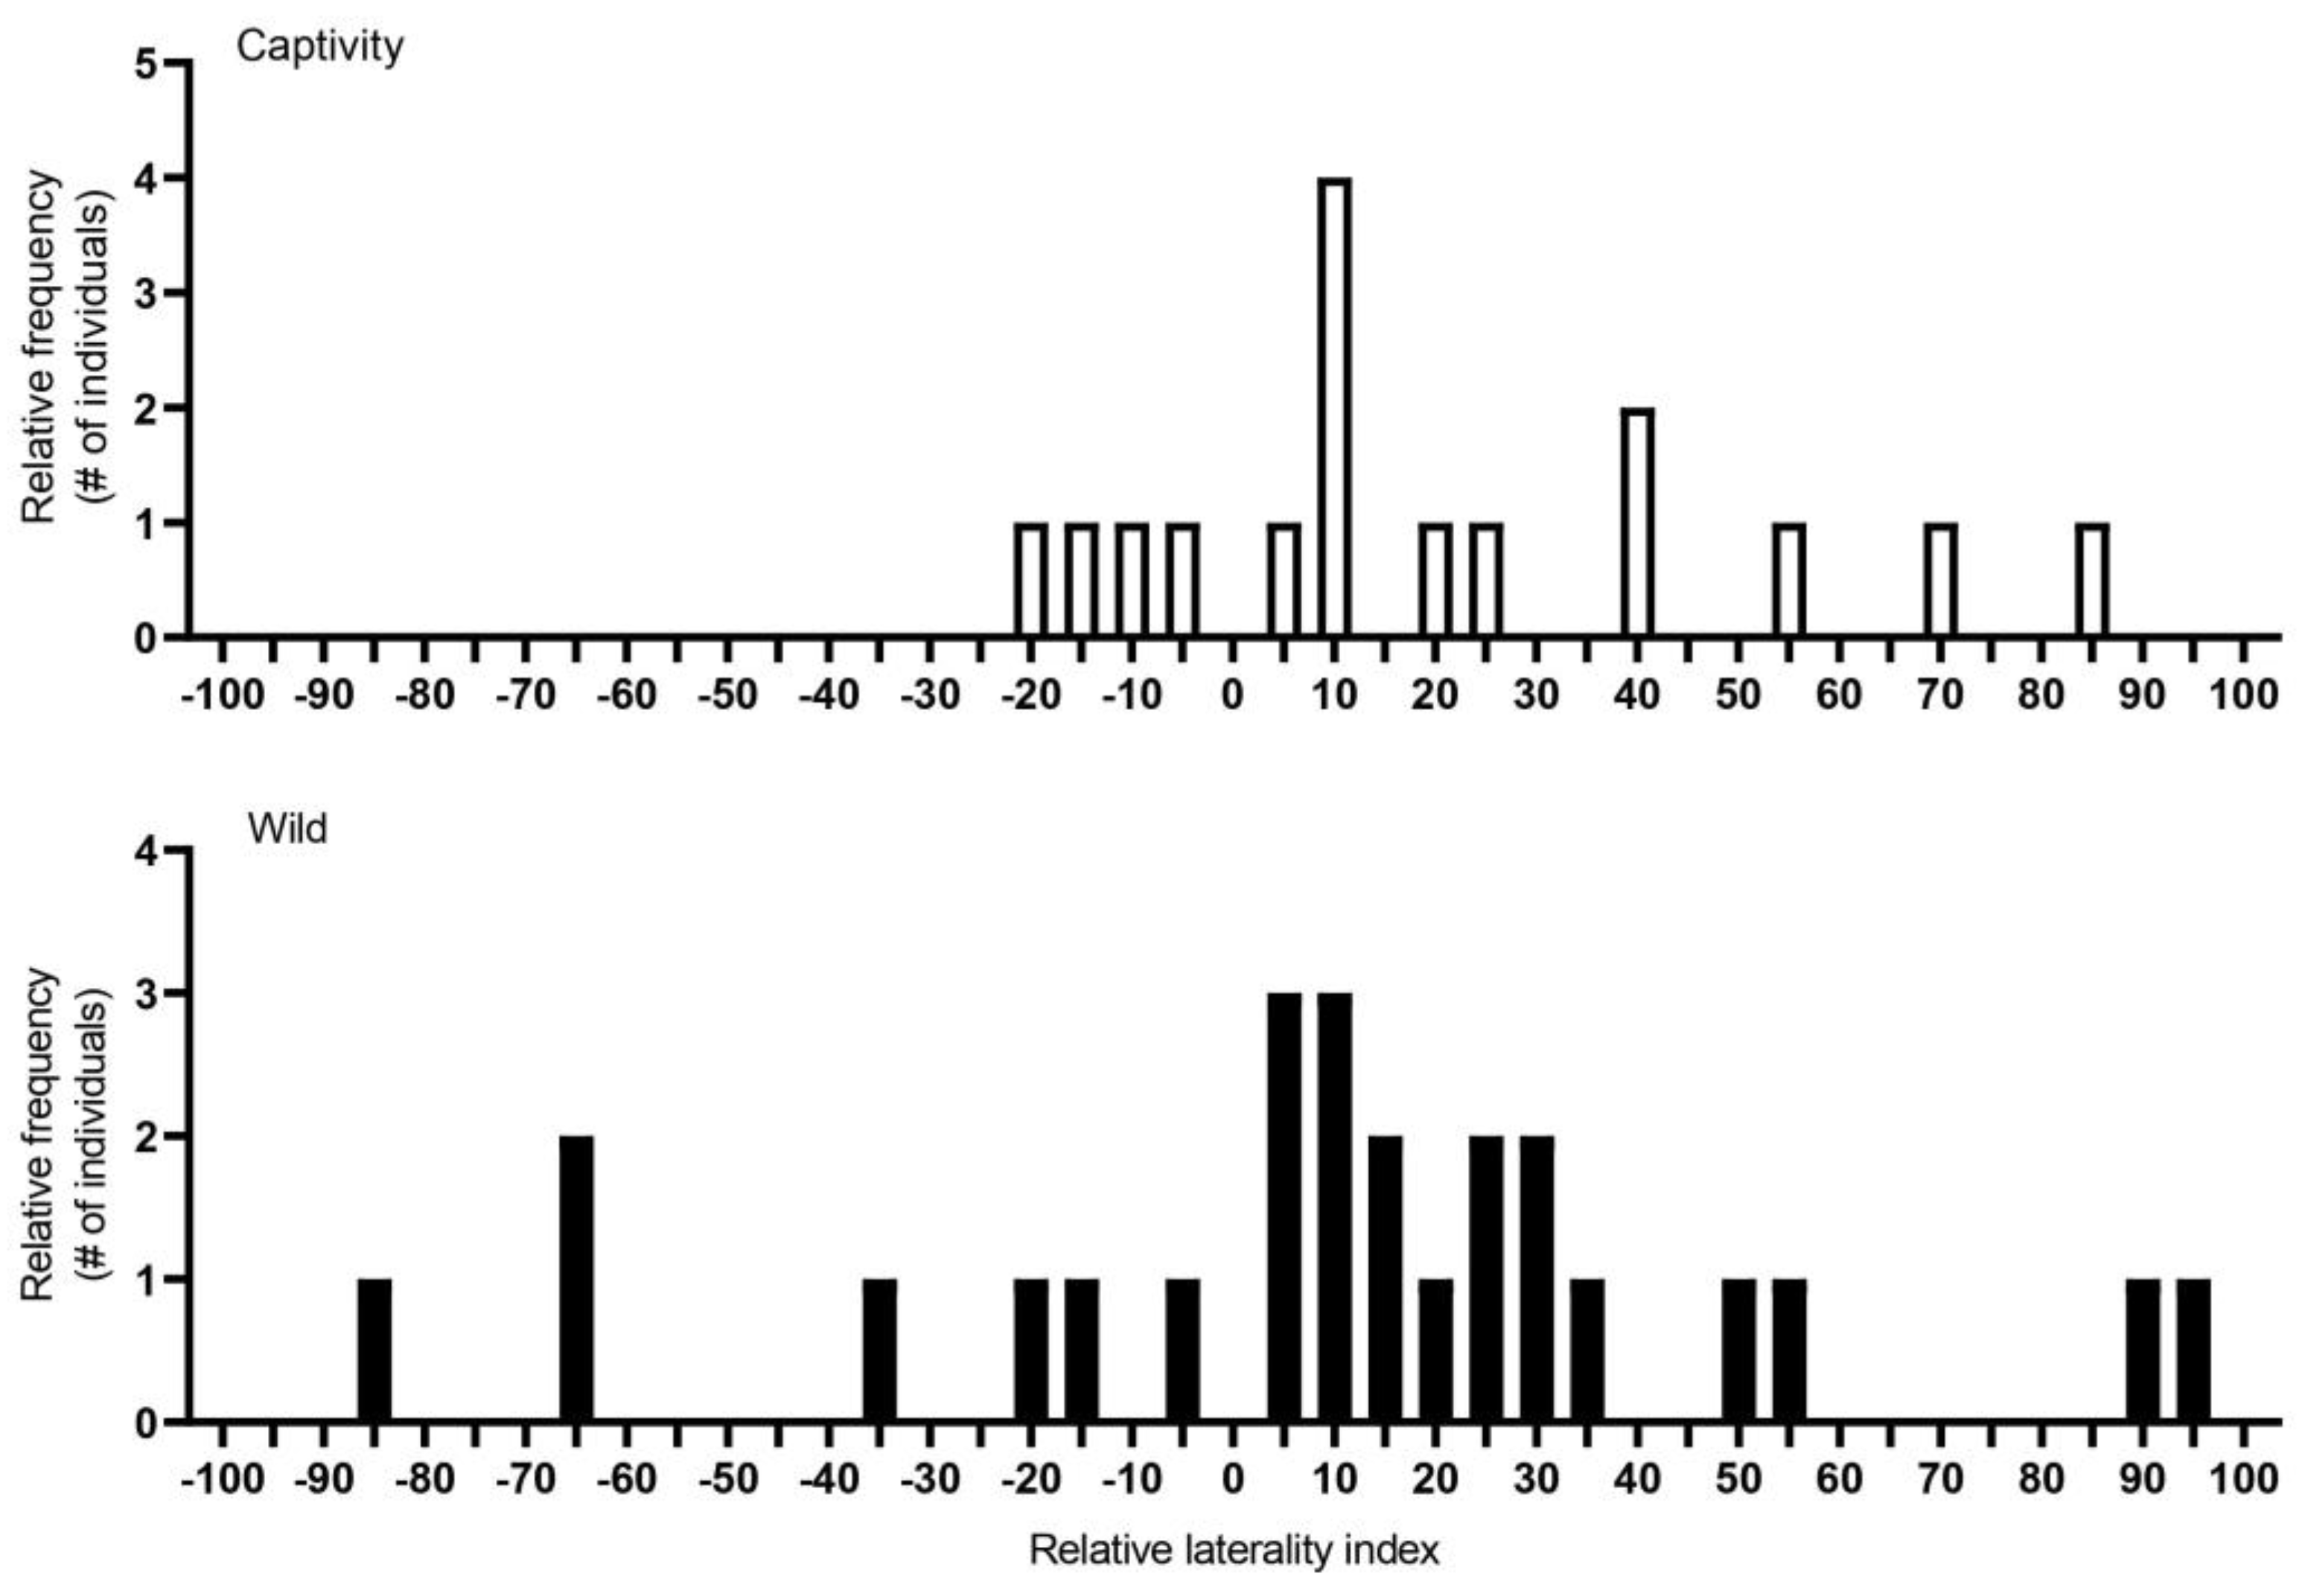
Figure 4. The relative frequency (Y-axis) of captive (n = 15) and wild-caught (n = 25) Damaraland mole rats’ (Fukomys damarensis) individual laterality along a laterality index (X-axis). The Y-axis scale represents the frequency of individuals with the same lateral index. The X-axis scale from the left represents right turning, with increased turning to the left as the index increased from −100 to 100. A laterality index of 0 means that an individual turned left and right in equal amounts, demonstrating no turning biases. Black bars represent wild-caught animals and white bars represent animals in captivity. #—number.
Animals 13 00627 g004
Figure 5. The absolute laterality (directional strength in laterality) in the Damaraland mole rat Fukomys damarensis between wild-caught (open circles: n = 25) and captive animals (open squares: n = 15). The dashed line represents the median, with solid lines representing the upper and lower quartiles. * indicates significance at p < 0.05.
Animals 13 00627 g005
Table 1. Damaraland mole rat (Fukomys damarensis) queen and non-breeding subordinate left- or right-turning bias preference from wild-caught and captive populations within their respective colonies. For each individual, the total numbers of left and right turns are given with the total number of trials, together with the two-tailed binomial significance (p or ns for not significant). Significance of the binomial probability demonstrates that an individual is lateralized.
Mole #ColonyWild/CaptiveBreeding StatusLeft TurnsRight TurnsTotal TurnsBinomial
Probability
WB11WildQueen38240p < 0.05
WB21WildSubordinate73340p < 0.05
WB32WildQueen132740p = 0.04
WB42WildSubordinate73340p < 0.05
WB52WildSubordinate192140ns
WB63WildQueen162440ns
WB73WildSubordinate211940ns
WB83WildSubordinate39140p < 0.05
WB93WildSubordinate33740p < 0.05
WT18WildSubordinate241539ns
WT28WildSubordinate271340p = 0.04
WT38WildSubordinate261440ns
WT48WildSubordinate221840ns
WT58WildQueen261440ns
WT69WildSubordinate30939p < 0.05
WT79WildQueen211940ns
WT89WildSubordinate251540ns
WT99WildSubordinate221739ns
WT109WildSubordinate241640ns
WT119WildSubordinate291039p < 0.05
LE116WildSubordinate211536ns
LE216WildSubordinate201636ns
LE316WildSubordinate191736ns
LE416WildSubordinate152035ns
LE516WildSubordinate201737ns
L911CaptiveQueen211940ns
L1011CaptiveSubordinate241640ns
L1111CaptiveSubordinate30939p < 0.05
L1211CaptiveSubordinate37340p < 0.05
L1312CaptiveQueen162440ns
L1412CaptiveSubordinate34640p < 0.05
L1512CaptiveSubordinate251540ns
L1612CaptiveSubordinate182240ns
L1712CaptiveSubordinate281240p = 0.02
L1813CaptiveQueen191534ns
L1913CaptiveSubordinate281240p = 0.02
LE1319CaptiveQueen201737ns
LE1419CaptiveSubordinate171835ns
LE1520CaptiveSubordinate191635ns
LE1620CaptiveQueen152035ns
Note: All subordinates are considered non-breeders. Mole # WB and WT were wild animals from Black Rock and Tswalu and # L and LE were laboratory animals. Significance is at p < 0.05.
Disclaimer/Publisher’s Note: The statements, opinions and data contained in all publications are solely those of the individual author(s) and contributor(s) and not of MDPI and/or the editor(s). MDPI and/or the editor(s) disclaim responsibility for any injury to people or property resulting from any ideas, methods, instructions or products referred to in the content.