Article

Comparison of the Microbiome-Metabolome Response to Copper Sulfate and Copper Glycinate in Growing Pigs

1
Key Laboratory of Livestock and Poultry Resources (Pig) Evaluation and Utilization of Ministry of Agriculture and Rural Affairs, Shanghai Engineering Research Center of Breeding Pig, Institute of Animal Husbandry & Veterinary Sciences, Shanghai Academy of Agricultural Sciences, Shanghai 201106, China
2
Institute of Animal Genetics and Breeding, College of Animal Science and Technology, Sichuan Agricultural University, Chengdu 611130, China
*
Authors to whom correspondence should be addressed.
Animals 2023, 13(3), 345; https://doi.org/10.3390/ani13030345
Submission received: 29 December 2022 / Revised: 15 January 2023 / Accepted: 17 January 2023 / Published: 19 January 2023

Abstract

:

Simple Summary

Copper sulfate and copper glycinate have been used as additives for copper supplementation and growth promotion in the swine feed industry. However, their effects on the gut microenvironment, especially for the fecal microbiota and metabolites, still remain unclear, which are the important indicators of gut health. As well as the nutrient digestibility and physiological and biochemical indices of pigs, the effects of copper sulfate and copper glycinate on fecal microbial communities and metabolic profiles were investigated to understand it better in the present study. Our results suggested that copper sulfate and copper glycinate could differentially affect fecal microbiota and metabolites, by which dietary copper glycinate exerted more beneficial effects on the gut health of pigs.

Abstract

This study aims to compare the fecal microbiome-metabolome response to copper sulfate (CuSO4) and copper glycinate (Cu-Gly) in pigs. Twelve Meishan gilts were allocated into the CuSO4 group and the Cu-Gly group (fed on a basal diet supplemented with 60 mg/kg copper from CuSO4 or Cu-Gly) paired in litter and body weight. After a two-week feeding trial, the Cu-Gly group had a higher copper digestibility, blood hemoglobin, and platelet volume and higher levels of plasma iron and insulin-like growth factor-1 than the CuSO4 group. The Cu-Gly treatment increased the abundance of the Lachnospiraceae family and the genera Lachnospiraceae XPB1014, Corprococcus_3, Anaerorhabdus_furcosa_group, Lachnospiraceae_FCS020_group, and Lachnospiraceae_NK4B4_group and decreased the abundance of the Synergistetes phylum and Peptostreptococcaceae family compared to the CuSO4 treatment. Moreover, the Cu-Gly group had a lower concentration of 20-Oxo-leukotriene E4 and higher concentrations of butyric acid, pentanoic acid, isopentanoic acid, coumarin, and Nb-p-Coumaroyl-tryptamine than the CuSO4 group. The abundance of Synergistetes was positively correlated with the fecal copper content and negatively correlated with the fecal butyric acid content. The abundance of the Lachnospiraceae_XPB1014_group genus was positively correlated with the plasma iron level and fecal contents of coumarin and butyric acid. In conclusion, Cu-Gly and CuSO4 could differentially affect fecal microbiota and metabolites, which partially contributes to the intestinal health of pigs in different manners.

Graphical Abstract

1. Introduction

Copper (Cu) is essential for animal growth, erythropoiesis, and metabolisms [1]. Copper sulfate (CuSO4) has been used as an additive at high doses for reducing diarrhea frequency and improving the growth performance of piglets over the last decades [2,3]. However, Cu chelate with amino acid or peptide (organic Cu) is a potential substitute for CuSO4 in the feed industry. Previous studies suggested that the improvements of the Cu-lysine complex in the daily gain and feed intake of piglets were greater than those of CuSO4 [4], and 100 mg/kg Cu from Cu proteinate was as effective as 250 Cu mg/kg from CuSO4 in improving the growth performance of growing pigs [5]. Finishing pigs fed with 200 mg/kg Cu as Cu-lysine had a higher weight gain than those fed with equivalent Cu as CuSO4 [6]. Similarly, the growth performance of pigs fed with 50–150 mg/kg Cu as Cu methionine hydroxy analog chelated was higher than that of those fed with 160 mg/kg Cu as CuSO4 [7]. These suggest that organic Cu could improve the growth performance and Cu utilization in pigs compared to CuSO4, whereas the underlying mechanism remains unclear.
Gut microbiota co-evolve with the host in a symbiotic relationship for nutrient digestion [8] and energy metabolism and immunity [9]. However, the dietary composition affects the gut microenvironment and consequently influences the gut microbial composition, and metabolites are the key mediators of the interaction between gut microbiota and the host [10]. Previous investigations suggested that 300 mg/kg Cu from CuSO4 reduced the relative abundance of Coprococcus (Lachnospiraceae family) and modulated microbial metabolism pathways in the gut, which may further affect the health of suckling piglets [11]. Supplemental 200 mg/kg CuSO4 increased the richness of Escherichia coli in the hindgut and altered the gut microbial metabolisms of piglets, including energy metabolism, protein metabolism, and amino acid biosynthesis [12]. Furthermore, gut microbiota can transport, metabolize, and utilize the trace elements for survival through the assimilation from diets or competing with the host [13], but the host sequester traces elements and prevents bacterial access to them through the complicated mechanisms [14]. Compared to CuSO4, finishing pigs supplemented with Cu glycinate (Cu-Gly) exhibited increased Cu utilization and an abundance of Clostridiaceae_1 in the colonic content [15]. Different from finishing pigs, the evolution of intestinal microbial communities is a more progressive [16] and variable procession in weanling and growing pigs [17]. Nevertheless, the effects of dietary Cu on the gut microbiota may depend on the experimental conditions, including the pig breed, copper source, and dosage [18]. Further studies on the mechanisms of the Cu source regulating the gut microbiota and mineral digestibility would help us to understand it better.
These findings suggested that CuSO4 and Cu-Gly may differentially affect the gut microbiome and metabolites, which partially at least play a role in the absorption of trace elements, growth axis hormones, and gut health. In order to verify the hypothesis, this study was conducted to investigate the effects of CuSO4 and Cu-Gly on the microbial communities, and metabolic profiles in the feces of growing pigs were investigated to understand them better in the present study; meanwhile, the nutrient digestibility and physiological and biochemical indices of pigs were determined.

2. Materials and Methods

2.1. Animals, Diets, and Experimental Design

Animal care and use procedures were followed in compliance with the Guidelines of the Animal Ethics Committee of Shanghai Academy of Agricultural Sciences, in accordance with standard international regulations. The experimental protocols used for research purposes in the present study were approved by the Institutional Review Board (SAASPZ0520011).
Twelve Meishan gilts (21.6 ± 1.33 kg) from three litters with the same parity were pre-treated with a basal corn-soybean diet (Table 1, without Cu addition, the intrinsic Cu level is 5.7 mg/kg) for two weeks. Afterward, the pigs were allocated to the CuSO4 group and the Cu-Gly group paired in litter and body weight (BW). Pigs in the CuSO4 group were fed the basal diet supplemented with 60 mg/kg Cu from Cu sulfate pentahydrate (CuSO4·5H2O, 25% Cu, Chelota Bio-tech Ltd., Sichuan, China), and the Cu-Gly-treated pigs were fed the basal diet supplemented with equivalent Cu from the Cu-Gly complex (21% Cu and 25% glycine, Debon Bio-tech Ltd., Hunan, China) for another two weeks, respectively. Then, 72.15 mg/kg glycine (99%, Aladdin, Shanghai, China) was added in the CuSO4-treated diet to achieve an equivalent glycine content to that in the Cu-Gly-treated diet. Pigs were individually raised in cages, receiving nipple water and feed ad libitum.
The BW and feed consumption were recorded at 8 a.m. on d14; the average daily body weight gain (ADG) and average daily feed intake (ADFI) were determined. The feed efficiency was calculated by the feed intake to the body weight gain.

2.2. Sample Collections and Preparations

Feces samples were collected by rectal distention stimulation at the beginning (d0, baseline) and the end of the experiment (d14). Blood samples were collected into vacuum tubes by jugular vein puncture. Plasma was separated by centrifuging at 3000 rpm for 15 min and stored at −20 °C until the subsequent analysis.

2.3. Chemical Analysis of Diets and Feces

Feed and feces samples were dried at 105 °C until they reached a constant weight to determine the dry matter (DM) and milled through a 40 mesh screen. Crude protein (CP) was calculated through the determination of the nitrogen (N) content by the Kjeldahl method according to the Association of Official Analytical Chemists (AOAC, 2005). The concentrations of Cu, zinc (Zn), iron (Fe), and manganese (Mn) in diets and feces were determined using an atomic absorption spectrometer (novAA 350, Analytik Jena AG, Jena, Germany) (ISO 6869: 2000). The acid-insoluble ash (AIA) method was used to measure the apparent total tract digestibility (ATTD) of DM, CP, Cu, Zn, Fe, and Mn, as previously described [19].

2.4. Measurements of Blood Physiological and Biochemical Indices

The whole blood samples were immediately used for hematology analysis using an automatic hematology analyzer (Sinothinker Technology Co., Ltd., Shenzhen, China), including the numbers of white blood cells (WBC), lymphocytes (LYM), intermediate cells (MID), neutrophilic granulocytes (GRAN), red blood cells (RBC), and platelets (PLT), as well as the hemoglobin content (HGB), mean corpuscular hemoglobin (MCH), hematocrit (HCT), mean platelet volume (MPV), platelet distribution width (PDW), plateletcrit (PCT), and platelet–larger cell ratio (P–LCR).
To determine the plasma concentrations of trace elements, 1 mL plasma sample and 6 mL nitric acid were piped into a digestion tank and digested using a closed microwave digestion system (MARS6, CEM, Matthews, NC, USA) after standing still for 2 h of cold digestion. Concentrations of plasma Cu, Zn, Fe, and Mn were determined using inductively coupled plasma mass spectrometry (iCAP TQ ICP-MS, Thermo Scientific, Waltham, MA, USA).
According to the instructions of the manufacturer, the levels of growth hormone (GH) and insulin like growth factor 1 (IGF-1) in plasma were determined with the competitive ELISA kits (Elixir Canada Medicine Company Ltd., Vancouver, BC, Canada) for porcine GH (G066SC, intra-assay CV < 5.0%, inner-assay CV < 8.3%, sensitivity is 1.0 ng/mL) and IGF-1 (I060SC, intra-assay CV < 5.3%, inner-assay CV < 6.2%, sensitivity is 1.0 ng/mL), respectively.

2.5. Pyrosequencing Analysis of Fecal Microbiome

The total genomic DNA of bacteria was extracted from the feces samples using the Ultra clean fecal DNA isolation kits (D1600, Solarbio Science & Technology, Beijing, China), according to the manufacturer’s protocol. The final DNA concentrations were determined by a Nano-Drop 1000 UV spectrophotometer (Thermo Scientific, Wilmington, DE, USA) at 260 and 280 nm, and the DNA quality was checked by 1% agarose gel electrophoresis.
The V3-V4 hypervariable regions of the bacterial 16S rRNA gene were amplified for high-throughput sequencing by polymerase chain reactions (PCR) with the universal primers 338F (5′-ACTCCTACGGGAGGCAGCAG-3′) and 806R (5′-GGACTACHVGGGTWTCTAAT-3′). Purified amplicons were purified with the QIA quick PCR purification kits (28104, Qiagen, Valencia, CA, USA). The products were quantified using the QuantiFluorTM-ST fluorescent quantitation system (Promega, Madison, WI, USA), pooled in equimolar ratios and sequenced on an Illumina MiSeq PE250 platform (Illumina, San Diego, CA, USA) according to the standard protocols of Majorbio Bio-Pharm Technology Co. Ltd. (Shanghai, China). Alpha and beta diversity analyses were performed to describe the microbial diversity among samples using the online platform of the Majorbio Cloud Platform (www.majorbio.com, accessed on 20 December 2022).

2.6. Liquid Chromatograph–Mass Spectrometer (LC–MS) Metabolomics Analysis

Fifty milligrams of feces samples were accurately weighed and extracted using a 400 µL methanol:ultrapure water (4:1) solution, with 0.02 mg/mL L-2-chlorophenylalanin as the internal standard. The mixture was settled at −10 °C, treated using a high-throughput tissue crusher (Wonbio-96c, Wanbo biotechnology Co., Ltd., Shanghai, China) at 50 Hz for 6 min, and then sonicated at 40 kHz for 30 min at 5 °C. The mixture was placed at −20 °C for 30 min to precipitate proteins and centrifuged at 13,000× g for 15 min at 4 °C. The supernatants were collected and carefully transferred to sample vials for the LC-MS analysis.
The LC-MS analysis was performed on a Thermo ultra-high-performance liquid chromatography system (UHPLC) coupled with a Thermo Q Exactive mass spectrometer (MS). Separation was achieved with an Acquity BEH C18 column (100 mm × 2.1 mm, i.d. 1.7 μm, Waters, Milford, CT, USA). The mobile phases consisted of 0.1% formic acid in water:acetonitrile (95:5, solvent A) and 0.1% formic acid in acetonitrile:isopropanol:water (47.5:47.5:5, solvent B). The sample injection volume was 2 µL, and the flow rate was 0.4 mL/min. The column temperature was maintained at 40 °C. During the analysis period, samples were stored at 4 °C.
The raw data of the UHPLC-MS analysis were imported into Progenesis QI 2.3 (Nonlinear Dynamics, Waters Corporation, Milford, MA, USA) for peak detection and alignment. The preprocessing results generated a data matrix that consisted of the retention time, mass-to-charge ratio (m/z) values, and peak intensity. The internal standard was used for data quality control (QC), and metabolic features were discarded when the relative standard deviation of QC > 30%. The mass spectra of these metabolic features were identified by using the accurate masses, MS fragments spectra and isotope ratio difference with searching in reliable biochemical databases as Human Metabolome Database (HMDB) (http://www.hmdb.ca, accessed on 16 December 2022) and Metlin database (https://metlin.scripps.edu, accessed on 25 December 2022).

2.7. Determination of Short-Chain Fatty Acids (SCFAs)

Gas chromatography analysis was performed to determine the concentrations of SCFAs in feces, as previously described [20]. A total of 1 g of each feces sample was diluted with distilled water, homogenized, and centrifuged (Heraeus Instruments, Düsseldorf, Germany) at 11,900× g for 15 min. Subsequently, 0.5 μL supernatant was injected into the gas chromatograph (7890B, Agilent Technologies, Santa Clara, CA, USA) equipped with a capillary column (30 m × 0.32 mm × 0.25 mm film thickness; Varian, Inc., Santa Clara, CA, USA) after filtrating through a 0.22 mm filter. The column, injector, and detector temperatures were 130 °C, 180 °C, and 180 °C, respectively. Crotonic acid was used as an internal standard. A standard SCFAs mixture including acetic acid, propionic acid, butyric acid, pentanoic acid, and isopentanoic acid was used for calculation, and the results were expressed as the mg/g of a fresh feces sample.

2.8. Statistical Analysis

Data organization and scientific graphing were performed using Microsoft Excel (Redmond, WA, USA) and GraphPad Prism (Version 8.0; La Jolla, CA, USA). Data analysis was performed using IBM SPSS Statistics 20.0 (IBM SPSS Statistics, Chicago, IL, USA). The statistical significance of differences was analyzed by a t-test for the paired samples of the CuSO4 and Cu-Gly groups, as well as paired samples before (d0, baseline) or after dietary Cu supplementation (d14). After confirming the normal distribution on histograms, the correlations between the microbial composition and metabolites in feces were assessed by Pearson’s correlation test using R language and the Pheatmap package. The Spearman correlations between the microbial composition and the concentrations of fecal SCFAs, trace elements, or plasma indices were analyzed on the online platform of Majorbio Cloud Platform (www.majorbio.com, accessed on 20 December 2022). All the differences were considered as statistically significant at p < 0.05.

3. Results

3.1. Growth Performance, Digestibility, and Fecal Microelement Contents

As shown in Table 2, Cu-Gly supplementation significantly increased the ADFI of pigs (p = 0.039) compared with CuSO4 supplementation. There was no difference in the final BW, ADG, and feed efficiency between the CuSO4 and Cu-Gly treatments. Compared to the CuSO4 treatment, the Cu-Gly treatment improved the ATTD of dietary Cu (p = 0.048), Fe (p = 0.021), and Mn (p = 0.048) and decreased the fecal contents of Cu (p = 0.023), Fe (p = 0.016), and Mn (p = 0.040). However, no differences in the ATTD of dietary DM, CP, and Zn as well as in their contents in feces were observed between the CuSO4 and Cu-Gly treatments.

3.2. Hematology and Plasma Indicators

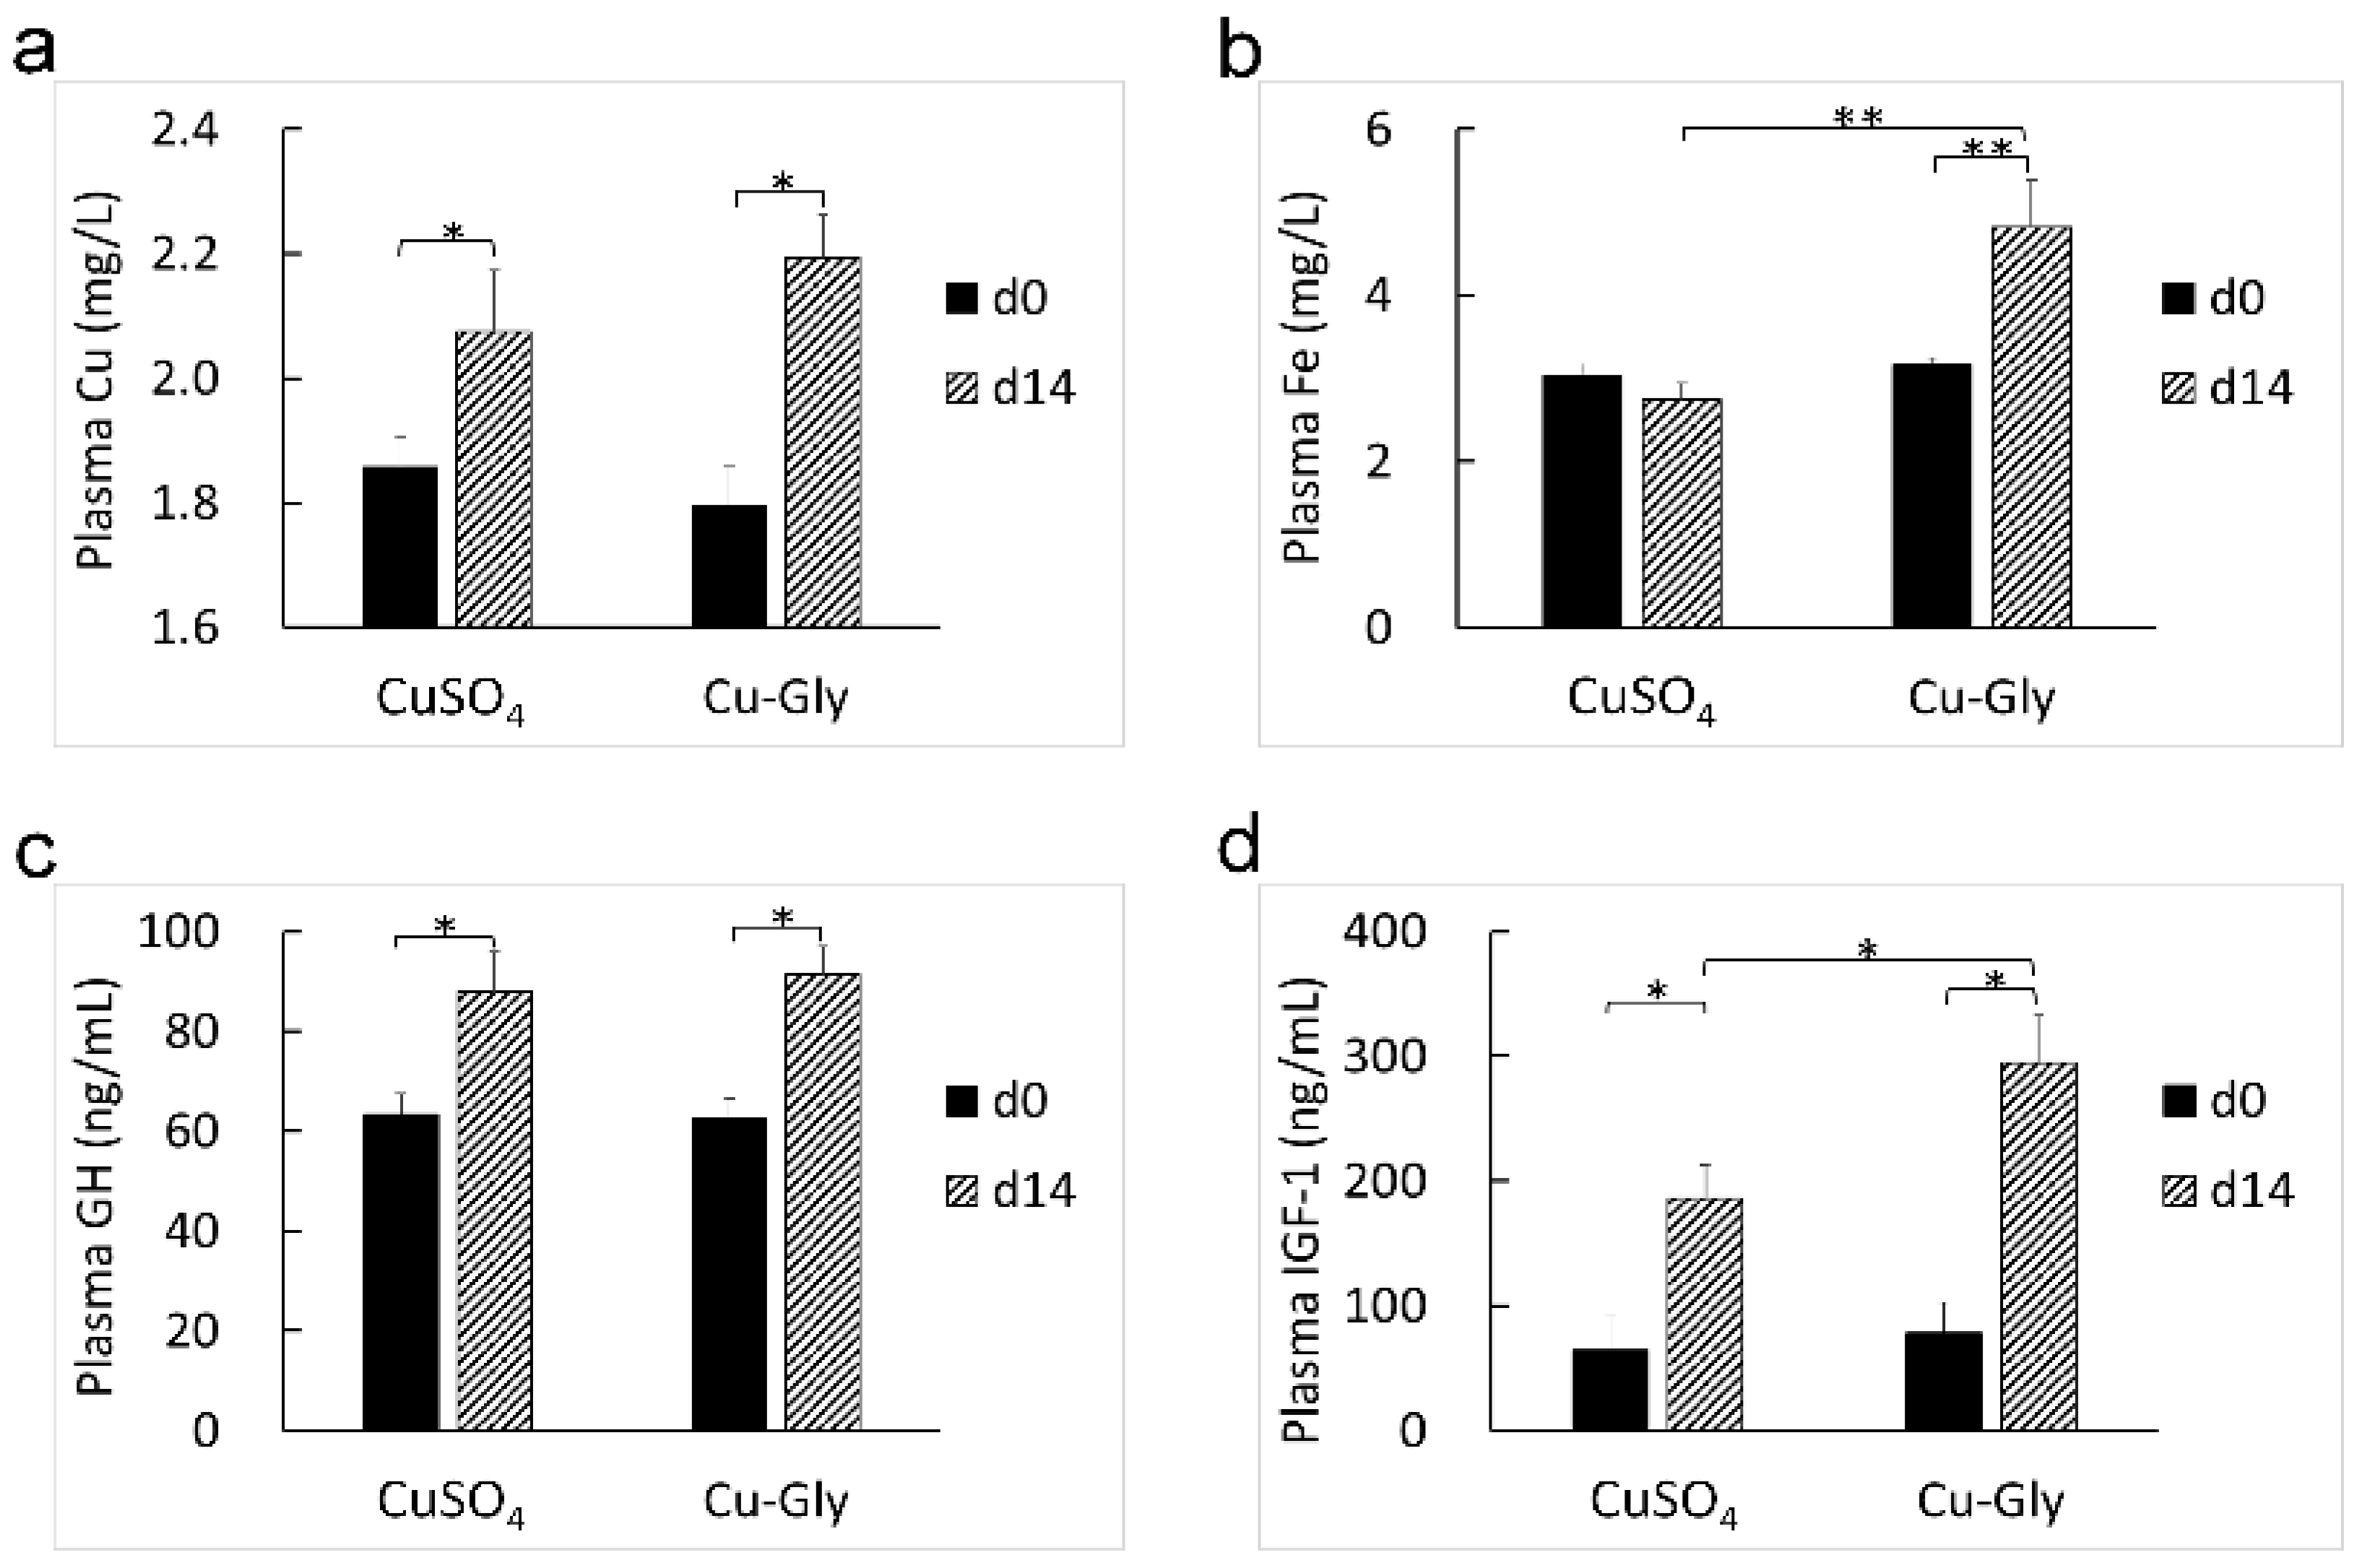
After two weeks of the experiment, the HGB (p < 0.001, p = 0.006. Figure 1a) and plasma Cu concentration (p = 0.049, 0.013. Figure 2a) increased in the CuSO4 and Cu-Gly treatments. Pigs supplemented with Cu-Gly had an increase in MPV (p = 0.001. Figure 1b), PDW (p < 0.001. Figure 1c), and P-LCR (p = 0.041. Figure 1d) and a higher plasma Fe concentration (p = 0.001. Figure 2b), while the CuSO4-treated pigs had a reduction in P-LCR (p = 0.036). The plasma Fe concentration in the Cu-Gly group was higher than that in the CuSO4 group (p = 0.002). No changes in the hematology parameters, including WBC, LYM, MID, GRAN, RBC, PLT, MCH, HCT, and PCT, were observed.
As compared to the baseline (d0), the supplementation of CuSO4 and Cu-Gly increased the plasma GH (p = 0.022, 0.018. Figure 2c) and IGF-1 levels (p = 0.030, 0.012. Figure 2d) at the end of the experiment. The Cu-Gly group had a higher plasma IGF-1 level (p = 0.039) than the CuSO4 group at the end of the experiment. Moreover, there was no difference in the plasma GH level between the CuSO4 and Cu-Gly groups.

3.3. Fecal Microbiome

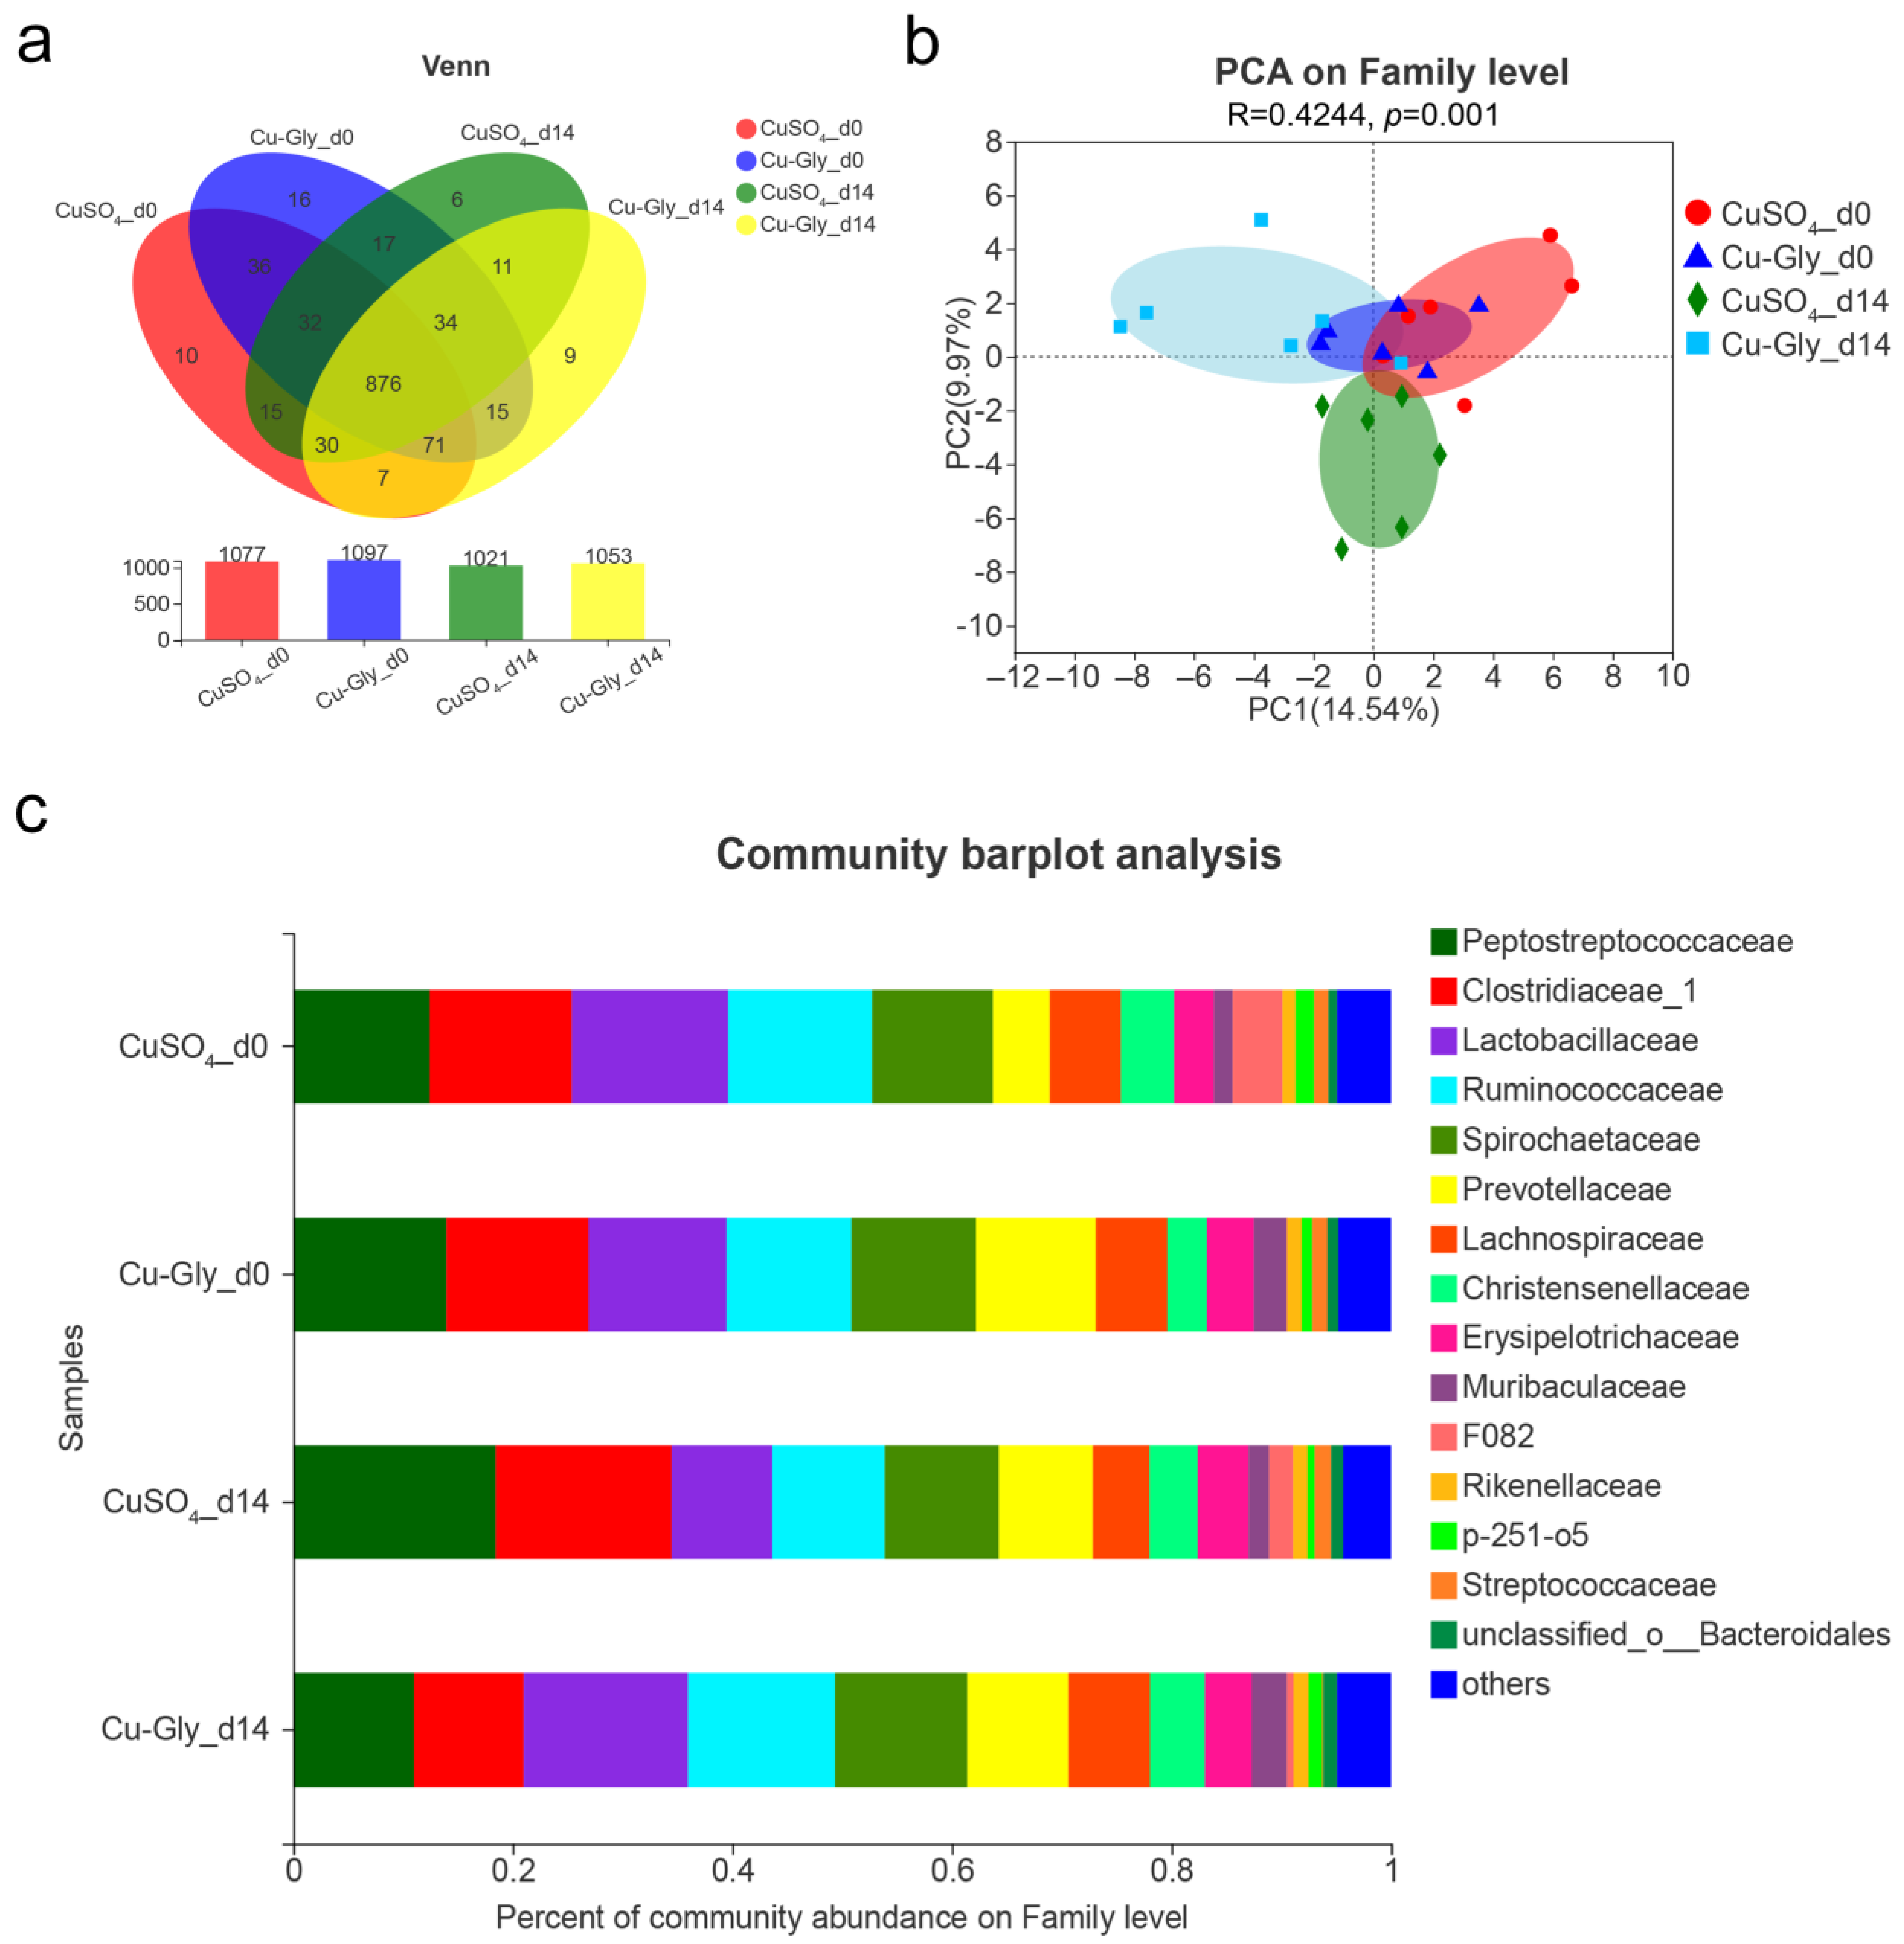
A total of 1280355 valid reads obtained from 24 samples were assigned to 1185 operational taxonomic units (OTUs) at the 97% similarity level. Rarefaction curves of the Sobs, Shannon, and Simpson indexes revealed a sufficient sequencing and sample size, and most diversity was captured. As shown in the Venn diagram (Figure 3a), the numbers of OTUs in the CuSO4 (1021 OTUs) and Cu-Gly groups (1053 OTUs) were reduced by 5.20% and 4.01%, respectively, as compared with the baseline (1077 OTUs for CuSO4 and 1097 OTUs for Cu-Gly).
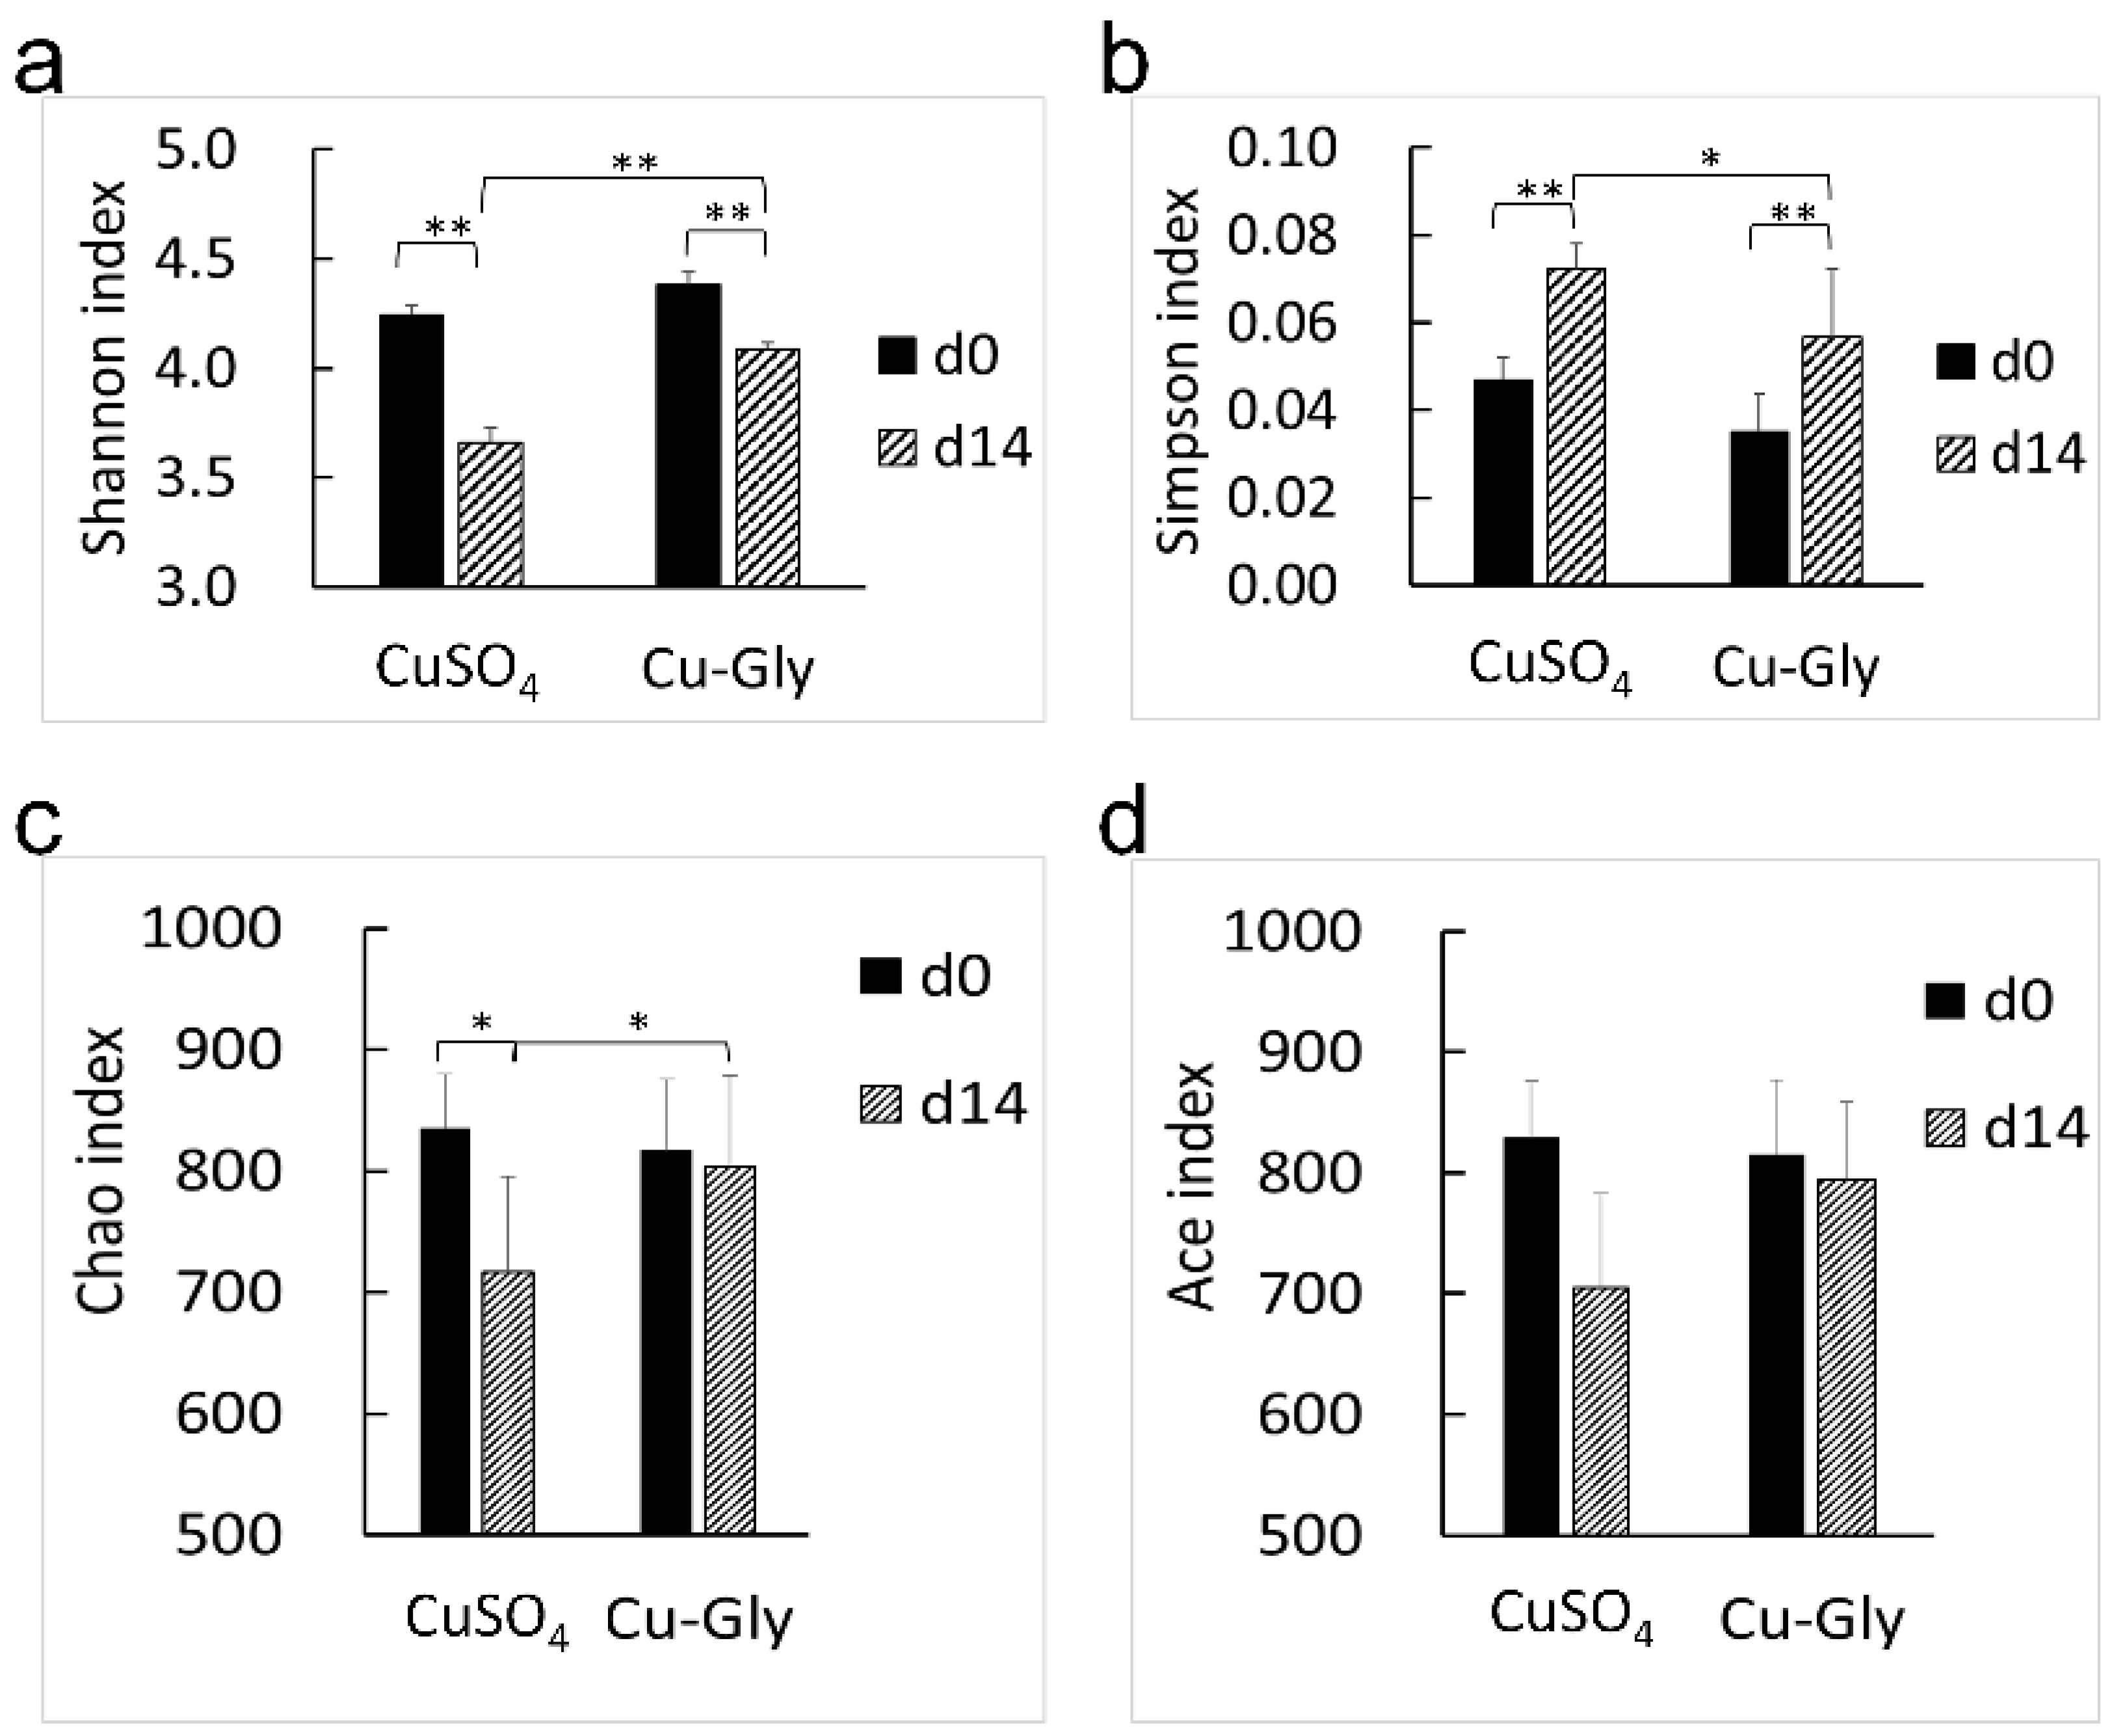
The results of alpha diversity are presented in Figure 4. The treatments of Cu-Gly and CuSO4 had a decrease in the Shannon index (p < 0.001) and an increase in the Simpson index (p = 0.014, 0.005) of the fecal microbiome at the end of the experiment, as compared with the baseline, and decreases in Ace (p = 0.004) and Chao (p = 0.06) were observed in the CuSO4 treatment. There was no change in the Ace and Chao indexes with Cu-Gly supplementation during the experiment. At the end of the experiment, the Shannon index of the Cu-Gly group was higher (p < 0.001) and the Simpson index of the Cu-Gly group was lower (p = 0.035) than those of the CuSO4 group.
Furthermore, beta diversity revealed that the microbiota community was structurally changed by supplemental CuSO4 and Cu-Gly. The two-dimensional plot of principal component analysis (PCA) indicated that the CuSO4 group displayed a distinct separation pattern from the baseline and Cu-Gly groups (Figure 3b). The composition of fecal microbiota was analyzed, and Firmicutes was the predominant phylum, varying from 67.93% to 75.37%, followed by Bacteroideteds (12.18–17.68%) and Spirochaetes (10.42–12.08%). At the family level, the dominant floras were comprised of Peptostreptococcaceae, Clostridiaceae, Lactobacillaceae, Ruminococcaceae, Spirochaetaceae, Prevotellaceae, Lachnosiraceae, and Christensenellaceae, which represent more than 80% of the diversity. Compared with the baseline (d0), CuSO4 increased the relative percent of the family Peptostreptococcaceae, Clostridiaceae, and Prevotellaceae and decreased the percent of the family Ruminococcaceae, Lactobacillaceae, and Lachnospiraceae (Figure 3c). Interestingly, a contrary trend in the percent of community abundance was observed after the Cu-Gly treament.
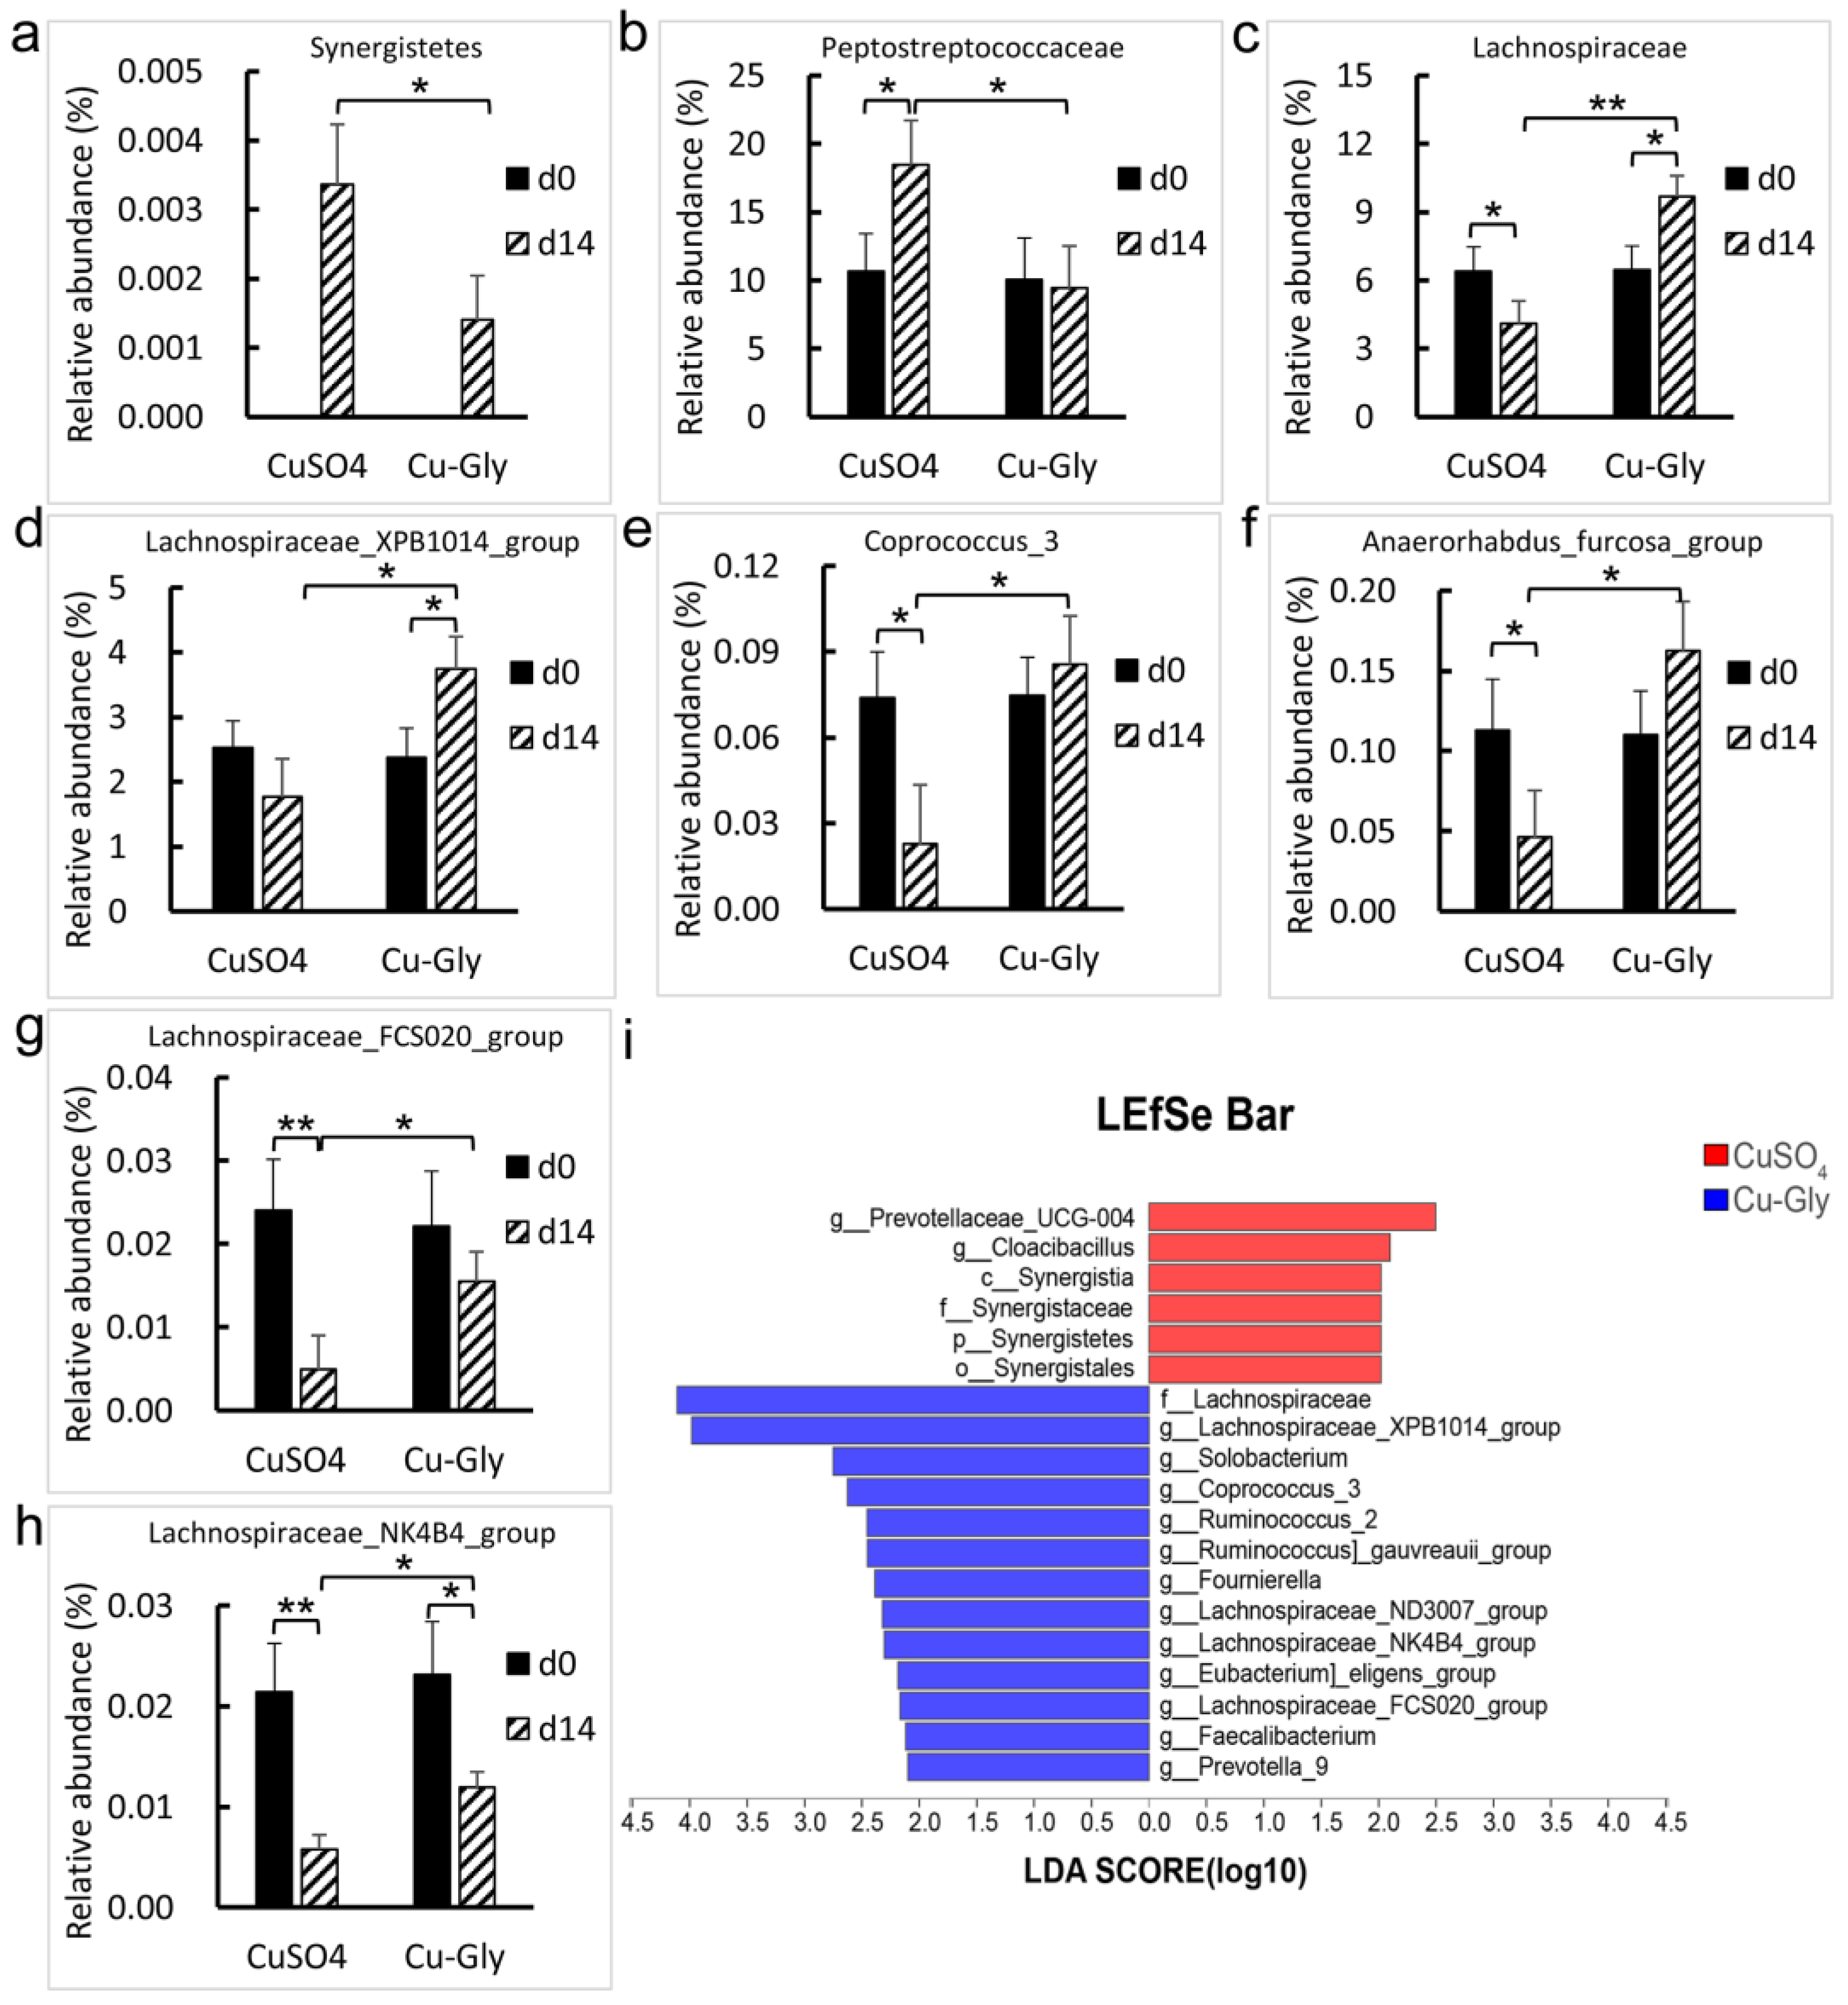
At the end of the experiment, CuSO4 increased the relative abundance of Synergistetes phylum compared to Cu-Gly (p = 0.021), though the proportion is tiny (<0.005%), and it was absent in feces at d0 (Figure 5a). Compared with the baseline, Cu-Gly-treated pigs had an increase in the abundance of the Lachnospiraceae family (p = 0.043. Figure 5c) and Lachnospiraceae_XPB1014_group genus (p = 0.046. Figure 5d) and a decrease in the Lachnospiraceae_NK4B4_group genus (p = 0.043. Figure 5h), while the CuSO4-treated pigs had an increase in the abundance of the Peptostreptococcaceae family (p = 0.035. Figure 5b) and a decrease in the abundance of the family Lachnospiraceae (p = 0.024) and the genera Corprococcus_3 (p = 0.047. Figure 5e), Anaerorhabdus_furcosa_group (p = 0.042. Figure 5f), Lachnospiraceae_FCS020_group (p = 0.008. Figure 5g), and Lachnospiraceae_NK4B4_group (p = 0.002). As compared with CuSO4, Cu-Gly had a higher abundance of the family Lachnospiraceae (p = 0.008) and the genera Lachnospiraceae XPB1014 (p = 0.038), Corprococcus_3 (p = 0.039), Anaerorhabdus_furcosa_group (p = 0.023), Lachnospiraceae_FCS020_group (p = 0.033), and Lachnospiraceae_NK4B4_group (p = 0.048) and a lower abundance of the Synergistetes phylum (p = 0.021) and the Peptostreptococcaceae family (p = 0.029) than CuSO4.
The results of the linear discriminant analysis effect size (LEfSe) indicated that the family Lachnospiraceae and the genera Lachnospiraceae (XPB1014, ND3007, NK4B4, and FCS020), Solobacterium, Coprococcus_3, Ruminococcus_2, Ruminococcus_gauvreauii_group, Fournierella, Eubacterium_eligens_group, Ruminococcus_gauvreauii_group, Faecalibacterium, and Prevotella_9 dominantly contributed to the significant difference in the microbial community of the Cu-Gly group (Figure 5i). However, the phylum Synergistetes, the class Synergistaceae, the order Synergistales, the family Synergistaceae, and the genera Prevotellaceae_UCG-004 and Cloacibacillus dominantly contributed to the significant difference in the microbial community of the CuSO4 group.

3.4. Metabolomic Profiles

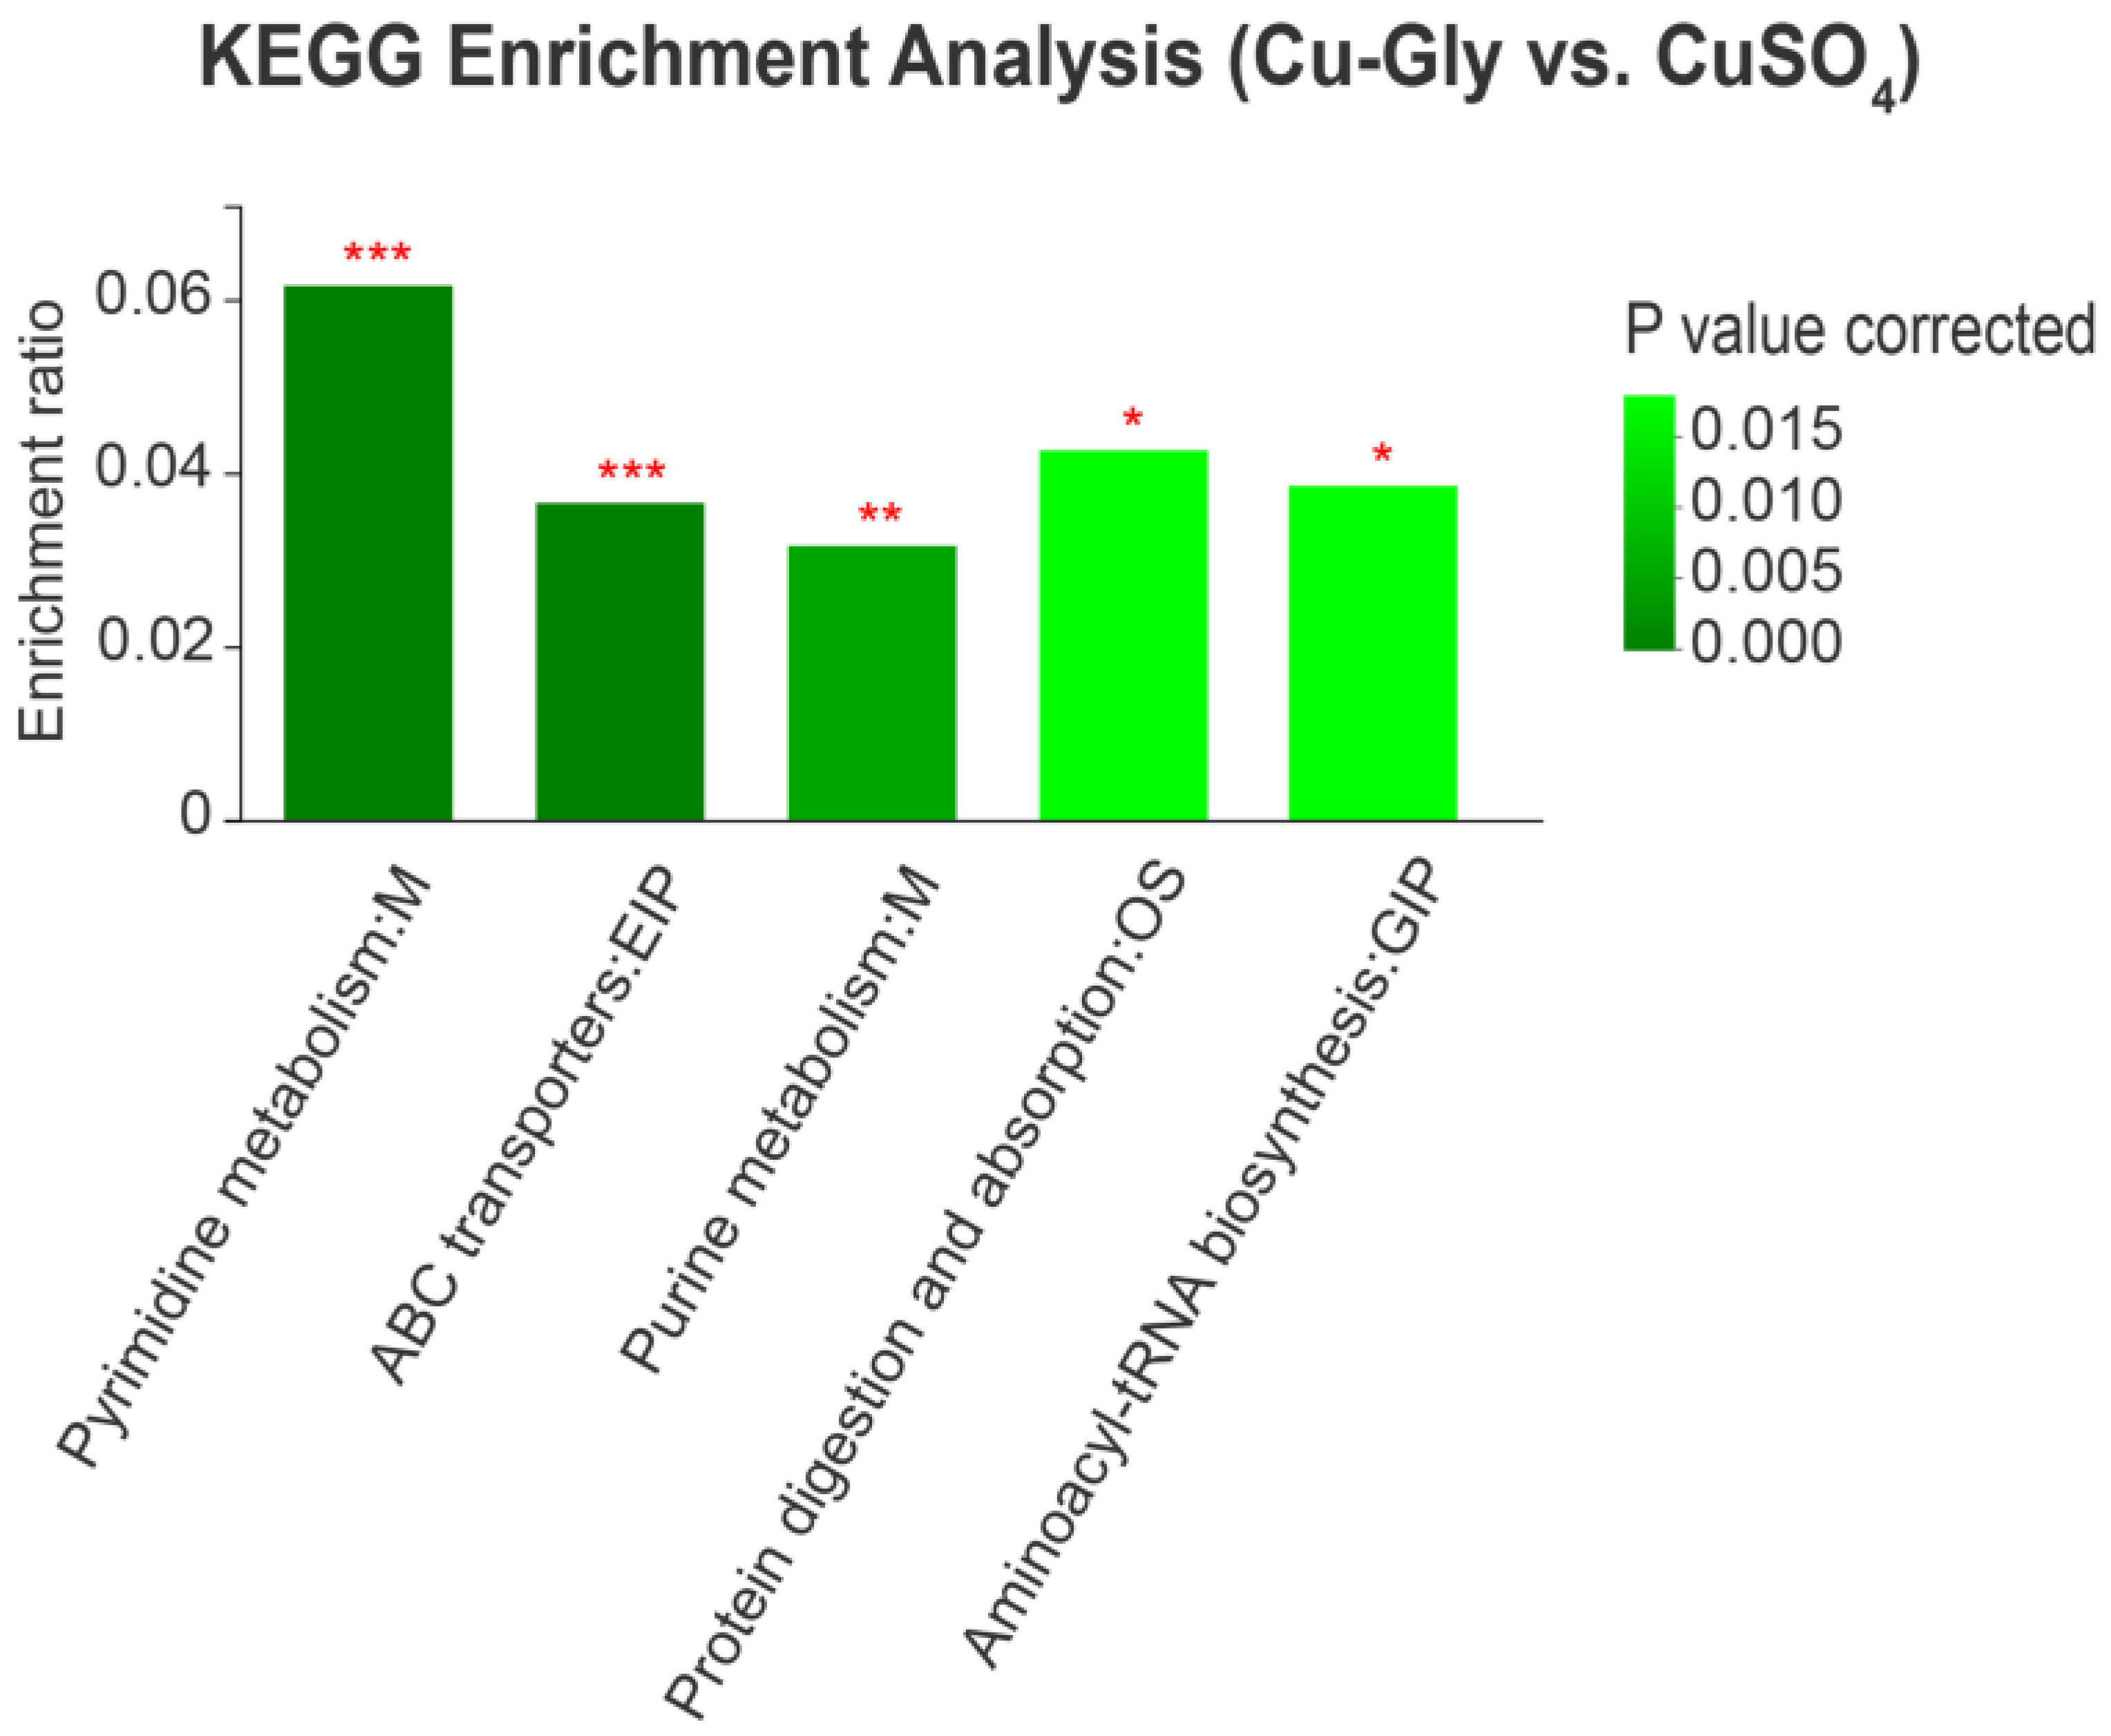
The LC-MS analysis detected a total of 775 peaks in all samples and observed 167 differential metabolites based on the variable importance in the projection (VIP) > 1 and p < 0.05. Furthermore, according to the accurate masses and MS spectrum measured by UHPLC, 22 metabolites in the metabolomics databases (HMDB) were identified based on the parameters of fold change (FC) > 1.30 or FC < 0.77 (Table 3). Differential metabolites between the CuSO4 and Cu-Gly groups were enriched in the Kyoto Encyclopedia of Genes and Genomes (KEGG) pathways of pyrimidine metabolism, ATP binding cassette (ABC) transporters, purine metabolism, protein digestion and absorption, and aminoacyl-tRNA biosynthesis (Figure 6).
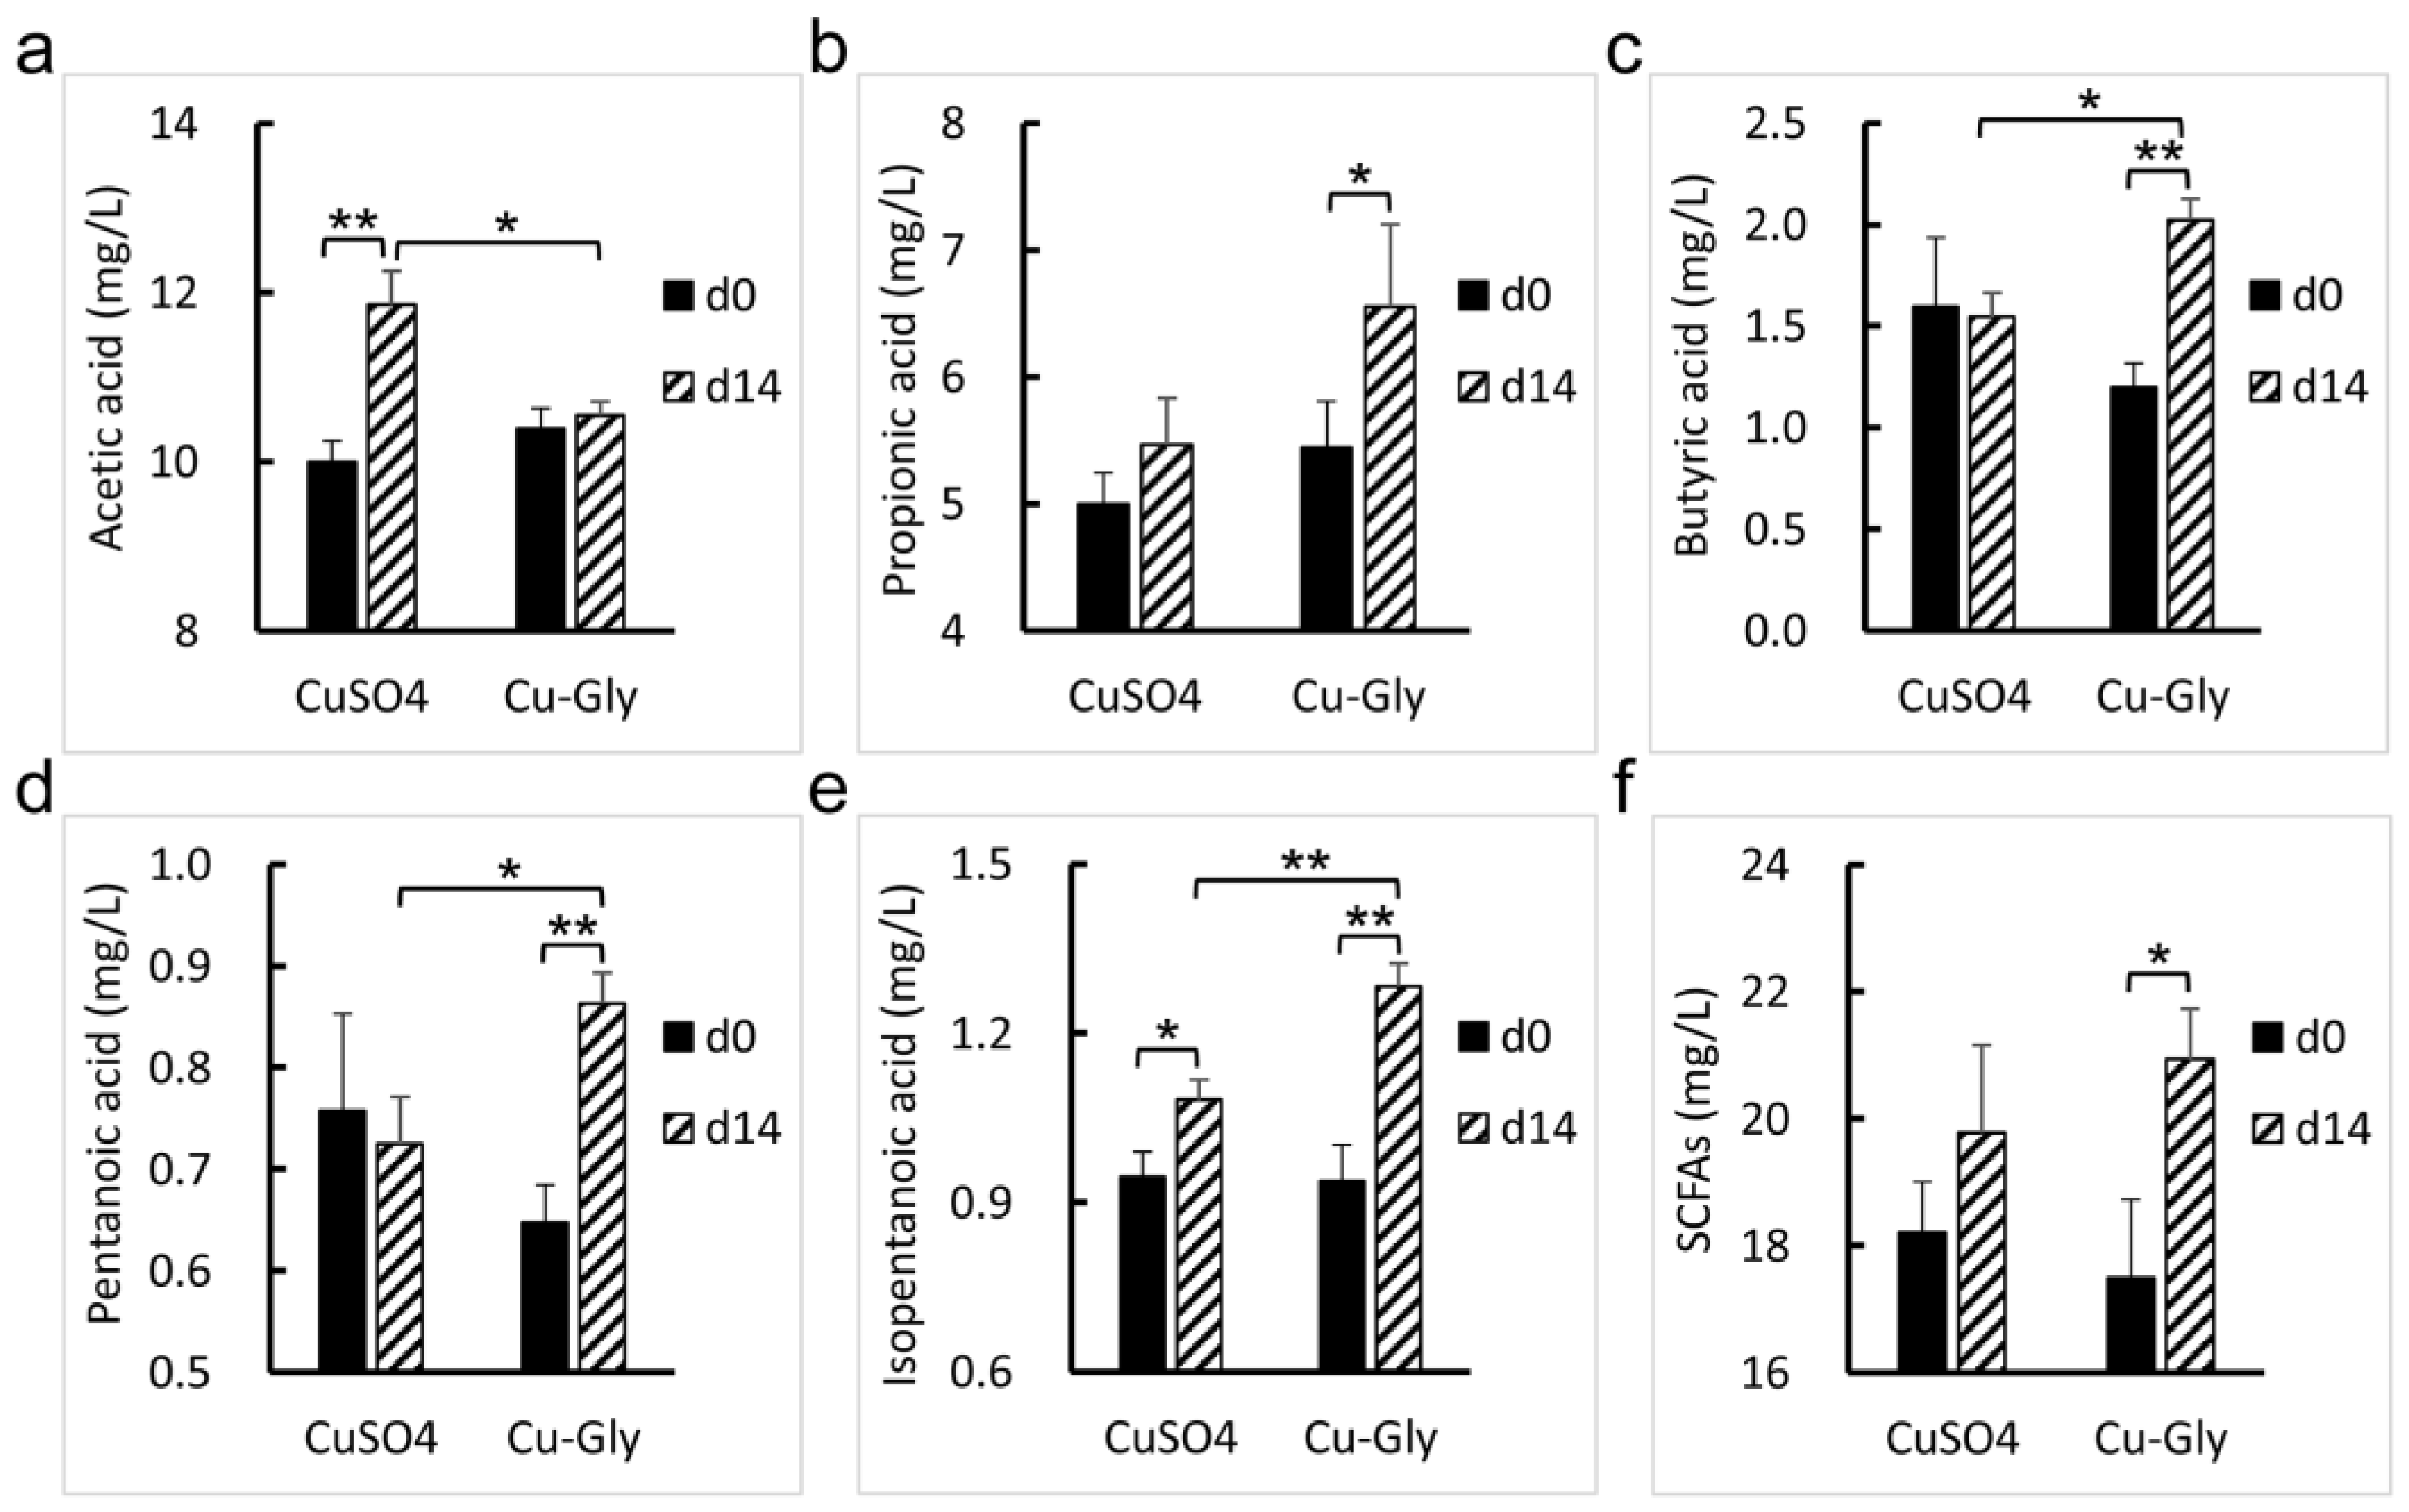
After two weeks of the experiment, the fecal concentrations of 3-hydroxytridecanoic acid (p = 0.034, 0.009), N-acetylmuramate (p = 0.002, 0.003), 5-[(E)-2-(3,5-dihydroxyphenyl) ethenyl]-2-methoxyphenyl oxidanesulfonic acid (p = 0.005, 0.012), physagulin F (p = 0.007, 0.031), alpha-carboxy-delta-decalactone (p = 0.013, 0.014), and 5-pentyltetrahydro-2-oxo-3-furancarboxylic acid (p = 0.033, 0.026) increased in both the CuSO4 and Cu-Gly groups. As compared with the baseline, CuSO4 decreased the concentration of zizybeoside I (p = 0.017) and increased the concentrations of grevilline B (p = 0.014), 7-hydroxy-1-oxo-1H-isochromene-3-carbaldehyde (p = 0.043), 3-hydroxypristanic acid (p = 0.036), ricinoleic acid (p = 0.004), 3,4,5-trihydroxy-6-(2-hydroxy-1,2-diphenylethoxy) oxane-2-carboxylic acid (p = 0.013), 23-hydroxyphysalolactone (p = 0.015), pristanoylglycine (p = 0.002), trans-grandmarin (p = 0.016), and tyrosyl-Serine (p = 0.020). Cu-Gly decreased the concentration of 20-Oxo-leukotriene E4 (p = 0.019) and increased the concentrations of Nb-p-Coumaroyl-tryptamine (p = 0.031), coumarin (p = 0.004) and coutaric acid (p < 0.001), prolyl-arginine (p = 0.021), and Xi-Linalool 3-[rhamnosyl-(1->6)-glucoside] (p = 0.001) at the end of the experiment. As shown in Figure 7, the Cu-Gly group had an increase in the concentrations of propionic acid (p = 0.012), butyric acid (p = 0.005), pentanoic acid (p = 0.010), isopentanoic acid (p = 0.001), and total SCFAs (p = 0.030) compared with the baseline, while the CuSO4 group had an increase in the concentrations of acetic acid (p = 0.003) and isopentanoic acid (p = 0.041).
Compared with the CuSO4 group, the Cu-Gly group had higher concentrations of butyric acid (p = 0.019), pentanoic acid (p = 0.029), isopentanoic acid (p = 0.008), Nb-p-Coumaroyl-tryptamine (p = 0.029), and coumarin (p = 0.024) and a lower concentration of 20-Oxo-leukotriene E4 (p = 0.003). No difference in the fecal concentrations of propionic acid and total SCFAs was observed between the Cu-Gly and CuSO4 groups.

3.5. Correlation Analysis

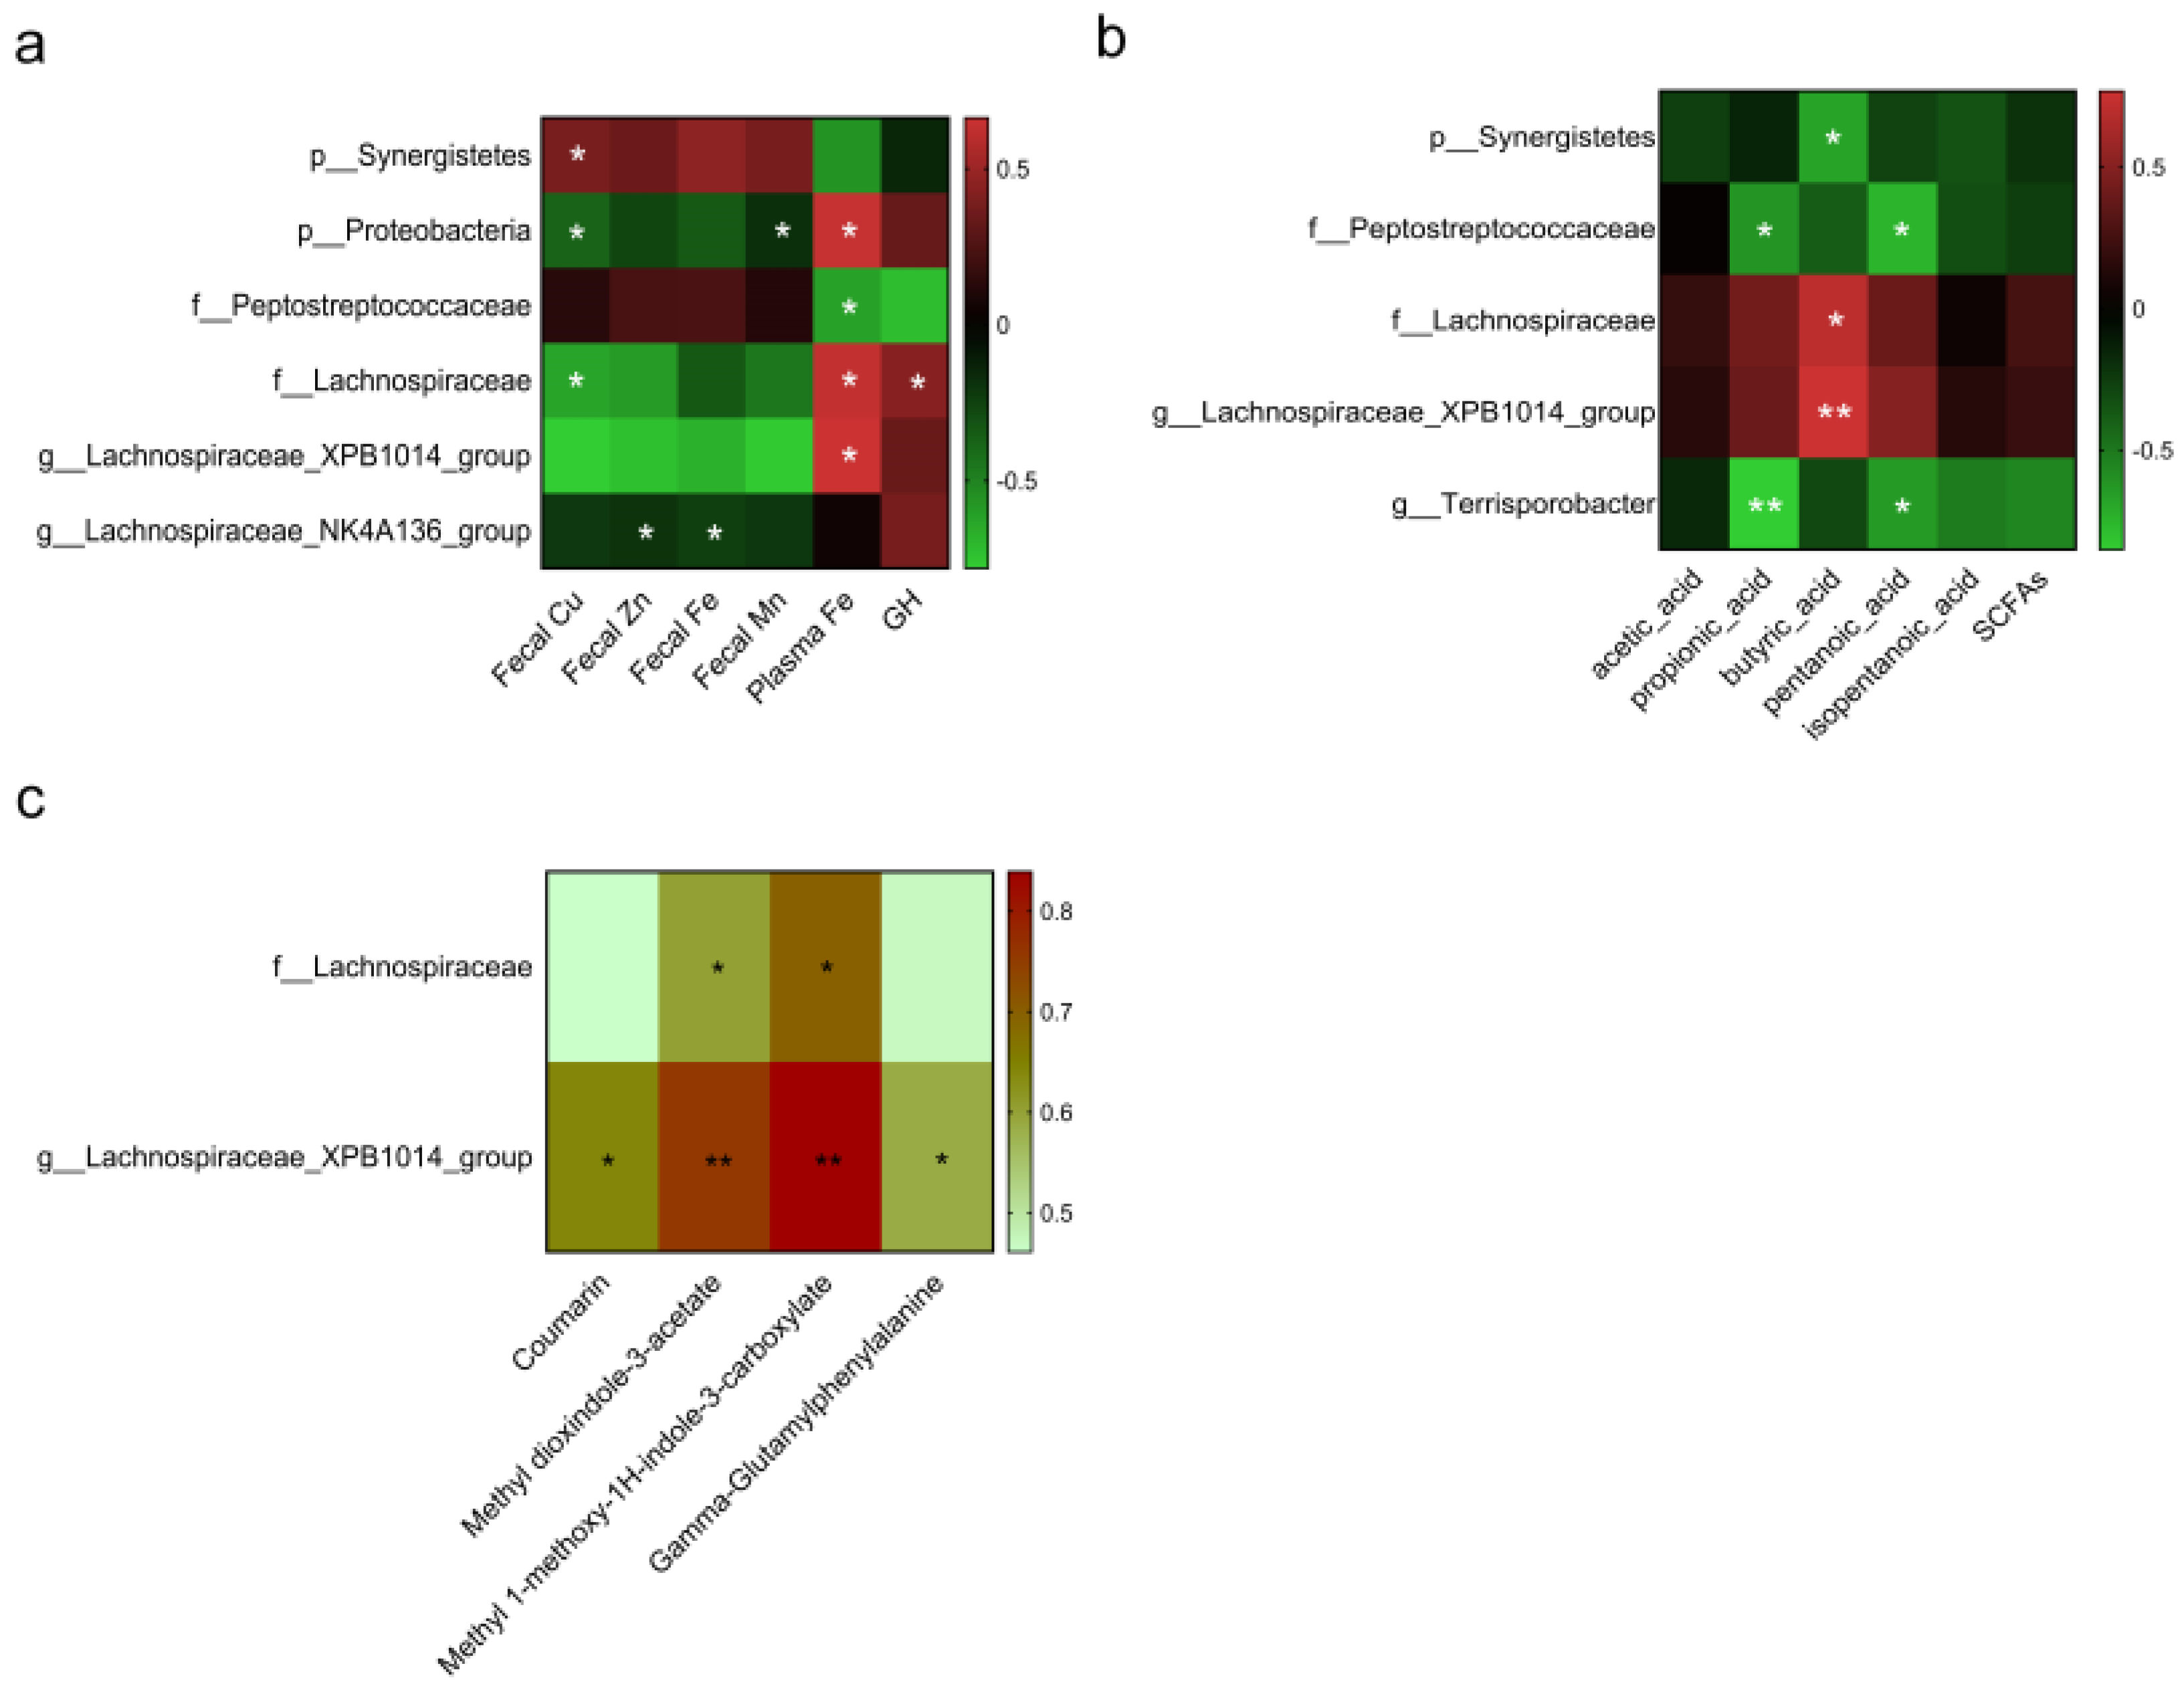
The correlation analysis showed that the Synergistetes phylum was positively correlated with the fecal Cu content (r = 0.39, p = 0.050. Figure 8a) and negatively correlated with the concentration of fecal butyric acid (r = −0.68, p = 0.030. Figure 8b). The Proteobacteria phylum was positively correlated with the plasma Fe concentration (r = 0.64, p = 0.047) and negatively correlated with the fecal Cu (r = −0.38, p = 0.046) and Mn contents (r = −0.18, p = 0.033). The Peptostreptococcaceae family was negatively correlated with the concentrations of plasma Fe (r = −0.62, p = 0.045), fecal propionic acid (r = −0.62, p = 0.049), and pentanoic acid (r = −0.75, p = 0.012). The Lachnospiraceae family was negatively correlated with the fecal Cu content (r = −0.63, p = 0.049) and positively correlated with the concentrations of fecal methyl dioxindole-3-acetate (r = 0.60, p = 0.039. Figure 8c), methyl 1-methoxy-1H-indole-3-carboxylate (r = 0.70, p = 0.012), butyric acid (r = 0.70, p = 0.024), plasma GH (r = 0.43, p = 0.034), and Fe (r = 0.63, p = 0.049). The genus Lachnospiraceae_XPB1014_group was positively correlated with the concentrations of fecal coumarin (r = 0.64, p = 0.025), methyl dioxindole-3-acetate (r = 0.76, p = 0.004), methyl 1-methoxy-1H-indole-3-carboxylate (r = 0.84, p = 0.001), gamma-glutamylphenyalanine (r = 0.59, p = 0.045), butyric acid (r = 0.77, p = 0.009), and plasma Fe (r = 0.66, p = 0.037). The genus Lachnospiraceae_NK4A136_group was negatively correlated with the contents of fecal Zn (r = −0.19, p = 0.038) and Fe (r = −0.24, p = 0.048). The Terrisporobacter genus (Peptostreptococcaceae family) was negatively correlated with the concentrations of propionic acid (r = −0.85, p = 0.002) and pentanoic acid (r = −0.64, p = 0.044). There was no significant correlation between microbiota and other parameters, including IGF-1, HGB, MPV, PDW, and P-LCR.

4. Discussion

Organic Cu chelated with amino acids or peptides has been reported to improve the growth performance of pigs [4,5,6], with more retention [21] and less Cu excretion [22]. The absorption of organic Cu is different from that of inorganic Cu, though the mechanisms remain controversial. Organic Cu could be absorbed as compounds and hydrolyzed on the brush border, which alleviates the antagonisms and contributes to the improvement in mineral absorption [15]. Consistently, our data showed that pigs fed with Cu-Gly had a higher feed intake and microelement absorption and lower excretion. The GH-IGF-1 axis plays a critical role in the regulation of animal growth, and it is a target for the nutritional regulation of animal growth [23]. IGF-1 secretion is stimulated by GH and is mainly produced in the liver [24], which is a key tissue for Cu metabolism and storage. It was suggested that the serum GH and IGF-1 concentrations of piglets could be elevated by 160 mg/kg Cu as Cu methionine hydroxy analog chelated [7] or by 100–300 mg/kg Cu as CuSO4 [25]. There was no difference in the serum GH concentration between CuSO4 and Cu methionine (Cu-Met) in growing pigs [26]. A previous study suggested that the decreased feed intake and plasma concentrations of GH and IGF-1 were accompanied by a reduced abundance of the Lachnospiraceae family in the caecum of weaned piglets [27]. Consistently in this study, Cu-Gly had a greater stimulation regarding the secretion of IGF-1, but not GH, than CuSO4. Cu-Gly supplementation increased the abundance of the Lachnospiraceae family, which was negatively correlated with the fecal Cu content and positively correlated with the plasma Fe and GH concentrations. The intestinal Fe absorption was closely correlated with Lachnospiraceae, and the intestinal absorption of minerals depended on the concentration of butyrate [28]. This indicated that the Cu-Gly treatment elevated plasma IGF-1 and improved the absorption of Cu, Fe, and Mn compared with the CuSO4 treatment, which might be attributed to the elevated Lachnospiraceae family in the hindgut.
Trace elements, such as Cu, Zn, and Fe, have an influence on the intestinal microenvironment, including the microbiota and nutrient digestibility [18]. The antimicrobial properties of Cu at high doses that have been documented though the underlying mechanism have yet to be elucidated [29,30]. The levels of dietary Fe can modulate the gut microbiome and microbial metabolites, especially for the butyrate content in the colon [31]. On the other hand, gut microbiota also play a role in the absorption and metabolism of trace elements, and there is a complicated mechanism modulating the mineral absorption in the gut [14]. Probiotics such as Lactobacilli can improve Fe absorption by facilitating the phytate degradation and iron release from diets [32]. Phytic acid prevents the absorption of essential trace elements by binding the metallic ions, and phytase inclusion is recommended in swine diets to improve the digestibility and utilization of trace elements, as well as calcium and phosphorus [33]. Because of using wheat bran at a high level in the present study, phytic acid at a high level (0.51% to 0.66%) in diets could promote the interaction with trace elements in the digesta and have a great influence on the mineral digestibility and metabolism [34,35]. Phytase was added to the basal diets as a recommendation, and the same conventional dose (500 U/kg diet) was used in both the basal and experimental diets in order to exclude the interference. Consistently, our results suggested that the Cu-Gly supplementation increased the content of fecal butyric acid and improved the absorption of Cu, Fe, and Mn as compared with the CuSO4 supplementation. Meanwhile, Cu-Gly increased the abundance of the Lachnospiraceae family and Lachnospiraceae_XPB1014_group genus, while the CuSO4 supplementation increased the abundance of the Peptostreptococcaceae family and decreased the abundance of the Lachnospiraceae family and the genera Corprococcus_3, Anaerorhabdus_furcosa_group, Lachnospiraceae_FCS020_group, and Lachnospiraceae_NK4B4_group. Furthermore, the precise interactions among the gut microbiome and mineral absorption and the impact of butyric acid in the modulation of the Cu source on the gut microbiota and health need further investigations, which will be helpful for us to understand it better.
The Peptostreptococcaceae family was elevated in ulcerative colitis patients, which is closely related to intestinal inflammation [36]. A study in cows indicated that the improvement in nutrient digestibility was associated with a decreased Peptostreptococcaceae abundance and increased plasma propionate concentration [37]. Both Synergistetes and Lachnospiraceae are identified as SCFA-producing bacteria [38]. The main products of Synergistetes are acetate, propionate, and formate [39], while the main product of Lachnospiraceae is butyrate [40]. It was reported that Synergistetes could reduce plant toxins by degrading fluoroacetate into acetate [41]. Synergistetes also participated in the anaerobic dissimilation of acetate into methane and carbon dioxide [42], which leads to a loss in the gross energy intake and is associated with a lower energy efficiency [43]. The main products of the genera Lachnospiraceae_XPB1014_group and Coprococcus_3 are propionate and butyrate, which play a beneficial role in the lipid metabolism [44] and anti-inflammatory response [45]. Butyrate is known as a primary energy source for enterocytes and also provides several benefits to intestinal immunity and host health [46]. The gut microbiome could modulate the host immunity and health by altering the butyrate producers [47]. Intestinal inflammation could be alleviated by butyrate administration or elevating butyrate-producing bacteria [48]. A previous study suggested that pigs of a high feed efficiency had a higher abundance of Lachnospiraceae [49]. Consistently, here, the fecal concentration of butyric acid was positively correlated with the abundance of the family Lachnospiraceae and the genus Lachnospiraceae_XPB1014_group and negatively correlated with the abundance of the phylum Synergistetes. Meanwhile, the fecal concentration of propionic acid was negatively correlated with the abundance of the Peptostreptococcaceae family and the Terrisporobacter genus (belongs to the Peptostreptococcaceae family). Compared with the CuSO4 group, the Cu-Gly group had a higher abundance of the Lachnospiraceae family and the genera Lachnospiraceae_XPB1014_group and Corprococcus_3 (belongs to the Lachnospiraceae family) and a lower abundance of the Synergistetes phylum and the Peptostreptococcaceae family. These findings supported the idea that Cu-Gly and CuSO4 altered the gut microbial communities and SCFAs production in a different manner, by which they had an influence on the intestinal health.
Furthermore, pigs supplemented with Cu-Gly had higher concentrations of Nb-p-Coumaroyl-tryptamine and coumarin and a lower concentration of 20-oxo-leukotriene E4 compared with those supplemented with CuSO4 in the present study. Nb-p-Coumaroyl-tryptamine and its derivatives have excellent anti-oxidant and anti-inflammatory activities [50]. Nb-p-Coumaroyl-tryptamine suppressed the LPS-induced extracellular secretion of pro-inflammatory cytokines in macrophage cells [51]. Leukotriene E4 is an inflammation mediator involved in the activation of the inflammatory process [52]. The 20-oxo-leukotriene E4 is a metabolite in the lipid oxidation of leukotriene E4, which is a potential metabolic marker of inflammation [53]. These findings supported the idea that Cu-Gly and CuSO4 differentially affected metabolic profiles in the hindgut, which partially contributed to the different effects of the Cu source on the host health. The dietary composition could greatly affect the microbial communities, and metabolites produced from dietary components or biochemically modified by gut bacteria [54] mediate the interaction between the microbes and host [55,56]. Coumarins are the phenolic compounds with antioxidant and anti-inflammation activities [57], which have been used to improve intestinal oxidative status in the treating gut inflammation [58]. Coumarins and coumarin derivatives could ameliorate inflammatory bowel diseases by inhibiting lipid peroxidation [59], which was accompanied by a high abundance of Lachnospiraceae [60]. Consistently, the integrated microbiome and metabolome analysis suggested that Lachnospiraceae_XPB1014_group was elevated by Cu-Gly and positively correlated with the concentrations of fecal coumarin and butyric acid. Our data presented the correlations between fecal microbiota and the metabolomics response and fecal or plasma indicators, which provide us with new insights into the potential interactions. Due to the limitation of the small sample size in the metabolic experiment, further investigations into the effects of Cu sources on the growth performance, gut microbiome, and immunity using a larger number of animals should be conducted. These findings highlight the microbiome-metabolome response to dietary Cu sources in growing pigs, and the potential benefits of the genus Lachnospiraceae_XPB1014_group, fecal coumarin, and butyric acid for intestinal health should be investigated in the future to understand it better.

5. Conclusions

Dietary Cu-Gly supplementation increased the feed intake and plasma IGF-1 and decreased fecal microelement contents as compared to CuSO4 supplementation. Cu-Gly supplementation elevated the abundance of the Lachnospiraceae family and the Lachnospiraceae_XPB1014_group genus, and CuSO4 supplementation increased the abundance of the Synergistetes phylum and the Peptostreptococcaceae family. Cu-Gly and CuSO4 altered microbial communities and fecal metabolites in different manners, which partially contributed to the differential effects on the intestinal health of pigs.

Author Contributions

Conceptualization, H.L., D.X. and K.L.; methodology, H.L. and Q.D.; validation, N.L., X.J. and K.L.; formal analysis, H.L. and Q.D.; investigation, H.L., Q.D., N.L. and X.J.; writing—original draft preparation, H.L. and Q.D.; writing—review and editing, N.L., X.J., D.X., K.L. and M.L.; supervision, D.X. and M.L.; project administration, H.L.; funding acquisition, H.L. All authors have read and agreed to the published version of the manuscript.

Funding

This research was funded by the Shanghai Agriculture Applied Technology Development Program, China (Grant No. G20190301).

Institutional Review Board Statement

Animal care and use procedures were followed in compliance with the Guidelines of the Animal Ethics Committee of Shanghai Academy of Agricultural Sciences, in accordance with standard international regulations. The experimental protocols used for the care and treatment of pigs in the present study were approved by the Animal Ethics Committee of Shanghai Academy of Agricultural Sciences (the approval code: SAASPZ0520011).

Informed Consent Statement

Not applicable.

Data Availability Statement

The data supporting the conclusions of this article are all available.

Conflicts of Interest

The authors declare no conflict of interest.

References

  1. Jończy, A.; Mazgaj, R.; Starzyński, R.R.; Poznański, P.; Szudzik, M.; Smuda, E.; Kamyczek, M.; Lipiński, P. Relationship between dowregulation of copper-related genes and decreased ferroportin protein level in the duodenum of iron-deficient piglets. Nutrients 2020, 13, 104. [Google Scholar] [CrossRef] [PubMed]
  2. Luo, X.G.; Dove, C.R. Effect of dietary copper and fat on nutrient utilization, digestive enzyme activities, and tissue mineral levels in weanling pigs. J. Anim. Sci. 1996, 74, 1888–1896. [Google Scholar] [CrossRef] [PubMed]
  3. Namkung, H.; Gong, J.; Yu, H.; De Lange, C.F.M. Effect of pharmacological intakes of zinc and copper on growth performance, circulating cytokines and gut microbiota of newly weaned piglets challenged with coliform lipopolysaccharides. Can. J. Anim. Sci. 2006, 86, 511–522. [Google Scholar] [CrossRef]
  4. Coffey, R.D.; Cromwell, G.L.; Monegue, H.J. Efficacy of a copper-lysine complex as a growth promotant for weanling pigs. J. Anim. Sci. 1994, 72, 2880–2886. [Google Scholar] [CrossRef] [PubMed]
  5. Feng, J.; Ma, W.Q.; Gu, Z.L.; Wang, Y.Z.; Liu, J.X. Effects of dietary copper (II) sulfate and copper proteinate on performance and blood indexes of copper status in growing pigs. Biol. Trace Elem. Res. 2007, 120, 171–178. [Google Scholar] [CrossRef]
  6. A Apgar, G.; Kornegay, E.T. Mineral balance of finishing pigs fed copper sulfate or a copper-lysine complex at growth-stimulating levels. J. Anim. Sci. 1996, 74, 1594–1600. [Google Scholar] [CrossRef] [Green Version]
  7. Gonzalez-Esquerra, R.; Araujo, R.B.; Haese, D.; Kill, J.L.; Cunha, A.; Monzani, P.S.; Lima, C.G. Effect of dietary copper sources on performance, gastric ghrelin-RNA expression, and growth hormone concentrations in serum in piglets. J. Anim. Sci. 2019, 97, 4242–4247. [Google Scholar] [CrossRef]
  8. Willing, B.P.; Van Kessel, A.G. Intestinal microbiota differentially affect brush border enzyme activity and gene expression in the neonatal gnotobiotic pig. J. Anim. Physiol. Anim. Nutr. 2009, 93, 586–595. [Google Scholar] [CrossRef]
  9. Heiss, C.N.; Olofsson, L.E. Gut microbiota-dependent modulation of energy metabolism. J. Innate Immun. 2018, 10, 163–171. [Google Scholar] [CrossRef]
  10. Ma, Y.; Han, X.; Fang, J.; Jiang, H. Role of dietary amino acids and microbial metabolites in the regulation of pig intestinal health. Anim. Nutr. 2022, 9, 1–6. [Google Scholar] [CrossRef]
  11. Zhang, F.; Zheng, W.; Xue, Y.; Yao, W. Suhuai suckling piglet hindgut microbiome-metabolome responses to different dietary copper levels. Appl. Microbiol. Biotechnol. 2019, 103, 853–868. [Google Scholar] [CrossRef] [PubMed] [Green Version]
  12. Zhang, Y.; Zhou, J.; Dong, Z.; Li, G.; Wang, J.; Li, Y.; Wan, D.; Yang, H.; Yin, Y. Effect of dietary copper on intestinal microbiota and antimicrobial resistance profiles of Escherichia coli in weaned piglets. Front. Microbiol. 2019, 10, 2808. [Google Scholar] [CrossRef] [PubMed]
  13. Crofts, A.A.; Poly, F.M.; Ewing, C.P.; Kuroiwa, J.M.; Rimmer, J.E.; Harro, C.; Sack, D.; Talaat, K.R.; Porter, C.K.; Gutierrez, R.L.; et al. Campylobacter jejuni transcriptional and genetic adaptation during human infection. Nat. Microbiol. 2018, 3, 494–502. [Google Scholar] [CrossRef]
  14. Becker, K.W.; Skaar, E.P. Metal limitation and toxicity at the interface between host and pathogen. FEMS Microbiol. Rev. 2014, 38, 1235–1249. [Google Scholar] [CrossRef] [PubMed] [Green Version]
  15. Wen, Y.; Li, R.; Piao, X.; Lin, G.; He, P. Different copper sources and levels affect growth performance, copper content, carcass characteristics, intestinal microorganism and metabolism of finishing pigs. Anim. Nutr. 2021, 8, 321–330. [Google Scholar] [CrossRef]
  16. Pan, X.; Gong, D.; Nguyen, D.N.; Zhang, X.; Hu, Q.; Lu, H.; Fredholm, M.; Sangild, P.T.; Gao, F. Early microbial colonization affects DNA methylation of genes related to intestinal immunity and metabolism in preterm pigs. DNA Res. 2018, 25, 287–296. [Google Scholar] [CrossRef] [Green Version]
  17. Heyer, C.M.E.; Schmucker, S.; Burbach, K.; Weiss, E.; Eklund, M.; Aumiller, T.; Capezzone, F.; Steuber, J.; Rodehutscord, M.; Hoelzle, L.E.; et al. Phytate degradation, intestinal microbiota, microbial metabolites and immune values are changed in growing pigs fed diets with varying calcium–phosphorus concentration and fermentable substrates. J. Anim. Physiol. Anim. Nutr. 2019, 103, 1185–1197. [Google Scholar] [CrossRef]
  18. Pajarillo, E.A.B.; Lee, E.; Kang, D.-K. Trace metals and animal health: Interplay of the gut microbiota with iron, manganese, zinc, and copper. Anim. Nutr. 2021, 7, 750–761. [Google Scholar] [CrossRef]
  19. Prawirodigdo, S.; Gannon, N.J.; Leury, B.J.; Dunshea, F.R. Acid-insoluble ash is a better indigestible marker than chromic oxide to measure apparent total tract digestibility in pigs. Anim. Nutr. 2021, 7, 64–71. [Google Scholar] [CrossRef]
  20. Jiang, X.; Lu, N.; Zhao, H.; Yuan, H.; Xia, D.; Lei, H. The Microbiome–metabolome response in the colon of piglets under the status of weaning stress. Front. Microbiol. 2020, 11, 2055. [Google Scholar] [CrossRef]
  21. A Apgar, G.; Kornegay, E.T.; Lindemann, M.D.; Notter, D.R. Evaluation of copper sulfate and a copper lysine complex as growth promoters for weanling swine. J. Anim. Sci. 1995, 73, 2640–2646. [Google Scholar] [CrossRef] [PubMed] [Green Version]
  22. Veum, T.L.; Carlson, M.S.; Wu, C.W.; Bollinger, D.W.; Ellersieck, M.R. Copper proteinate in weanling pig diets for enhancing growth performance and reducing fecal copper excretion compared with copper sulfate1. J. Anim. Sci. 2004, 82, 1062–1070. [Google Scholar] [CrossRef] [PubMed]
  23. Ju, D.; Teng, T.; Bai, G.; Fu, H.; Qiu, S.; Zhao, X.; Sun, Y.; Shi, B. The role of protein restriction and interaction with antibiotics in the regulation of compensatory growth in pigs: Growth performance, serum hormone concentrations, and messenger RNA levels in component tissues of the endocrine growth axis. Domest. Anim. Endocrinol. 2021, 74, 106524. [Google Scholar] [CrossRef] [PubMed]
  24. Louveau, I.; Bonneau, M. Effect of a growth hormone infusion on plasma insulin-like growth factor-I in Meishan and Large White pigs. Reprod. Nutr. Dev. 1996, 36, 301–310. [Google Scholar] [CrossRef] [PubMed] [Green Version]
  25. Wang, J.; Zhu, X.; Guo, Y.; Wang, Z.; Zhao, B.; Yin, Y.; Liu, G. Influence of Dietary Copper on Serum Growth-Related Hormone Levels and Growth Performance of Weanling Pigs. Biol. Trace Elem. Res. 2015, 172, 134–139. [Google Scholar] [CrossRef]
  26. Yang, W.; Wang, J.; Zhu, X.; Gao, Y.; Liu, Z.; Zhang, L.; Chen, H.; Shi, X.; Yang, L.; Liu, G. High Lever Dietary Copper Promote Ghrelin Gene Expression in the Fundic Gland of Growing Pigs. Biol. Trace Elem. Res. 2012, 150, 154–157. [Google Scholar] [CrossRef]
  27. Wang, S.; Yang, J.; Zhang, B.; Zhang, L.; Wu, K.; Yang, A.; Li, C.; Wang, Y.; Zhang, J.; Qi, D. Potential Link between Gut Microbiota and Deoxynivalenol-Induced Feed Refusal in Weaned Piglets. J. Agric. Food Chem. 2019, 67, 4976–4986. [Google Scholar] [CrossRef]
  28. Zeng, H.; Huang, C.; Lin, S.; Zheng, M.; Chen, C.; Zheng, B.; Zhang, Y. Lotus Seed Resistant Starch Regulates Gut Microbiota and Increases Short-Chain Fatty Acids Production and Mineral Absorption in Mice. J. Agric. Food Chem. 2017, 65, 9217–9225. [Google Scholar] [CrossRef]
  29. Dębski, B. Supplementation of pigs diet with zinc and copper as alternative to conventional antimicrobials. Pol. J. Veter.-Sci. 2016, 19, 917–924. [Google Scholar] [CrossRef] [Green Version]
  30. Villagómez-Estrada, S.; Pérez, J.F.; Darwich, L.; Vidal, A.; Van Kuijk, S.; Duran, D.A.M.; Solà-Oriol, D. Effects of copper and zinc sources and inclusion levels of copper on weanling pig performance and intestinal microbiota. J. Anim. Sci. 2020, 98, skaa117. [Google Scholar] [CrossRef]
  31. Dostal, A.; Lacroix, C.; Bircher, L.; Pham, V.T.; Follador, R.; Zimmermann, M.B.; Chassard, C. Iron Modulates Butyrate Production by a Child Gut Microbiota In Vitro. Mbio 2015, 6, e01453-15. [Google Scholar] [CrossRef] [PubMed] [Green Version]
  32. Fischer, M.M.; Egli, I.M.; Aeberli, I.; Hurrell, R.F.; Meile, L. Phytic acid degrading lactic acid bacteria in tef-injera fermentation. Int. J. Food Microbiol. 2014, 190, 54–60. [Google Scholar] [CrossRef] [PubMed]
  33. Torre, M.; Rodriguez, A.R.; Saura-Calixto, F. Effects of dietary fiber and phytic acid on mineral availability. Crit. Rev. Food Sci. Nutr. 1991, 30, 1–22. [Google Scholar] [CrossRef] [PubMed]
  34. Dersjant-Li, Y.; Villca, B.; Sewalt, V.; de Kreij, A.; Marchal, L.; Velayudhan, D.E.; Sorg, R.A.; Christensen, T.; Mejldal, R.; Nikolaev, I.; et al. Functionality of a next generation biosynthetic bacterial 6-phytase in enhancing phosphorus availability to weaned piglets fed a corn-soybean meal-based diet without added inorganic phosphate. Anim. Nutr. 2020, 6, 24–30. [Google Scholar] [CrossRef] [PubMed]
  35. Bikker, P.; Van Diepen, J.T.M.; Binnendijk, G.P.; Jongbloed, A.W. Phytase inclusion in pig diets improves zinc status but its effect on copper availability is inconsistent1. J. Anim. Sci. 2012, 90 (Suppl. S4), 197–199. [Google Scholar] [CrossRef] [Green Version]
  36. Jalanka, J.; Cheng, J.; Hiippala, K.; Ritari, J.; Salojärvi, J.; Ruuska, T.; Kalliomäki, M.; Satokari, R. Colonic Mucosal Microbiota and Association of Bacterial Taxa with the Expression of Host Antimicrobial Peptides in Pediatric Ulcerative Colitis. Int. J. Mol. Sci. 2020, 21, 6044. [Google Scholar] [CrossRef]
  37. Jiang, X.; Xu, H.; Ma, G.; Sun, Y.; Li, Y.; Zhang, Y. Digestibility, lactation performance, plasma metabolites, ruminal fermentation, and bacterial communities in Holstein cows fed a fermented corn gluten-wheat bran mixture as a substitute for soybean meal. J. Dairy Sci. 2021, 104, 2866–2880. [Google Scholar] [CrossRef]
  38. Okamoto, T.; Morino, K.; Ugi, S.; Nakagawa, F.; Lemecha, M.; Ida, S.; Ohashi, N.; Sato, D.; Fujita, Y.; Maegawa, H. Microbiome potentiates endurance exercise through intestinal acetate production. Am. J. Physiol. Metab. 2019, 316, E956–E966. [Google Scholar] [CrossRef]
  39. Looft, T.; Levine, U.Y.; Stanton, T.B. Cloacibacillus porcorum sp. nov., a mucin-degrading bacterium from the swine intestinal tract and emended description of the genus Cloacibacillus. Int. J. Syst. Evol. Microbiol. 2013, 63, 1960–1966. [Google Scholar] [CrossRef]
  40. Zhang, J.; Song, L.; Wang, Y.; Liu, C.; Zhang, L.; Zhu, S.; Liu, S.; Duan, L. Beneficial effect of butyrate-producing Lachnospiraceae on stress-induced visceral hypersensitivity in rats. J. Gastroenterol. Hepatol. 2019, 34, 1368–1376. [Google Scholar] [CrossRef]
  41. Kang, S.; Khan, S.; Webb, R.; Denman, S.; McSweeney, C. Characterization and survey in cattle of a rumen Pyrimadobacter sp. which degrades the plant toxin fluoroacetate. FEMS Microbiol. Ecol. 2020, 96, fiaa077. [Google Scholar] [CrossRef]
  42. Aoyagi, T.; Inaba, T.; Aizawa, H.; Mayumi, D.; Sakata, S.; Charfi, A.; Suh, C.; Lee, J.H.; Sato, Y.; Ogata, A.; et al. Unexpected diversity of acetate degraders in anaerobic membrane bioreactor treating organic solid waste revealed by high-sensitivity stable isotope probing. Water Res. 2020, 176, 115750. [Google Scholar] [CrossRef]
  43. Misiukiewicz, A.; Gao, M.; Filipiak, W.; Cieslak, A.; Patra, A.; Szumacher-Strabel, M. Review: Methanogens and methane production in the digestive systems of nonruminant farm animals. Animal 2021, 15, 100060. [Google Scholar] [CrossRef]
  44. Huang, S.-M.; Wu, Z.-H.; Li, T.-T.; Liu, C.; Han, D.-D.; Tao, S.-Y.; Pi, Y.; Li, N.; Wang, J.-J. Perturbation of the lipid metabolism and intestinal inflammation in growing pigs with low birth weight is associated with the alterations of gut microbiota. Sci. Total Environ. 2020, 719, 137382. [Google Scholar] [CrossRef]
  45. Zhang, W.; Xu, J.-H.; Yu, T.; Chen, Q.-K. Effects of berberine and metformin on intestinal inflammation and gut microbiome composition in db/db mice. Biomed. Pharmacother. 2019, 118, 109131. [Google Scholar] [CrossRef]
  46. Hamer, H.M.; Jonkers, D.; Venema, K.; Vanhoutvin, S.; Troost, F.J.; Brummer, R.-J. Review article: The role of butyrate on colonic function. Aliment. Pharmacol. Ther. 2008, 27, 104–119. [Google Scholar] [CrossRef]
  47. Han, Y.; Zhao, Q.; Tang, C.; Li, Y.; Zhang, K.; Li, F.; Zhang, J. Butyrate Mitigates Weanling Piglets From Lipopolysaccharide-Induced Colitis by Regulating Microbiota and Energy Metabolism of the Gut–Liver Axis. Front. Microbiol. 2020, 11, 588666. [Google Scholar] [CrossRef]
  48. Salvi, P.S.; Cowles, R.A. Butyrate and the Intestinal Epithelium: Modulation of Proliferation and Inflammation in Homeostasis and Disease. Cells 2021, 10, 1775. [Google Scholar] [CrossRef]
  49. He, B.; Li, T.; Wang, W.; Gao, H.; Bai, Y.; Zhang, S.; Zang, J.; Li, D.; Wang, J. Metabolic characteristics and nutrient utilization in high-feed-efficiency pigs selected using different feed conversion ratio models. Sci. China Life Sci. 2019, 62, 959–970. [Google Scholar] [CrossRef]
  50. Takii, T.; Hayashi, M.; Hiroma, H.; Chiba, T.; Kawashima, S.; Zhang, H.L.; Nagatsu, A.; Sakakibara, J.; Onozaki, K. Serotonin Derivative, N-(p-Coumaroyl)serotonin, Isolated from Safflower (Carthamus tinctorius L.) Oil Cake Augments the Proliferation of Normal Human and Mouse Fibroblasts in Synergy with Basic Fibroblast Growth Factor (bFGF) or Epidermal Growth Factor (EGF). J. Biochem. 1999, 125, 910–915. [Google Scholar] [CrossRef]
  51. Takii, T.; Kawashima, S.; Chiba, T.; Hayashi, H.; Hayashi, M.; Hiroma, H.; Kimura, H.; Inukai, Y.; Shibata, Y.; Nagatsu, A.; et al. Multiple mechanisms involved in the inhibition of proinflammatory cytokine production from human monocytes by N-(p-coumaroyl)serotonin and its derivatives. Int. Immunopharmacol. 2003, 3, 273–277. [Google Scholar] [CrossRef] [PubMed]
  52. Paruchuri, S.; Tashimo, H.; Feng, C.; Maekawa, A.; Xing, W.; Jiang, Y.; Kanaoka, Y.; Conley, P.; Boyce, J.A. Leukotriene E4–induced pulmonary inflammation is mediated by the P2Y12 receptor. J. Exp. Med. 2009, 206, 2543–2555. [Google Scholar] [CrossRef] [PubMed] [Green Version]
  53. Hof, M.I.; Schnyder, M.; Hartnack, S.; Stanke-Labesque, F.; Luckschander, N.; Burgener, I. Urinary Leukotriene E4 Concentrations as a Potential Marker of Inflammation in Dogs with Inflammatory Bowel Disease. J. Veter.-Intern. Med. 2012, 26, 269–274. [Google Scholar] [CrossRef] [PubMed]
  54. Postler, T.S.; Ghosh, S. Understanding the Holobiont: How Microbial Metabolites Affect Human Health and Shape the Immune System. Cell Metab. 2017, 26, 110–130. [Google Scholar] [CrossRef] [Green Version]
  55. Tremaroli, V.; Bäckhed, F. Functional interactions between the gut microbiota and host metabolism. Nature 2012, 489, 242–249. [Google Scholar] [CrossRef]
  56. Zheng, H.; Ji, H.; Fan, K.; Xu, H.; Huang, Y.; Zheng, Y.; Xu, Q.; Li, C.; Zhao, L.; Li, Y.; et al. Targeting Gut Microbiota and Host Metabolism with Dendrobium officinale Dietary Fiber to Prevent Obesity and Improve Glucose Homeostasis in Diet-Induced Obese Mice. Mol. Nutr. Food Res. 2022, 66, e2100772. [Google Scholar] [CrossRef] [PubMed]
  57. Nazeam, J.A.; Alshareef, W.; Helmy, M.W.; El-Haddad, A.E. Bioassay-guided isolation of potential bioactive constituents from pomegranate agrifood by-product. Food Chem. 2020, 326, 126993. [Google Scholar] [CrossRef]
  58. Luchini, A.C.; Rodrigues-Orsi, P.; Cestari, S.H.; Seito, L.N.; Witaicenis, A.; Pellizzon, C.H.; Di Stasi, L.C. Intestinal Anti-inflammatory Activity of Coumarin and 4-Hydroxycoumarin in the Trinitrobenzenesulphonic Acid Model of Rat Colitis. Biol. Pharm. Bull. 2008, 31, 1343–1350. [Google Scholar] [CrossRef] [Green Version]
  59. Witaicenis, A.; Seito, L.N.; Chagas, A.D.S.; de Almeida, L.D.; Luchini, A.C.; Rodrigues-Orsi, P.; Cestari, S.H.; Di Stasi, L.C. Antioxidant and intestinal anti-inflammatory effects of plant-derived coumarin derivatives. Phytomedicine 2014, 21, 240–246. [Google Scholar] [CrossRef]
  60. Ji, J.; Ge, X.; Chen, Y.; Zhu, B.; Wu, Q.; Zhang, J.; Shan, J.; Cheng, H.; Shi, L. Daphnetin ameliorates experimental colitis by modulating microbiota composition and Treg/Th 17 balance. FASEB J. 2019, 33, 9308–9322. [Google Scholar] [CrossRef]
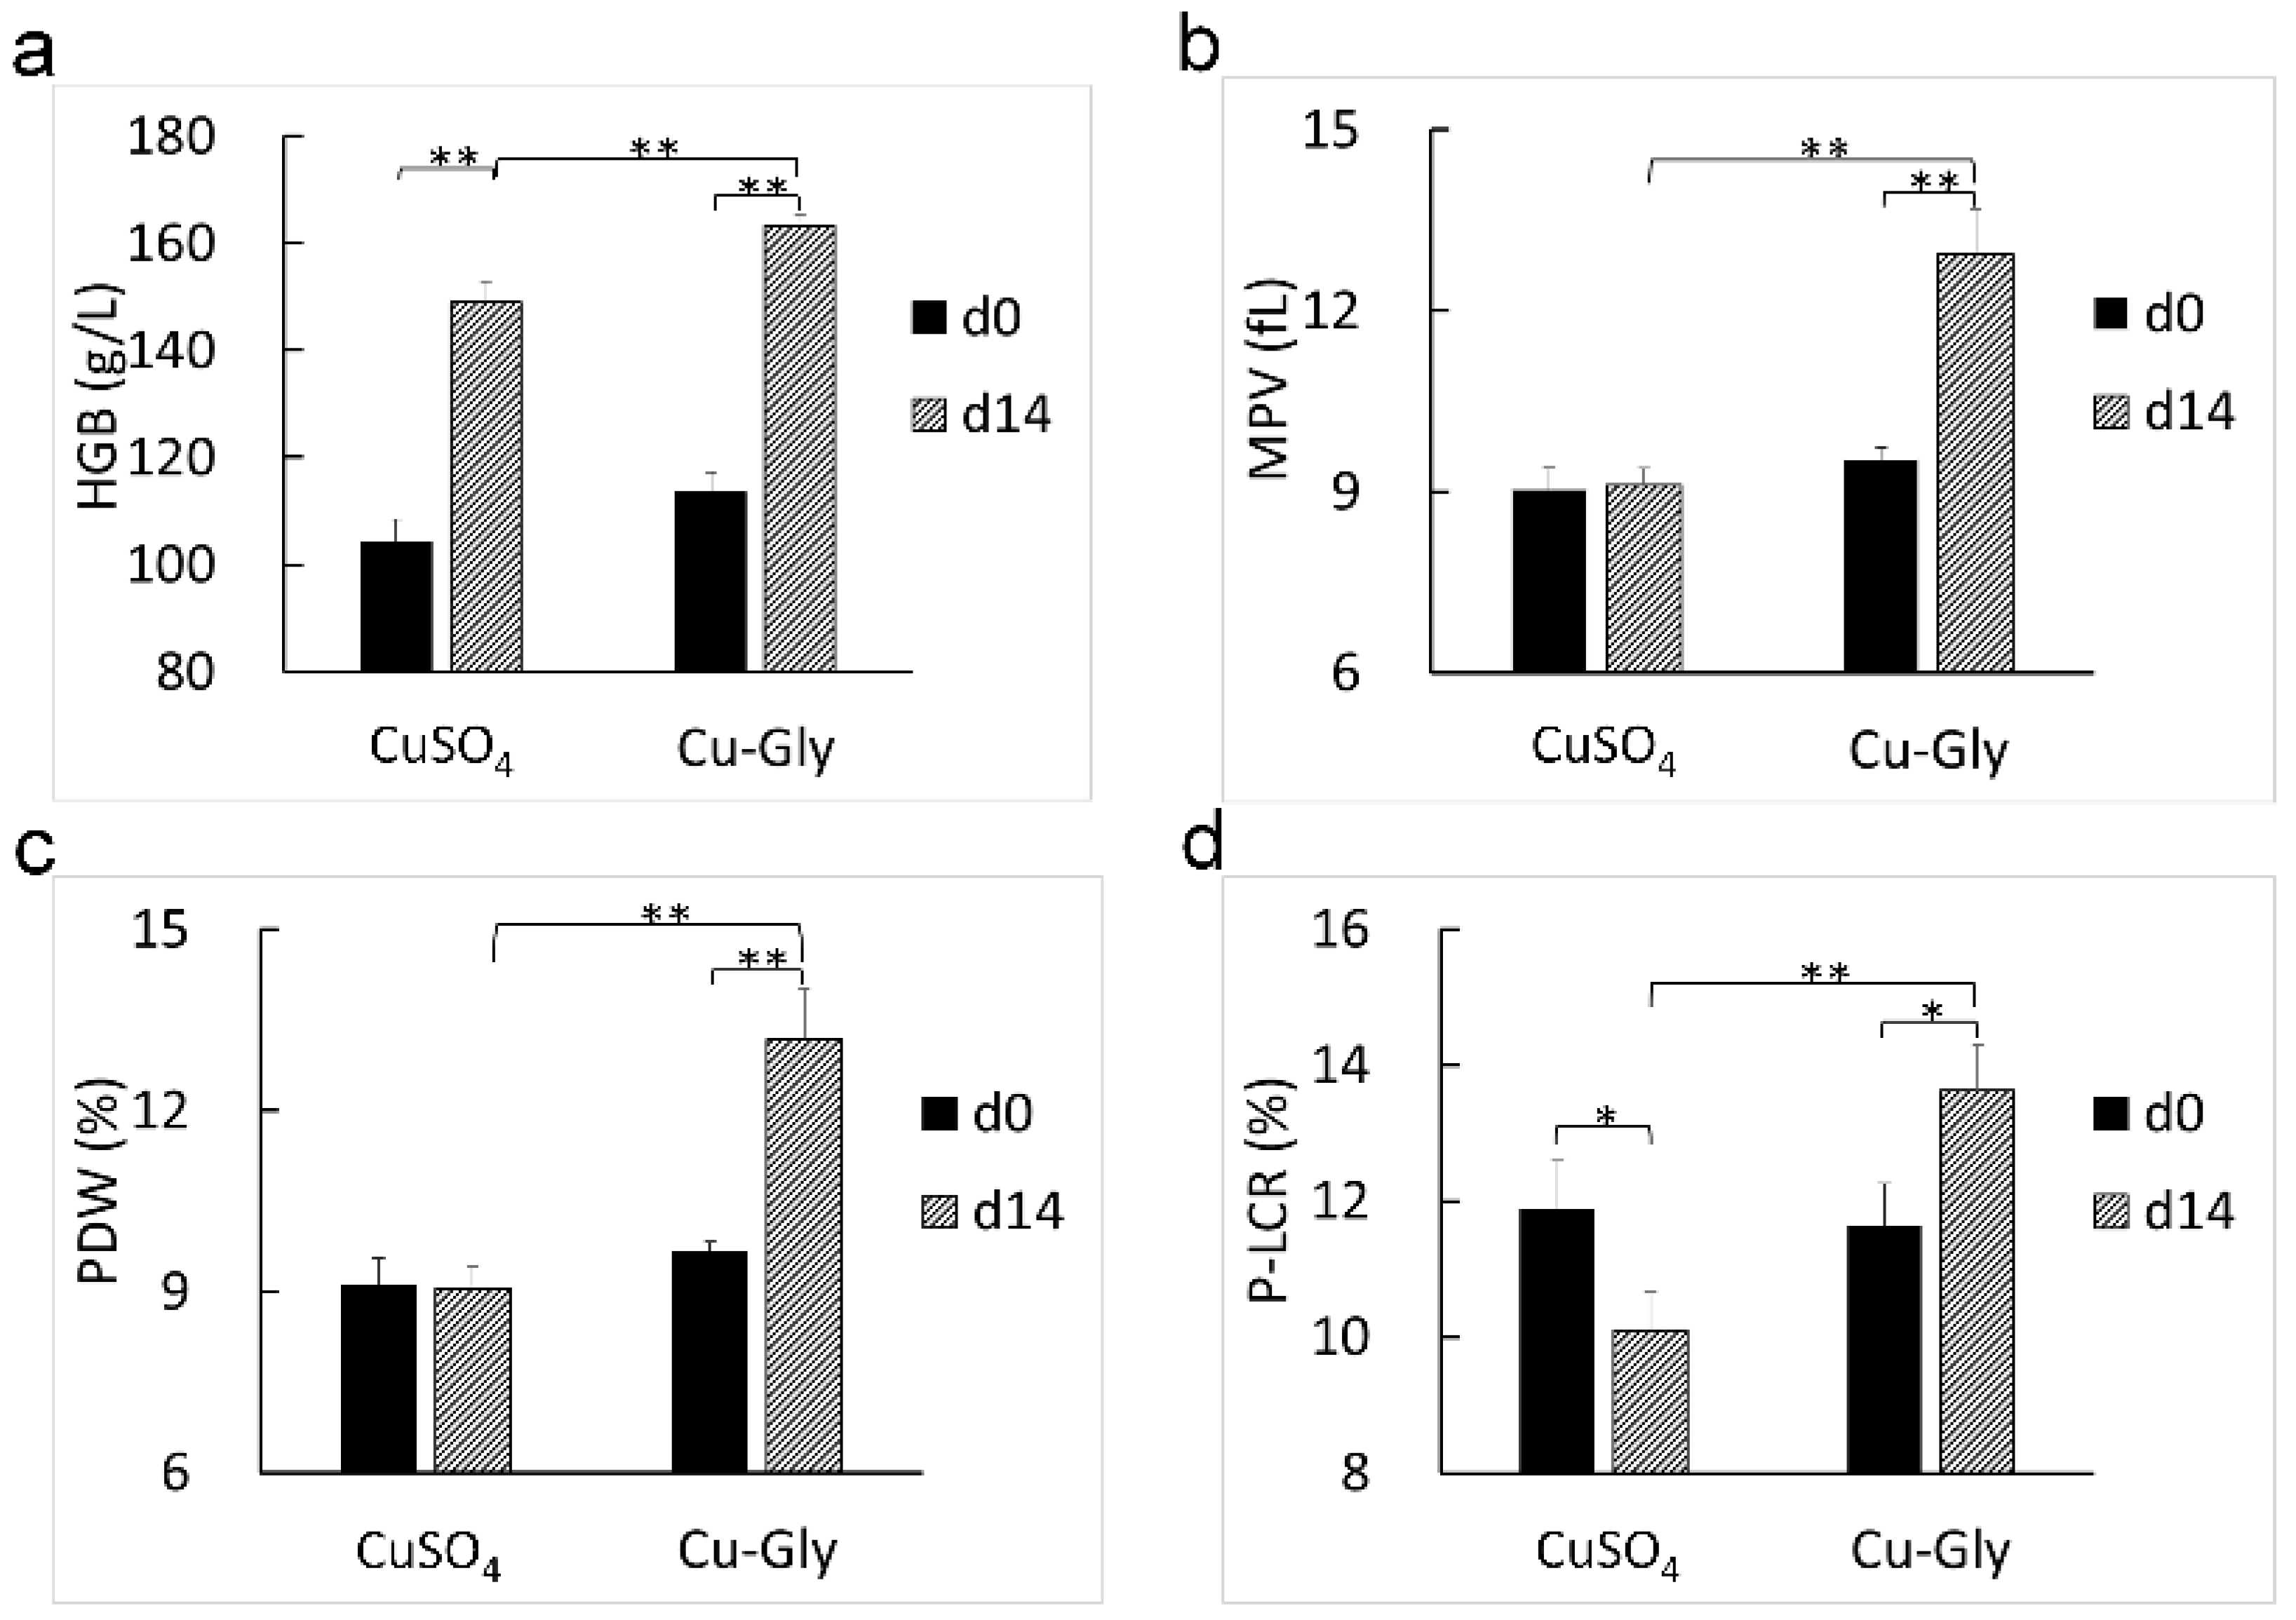
Figure 1. Effects of Cu sources on the hematology parameters of pigs. Hematology analysis was performed, and only a significant difference in hematology parameters, including HGB (a), MPV (b), PDW (c), and P-LCR (d), was shown. Data present mean values ± standard errors. * represents a significant difference at p < 0.05, and ** represents a significant difference at p < 0.01. n = 6. HGB, hemoglobin; MPV, mean platelet volume; PDW, platelet distribution width; P–LCR, platelet–larger cell ratio.
Animals 13 00345 g001
Figure 2. Effects of Cu sources on the levels of plasma Cu, Fe, GH, and IGF-1. Concentrations of plasma Cu (a), Fe (b), GH (c), and IGF-1 (d). Data present mean values ± standard errors. * represents a significant difference at p < 0.05, and ** represents a significant difference at p < 0.01. n = 6. GH, growth hormone; IGF-1, insulin like growth factor 1.
Animals 13 00345 g002
Figure 3. Changes in microbial communities in the feces of pigs. (a) Venn analysis at the OTU level; (b) Principal component analysis (PCA) score plots at the family level; (c) Taxonomic classification of the 16S rRNA gene sequences at the family level. n = 6.
Animals 13 00345 g003
Figure 4. Effects of Cu sources on the alpha diversity of the microbial community in the feces of pigs. The Shannon (a), Simpson (b), Ace (c), and Chao (d) indices were calculated. Data present mean values ± standard errors. * represents a significant difference at p < 0.05, and ** represents a significant difference at p < 0.01. n = 6.
Animals 13 00345 g004
Figure 5. Effects of Cu sources on the relative abundance of bacteria in the feces of pigs. The column charts showed the changes in the relative abundance of the phylum Synergistetes (a), the families Peptostreptococcaceae (b) and Lachnosiraceae (c), and the genera Lachnospiraceae_XPB1014_group (d), Corprococcus_3 (e), Anaerorhabdus_furcosa_group (f), Lachnospiraceae_FCS020_group (g), and Lachnospiraceae_NK4B4_group (h) in the CuSO4 and Cu-Gly groups. Only significant changes in microbiota abundance were presented. Data present mean values ± standard errors. * represents a significant difference at p < 0.05, and ** represents a significant difference at p < 0.01. (i) A non-parametric factorial Kruskal–Wallis (KW) sum-rank test and linear discriminant analysis (LDA) were performed to discriminate the microbial community that contributed to the significant difference in the CuSO4 and Cu-Gly groups. The bar represents thelLinear discriminant analysis effect size (LEfSe). n = 6.
Animals 13 00345 g005
Figure 6. Differential metabolites were annotated, categorized, and enriched to the KEGG pathways. * represents a significant difference at p < 0.05, ** represents a significant difference at p < 0.01, *** represents a significant difference at p < 0.001. n = 6. KEGG, Kyoto Encyclopedia of Genes and Genomes.
Animals 13 00345 g006
Figure 7. Effects of Cu sources on the concentrations of SCFAs in the feces of pigs. The concentrations of acetic acid (a), propionic acid (b), butyric acid (c), pentanoic acid (d), isopentanoic acid (e), and SCFAs (f) were determined. Data present mean values ± standard errors. * represents a significant difference at p < 0.05, and ** represents a significant difference at p < 0.01. n = 6. SCFAs, short-chain fatty acids.
Animals 13 00345 g007
Figure 8. Correlation analysis between microbiota and metabolites, SCFAs, or fecal and plasma indicators. Spearman correlation analysis between differential microbiota and plasma indicators, fecal trace elements (a), SCFAs (b), and metabolites (c). Only significant correlations were presented. * represents a significant difference at p < 0.05, and ** represents a significant difference at p < 0.01. n = 6. GH, growth hormone; SCFAs, short-chain fatty acids.
Animals 13 00345 g008
Table 1. Ingredients and composition of the basal diet 1.
IngredientContent (%)Nutrient Composition
Corn65.30Metabolic energy (MJ/kg)12.21
Soybean meal18.40Crude protein 4 (%)16.21
Wheat bran12.20Calcium (%)0.71
Limestone1.12Total phosphorus (%)0.55
Dicalcium phosphate0.85Lysine (%)1.12
Salt0.30Methionine + cysteine (%)0.65
Phytase 20.01Threonine (%)0.72
L-Lysine hydrochloride0.50Tryptophan (%)0.18
DL-Methionine0.16
Threonine0.16
Premix 31.00
1 The intrinsic copper level of the basal diet is 5.7 mg/kg. 2 The calculated level of phytic acid varies from 0.51% to 0.66%, and the premix provided 500 U phytase per kilogram of diet. 3 The premix provided per kilogram of diet: 60 mg Zn, 150 mg Fe, 85 mg Mn, 0.3 mg Se and 0.14 mg I, 2000 IU vitamin A, 1500 IU Vitamin D3, 53 mg vitamin E, 1 mg vitamin K3, 6 mg thiamine, 2.8 mg riboflavin, 2.8 mg vitamin B6, 0.1 mg vitamin B12, 2 mg folic acid, 8 mg niacin, 28 mg calcium pantothenate, and 0.2 mg biotin. 4 Determined by chemical analysis.
Table 2. Effects of Cu sources on growth performance, digestibility, and fecal microelement contents.
ItemCuSO4Cu-GlySEMp-Value
Initial BW (kg)24.7824.922.960.707
Final BW (kg)31.8632.723.360.509
ADG (g/d)505.43557.4357.080.227
ADFI (g/d)1348.291483.57101.070.039
Feed efficiency (feed/gain)2.672.660.6290.258
ATTD 1 of DM (%)90.4490.450.250.949
ATTD of CP (%)83.9184.721.750.656
ATTD of Cu (%)45.1756.495.030.048
ATTD of Zn (%)26.1127.554.010.727
ATTD of Fe (%)52.6267.495.380.021
ATTD of Mn (%)49.4661.575.410.048
Fecal content of DM (%)25.3726.181.090.475
Fecal content of CP (%)47.7048.091.110.730
Fecal content of Cu (mg/kg)522.04484.2814.040.023
Fecal content of Zn (mg/kg)1062.75979.6865.500.270
Fecal content of Fe (mg/kg)1805.681120.97230.410.016
Fecal content of Mn (mg/kg)1047.37885.4767.470.040
1 ATTD, apparent total tract digestibility. n = 6. BW, body weight; ADG, average daily gain; ADFI, average daily feed intake; DM, dry matter; CP, crude protein.
Table 3. Effects of Cu sources on the metabolite concentrations in the feces of pigs.
MetaboliteHMDB IDCuSO4 vs. BaselineCu-Gly vs. BaselineCu-Gly vs. CuSO4
FC 1p-ValueFCp-ValueFCp-Value
3-hydroxytridecanoic acidHMDB00616553.6970.0343.5280.009--
N-AcetylmuramateHMDB00604932.1880.0022.0750.003--
5-[(E)-2-(3,5-dihydroxyphenyl)ethenyl]-2-methoxyphenyl oxidanesulfonic acidHMDB01345871.6990.0051.5930.012--
Physagulin FHMDB00396311.5270.0071.4180.031--
Grevilline BHMDB00332401.4980.014----
7-hydroxy-1-oxo-1H-isochromene-3-carbaldehydeHMDB01286171.4560.043----
3-hydroxypristanic acidHMDB00616511.4170.036----
Ricinoleic acidHMDB00342971.3900.004----
Alpha-Carboxy-delta-decalactoneHMDB00309851.3880.0131.4100.014--
3,4,5-trihydroxy-6-(2-hydroxy-1,2-diphenylethoxy)oxane-2-carboxylic acidHMDB01352011.3710.013----
5-Pentyltetrahydro-2-oxo-3-furancarboxylic acidHMDB00309891.3690.0331.4130.026--
23-HydroxyphysalolactoneHMDB00313881.3550.015----
PristanoylglycineHMDB00133031.3500.002----
Trans-GrandmarinHMDB00390301.3470.016----
Tyrosyl-SerineHMDB00291141.3260.020----
Zizybeoside IHMDB00349540.7520.017----
Prolyl-ArginineHMDB0029011--2.0520.021--
Xi-Linalool 3-[rhamnosyl-(1->6)-glucoside]HMDB0030422--1.3600.001--
Coutaric acidHMDB0029225--1.3430.000--
Nb-p-Coumaroyltryptamine (CT)HMDB0041518--1.4740.0311.3880.036
CoumarinHMDB0001218--1.4210.0041.4400.024
20-Oxo-leukotriene E4HMDB0012642--0.7130.0190.7570.003
1 FC, fold change in the mean value of the peak area obtained from each group. - indicates no statistical significance at p > 0.05 or 0.77 < FC < 1.3. n = 6. FC, fold change; HMDB, human metabolome database.
Disclaimer/Publisher’s Note: The statements, opinions and data contained in all publications are solely those of the individual author(s) and contributor(s) and not of MDPI and/or the editor(s). MDPI and/or the editor(s) disclaim responsibility for any injury to people or property resulting from any ideas, methods, instructions or products referred to in the content.